Bollinger Bands

Bollinger Bands

Jayati WALIA

In this article, Jayati WALIA (ESSEC Business School, Grande Ecole Program – Master in Management, 2019-2022) presents the popular Bollinger bands used in technical analysis.

This post is organized as follows: we introduce the concept of Bollinger bands and provide an illustration with Apple stock prices. We delve into the interpretation of Bollinger bands as port and resistance price levels used to define buy and sell trading signals. We then present the techniques to compute the Bollinger bands and finally discuss their limitations.

Introduction

In the 1980s, John Bollinger, a long-time market technical analyst, developed a technical analysis tool for trading in securities. At that time, it was presumed that volatility was a static quantity, a property of a security, and if it changed at all, it would happen in a long-term period. After some experimentation, Bollinger figured that volatility was indeed a very dynamic quantity and a moving average computed on a time period (typically 20 days) with bands drawn above and below at intervals could be determined by a multiple of standard deviation.

Unlike a percentage calculation from a simple moving average, Bollinger bands simply add and subtract a standard deviation (or a multiple of the standard deviation, usually two). The tool thus represents the volatility in the prices of the security which is measured by the standard deviation of the prices of the security. The bands are used to understand the overbought or oversold levels for a security and to follow the price trends. The indicator/tool comprises of three main bands, an upper band, a lower band, and a middle band.

The middle band is a simple moving average (SMA), which is usually computed over a rolling period of 20 trading days (about a calendar month). The upper and the lower bands are positioned two standard deviations away from the SMA. The change in the distance of the upper and lower bands from the SMA determine the price strength (which is the strength of price trend of stock relative to overall market trend) and the lower and the upper levels for the stock prices. Bollinger bands can be applied to all financial securities traded in the market including equities, forex, commodities, futures, etc. They are used in multiple time frames (daily, weekly and monthly) and can be even applied to very short-term periods such as hours.

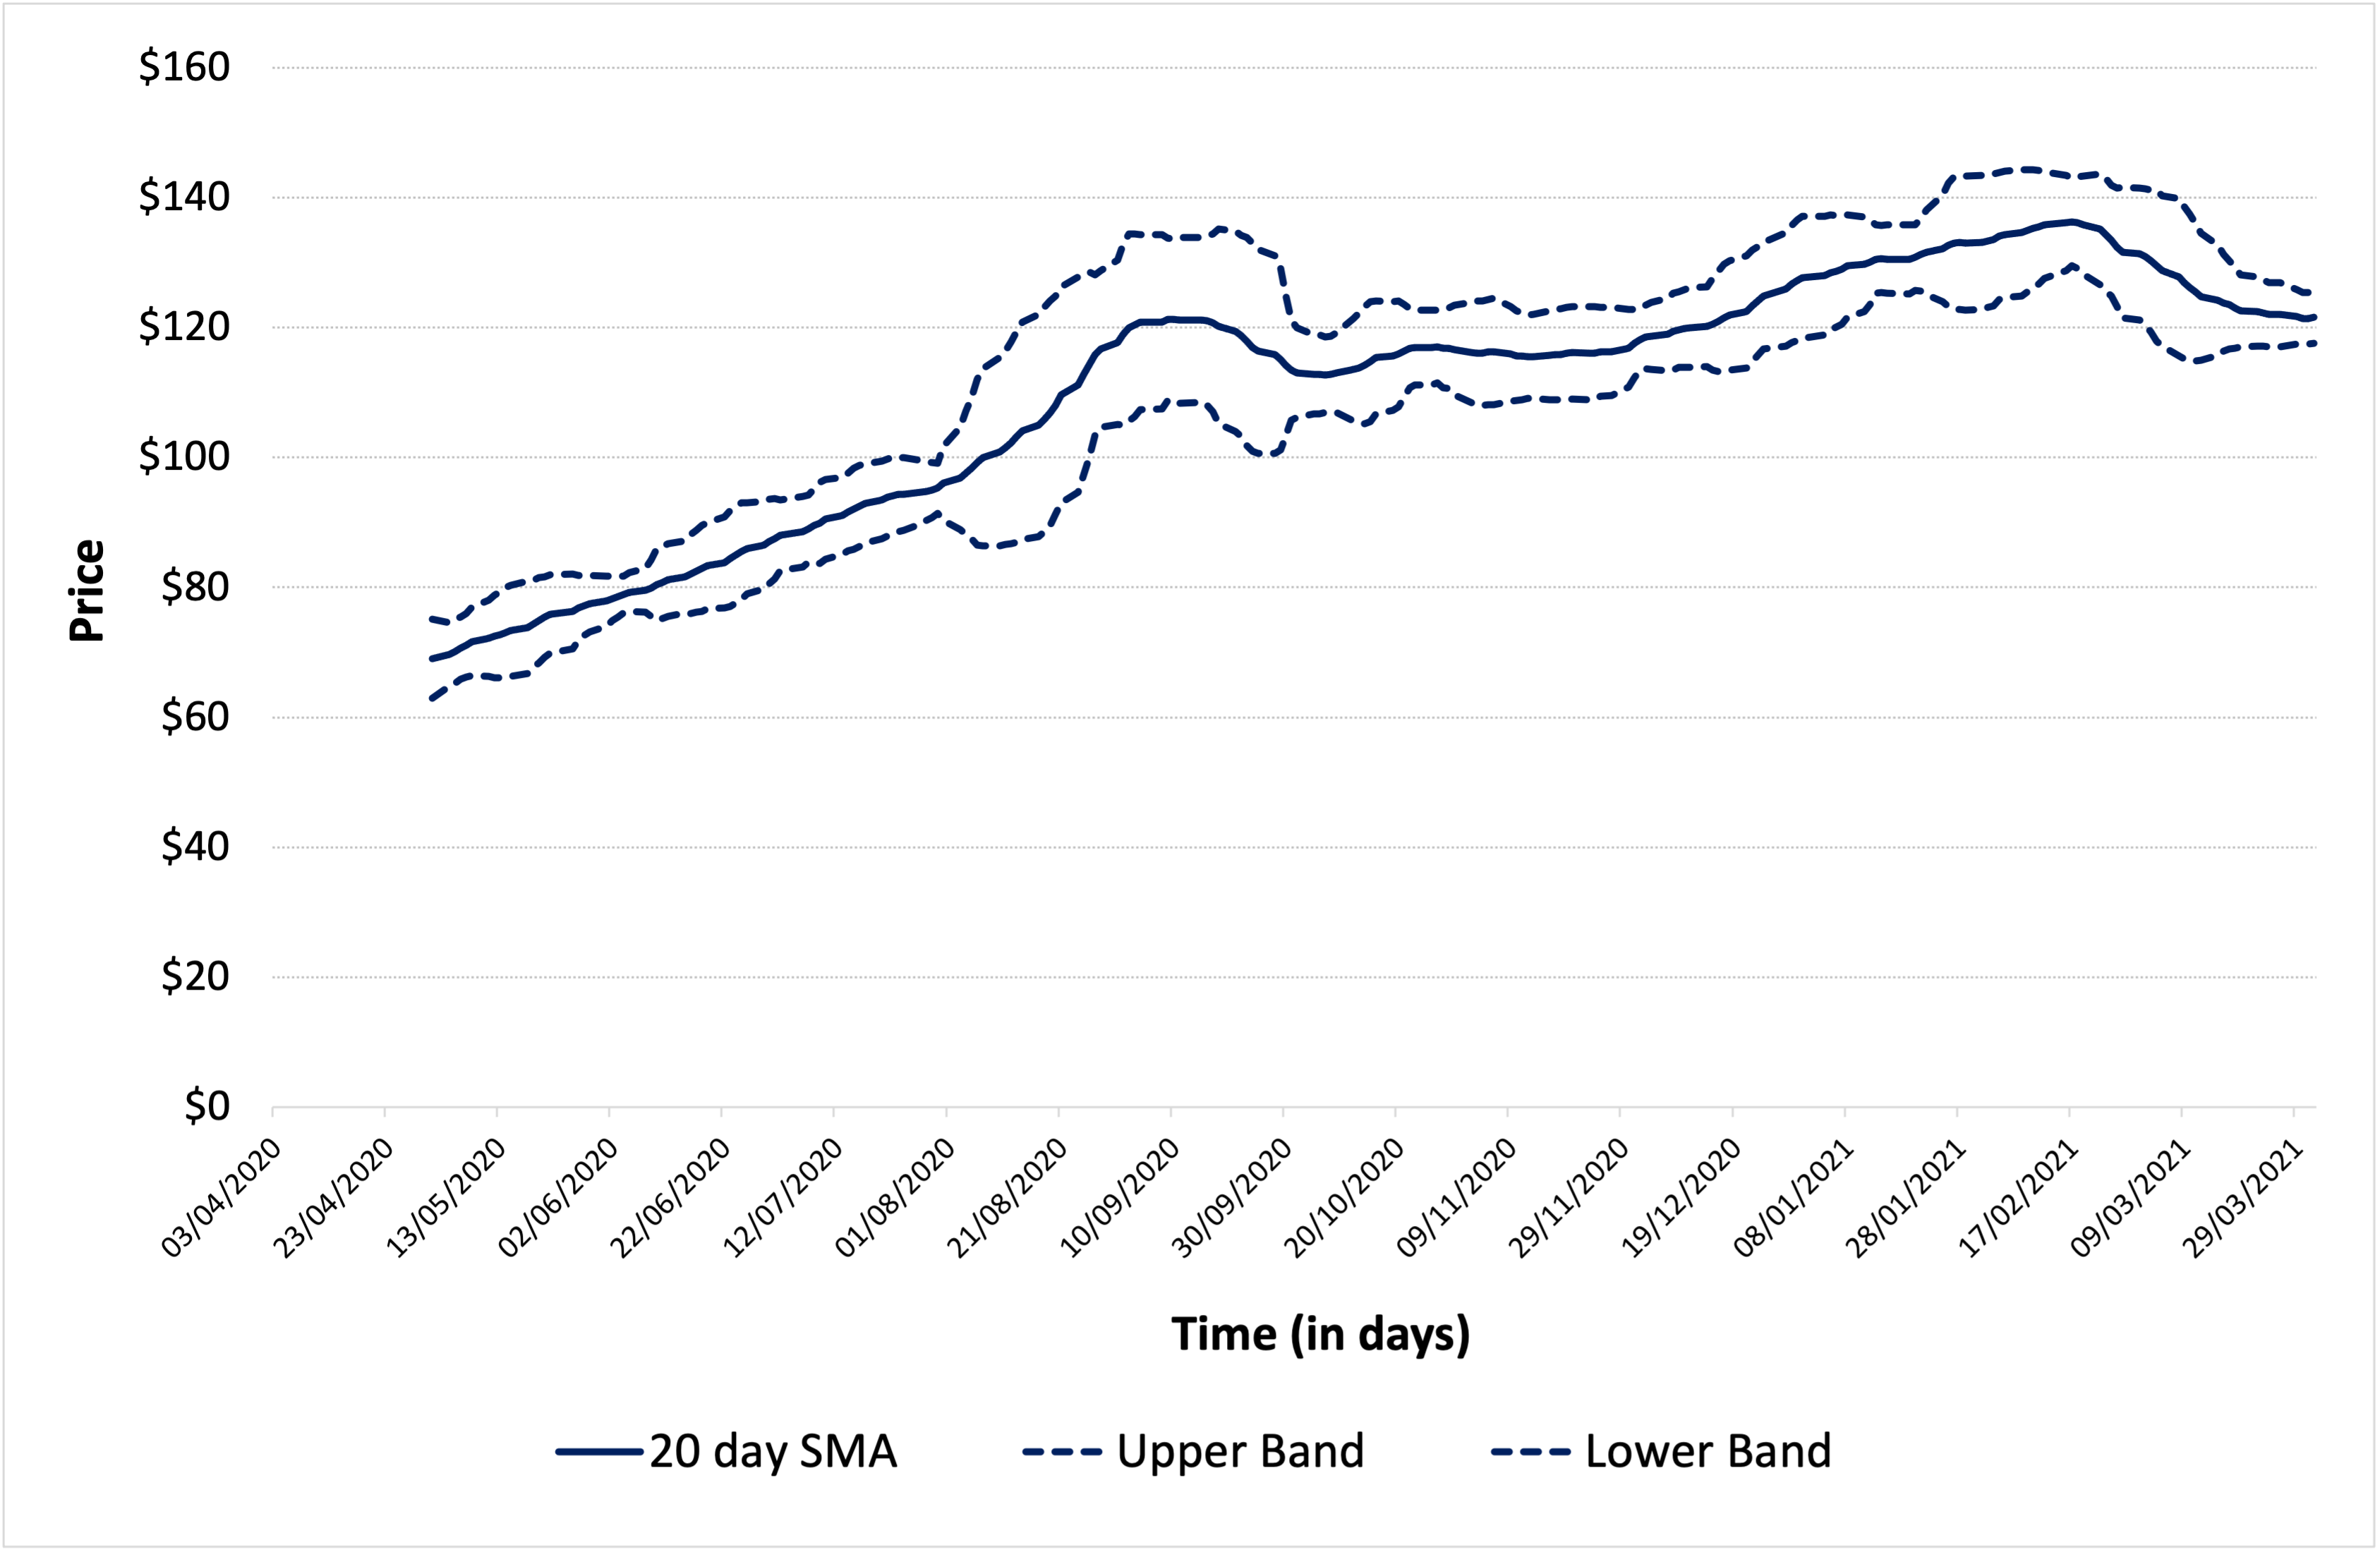
Figure 1 represents the evolution of the price of Apple stocks with the Bollinger bands for the period January 2020 – September 2021.

Figure 1. Bollinger bands on Apple stock.
Bollinger bands Apple stock
Source: computation by the author (data source: Bloomberg).

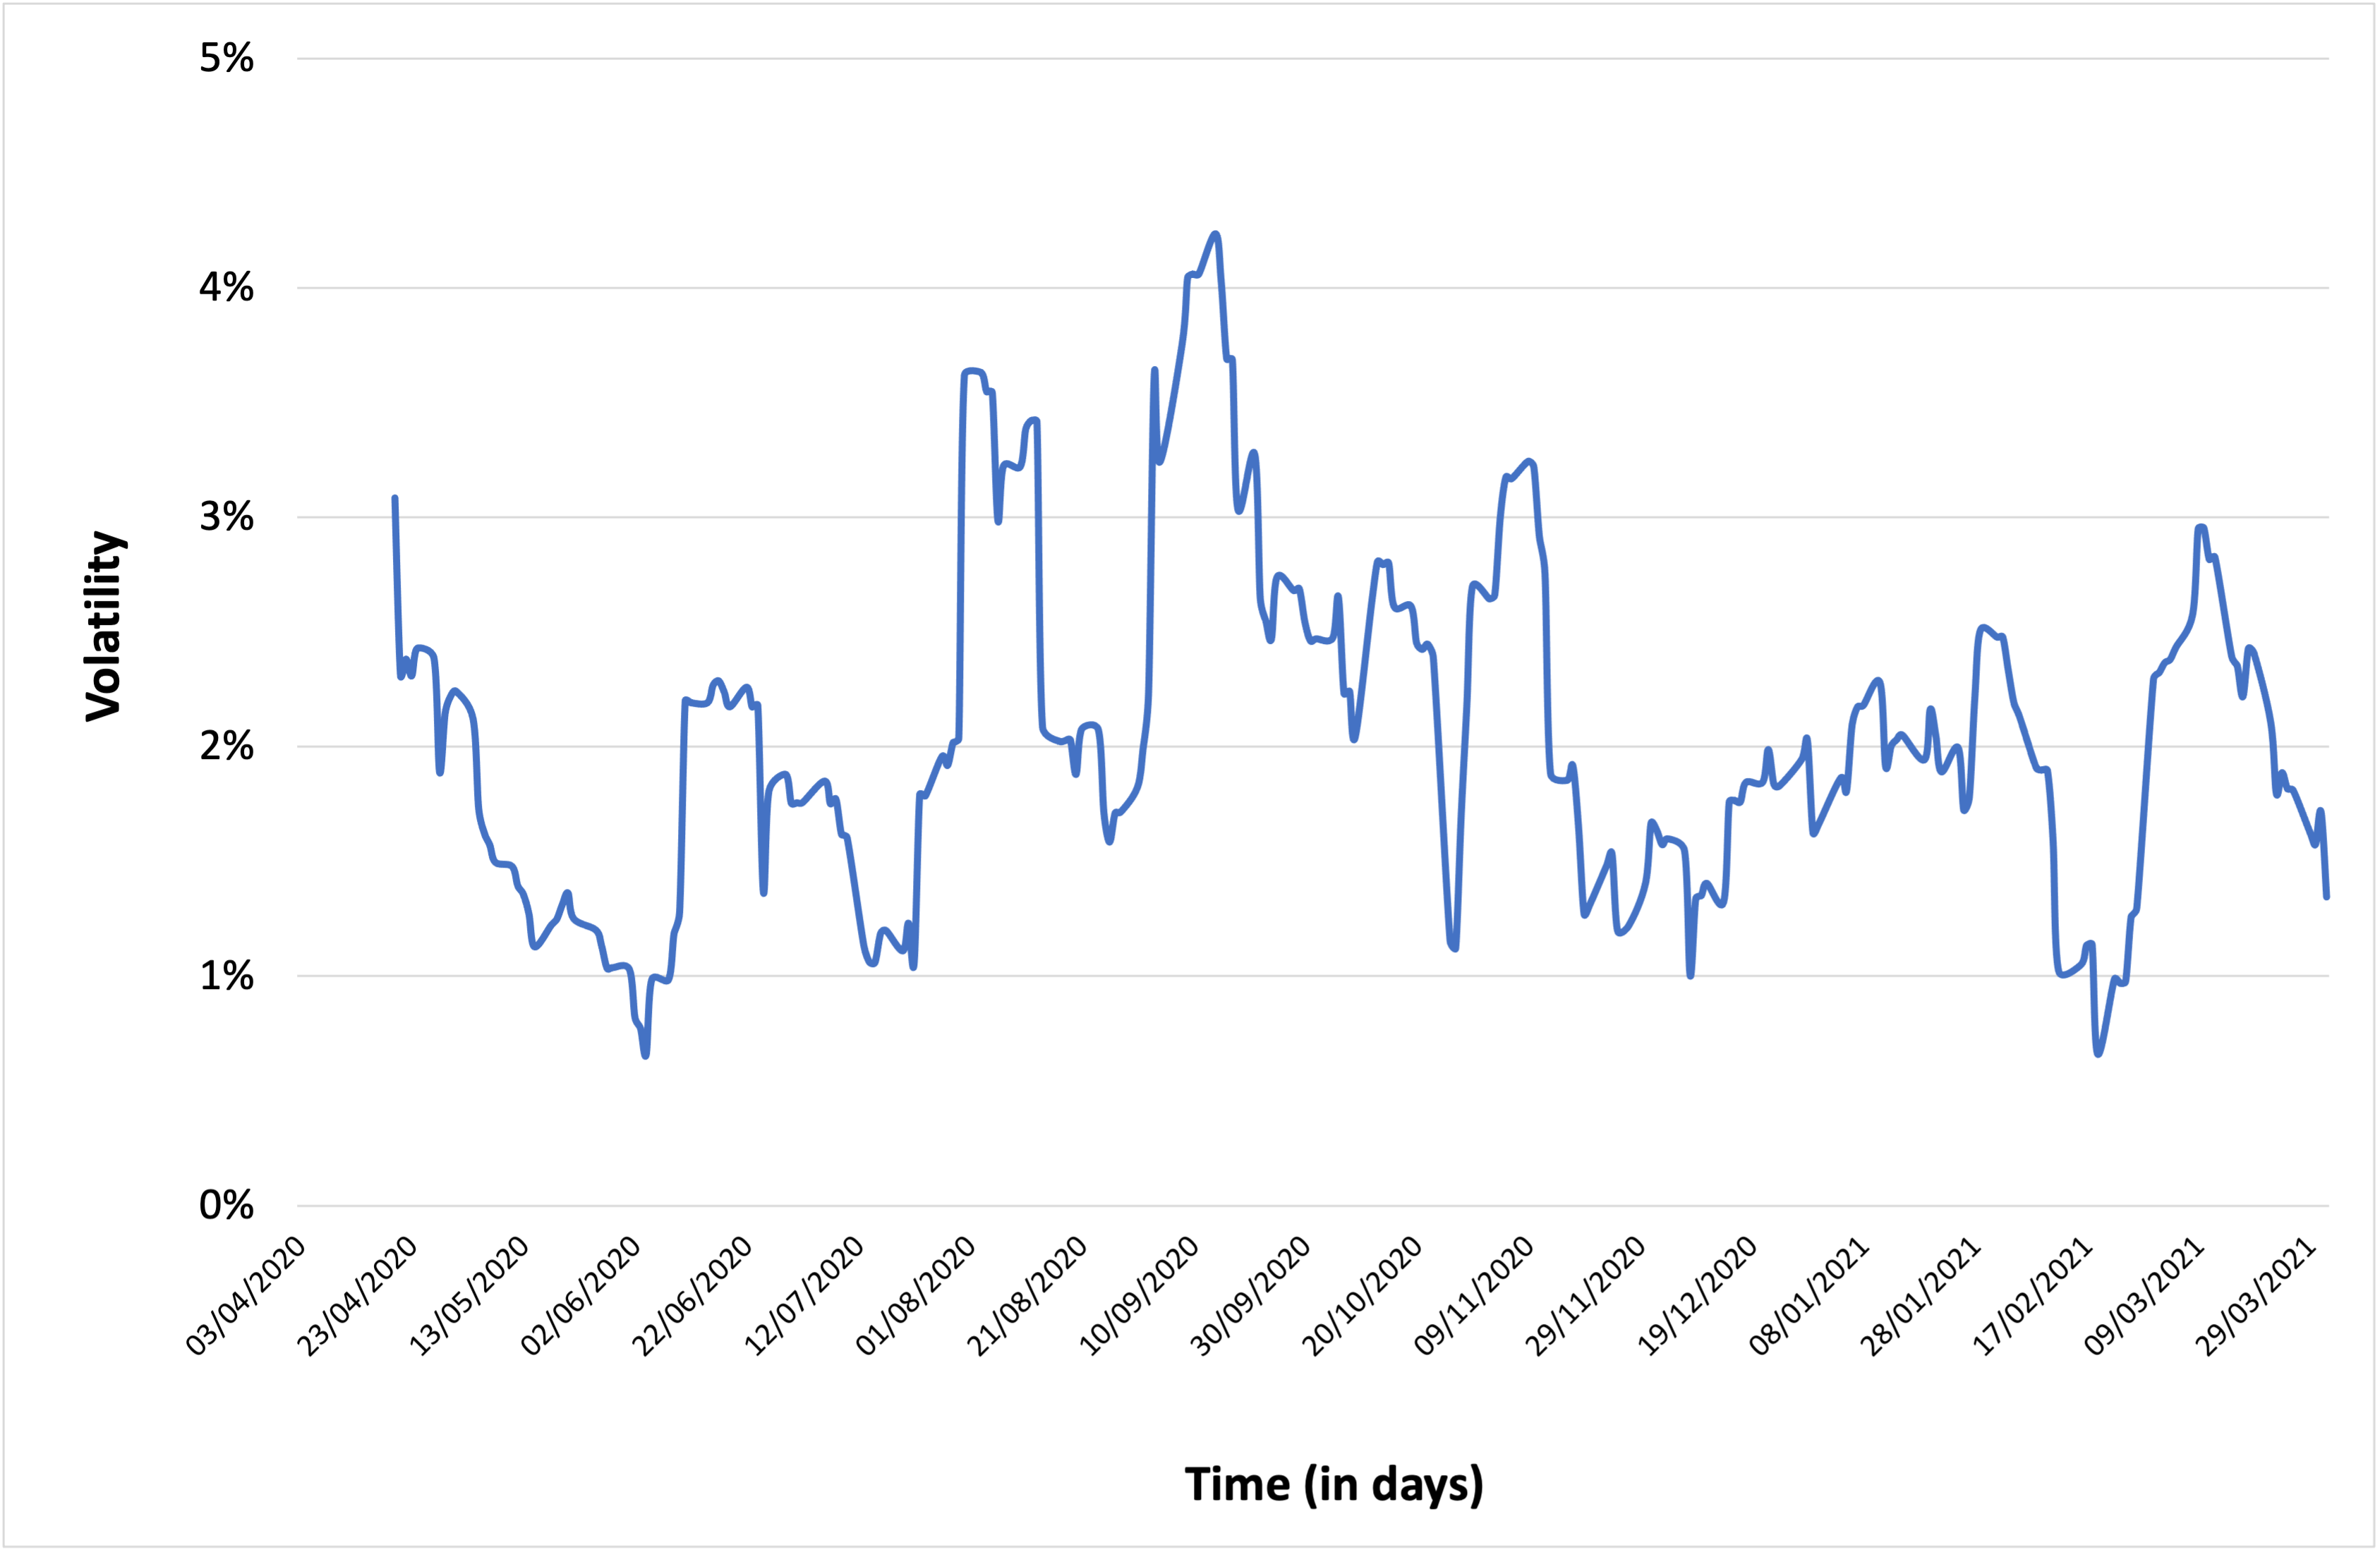
Figure 2 illustrates for the price of Apple stocks the link between the Bollinger bands and volatility measured by the standard deviation of prices. The lower the volatility, the narrower the bands.

Figure 2. Bollinger’s bands and volatility
Bollinger bands and volatility Apple stock
Source: computation by the author (data source: Bloomberg).

How to interpret Bollinger bands

Traders use the Bollinger bands to determine the strength of the price trend of a stock. The upper and lower bands measure the degree of volatility in prices over time. The width between the bands widens as the volatility in the stock prices increases and indicates a strong trend in the price movement. Conversely, the width between the bands narrows as the volatility decreases, indicating that the price of the security is range-bound. When this width is extremely narrow and contracting, it indicates that there can be a potential breakout in the price movement soon and is referred to as “Bollinger squeeze”. If the price crosses the upper band, it may indicate that the movement will be in an uptrend, and If the price crosses the lower band, it may indicate that the movement will be in a downtrend.

If the price hits the upper band, it indicates an overbought level in the security, and when the price hits the lower band, it indicates an oversold level. When the price crosses the upper band, traders consider it to a positive signal to buy the stock as the price trend is in an upward direction and shows great strength. Similarly, when the price crosses the lower band, traders consider it to a positive signal to sell the stock as the price trend is in a downward direction and shows great strength.

In other words, Bollinger bands act as dynamic resistance and support levels for the price of the security. Thus, once prices touch either of the upper or lower band levels, they tend to return back to the middle of the band. This phenomenon is referred to as the “Bollinger bounce” and many traders rely extensively on this strategy when the market is ranging and there is no clear trend that they can identify.

Calculation

The three bands of the Bollinger bands are calculated using the following formula:

Middle Band

The middle band is the simple moving average (SMA) over a 20-day rolling period. To calculate the SMA, we compute the average of the closing prices of the stock over the past 20 days.

SMA 20 days

To compute the upper and lower bands, we need first to compute the standard deviation of prices.

img_std_dev_bollinger_bands

Upper band

The upper band is calculated by adding the SMA and the standard deviation times two:

Bollinger upper band

Lower band

The lower band is calculated by subtracting the standard deviation times two from the SMA:

Bollinger lower band

Limitations of Bollinger bands

Bollinger bands are considered to be lagging indicators since they represent the simple moving average which is based on the historical stock prices. This means that the indicator is not very useful in predicting the future price patterns as the indicator signals a price trend when it has already started to happen.

To benefit from the Bollinger bands, traders often combine this indicator with other technical tools like the Relative Strength Index (RSI), Stochastic indicators and Moving Averages Convergence-Divergence (MACD).

Related Posts

   ▶ Jayati WALIA Trend Analysis and Trading Signals

   ▶ Jayati WALIA Moving averages

   ▶ Jayati WALIA Standard deviation

Useful resources

Bollinger bands

Fidelity: Technical Indicators: Bollinger Bands

About the author

The article was written in November 2021 by Jayati WALIA (ESSEC Business School, Grande Ecole Program – Master in Management, 2019-2022).

Trend Analysis and Trading Signals

Trend Analysis and Trading Signals

Jayati WALIA

In this article, Jayati WALIA (ESSEC Business School, Grande Ecole Program – Master in Management, 2019-2022) presents an overview of trend analysis and trading signals in stock price movements.

This post is organized as follows: we introduce the concept of trends used in technical analysis and its link with support and resistance price levels used to define buy and sell trading signals. Then, we present the different types of trends and discuss the time frame for their analysis. Trends based on straight lines, moving averages and the Fibonacci method are presented in detail with examples using Moderna, Intel, Adobe and Apple stock prices.

Introduction

Trend Analysis is one of the most important areas of technical analysis and is key to determining the overall direction of movement of any financial security. The analysis of trends in asset prices is used to find support and resistance price levels and in fine generate buy and sell trading signals when these support and resistance price levels are broken.

Support and resistance

The support and resistance are specific points on the price chart of any security which can be used to identify trade entry and exit points. The support refers to the price level at which price generally bounces upwards and buying trend is strongest. Likewise, the resistance price is a price level at which selling power is strongest and the price of the security struggles to break above the resistance. The support and resistance levels can act as potential entry and exit points for any trade since it is at these levels that the price can either “break-out” of the current trend or continue moving in the same direction. The support and resistance can be determined by using prices or Japanese candlesticks.

Ways to define trends

The two main ways to define trends in financial markets are straight lines and moving averages. Straight lines simply give static support and resistance levels that do not change over time. Moving averages give dynamic support and resistance levels that are continuously adjusted over time. Another popular method to define trends is the Fibonacci method.

Trends based on straight lines

Overview

Trend lines are indicators to identify the trends in the price chart of a security within a time frame (say one week or one month). Trend analysis using trend lines takes specific price levels or zones that correspond to support and resistance. An uptrend is based on the principle of higher highs and higher lows; similarly, a downtrend is based of lower highs and lower lows.

These price levels are the major zones where the market seems to respond by making a strong advance or decline. If the stock prices are in an uptrend, it shows an increasing demand for the stock and if the stock prices are in downtrend, it shows an increasing supply for the stock.

Trend lines can be built by connecting two or more prices (peaks or troughs) in either direction of a stock price movement on a time frame determined by the trader (1 hour, 1 day, 1 week, etc.) over a period (3 months, 6 months, 12 months, etc.). For a trend line to be valid, a minimum of two highs or lows should be used. The more times price movement touches a trend line, the more accurate is the trend indicated by the line.

Different types of trends using straight lines

The use of market trends in technical analysis in financial markets is based on the concept that past movements in the prices of the stock provides an overview of the future movement. Note that such an approach is in contradiction with the Market Efficiency Hypothesis (EMH) developed by Fama (1970), which states that the best prediction of the price of tomorrow is the price of today (past prices being useless).

The prices of any financial asset in the market follows three major trends: up, down and sideways trends.

Up trend

When the stock prices follow an uptrend, it means the prices are reaching higher highs and higher lows on a pre-determined time frame (decided by the trader). The higher high of a stock price is the highest it reaches in each time frame and the lower lows is the lowest it reaches in that time frame. The constant rise and fall in the stock prices show that the market sentiments are bullish about the stock and the trader tries to buy the stock when it is at its lowest in the uptrend.

The following figure shows an upward channel trend in Moderna stock prices using Japanese
candlesticks. As observed in the graph, both the upper and lower trend lines connect minimum two peaks and troughs respectively. As the price crosses the upper trend line (resistance level), it enters an uptrend (or a bullish trend) indicating a buy signal.

Figure 1. Uptrend in Moderna stock.

Uptrend in Moderna stock

Source: computation by the author (data source: Bloomberg).

Down trend

A downtrend comprises of lower highs and lower lows in the prices of the stock. The stock prices follow a downward sloping trend, which shows a bearish sentiment in the stock. The traders resist to enter in a long position when the stock prices are in down trend.

The following figure shows Intel stock prices in a downtrend (or bearish trend) represented by upper and lower straight trends lines. When the price crosses the lower trend line (support level), it will enter into a downtrend indicating a sell signal.

Figure 2. Downtrend in Intel stock.

Downtrend in Intel stock

Source: computation by the author (data source: Bloomberg).

Sideways trend

In such a trend, the stock prices move in a sideways direction and the highs and lows of the stock price are constant for a period of time. Such price movements make it difficult for the trader to predict the future price movements of the stock. The trader trading in this stock tries to anticipate potential breakouts above the resistance level or below the support level. He or she enters in a long position when the price of the stock breaks the upper resistance level. Also, he or she can benefit from the sideways movement by entering in a long position when the stock prices retrace from the support level, to enjoy the stream of profits till the price reaches the resistance level.

Figure 3. Sideways trend in Adobe stock.

Sideways trend in Adobe stock

Source: computation by the author (data source: Bloomberg).

Trends based on moving averages

Overview

A moving average is an indicator to interpret the current trend of a stock price. A moving average basically shows the price fluctuations in a stock as a single curve and is calculated using previous price, hence it is a lagging indicator.

To measure the direction and strength of a trend, moving averages strategy involves price averaging to establish a baseline. For instance, if price moves above the average, the indicated trend is bullish and if it moves below the average, the trend is bearish. Moving averages are also used in development of other indicators such as Bollinger’s bands and Moving Average Convergence Divergence (also known as MACD).

The moving average indicator can be of many types, but the simple moving average (SMA) and exponential-weighted moving average (EWMA) are most commonly used. An n-period SMA can be calculated simple by taking the sum of the closing prices of a stock for the past ‘n’ time-periods divided by ‘n’.

Crossovers of moving averages is a common strategy used by traders wherein two or more moving averages can help determine a more long-term trend. Basically, if a short-term MA crosses above a long-term MA, the crossover indicates a downtrend and vice-versa indicates an uptrend. Traders can utilize it establish their position in the stock.

Example: Apple stock

Consider below the APPLE stock price chart using Japanese candlesticks. The lines in blue and yellow indicate 20-day (or 20-period) SMA and 50-day SMA respectively. We can observe that while the 2 lines are indicative of the movement of stock price fluctuations, the 20-day SMA is closer to the actual price movement and responds more quickly to price change.

We can also observe a crossover in the moving averages wherein the 20-day MA is crossing below the 50-day MA indicating a down trend in price movement.

Figure 4. Moving averages on Apple stock.

Moving averages in Apple stock

Source: computation by the author (data source: Bloomberg).

Fibonacci Levels

Fibonacci levels are a commonly used trading indicator in technical analysis that provides support and resistance levels for price trends. These levels can be used to determine more accurate entry and exit points by measuring or predicting the retracements before the continuation of a trend.

Fibonacci retracement levels are counted on numbers of the Fibonacci sequence (0, 1, 1, 2, 3, 5, 8, 13, 21, 34, 55 and so on). Each number (say 13) amounts to approximately 61.8% of the following number (13/21=0.618), 38.2% of the number after (13/34=0.382), and 23.6% of the number after (13/55=0.236).

Fibonacci analysis can be applied when there is an evident trend in prices. Whenever a security moves either upwards or downwards sharply, it tends to retrace back a little before its next move. For example, consider a stock that moved from $50 to $70, it is likely to retrace back to, say, $60 before moving to $90. Fibonacci levels can be used to identify these retracement levels and provide opportunities for the traders to enter new positions in the trend direction.

Example: Moderna stock

Consider below the Moderna stock price chart using Japanese candlesticks. We can see an evident uptrend (indicated by the straight trendlines in blue). The Fibonacci retracement levels have been plotted and we can notice that the ‘61.8% Fibonacci level’ intersects the rising trend line. Thus, it can serve as a potential support level. Further, it can also be observed that the price bounces from the 61.8% level before rising up again and it would have been a good entry point for a trader to take up a long position in the stock.

Figure 5. Fibonacci levels on Moderna stock.

Fibonacci levels in Moderna stock

Source: computation by the author (data source: Bloomberg).

Time frame

Trends also can vary among different time frames. For example, an overall uptrend on the weekly time frame can include a downtrend on the daily time frame, while the hourly is going up. Multiple time frame analysis can thus help traders understand the bigger picture. Some trends are seasonal while others are part of bigger cycles.

The trend analysis can be done on different time horizons (including short term, intermediate term, and long term) to identify the price trends for different trading styles.

Related posts on the SimTrade blog

   ▶ Jayati WALIA Bollinger Bands

   ▶ Jayati WALIA Moving averages

   ▶ Akshit GUPTA Momentum Trading Strategy

Useful resources

Academic articles

Fama E.F. (1970) Efficient Capital Markets: A Review of Theory and Empirical Work, The Journal of Finance 25(2): 383-417.

About the author

The article was written in November 2021 by Jayati WALIA (ESSEC Business School, Grande Ecole Program – Master in Management, 2019-2022).

Credit risk

Credit risk

Jayati WALIA

In this article, Jayati WALIA ESSEC Business School, Grande Ecole Program – Master in Management, 2019-2022) presents credit risk.

Introduction

Credit risk is the risk of not receiving promised repayments due to the counterparty (a corporate or individual borrower) failing to meet its obligations and is typically used in context of bonds and traditional loans. The counterparty risk, on the other hand, refers to the probability of potential default on a due obligation in derivatives transactions and also affects the credit rating of the issuer or the client. The default risk can arise from non-payments on any loans offered to the institution’s clients or partners.

With bank failures in Germany and the United States in 1974 led to the setup of the Basel Committee by central bank governors of the G10 countries with the aim of improving the quality of banking supervision globally and thus devising a credible framework for measuring and mitigating credit risks. Banks and financial institutions especially need to manage the credit risk that is inherent in their portfolios as well as the risk in individual transactions. Banks also need to consider the relationships between credit risk and other risks. The effective management of credit risk is a critical component of a comprehensive approach to risk management and essential to the long-term success of any banking organisation.

Credit risk for banks

For most banks, debts (on the assets side of their balance sheet – banking book) are the largest and most obvious source of credit risk. However, sources of credit risk (counterparty risk) also exist through other the activities of a trading (on the assets side of their balance sheet – trading book), and both on and off the balance sheet. Banks increasingly face credit risk (counterparty risk) in various financial instruments other than loans, including interbank transactions, trade financing, bonds, foreign exchange transactions, forward and futures contracts, swaps, options, and in the extension of commitments and guarantees, and the settlement of transactions.

Risk management

Exposure to credit risk makes it essential for banks to have a keen awareness of the need to identify, measure, monitor and control credit risk as well as determine that they hold adequate capital against these risks and are adequately compensated in case of a credit event.

Financial regulation

The Basel Committee on Banking Supervision has developed influential policy recommendations concerning international banking and financial regulations in order to exercise judicious corporate governance and risk management (especially credit and operational risks), known as the Basel Accords. The key function of Basel accords is to set banks’ capital requirements and ensure they hold enough cash reserves to meet their respective financial obligations and henceforth survive in any financial and/or economic distress. Common risk parameters such as exposure at default, probability of default, etc. are calculated in accordance with specifications listed under the Basel accords and quantify the exposure of banks to credit risk enabling efficient risk management.

Credit risk modelling: overview

Credit risk modelling is done by banks and financial institutions in order to calculate the chances of default and the net financial losses that may be incurred in case of occurrence of default event. The three main components used in credit risk modelling as per advanced IRB (Interest ratings based) approach under Basel norms aimed at describing the exposure of the bank to its credit risk are described below. These risk measures are converted into risk weights and regulatory capital requirements by means of risk weight formulas specified by the Basel Committee.

Probability of default (PD)

The probability of default (PD) is the probability that a borrower may default on its debt over a period of one year. There are two main approaches to estimate PD. The first is the ‘Judgemental Method’ that takes into account the 5Cs of credit (character, capacity, capital, collateral and conditions). The other is the ‘Statistical Method’ that is based on statistical models which are automated and usually a more accurate and unbiased method of determining the PD.

Exposure at Default (EAD)

The exposure at default (EAD) is the predicted expected amount outstanding in case the borrower defaults and essentially is dependent upon the amount to which the bank was exposed to the borrower at the time of default. It changes periodically as the borrower repays his payments to the lender.

Loss given default (LGD)

The loss given default LGD refers to the amount expected to lose by the lender as a proportion of the EAD. Thus, LGD is generally expressed as a percentage.

LGD = (EAD – PV(recovery) – PV(cost))/EAD

With:
PV(recovery) = Present value of recovery discounted till time of default
PV(cost) = Present value of cost of lender discounted till time of default

For instance, a borrower takes a $50,000 auto loan from a bank for purchasing a vehicle. At the time of default, loan has an outstanding balance of $40,000. EAD would thus be $40,000.

Now, the bank takes over the vehicle and sells it for $35,000 for recovery of loan. LGD will be calculated as ($40,000 – $35,000)/$40,000 which is equal to 12.5%. Note that we have assumed the present value of cost here as 0.

Expected Loss

The expected loss is case of default is thus calculated to be PD*EAD*LGD and banks use this methodology in order to better estimate their credit risk and be prepared for any losses to be incurred thus implementing risk management.

Credit Rating

Credit rating describe the creditworthiness of a borrower entity such as a company or a government, which has issued financial debt instruments like loans and bonds. It also applies to individuals who borrow money from their banks to finance the purchase of a scar or residence. It is a means to quantify the credit risk associated with the entity and essentially signifies the likelihood of default.

Credit risk assessment for companies and governments is generally performed by a credit rating agencies which analyses the internal and external, qualitative and quantitative attributes that drive the economic future of the entity. Some examples of such attributes include audited financial statements, annual reports, analyst reports, published news articles, overall industry analysis and future trends, etc.

A credit agency is deemed to provide an independent and impartial opinion of the credit risk and consequent ratings they issue for any entity. Rating agencies S&P Global, Moody’s and Fitch Ratings currently dominate 85% of the global ratings market (as of 2021).

Related posts on the SimTrade blog

   ▶ Jayati WALIA Quantitative Risk Management

   ▶ Rodolphe CHOLLAT-NAMY Credit Rating Agencies

   ▶ Rodolphe CHOLLAT-NAMY Credit analyst

   ▶ Jayati WALIA My experience as a credit analyst at Amundi Asset Management

About the author

The article was written in November 2021 by Jayati WALIA (ESSEC Business School, Grande Ecole Program – Master in Management, 2019-2022).

How to compute the IRR in Excel

How to compute the IRR in Excel

Photo Jérémy PAULEN Jeremy PAULEN

In this article, Jérémy PAULEN (ESSEC Business School, Global Bachelor of Business Administration, 2019-2023) explains everything about the IRR function in Excel, which is used to compute the internal rate of return of a series of cash flow to evaluate the financial performance of an investment in relative terms.

What is the IRR?

The IRR represents the internal rate of return of an investment. It is closely related to the net present value (NPV) of the investment as the IRR is the discount rate that makes the NPV equal to zero.

Consider an investment represented by a series of cash flows CF0, CF1, CF2, …, CFT, which take into account the revenues and expenses of the project computed or forecasted at time 0 leading to capital inflows and outflows for the firm. The NPV of this investment is given by:

NPV formula

where r is the discount rate that takes into account the risk of the project.

The IRR corresponds to the value of the discount rate for which the NPV is equal to 0:

IRR

The IRR is the solution of a non-linear equation:

IRR

Note that this equation may have one solution, several solutions or no solution according to the sequence of cash flows.

The internal rate of return (IRR) is an important indicator in the decision-making process as it measures the financial performance of a project. The IRR is a relative measure as its unit is a percentage. The NPV is an absolute measure as its unit is the euro, the dollar, etc.

It makes it possible to measure the future financial performance of a project or a company. The higher the IRR is, the more interesting it is to launch the project.

The IRR can therefore be used in the case of a choice to be made between different investment perspectives, but also to evaluate the company’s share buyback programs.

A limit of using the IRR method is that it does not consider the size of a project. Cash flows are simply compared to the amount of capital outlay generating those cash flows. In other words, considering two projects A and B, the IRR of A may be lower than the IRR of B, while the NPV of A may be higher than the NPV of B.

The IRR function in Excel

How to use the IRR function in Excel?

In Excel, you can get the IRR function in the “Formulas” tab.
You can also type “= IRR (value, [guess])” in the cell where you want to compute the IRR.

The IRR function uses the following arguments:

  • Values: The cash flow series. Cash flows include investment values and net income.
  • Guess: a number guessed by the user that is close to the expected internal rate of return

Example

Example: consider a new factory modeled by the following series of cash flows:

  • CF0 = -$50,000 (initial cost)
  • CF1 = +$5,000 (net cash flow in year 1)
  • CF2 = +$8,000 (net cash flow in year 2)
  • CF3 = +$13,500 (net cash flow in year 3)
  • CF4 = +$18,800 (net cash flow in year 4)
  • CF5 = +$20,500 (net cash flow in year 5)

Excel file to compute the IRR of a series of cash flows

You can download below a short video which illustrates how to compute the IRR of a series of cash flows with Excel.

Download a video to illustrate IRR with Excel

Related posts on the SimTrade blog

   ▶ Raphaël ROERO DE CORTANZE The Internal Rate of Return

   ▶ William LONGIN How to compute the present value of an asset?

   ▶ Rodolphe CHOLLAT-NAMY Bond valuation

   ▶ Léopoldine FOUQUES The IRR, XIRR and MIRR functions in Excel

   ▶ Sébastien PIAT Simple interest rate and compound interest rate

Useful resources

Microsoft IRR function

About the author

The article was written in November 2021 by Jérémy PAULEN (ESSEC Business School, Global Bachelor of Business Administration, 2019-2023)

Liabilities

Liabilities

Shruti Chand

In this article, Shruti CHAND (ESSEC Business School, Grande Ecole Program – Master in Management, 2020-2022) elaborates on the concept of liabilities.

This read will help you get started with understanding the liability side of the balance sheet.

Introduction

A liability is an obligation that a company has in return of economic benefits that the company has received in the past. Any kind of obligation or risk that are due to a third party can be termed as liability.

Liabilities are recorded on the balance sheet can be short-term or long-term in nature.

Liability vs Expense

It is important to know that liability is not an expense for the business. An expense is the cost of operation for the business and is recorded on the income statement of a business. Liabilities on the other hand is what the business owes to another party already as the economic benefit has been transferred in the past. It is recorded in the balance sheet of the company.

Liabilities are very important for a business as they finance the daily operations of the business. For expansion activities, for instance if a business wants to expand overseas, liability in form of bank loans will help the business acquire assets to make the move to another location. This loan facilitated by a bank for example will be recorded in the liabilities section in the balance sheet.

Structure of the Liabilities part of the balance sheet

The Liabilities part of the balance sheet can be structured as follows.

Screenshot 2021-10-25 at 1.24.06 AM

Current Liabilities

These are the company’s short-term obligation (Usually financial in nature) that are to be paid within a period of one year. Most noteworthy examples of current liabilities include:

  1. Wages Payable: The total amount of salaries that the company owes to its employees.
  1. Interest Payable: The credit that the business takes to finance short term needs of business operations accrues an interest. This interest in payable by the business in the short term and is recorded in the interest payable section of the balance sheet.
  1. Dividends Payable: The total amount of dividends that the company owes to the investors against the stocks issued to them.

These items help the readers understand the level of obligations on the businesses due in a short period of time.

Non-current liabilities

These are obligations that are owed in a period longer than a year. Long term bonds, loans, etc. are a part of long-term/non-current liabilities. Companies usually issue bonds fulfil their long-term capital needs which are very common type of non-current liability. Other common examples of long-term liabilities include:

  1. Debentures: Type of bond or debt instrument issued by the company unsecured against a collateral.
  1. Bonds Payable: Long term debt instrument issued by companies and government which is a promise to pay at a future date and is issued at a discount in the current period.
  1. Deferred tax liabilities: All that the company owed the government in the form of tax obligation that hasn’t been met yet by the company.

Final Word

Liability section of the balance sheet helps investors to assess the risk profile of a business. It is an important tool to measure the leverage taken by a firm to assess the risk level of the company within the industry and compare it with competitors in the same industry.

Relevance to the SimTrade certificate

This post deals with Liability side of the balance sheet, an important tool for investors to take investment decisions.

About theory

  • By taking the SimTrade course, you will know more about how investors can use various strategies to invest in order to trade in the market.

Take SimTrade courses

About practice

  • By launching the series of Market maker simulations, you can extend your learning about financial markets and trading approaches.

Take SimTrade courses

Related posts on the SimTrade blog

   ▶ Shruti CHAND Balance Sheet

   ▶ Shruti CHAND Long-Term Liabilities

   ▶ Shruti CHAND Accounts Payable

   ▶ Shruti CHAND Financial leverage

About the author

Article written by Shruti CHAND (ESSEC Business School, Grande Ecole Program – Master in Management, 2020-2022).

Cash and Cash Equivalents

Cash and Cash Equivalents

Shruti Chand

In this article, Shruti Chand (ESSEC Business School, Master in Management, 2020-2022) elaborates on the concept of cash equivalents

This read will help you get started with understanding the concept and its significance in determining financial health of a business.

Introduction

Cash and Cash Equivalents on the assets side of the balance sheet is the total amount of cash or assets that can be converted into cash on an immediate basis. Any bank accounts or marketable securities that a business owns can be categorized as cash equivalents.

What is included in Cash and Cash Equivalents?

Cash equivalents are the assets with short maturities typically 90 days or less. Examples of cash equivalents on a firm’s balance sheet include:

  • Treasury Bills
  • Money market mutual funds
  • Commercial Paper (bought from other firms)
  • Bank Certificates of deposit
  • Repurchase agreements
  • Other money market instruments

Cash on the other hand is not limited to the amount of money in checking and savings accounts (and coins and banknotes). It also includes assets such as cheques received but not deposited.

Cash and Cash Equivalents is recorded in the balance sheet in the “Current assets” section. Cash and Cash equivalents are related to other current assets that will transformed into cash later.

Measure of liquidity

Cash and Cash equivalents are used to measure the liquidity of the firm. For example, in financial analysis, it enters the computation of liquidity ratios.

Final Words

Cash and Cash equivalents may be a small part on the balance sheet of a firm but have a lot of impact as it is used to pay day-to-day operations of the firm on a very frequent basis.

Related posts on the SimTrade blog

   ▶ Shruti CHAND Balance sheet

   ▶ Shruti CHAND Current Assets

About the author

Article written in October 2021 by Shruti CHAND (ESSEC Business School, Grande Ecole Program – Master in Management, 2020-2022).

Long-term securities

Long term securities

Shruti CHAND

In this article, Shruti CHAND (ESSEC Business School, Grande Ecole Program – Master in Management, 2020-2022) elaborates on the concept of long-term securities.

This read will help you get started with understanding long-term securities.

Introduction

Long-term assets on a balance sheet represent all the assets of a business that are not expected to turn into cash within one year. They are represented as the non-current part of the balance sheet. These are a set of assets that the company keeps for a long-term and is not likely to be sold in the coming years, in some cases, may never be sold.

Long-term assets can be expensive and require huge capital which might result in draining cash reserves or increasing debt for the firm.

The following category of long-term assets can be found in the balance sheet:

Investments

These are all the long-term investments by a company in securities, real estate and other asset classes. Even the bonds and other assets restricted for long-term value are treated as investments by the company.

Property, plant and equipment

Property that the company owns associated with the manufacturing process or other business operations. An important aspect about this asset class is the depreciation associated with the value of the asset over time.

Typically, you can find the following items disclosed as property, plant and equipment on the balance sheet:

  • Land
  • Land improvements
  • Buildings
  • Furniture
  • Machinery

(Less: Depreciation)

Intangible assets

Intangible assets are the assets without a physical existence. These items represent the intellectual property of a business acquired through their operations, marketing and other efforts to create value. The most notable intangible asset on a balance sheet is Goodwill.

Other intangible assets found in the financial statements are:

  • Copyrights
  • Trademarks
  • Patents

Other assets: All the assets of non-current nature that can not be liquidated easily.

Final words

Since a company holds the long-term assets for a long period of time, the changes in the long-term assets can be a sign of liquidation in some cases. When investors study the balance sheet of a company, they can see if the company often sells its long-term assets then it can be a sign of financial difficulty.

Related posts on the SimTrade blog

   ▶ Shruti CHAND Balance Sheet

   ▶ Shruti CHAND Assets

   ▶ Shruti CHAND Fixed Assets

About the author

Article written in October 2021 by Shruti CHAND (ESSEC Business School, Grande Ecole Program – Master in Management, 2020-2022).

Fixed Assets

Fixed Assets

Shruti Chand

In this article, Shruti CHAND (ESSEC Business School, Grande Ecole Program – Master in Management, 2020-2022) elaborates on the concept of fixed assets.

Fixed Assets:

A fixed asset on a balance sheet is any asset that has a useful life greater than one year. Typically, a fixed asset is not intended to be resold within a short period of time. Fixed assets can also be understood as any non-current asset are recorded on the Balance Sheet with other assets.

Examples of Fixed assets on a company’s balance sheet:

  1. Property
  2. Building
  3. Machinery
  4. Land

The fixed assets are usually recorded at the net book value, which is nothing but the price at which it was acquired. Over time, all the lost value in the fixed assets arising out of holding these assets is recorded as impairment charges and depreciation in the balance sheet.

Out of intuition, it is fair to assume that Fixed costs are large assets which are immovable, but that is not true. An office equipment such as Office Computer can also be a fixed asset if it exceeds the capitalization limits of the concerned business.

Depreciation of fixed assets

Fixed assets can not be converted into cash easily. It is usually acquired by the company to produce more goods and services, hence the use that the fixed assets are put into can lead to its depreciation in value.

This decrease in value is recorded as depreciation in the books of accounts (Balance Sheet). Depending on the company, the depreciation methods vary. For instance, if the company uses a straight line method, the same amount of depreciation is recorded every year for a fixed period of time until the value of the asset is zero.

Example of depreciation

Let’s say a company purchases machinery and plants for $100000 and the useful life of the asset is fixed at 10 years, then every year $10000 will be recorded as depreciation in the books of accounts for the next 10 years and at the 10th year, the value of the asset in the book finally will be 0.

Relevance to the SimTrade certificate

This post deals with Fixed Assets on the Balance Sheet of the companies investors might be assessing to understand the financial health of the company.

About theory

  • By taking the SimTrade course, you will know more about how investors can use various strategies to invest in order to trade in the market.

Take SimTrade courses

About practice

  • By launching the series of Market maker simulations, you can extend your learning about financial markets and trading approaches.

Take SimTrade courses

Related posts on the SimTrade blog

   ▶ Shruti CHAND Balance Sheet

   ▶ Shruti CHAND Assets

   ▶ Shruti CHAND Long-term securities

About the author

Article written by Shruti CHAND (ESSEC Business School, Grande Ecole Program – Master in Management, 2020-2022).

Balance Sheet

Balance Sheet

Shruti CHAND

In this article, Shruti CHAND (ESSEC Business School, Grande Ecole Program – Master in Management, 2020-2022) elaborates on the concept of balance sheet

This read will help you get started with understanding balance sheet and what it indicates when studying a company.

What is a balance sheet?

Balance Sheet is one of the most important financial statement that states business’ assets, liabilities and shareholders’ equity at a specific point of time. It is a consolidated statement to explain what an entity owns and owes to the investors (both creditors and shareholders).

Balance sheet helps to understand the financial standing of the business and helps to calculate ratios which better explain the liquidity, profitability, financial structure and over all state of the business to better understand it.

Structure of the balance sheet

Screenshot 2021-10-25 at 1.24.06 AM

Use of the balance sheet in financial analysis

In financial analysis, the information from the balance sheet is used to compute ratios: liquidity ratios, profitability ratios (especially the return on investment (ROI) and the return on equity (ROE)) and ratios to measure the financial structure (the debt-to-equity ratio).

Final Word

Balance Sheet is one of the most important financial statement for fundamental analysis. Investors use Balance Sheet to get a sense of the health of the company. Various ratios such as debt-to-equity ratio, current ratio, etc can be derived out of the balance sheet. Fundamental Analyst also use the balance sheet as a comparison tool between companies in the same industry.

Relevance to the SimTrade certificate

This post deals with Balance Sheet and its importance in the books of accounts of a company that investors might want to assess.

About theory

  • By taking the SimTrade course, you will know more about how investors can use various strategies to invest in order to trade in the market.

Take SimTrade courses

About practice

  • By launching the series of Market maker simulations, you can extend your learning about financial markets and trading approaches.

Take SimTrade courses

Related posts on the SimTrade blog

   ▶ Shruti CHAND Assets

   ▶ Shruti CHAND Liabilities

   ▶ Shruti CHAND Assets

   ▶ Shruti CHAND Long-term securities

About the author

Article written by Shruti CHAND (ESSEC Business School, Grande Ecole Program – Master in Management, 2020-2022).

Long-Term Liabilities

Long-Term Liabilities

Shruti Chand

In this article, Shruti CHAND (ESSEC Business School, Grande Ecole Program – Master in Management, 2020-2022) elaborates on long-term liabilities.

This read will help you get started with understanding long-term liabilities and how it is used in making investment decisions.

Introduction

Long-term liabilities are financial liabilities of the firm that are due in a period more than one year. These long-term obligations are also referred to as non-current liabilities.

You can find the long-term liabilities in the balance sheet including various items such as all long-term loans, bonds, and deferred tax liabilities.

While the current liabilities of a business represent the funds used by a company to cover its liquid assets, the non-current part of the liabilities are used to cover primary business operations and purchase of heavy long-term assets.

The current and non-current liabilities are separated from each other to help readers understand the financial prosperity of the businesses in different time scenarios.

The most common examples of long-term liabilities are as follows:

● Bonds payable
● Long term loans
● Pension liabilities
● Deferred income taxes
● Deferred revenues

Final Words

Understanding the level of long-term liabilities of the business helps the reader to assess the risk behind meeting the financial obligations of a business. To be able to measure this risk level, it is very important for the investor to understand the concept of leverage. It helps the reader understand how much capital comes from debt. This
helps one understand the position of a company towards its ability to meet its financial obligations. High levels of leverage can be risky for the business. You can measure this using various financial ratios. Common leverage ratios include debt-equity ratio and equity multiplier.

Relevance to the SimTrade certificate

Understanding long term liabilities and its significance in the books of accounts of a company will help you better understand the financial health of companies you would like to invest in.

About theory

  • By taking the market orders course, you will know more about how investors can use various strategies to invest in order to trade in the market.

Take SimTrade courses

About practice

  • By launching the series of Market maker simulations, you can extend your learning about financial markets and trading approaches.

Take SimTrade courses

Related posts on the SimTrade blog

   ▶ Shruti CHAND Balance sheet

   ▶ Shruti CHAND Liabilities

About the author

Article written in October 2021 by Shruti CHAND (ESSEC Business School, Grande Ecole Program – Master in Management, 2020-2022).

Inventory

Inventory

Shruti Chand

In this article, Shruti CHAND (ESSEC Business School, Grande Ecole Program – Master in Management, 2020-2022) elaborates on the concept of accounts receivable.

This read will help you get started with understanding inventory and its significance.

Definition

All the raw material that a business uses to produce goods and the ready for sale products that a business possesses is referred to as Inventory. It is a form of asset for a business.

All inventory is categorised and recorded as current asset on the balance sheet. The inventory mainly comprises of three types of goods:

1. Raw materials: The assets that a business uses in the production process to produce the final product.

2. Work-in progress: The unfinished product held by a business not ready to be sold yet.

3. Finished goods: Ready to sell products possessed by a business not sold yet. These products are usually held by a business in warehouses.

The value of inventory is important to be evaluated by a business as it is an asset stored by the business which incurs costs of storage. The value of the inventory can be evaluated in various ways though, depending on the accounting method followed by the business.

The three ways in which inventory can be valued are as follows

1. FIFO: First in first out method which calculates the cost of goods sold on the basis of the cost of earliest purchased materials.

2. LIFO: Last in first out method states that the cost of the goods sold are calculated based on the value of the raw materials purchased last.

3. Weighted average method: States that the value of inventory is calculated based on the average cost of the total raw material purchased by the business.

Final Words

Understanding inventory and calculating it well helps the business to plan the purchase of raw materials and production decisions better. Business can determine the level of purchases to be made and exercise stock control for better business performance.

Relevance to the SimTrade certificate

This post deals with inventory part of the books of accounts, which is an important indicator for investors to study the financial health of a company.

About theory

  • By taking the SimTrade course , you will learn more about the markets.

Take SimTrade courses

About practice

  • By launching the series of Market maker simulations, you can extend your learning about financial markets and trading approaches.

Take SimTrade courses

Related posts on the SimTrade blog

   ▶ Shruti CHAND Balance sheet

   ▶ Shruti CHAND Accounts Receivable

   ▶ Shruti CHAND Current Assets

About the author

Article written in October 2021 by Shruti CHAND (ESSEC Business School, Grande Ecole Program – Master in Management, 2020-2022).

Accounts Receivable

Accounts Receivable

Shruti Chand

In this article, Shruti CHAND (ESSEC Business School, Grande Ecole Program – Master in Management, 2020-2022) elaborates on the concept of accounts receivable.

This read will help you get started with understanding accounts receivable and its significance.

Introduction

Accounts Receivable appears in the balance sheet of a company when an entity (an individual or a company) purchases goods or services on credit from the company and the payment will be received later.

It is the amount of money owed by the customer for any purchase that is made on credit. Quite often, business sells products/services to its customers but the payment is made in the future and issues an invoice for this same in the meantime. This invoice signifies that the product has been sent but the payment is to be done within a specified future date. These are a form of short-term debt since they are to be paid back in a short span. The time for the payment is usually from about 30 days to a few months.

Example

Company A that sells broadband service usually provides the service for the month, but the payment is typically received at the end of the month. This means that even though the service has been provided, the payment is pending hence making it an accounts receivable.

Mostly, businesses provide credit purchases to customers with whom they have frequent transactions. This enables them to avoid the hassle of payments every time a transaction occurs. It also helps build a good relationship with its clients by providing them an ease of payment.

Accounting Treatment

As discussed, since Accounts Receivables is like a short-term credit line to clients hence it is treated as a short-term asset in the balance sheet. It falls under ‘Current Assets’ since the payment is received in the short term. For double entry, the credit side of the same is recorded in the income account as a sale. Once, the payment is made the cash in the balance sheet will increase and the accounts receivable will decrease. For goods like raw materials, there is a variation in inventory in the revenues and a decrease in the Asset side under ‘Inventory’.

The increase or decrease in accounts receivable from the prior period is also recorded in the Cash Flow Statement.

Final Words

Accounts receivable are crucial to every economy and it differs based on various factors and is taken in control by policy makers whenever needed. As a student curious about Finance, learning about accounts receivable will go a long way in the future to understand better how liquidity and prices in the economy is maintained.

Relevance to the SimTrade certificate

This post deals with Accounts Receivable and its significance on the book of accounts of a company.

About theory

  • By taking the SimTrade course , you will learn more about the markets. It’s important to remember that accounts receivables are an important to assess it to understand the financial health of a company you would like to invest in.

Take SimTrade courses

About practice

  • By launching the series of Market maker simulations, you can extend your learning about financial markets and trading approaches.

Take SimTrade courses

Related posts on the SimTrade blog

   ▶ Shruti CHAND Balance sheet

   ▶ Shruti CHAND Accounts Payable

   ▶ Shruti CHAND Current Assets

About the author

Article written in October 2021 by Shruti CHAND (ESSEC Business School, Grande Ecole Program – Master in Management, 2020-2022).

Rise of SPAC investments as a medium of raising capital

Rise of SPAC investments as a medium of raising capital

Daksh GARG

In this article, Daksh GARG (ESSEC Business School, Master in Strategy & Management of International Business (SMIB), 2020-2021) talks about the rise of SPAC investments as a medium of raising capital. Imagine someone famous asking you to invest in a company. Chances are, you will want to know more. As it turns out, there is no company, at least not yet. Will you invest in it with your money?

What are SPACs?

‘SPAC’ stands for Special Purpose Acquisition Companies. SPACs are a type of blank-check company that pools funds to finance mergers and acquisitions (M&A) transactions.

Once shunned by investors, SPACs have become an increasingly popular method in recent years to list companies on a stock exchange.

SPACs are shell companies with no actual commercial operations but are created solely for raising capital through an initial public offering – or IPO – to acquire later a private company. This is done by selling common stocks – with shares commonly sold at $10 a piece – and a warrant, which gives investors the preference to buy more stocks later at a fixed price.

Once the funds are raised, they will be kept in a trust until one of two things happen:

    The management team of the SPAC — also known as sponsors — identifies a company of interest, which will then be taken public through an acquisition, using the capital raised in the SPAC IPO.

    If the SPAC fails to merge or acquire a company within a deadline typically two years — the SPAC will be liquidated, and investors will get their money back.

SPACs have existed in one form or another as early as the 1990s, typically as a last resort for smaller companies to go public. The number of SPAC IPOs has waxed and waned over the years in tandem with the economic cycles. SPACs have been making a resurgence of late.

The timeline for SPAC

Figure 1 gives the typical timeline for a SPAC investment. Following the IPO, the proceeds for a SPAC are placed in a fund. In the meantime, the SPAC has to merge with a target company. If it is not able to do that in the time frame, the SPAC has to liquidate and the IPO proceeds are returned to the shareholders.

Figure 1. Typical SPAC timeline.

Typical SPAC timeline

Source: PWC accounting advisory

Difference between a traditional IPO and a SPAC

There are several ways a private company can go public (being quoted on the stock market). The most common route is through a traditional IPO, where the company is subject to regulatory and investor scrutiny of its audited financial statements.

An investment bank is usually hired by the company to underwrite the IPO, which usually takes 4-6 months to complete. This involves roadshows and pitch meetings between company executives and potential investors to drum up interest and demand in its shares. And not all IPOs succeed. A very famous example is that of a co-working-space company called WeWork withdrew its high-profile IPO in 2019 amid weak demand for its shares after massive losses and leadership controversies were revealed. Other companies such as Spotify and Slack went public through direct listings, saving on fees paid to middlemen such as investment banks, although there are more risks involved. And while private companies listed through SPACs are similar to reverse takeovers, such as the case for insolvent fintech company Wirecard, they are different in that SPACs start off on a clean slate and have lower risks. Because SPACs are nothing more but shell companies, their track records depend on the reputation of their management teams. By skipping the roadshow process, SPAC IPOs also typically are listed in a much shorter time. This leads to some investors to become wary of buying shares in companies listed through SPACs due to the lack of scrutiny compared to traditional IPOs.

SPAC sponsors also typically receive 20% of founder shares in the company at a heavily discounted price, also known as the “promote.” This essentially dilutes the ownership of public shareholders.

Performance of traditional IPOs compared to SPAC IPOs

According to Bloomberg, a study of 56 SPACs that completed acquisitions or mergers since the start of 2018 found that they tend to underperform the S&P 500 during a three, six and 12-month period after the transaction. A separate study of blank-check companies in the U.S. organized between 2015 and 2019 found that the majority are trading below the standard price of $10 per share. Between 2017 and the middle of 2019, there were slightly over 100 SPACs in the U.S., with an average return of a mere 2%.

Even before the pandemic, SPACs were already on the rise, buoyed by the equity boom and hot IPO market in 2019. While the pandemic has slowed the pipeline of traditional IPOs, SPACs have increased.

In fact, funds raised through SPACs outpaced traditional IPOs in August 2020 — a rarity on Wall Street. In the first ten months of 2020, there were 165 SPAC IPOs globally, of which 96% of them were listed in the U.S. While largely an American phenomenon, SPACs have caught the attention of investors in other jurisdictions.
In 2018, Antony Leung, the former finance secretary of Hong Kong, raised $1.5 billion on the New York Stock Exchange through his SPAC, which bought a mainland hospital chain a year later.

Other players include Masayoshi Son’s SoftBank, and the investment arm of Chinese state-owned conglomerate CITIC Group. Despite having sponsors from Asia looking to acquire international companies, these SPACs are ultimately listed in the U.S.

One main reason is the different rules for SPACs across jurisdictions. In the U.S., investors can vote to approve the acquisition the SPAC proposes or redeem their funds if they do not support the proposed deal.

This, however, isn’t a requirement in some European jurisdictions, including the U.K. There is also a lock-in period for British investors once an acquisition is announced until the approval of the prospectus, which ties them into deals that they may not support in that indefinite period.

Future of SPACs

As SPAC activity reaches fever pitch in the U.S., regulators are putting these blank-check companies under the microscope. Competition to the IPO process is probably a good thing, but for good competition and good decision-making, you need good information. And one of the areas in the SPAC space that I’m particularly focused on is incentives and compensation to the SPAC sponsors. As more ordinary investors jump on the SPAC bandwagon, experts are concerned that this will overheat markets and affect any fragile economic recovery. While SPACs provide a straightforward route to invest through a trusted intermediary, its performance so far means that it is a dicey bet for ordinary investors.

Why should I be interested in this post?

If you are interested in how big companies are going public, SPAC is one of the most interesting phenomena which is going to transform the financial industry. So, if you are planning to work for top underwriting firms or big banks or on Wall Street, you should have in-depth knowledge on how SPACs work and what are some of their advantages and disadvantages.

Useful resources

PWC How special purpose acquisition companies (SPACs) work Accessed November 2, 2021.

PWC Analysis: De-SPACing Successes Refuel Hot SPAC IPO Market Accessed November 2, 2021.

Related posts on the SimTrade blog

   ▶ Suyue MA Expeditionary experience in a Chinese investment banking boutique

   ▶ Raphaël ROERO DE CORTANZE In the shoes of a Corporate M&A Analyst

About the author

The article was written in November 2021 by Daksh GARG (ESSEC Business School, Master in Strategy & Management of International Business (SMIB), 2020-2021).

Pension Funds

Pension Funds

Shruti Chand

In this article, Shruti CHAND (ESSEC Business School, Grande Ecole Program – Master in Management, 2020-2022) elaborates on the concept of Pension Funds

This read will help you get started with understanding pension funds and its significance.

What are pension funds

Term pension liability refers to the amount that a company or government owes to the pension fund obligations due to retirees. A pension liability will only occur in defined benefit schemes.

The traditional pensions are pre-defined benefit schemes. These funds consist of contributions from employees and the company over a period of time. The employees agree to contribute a certain amount into the fund in return of a guaranteed source of fund flow upon retirement.

Not all pension funds have liabilities attached to them. Most common pension fund in this regard is 401k where the company is under no obligation to contribute towards the fund. It is pre-defined by the company and the employee to contribute towards the fund which may or may not guarantee obligation upon retirement.

So, what is pension fund liability?

Pension fund liability is the difference between the total amount due to retirees and the actual amount of money the company has in order to meet these fund obligations.

If the company or the government has more money than the future payment obligations, it is said to have a pension surplus, and if this is not the case, it is referred to as pension deficit which results in a pension fund liability.

Relevance to the SimTrade certificate

This post deals with Pension fund liability.

About theory

  • By taking the SimTrade course , you will learn more about the markets. It’s important to remember that pension funds has not much to do with investing directly. But, it is important to understand it as it’s an important activity for the companies investors invest in.

Take SimTrade courses

About practice

  • By launching the series of Market maker simulations, you can extend your learning about financial markets and trading approaches.

Take SimTrade courses

Related posts on the SimTrade blog

   ▶ Shruti CHAND Balance sheet

   ▶ Shruti CHAND Liabilities

About the author

Article written in October 2021 by Shruti CHAND (ESSEC Business School, Grande Ecole Program – Master in Management, 2020-2022).

Long-Term Assets

Long-Term Assets

Shruti Chand

In this article, Shruti CHAND (ESSEC Business School, Grande Ecole Program – Master in Management, 2020-2022) elaborates on long-term assets.

This read will help you get started with understanding long-term assets on the balance sheet of a business.

Introduction

Long-term assets on a balance sheet represent all the assets of a business that are not expected to turn into cash within one year. They are represented as the non- the current part of the balance sheet. These are a set of assets that the company keeps for the long-term and is not likely to be sold in the coming years, in some cases, may
never be sold.

Long-term assets can be expensive and require huge capital which might result in draining cash reserves or increasing debt for the firm.

The following category of long-term assets can be found in the balance sheet:

1. Investments:

These are all the long-term investments by a company in securities, real estate, and other asset classes. Even the bonds and other assets restricted for long-term value are treated as investments by the company.

2. Property, plant, and equipment:

Property that the company owns associated with the manufacturing process or other business operations. An important aspect about this asset class is the depreciation associated with the value of the asset over time.

Typically, you can find the following items disclosed as property, plant and equipment on the balance sheet:

● Land
● Land improvements
● Buildings
● Furniture
● Machinery
(Less: Depreciation)

3. Intangible assets

Intangible assets are the assets without a physical existence. These items represent the intellectual property of a business acquired through their operations, marketing and other efforts to create value. The most notable
intangible asset on a balance sheet is Goodwill.

Other intangible assets found in the financial statements are:

● Copyrights
● Trademarks
● Patents

4. Other assets: All the assets of non-current nature that can not be liquidated
easily.

Final Words

Since a company holds the long-term assets for a long period of time, the changes in the long-term assets can be a sign of liquidation in some cases. When investors study the balance sheet of a company, they can see if the company often sells its long-term assets then it can be a sign of financial difficulty.

Relevance to the SimTrade certificate

This post deals with Long-Term assets which are used by various  investors to study the financial health of a business.

Additional courses:

  • By taking the market orders course, you will know more about how investors can use various strategies to invest in order to trade in the market.

Take SimTrade courses

About practice

  • By launching the series of Market maker simulations, you can extend your learning about financial markets and trading approaches.

Take SimTrade courses

Related posts on the SimTrade blog

   ▶ Shruti CHAND Balance sheet

   ▶ Shruti CHAND Current Assets

About the author

Article written in October 2021 by Shruti CHAND (ESSEC Business School, Grande Ecole Program – Master in Management, 2020-2022).

Programming Languages for Quants

Programming Languages for Quants

Jayati WALIA

In this article, Jayati WALIA (ESSEC Business School, Grande Ecole Program – Master in Management, 2019-2022) presents an overview of popular programming languages used in quantitative finance.

Introduction

Finance as an industry has always been very responsive to new technologies. The past decades have witnessed the inclusion of innovative technologies, platforms, mathematical models and sophisticated algorithms solve to finance problems. With tremendous data and money involved and low risk-tolerance, finance is becoming more and more technological and data science, blockchain and artificial intelligence are taking over major decision-making strategies by the power of high processing computer algorithms that enable us to analyze enormous data and run model simulations within nanoseconds with high precision.

This is exactly why programming is a skill which is increasingly in demand. Programming is needed to analyze financial data, compute financial prices (like options or structured products), estimate financial risk measures (like VaR) and test investment strategies, etc. Now we will see an overview of popular programming languages used in modelling and solving problems in the quantitative finance domain.

Python

Python is general purpose dynamic high level programming language (HLL). It’s effortless readability and straightforward syntax allows not just the concept to be expressed in relatively fewer lines of code but also makes it’s learning curve less steep.

Python possesses some excellent libraries for mathematical applications like statistics and quantitative functions such as numpy, scipy and scikit-learn along with the plethora of accessible open source libraries that add to its overall appeal. It supports multiple programming approaches such as object-oriented, functional, and procedural styles.

Python is most popular for data science, machine learning and AI applications. With data science becoming crucial in the financial services industry, it has consequently created an immense demand for Python, making it a programming language of top choice.

C++

The finance world has been dominated by C++ for valid reasons. C++ is one of the essential programming languages in the fintech industry owing to its execution speed. Developers can leverage C++ when they need to programme with advanced computations with low latency in order to process multiple functions fasters such as in High Frequency Trading (HFT) systems. This language offers code reusability (which is crucial in multiple complex quantitative finance projects) to programmers with a diverse library comprising of various tools to execute.

Java

Java is known for its reliability, security and logical architecture with its object-oriented programming to solve complicated problems in the finance domain. Java is heavily used in the sell-side operations of finance involving projects with complex infrastructures and exceptionally robust security demands to run on native as well as cross-platform tools. This language can help manage enormous sets of real-time data with the impeccable security in bookkeeping activity. Financial institutions, particularly investment banks, use Java and C# extensively for their entire trading architecture, including front-end trading interfaces, live data feeds and at times derivatives’ pricing.

R

R is an open source scripting language mostly used for statistical computing, data analytics and visualization along with scientific research and data science. R the most popular language among mathematical data miners, researchers, and statisticians. R runs and compiles on multiple platforms such as Unix, Windows and MacOS. However, it is not the easiest of languages to learn and uses command line scripting which may be complex to code for some.

Scala

Scala is a widely used programming language in banks with Morgan Stanley, Deutsche Bank, JP Morgan and HSBC are among many. Scala is particularly appropriate for banks’ front office engineering needs requiring functional programming (programs using only pure functions that are functions that always return an immutable result). Scala provides support for both object-oriented and functional programming. It is a powerful language with an elegant syntax.

Haskell and Julia

Haskell is a functional and general-purpose programming language with user-friendly syntax, and a wide collection of real-world libraries for user to develop the quant solving application using this language. The major advantage of Haskell is that it has high performance, is robust and is useful for modelling mathematical problems and programming language research.

Julia, on the other hand, is a dynamic language for technical computing. It is suitable for numerical computing, dynamic modelling, algorithmic trading, and risk analysis. It has a sophisticated compiler, numerical accuracy with precision along with a functional mathematical library. It also has a multiple dispatch functionality which can help define function behavior across various argument combinations. Julia communities also provide a powerful browser-based graphical notebook interface to code.

Related posts on the SimTrade blog

   ▶ Jayati WALIA Quantitative Finance

   ▶ Jayati WALIA Quantitative Risk Management

   ▶ Jayati WALIA Value at Risk

   ▶ Akshit GUPTA The Black-Scholes-Merton model

Useful Resources

Websites

QuantInsti Python for Trading

Bankers by Day Programming languages in FinTech

Julia Computing Julia for Finance

R Examples R Basics

About the author

The article was written in October 2021 by Jayati WALIA (ESSEC Business School, Grande Ecole Program – Master in Management, 2019-2022).

The Warren Buffett Indicator

The Warren Buffett Indicator

Youssef EL QAMCAOUI

In this article, Youssef EL QAMCAOUI (ESSEC Business School, Master in Strategy & Management of International Business (SMIB), 2020-2021) discusses the Warren Buffett Indicator.

It is no secret that stock prices are all-time highs and people have been asking the important question: are we in a stock market bubble? According to the Warren Buffett Indicator, the answer to that question is YES.

Let’s discuss what exactly the Warren Buffett Indicator is, why it is showing that this stock market is the most overvalued in history and why the stock market would have to fall by more than 50% to be considered fairly valued based on historical averages.

Definition and origin of the Warren Buffett Indicator

The Warren Buffett Indicator is defined as the ratio between the US Wilshire 5000 index to US Gross Domestic Product (GDP). In other words, it is the American stock market valuation to US GDP divided by the size of the American economy.

It is used to determine how cheap or expensive the stock market is at a given point in time. It was named after the legendary investor Warren Buffett who called in 2001 the ratio “the best single measure of where valuations stand at any given moment”. It is widely followed by the financial media and investors as a valuation measure for the US stock market and has hit an all-time high in 2021.

To calculate the Warren Buffett Indicator, we need to get data for both metrics: the US Wilshire 5000 index and the US GDP.

The US Wilshire 5000 index

To determine the total stock market value of the US, Warren Buffett uses the Wilshire 5000 index. This index is a broad-based market capitalization weighted index composed of 3,451 publicly traded companies that meet the following criteria:

  • The companies are headquartered in the United States.
  • The stocks are listed and actively traded on a US stock exchange.
  • The stocks have pricing information that is widely available to the public.

The Wilshire 5000 index is a better measure of the total value of the US stock market than other more popular stock market indices such as the S&P500 the Dow Jones or the NASDAQ. In the case of the S&P500, it only measures the 500 largest US companies. The Dow Jones has only 30 component companies and the NASDAQ consists of mostly tech companies and excludes companies listed on the NYSE. On the other hand, the Wilshire 5000 is often used as a benchmark for the entirety of the US stock market and is widely regarded as the best single measure of the overall US equity market.

In 2021, the market capitalization of the Wilshire 5000 is approximately 47.1 trillion dollars.

The US GDP

The US GDP which represents the total production of the US economy. It is measured quarterly by the US Government’s Bureau of Economic Analysis. The GDP is a static measurement of prior economic activity meaning it does not forecast the future or include any expectation or evaluation of future economic activity or growth. In 2021, the US GDP is 22.7 trillion dollars.

The Warren Buffett Indicator

Knowing the value of the US Wilshire 5000 index and the value of the US GDP, we can compute the value of the Warren Buffett Indicator:

(47.1 / 22.7)*100 = 207.5%.

Without any historical context this number doesn’t say anything so let’s dive into it.

Evolution of the Warren Buffett Indicator

Figure 1 gives the evolution of the Warren Buffett Indicator over the period 1987-2021. This figure underlines how extremely high the Warren Buffett Indicator currently is compared to historical averages.

Figure 1. The Warren Buffett Indicator (1987-2021).

 History Warren Buffet Indicator
Source: www.longtermtrends.net

The Warren Buffett Indicator at 207% is tremendously higher than periods that turned out to be huge market bubbles such as “.com” bubble in March of 2000 where the Warren Buffett Indicator topped out at 140%. Even at the top of the housing bubble in October 2007 looks significantly tame at 104% compared to today’s level of nearly double that.

Since 1970, the average Warren Buffett Indicator reading has been at around 85%. In fact, for the stock market to be considered fairly valued based on historical averages, the total value of the stock market would have to fall to 19.3 trillion, far from the current value of 47.1 trillion. This means it would take a 60% stock market crash for the Warren Buffett Indicator to fall back to its historical average of 85%.

Use of the Warren Buffett Indicator for investment

But what does this mean for future investing returns? Over the last 10 years the S&P500 returns have been extremely strong at an average of 12.5% per year – well above historical trends.

Let’s look at how Warren Buffett used the thinking around the Warren Buffett Indicator to help make predictions about future returns from the stock market during these crazy times. Warren Buffett has been known to be hesitant about making predictions about the stock market but there have been a few times where Buffett used the Warren Buffett Indicator to help make accurate predictions about the future returns of the stock market in November 1999 when the Dow Jones was at 11,000 – and just a few months before the burst of the dot-com bubble – the stock market gained 13% a year from 1981 to 1998. The Warren Buffett Indicator was at 130% significantly higher than ever before in the past 30 years.

Warren Buffett said at the time that 13% return is impossible if you strip out the inflation component from this nominal return which you would need to do. However, inflation fluctuates that’s 4% in real terms and if 4%.

Two years after the November 1999 article when the Dow Jones was down to 9,000, Warren Buffett stated: “I would expect now to see long-term returns somewhat higher [around] 7% after costs”. He revised his expectations for future returns higher because the Warren Buffett Indicator had come down significantly from its high of 130% in November 1999 to 93% just two years later – meaning stocks were more fairly valued and as a result prospective future returns were higher.

In October 2008, after the S&P500 had fallen from a high of greater than 1,500 in July 2007 to around 900, Warren Buffett wrote “Equities will almost certainly outperform cash over the next decade probably by a substantial degree. At that moment, the indicator was at around 60%. This was not a popular prediction and people were selling out of stocks because they were worried about the future. They had seen stock prices fall consistently and wanted to sell out of stocks before they kept falling more. Since Warren Buffett made this call in October 2008, the S&P500 has returned an average annualized return of 14.7% with dividends reinvested. This return is significantly higher than the long-term historical return of the stock market.

To grasp the Warren Buffett Indicator has been a good gauge of future stock market returns, it is needed to understand the reason stocks can’t rise 25% or more a year forever. This is because over the long term, stock market returns are determined by the following:

Interest rate

The higher the interest rate, the greater the downward pole. This is because the rate of return that investors need from any kind of investment is directly tied to the risk-free rate that they can earn from government securities. As Warren Buffett explained: “If the government rate rises the prices of all other investments must adjust downward to a level that brings their expected rates of return into line. If government interest rates fall, the dynamic pushes the prices of all other investments upward”.

Long-term growth of corporate profitability

Over the long-term, corporate profitability reverts to its long-term trend (~6%). During recessions, corporate profit margins shrink and during economic growth periods corporate profit margins expand. Nonetheless, long-term growth of corporate profitability is closely tied to long-term economic growth.

Current market valuation

Over the long run, stock market valuation tends to revert to its historical average. A higher current valuation certainly correlates with lower long-term returns in the future. On the other hand, a lower current valuation correlates with a higher long-term return.

Discussion

That being said there are some points that we add to discuss this perspective.

Historically low interest rates

Figure 2 represents the history of interest rates in the US for the period 1960-2021.

Figure 2. History of interest rates in the US.

History US interest rates
Source: www.macrotrends.net

This figure shows that the current interest rate on 10-year US government bonds has never been so low. This extremely low level of interest rates partially helps to explain the high stock market valuation by historical standards. As Warren Buffet stated: “As interest rates rise stocks become less valuable and as interest rates decrease stock prices increase all else being equal”.

Companies are staying private for longer

As companies stay private for longer, these companies are not included in the value of the stock market. If these companies had decided to go public, the market cap of Wilshire 5000 would be higher as the index currently contains around 3,500 stocks. Since this index only counts publicly traded companies, if large non-publicly traded companies were also included in the value of the index, the value of the Warren Buffet Indicator would increase – although likely not by a large enough factor.

Why should I be interested in this post?

You might be interested in this topic if you are aware or are trying to get knowledge around the stock market and the possible crash that is being discussed in 2021. This might help you understand what the current situation is and why we are talking about this. But it also gives you insights to understand how important this topic can become in the very near future.

Useful resources

Data to compute the Warren Buffett Indicator

Federal Reserve Economic Data US GDP

Federal Reserve Economic Data Wilshire 5000 Full Cap Price Index

Other

Wilshire www.wilshire.com

Current market valuation Buffet Indicator

Related posts on the SimTrade blog

   ▶ Bijal GANDHI Gross Domestic Product (GDP)

   ▶ Rayan AKKAWI Warren Buffet and his basket of eggs

About the author

The article was written in October 2021 by Youssef EL QAMCAOUI (ESSEC Business School, Master in Strategy & Management of International Business (SMIB), 2020-2021).

Smart Beta industry main actors

Youssef_Louraoui

In this article, Youssef LOURAOUI (ESSEC Business School, Global Bachelor of Business Administration, 2017-2021) presents the main actors of the smart beta industry, which is estimated to represent a cumulative market value of $1.9 trillion as of 2017 and is projected to grow to $3.4 trillion by 2022 (BlackRock, 2021).

The structure of this post is as follows: we begin by presenting an overview of the smart beta industry actors. We will then discuss the case of BlackRock, the 10 trillion dollar powerhouse of the asset management industry, which is the main actor in the smart beta industry segment.

Overview of the market

The asset management sector, which is worth 100 trillion dollars worldwide, is primarily divided into active and passive management (BCG, 2021). While active management continues to dominate the market, passive management’s proportion of total assets under managed (AUM) increased by 4 percentage points between 2008 and 2019, reaching 15%. This market transition is even more dramatic in the United States, where passive management accounted for more than 40% of the total market share in 2019. A new category has arisen and begun to acquire market share over the last decade. Smart beta exchange-traded funds (ETFs) are receiving fresh inflows and are the industry’s fastest-growing ETF product. Various players are entering the market by developing and releasing new products (Deloitte, 2021).

Active funds have demonstrated divergent returns when compared to passive funds, making the cost difference increasingly difficult to justify (Figure 1). The growing market share of passive funds in both the United States and the European Union is putting further pressure on active managers’ fees. When it comes to meeting the demands of investors, both active and passive management has shown shortcomings. Active management funds often fail to outperform their benchmarks because they lack clear indicators, charge expensive fees, and don’t always have clear indicators. As seen in Figure 1, active funds struggle to deliver consistent returns over a prolonged timeframe, as depicted in the European market. In this sense, the active funds success rate is divided by more than half between year one and year three (Deloitte, 2021). Concentration is a problem for passive funds that are weighted by market capitalization.. These limits have prepared the ground for smart beta funds to emerge (Figure 1).

Figure 1. Active funds success rates (% of funds beating their index over X years)
Active funds success rates
Source: Deloitte (2021).

The smart beta market is dominated by several players who have a strategic position with a large volume of assets under management. Figure 2 compares smart beta actors based on percentage of asset under management (%AUM), one the most important metric in the asset management industry. Some key elements can be drawn for the first figure. BlackRock is the provider with the largest market share, with over 40% of the smart beta industry in the analysis, followed by Vanguard and State Street Global Advisors with 30.66% and 18.44% respectively in this benchmark study underpinning nearly $1 trillion (Figure 2).

Figure 2. % AUM of the biggest Smart Beta ETF providers
Smart_Beta_benchmark_analysis
Source: etf.com (2021).

BlackRock dominance

The main powerhouses of the passive investing industry, BlackRock and Vanguard, are poised to capture the lion’s share of assets in the rapidly rising world of actively managed exchange-traded funds. The conclusion is likely to dissatisfy active fund managers, who have been squeezed by the fast development of passive ETFs in recent years and may have seen the introduction of active ETFs as a chance to fight back and get a piece of the lucrative pie (Financial Times, 2021).

According to a study of 320 institutional investors with a combined $12.9 trillion in assets, institutional investors prefer BlackRock and Vanguard to handle their active ETF investments. The juggernauts were expected to provide the best performance as well as the best value for money. With over a third of the global ETF market capitalization, BlackRock remains the dominant player (The Financial Times, 2021). BlackRock is unquestionably a major force in the ETF business, with an unparalleled market share in both the US and European ETF markets. BlackRock has expanded to become the world’s largest asset manager, managing funds for everyone from pensioners to oligarchs and sovereign wealth funds. It is now one of the largest stockholders in practically every major American corporation — as well as a number of overseas corporations. It is also one among the world’s largest lenders to businesses and governments.

Aladdin, the company’s technological platform, provides critical wiring for large portions of the worldwide investing industry. By the end of June this year, BlackRock was managing a stunning $9.5 trillion in assets, a sum that would be hardly understandable to most of the 35 million Americans whose retirement accounts were managed by the business in 2020. If the current rate of growth continues, BlackRock’s third-quarter reports on October 13 might disclose that the company’s market capitalization has surpassed $10 trillion. It’s expected to have surpassed that mark by the end of the year (FT, 2021). To put this in perspective, it is about equivalent to the worldwide hedge fund, private equity, and venture capital industries combined.

Industry-wide fee cuts had helped BlackRock maintain its dominance in the ETF sector. Its iShares brand is the industry’s largest ETF provider for both passive and actively managed products (CNBC, 2021).

Why should I be interested in this post?

If you are a business school or university undergraduate or graduate student, this content will help you in understanding the various evolutions of asset management throughout the last decades and in broadening your knowledge of finance.

Smart beta funds have become a trending topic among investors in recent years. Smart beta is a game-changing invention that addresses an unmet need among investors: a higher return for lower risk, net of transaction and administrative costs. In a way, these investment strategies create a new market. As a result, smart beta is gaining traction and influencing the asset management industry.

Related posts on the SimTrade blog

Factor investing

   ▶ Youssef LOURAOUI Factor Investing

   ▶ Youssef LOURAOUI Origin of factor investing

   ▶ Youssef LOURAOUI MSCI Factor Indexes

   ▶ Youssef LOURAOUI Smart beta 1.0

   ▶ Youssef LOURAOUI Smart beta 2.0

Factors

   ▶ Youssef LOURAOUI Size Factor

   ▶ Youssef LOURAOUI Value Factor

   ▶ Youssef LOURAOUI Yield Factor

   ▶ Youssef LOURAOUI Momentum Factor

   ▶ Youssef LOURAOUI Quality Factor

   ▶ Youssef LOURAOUI Growth Factor

   ▶ Youssef LOURAOUI Minimum Volatility Factor

Useful resources

Business analysis

BlackRock, 2021.What is factor investing?

BCG, 2021.The 100$ Trillion Machine: Global Asset Management 2021

CNBC, 2021. What Blackrock’s continued dominance means for other ETF issuers.

Deloitte, 2021. Will smart beta ETFs revolutionize the asset management industry? Understanding smart beta ETFs and their impact on active and passive fund managers

Etf.com, 2021.Smart Beta providers

Financial Times (13/09/2020) BlackRock and Vanguard look set to extend dominance to active ETFs

Financial Times (07/10/2021) The ten trillion dollar man: how Larry Fink became king of Wall St

About the author

The article was written in October 2021 by Youssef LOURAOUI (ESSEC Business School, Global Bachelor of Business Administration, 2017-2021).

MSCI Factor Indexes

Youssef_Louraoui

In this article, Youssef LOURAOUI (ESSEC Business School, Global Bachelor of Business Administration, 2017-2021) presents the MSCI Factor Indexes. MSCI is one of the most prominent actors in the indexing business, with approximately 236 billion dollars in assets benchmarked to the MSCI factor indexes.

The structure of this post is as follows: we begin by introducing MSCI Factor Indexes and the evolution of portfolio performance. We then delve deeper by describing the MSCI Factor Classification Standards (FaCS). We finish by analyzing factor returns over the last two decades.

Definition

Factor

A factor is any component that helps to explain the long-term risk and return performance of a financial asset. Factors have been extensively used in portfolio risk models and in quantitative investment strategies, and documented in academic research. Active fund managers use these characteristics while selecting securities and constructing portfolios. Factor indexes are a quick and easy way to get exposure to several return drivers. Factor investing aims to obtain greater risk-adjusted returns by exposing investors to stock features in a systematic way. Factor investing isn’t a new concept; it’s been utilized in risk models and quantitative investment techniques for a long time. Factors can also explain a portion of fundamental active investors’ long-term portfolio success. MSCI Factor Indexes use transparent and rules-based techniques to reflect the performance characteristics of a variety of investment types and strategies (MSCI Factor Research, 2021).

Performance analysis

Understanding portfolio returns is crucial to determining how to evaluate portfolio performance. It may be traced back to Harry Markowitz’s pioneering work and breakthrough research on portfolio design and the role of diversification in improving portfolio performance. Investors did not discriminate between the sources of portfolio gains throughout the 1960s and 1970s. Long-term portfolio management was dominated by active investment. The popularity of passive investment as an alternative basis for implementation was bolstered by finance research in the 1980s. Through passive allocation, investors began to effectively capture market beta. Investors began to perceive factors as major determinants of long-term success in the 2000s (MSCI Factor Research, 2021). Figure 1 presents the evolution of portfolio performance analysis over time: until the 1960s, based on the CAPM model, returns were explain by one factor only: the market return. Then, the market model was used to assess active portfolio with the alpha measuring the extra performance of the fund manager. Later on in the 2000s, the first evaluation model based on the market factor was augmented with other factors (size, value, etc.).

Figure 1. Evolution of portfolio performance analysis.
Evolution_portfolio_performance
Source: MSCI Research (2021).

MSCI Factor Index

MSCI Factor Classification Standards (FaCS) establishes a standard vocabulary and definitions for factors so that they may be understood by a wider audience. MSCI FaCS is comprised of 6 Factor Groups and 14 factors and is based on MSCI’s Barra Global Equity Factor Model (MSCI Factor Research, 2021) as shown in Table 1.

Table 1 Factor decomposition of the different factor strategies.
MSCI_FaCS
Source: MSCI Research (2021).

The MSCI Factor Indexes are based on well-researched academic studies. The MSCI Factor Indexes were identified and developed based on academic results, creating a unified language to describe risk and return via the perspective of factors (MSCI Factor Research, 2021).

Performance of factors over time

Figure 2 compares the MSCI factor indexes’ performance from 1999 to May 2020. All indexes are rebalanced on a 100-point scale to ensure consistency in performance and to facilitate factor comparisons. Over a two-decade period, smart beta factors have all outperformed the MSCI World index, with the MSCI World Minimum Volatility Index as the most profitable factor which has consistently provided excess profits over the long run while (MSCI Factor research, 2021).

Figure 2. Performance of MSCI Factor Indexes during the period 1999-2017.
MSCI_performance
Source: MSCI Research (2021).

Individual factors have consistently outperformed the market over time. Figure 2 represents the performance of the MSCI Factor Indexes for the last two decades compared to the MSCI ACWI, which is MSCI’s flagship global equity index and is designed to represent the performance of large- and mid-cap stocks across 23 developed and 27 emerging markets.

It is possible to make some conclusions regarding the performance of the investment factor over the previous two decades by dissecting the performance of the various factorial strategies. The value factor was the one that drove performance in the first decade of the 2000s. This outperformance is characterized by a movement towards more conservative investment in a growing market environment. The dotcom bubble crash resulted in a bear market, with the minimal volatility approach helping to absorb market shocks in 2002. When it comes to the minimal volatility approach, it is evident that it is highly beneficial during moments of high volatility, acting as a viable alternative to hedging one’s stock market exposure and moving into more safe-haven products. Several times of extreme volatility may be recognized, including the dotcom boom, the US subprime crisis, and the European debt crisis as shown in Figure 3.

Figure 3. Table of performance of MSCI Factor Indexes from 1999-2017.
MSCI_historical_performance
Source: MSCI Research (2021).

Why should I be interested in this post?

If you are a business school or university undergraduate or graduate student, this content will help you in understanding the evolution of asset management throughout the last decades and in broadening your knowledge of finance.

Smart beta funds have become a trending topic among investors in recent years. Smart beta is a game-changing invention that addresses an unmet need among investors: a higher return for lower risk, net of transaction and administrative costs. In a way, these investment strategies create a new market. As a result, smart beta is gaining traction and influencing the asset management industry.

Related posts on the SimTrade blog

Factor investing

   ▶ Youssef LOURAOUI Factor Investing

   ▶ Youssef LOURAOUI Origin of factor investing

   ▶ Youssef LOURAOUI Smart beta 1.0

   ▶ Youssef LOURAOUI Smart beta 2.0

Factors

   ▶ Youssef LOURAOUI Size Factor

   ▶ Youssef LOURAOUI Value Factor

   ▶ Youssef LOURAOUI Yield Factor

   ▶ Youssef LOURAOUI Momentum Factor

   ▶ Youssef LOURAOUI Quality Factor

   ▶ Youssef LOURAOUI Growth Factor

   ▶ Youssef LOURAOUI Minimum Volatility Factor

Useful resources

Business analysis

MSCI Factor Research, 2021.MSCI Factor Indexes

MSCI Factor Research, 2021. MSCI Factor Classification Standards (FaCS)

About the author

The article was written in October 2021 by Youssef LOURAOUI (ESSEC Business School, Global Bachelor of Business Administration, 2017-2021).

Carbon Disclosure Rating

Carbon Disclosure Rating

Anant Jain

In this article, Anant JAIN (ESSEC Business School, Grande Ecole Program – Master in Management, 2019-2022) talks about Carbon Disclosure Rating.

Introduction

Carbon disclosure rating (CDR) is a medium to measure the environment sustainability of a company. It is calculated based on the voluntarily disclosure by a company itself. This rating is useful for an ethical investor who wish to incorporate environmental, social, and governance (ESG) factors into their investment decision making process. It focuses on the environmental factor.

Environmental, social, and governance (ESG) criteria constitute a framework that helps socially conscious investors to screen potential investments which incorporate their personal values/agendas. The ESG criteria screen companies based on sound environmental practices, healthy social responsibilities and moral governance initiatives into their corporate policies and daily operations.

The most commonly used carbon disclosure rating is administered by Carbon Disclosure Project (CDP), a United Kingdom based non-profit organization. It is comparable with Global Reporting Initiative (GRI) which is a Netherlands based organization. GRI works with businesses and organizations while CDP works with individual companies.

Framework of Carbon Disclosure Rating

Carbon Disclosure Rating is calculated by a general framework based on questionnaire generated by CDP. About 6,800 companies, which participated as of year 2020, usually submit responses to a series of industry specific questions depending on the industry of a specific company. The responses are then evaluated, analyzed, and graded. They are finally made accessible to institutional investors and other interested parties as well.

The grading separate companies based on their comprehension and application of climate-related changes. The grading mention below is stated from CDP.

Figure 1. Carbon Disclosure Project (CDP) Scoring Board.
Carbon disclosure rating table
Source: Carbon Disclosure Project (CDP) .

A and A- | Leadership level
B and B- | Management level
C and C- | Awareness level
D and D- | Disclosure level
F | Failure to provide sufficient information to be evaluated

CDP then publishes a list of most favorable companies that were graded at “Leadership Level A and A-”. In the year 2020, 313 companies were features on the list. Majority of those companies were large multinational corporations who are a leader in their specific industry. It included many prominent companies, such as Ford Motor Company, Apple, Bank of America, Johnson & Johnson, and Walmart.

Benefits of CDR

There is a constant increasing demand for environmental disclosure due to rise in ethical investing. As a result, there are numerous tangible benefits gained by a company when it discloses the requested informed asked by the CDP. They are as follows:

  • Improve and protect a company’s reputation as it builds confidence via transparency and concern for environment
  • Helps gain a competitive edge while performing on the stock market
  • More preparedness for mandatory environmental reporting regulations
  • Discover new opportunities and mitigate potential risks by identifying emerging environmental risks and opportunities which might have been overlooked otherwise
  • Assessing and tracking progress in comparison to the competition in the same industry

Criticism

The biggest criticism of carbon disclosure rating is that the score does not reflect an honest depiction of the actions taken by a company to alleviate its impact on climate change or reduce its carbon footprint. It may simply reflect a that a company didn’t disclose information with CDP. For instance, Amazon in the year 2020 was given a score “F” by CDP because it did not respond to CDP’s request for information.

Therefore, an “F” score may simply mean that a company failed to provide enough information to receive an evaluation. It does not necessarily mean that company’s inability to reduce its carbon footprint. As a result, CDP’s rating is termed to be inconclusive since many companies do not provide information to CDP on thier actions to reduce their carbon footprint and actions to limit their impact on climate change.

Related posts on the SimTrade blog

Useful resources

Carbon Disclosure Project (CDP)

Global Reporting Initiative (GRI)

About the author

The article was written in October 2021 by Anant JAIN (ESSEC Business School, Grande Ecole Program – Master in Management, 2019-2022).