

In this article, Raphaël ROERO DE CORTANZE (ESSEC Business School, Grande Ecole Program – Master in Management, 2019-2022) explains the financial concept of internal rate of return (IRR).
What is the Internal Rate of Return?
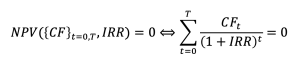
The Internal Rate of Return (IRR or “TRI” – “taux de rendement interne” in French) of a sequence of cash flows is the discount rate that makes the Net Present Value (NPV or “VNP” or “VAN” for “valeur nette présente” or “valeur actuelle nette” in French) of this sequence of cash flows equal to zero.
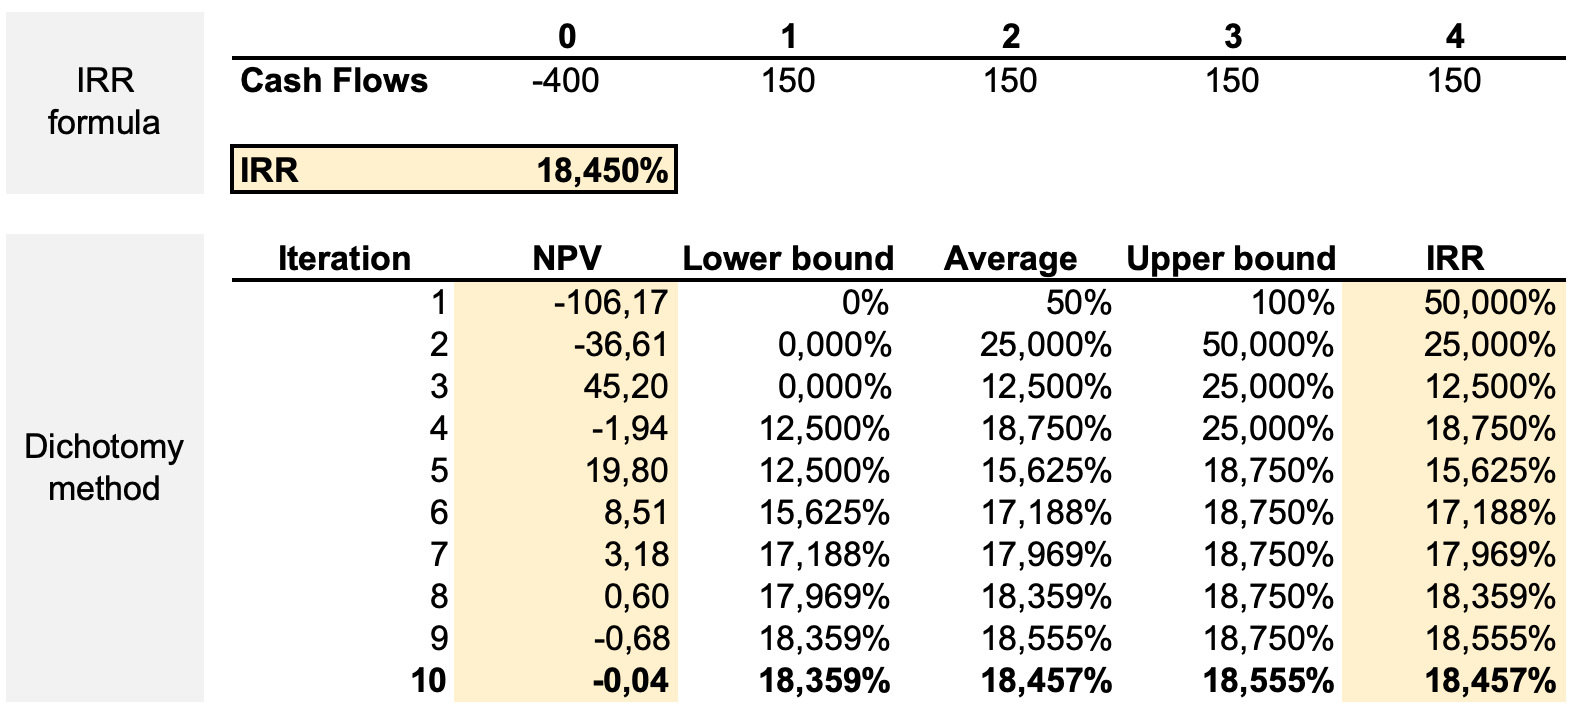
In order to calculate the IRR, two methods can be used. First of all, use the Excel “IRR” formula on the sequence of cash flows, which will automatically display an approximate value for the IRR. Nonetheless, if Excel is not available for performing the IRR calculation, you can use the dichotomy method (which is indeed used by Excel). The dichotomy method uses several iterations to determine an approximation of the IRR. The more iterations are performed, the more accurate the final IRR output is. For each iteration, the table below assesses whether the NPV using the “Average” discount rate is positive or negative. If it is negative (resp. positive), it means the IRR is somewhere in between the “Lower bound” (resp. “Upper bound” and the “Average”) and the next iteration will thus keep the same “Lower bound” (resp. use the “Average” as the new lower bound) and use the “Average” as the new “Upper bound” (resp. keep the same “Upper bound”). After 10 iterations, the table displays an IRR of 18,457%, which is an approximation to the nearest hundredth of the 18,450% IRR calculated with the Excel formula.
The IRR criterion
In the same way as the NPV, the IRR can be used to evaluate the financial performance of:
A tangible investment: the IRR criterion can be used to evaluate which investment project will be the most profitable. For instance, if a firm hesitating between Project A (buying a new machine), Project B (upgrading the existing machine) and Project C (outsourcing a fraction of the production), the firm can calculate the IRR of each project and compare them.
A financial investment: whether it is a bank investment or a private equity investment (purchase of a company) the IRR criterion can be used to sort different projects according to their financial performance.
Disaggregating the IRR
Investors and especially Private Equity firms often rely on the IRR as one measure of a project’s yield. Projects with the highest IRRs are considered the most attractive. The performance of Private Equity funds is also measured through the IRR criterion. In other words, PE firms use the IRR to select the most profitable projects and investors look at the IRR of PE funds when choosing to which PE firms’ fundraising campaign, they will participate in.
Nonetheless, IRR is the most important performance benchmark for PE investments, the IRR does not go into detail. Indeed, disaggregating the IRR can help better understand which are the different components of the IRR:
- Unlevered IRR components:
- Baseline return: the cash flows that the acquired business was expected to generate without any improvements after acquisition.
- Business performance: value creation through growth by improving the business performance, margin increase and capital efficiency improvements.
- Strategic repositioning: value creation through by increasing the opportunity for future growth and returns (innovation, market entries etc.).
- Leveraged IRR: PE investments heavily rely on high amounts or debt funding (hence the wide use of Leverage Buy-Out or LBO). Debt funding allows to resort to less equity funding, thus mechanically increasing the IRR of the investment.
Each of these components can have different proportions in the IRR. As an example, we can consider two PE funds A and B displaying the same IRR of 30%. After disaggregating each fund’s IRR, we come up with the following table, showing the weight of each IRR component in the total IRR (or “Levered IRR”). From this table, we understand that Fund A and Fund B have very different strategies. Fund A focuses in its PE operations on improving the business performance and carrying out strategic repositioning’s. Only 23% of the total IRR comes from financial engineering. In contrast, Fund B draws most of its performance from financial engineering, while only 23% of the total IRR comes from the unlevered IRR.
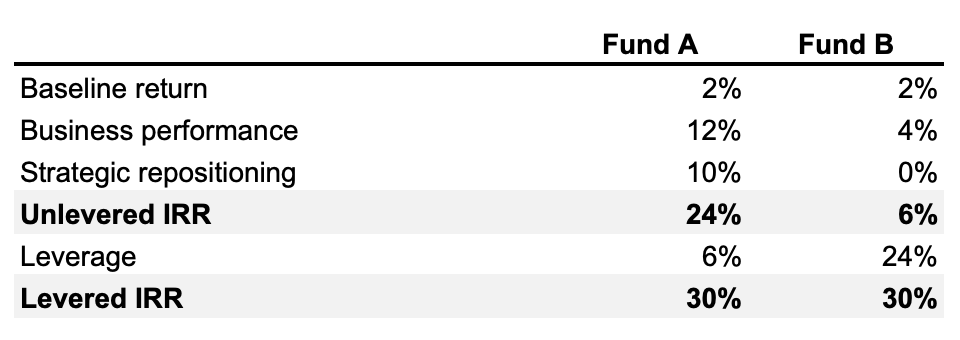
Through this example we understand that PE funds and firms can have very different strategies, while disclosing the same IRR. Thus, disaggregating the IRR can reveal the positioning of PE funds. Finally, disaggregating the IRR also allows to assess whether PE funds are true to the strategy they display: for instance, a fund can be specialized in strategic repositioning and business performance improvements on the paper, but drawing most of its value creation through financial engineering.
Related posts on the SimTrade blog
▶ Jérémy PAULEN The IRR function in Excel
▶ Léopoldine FOUQUES The IRR, XIRR and MIRR functions in Excel
▶ William LONGIN How to compute the present value of an asset?
▶ Maite CARNICERO MARTINEZ How to compute the net present value of an investment in Excel
▶ Sébastien PIAT Simple interest rate and compound interest rate
Useful resources
Prof. Longin’s website Calcul de la VNP et du TRI d’une séquence de flux (in French)
Prof. Longin’s website Méthode de dichotomie pour le calcul du TRI (in French)
McKinsey A better way to understand internal rate of return
About the author
Article written in June 2021 by Raphaël ROERO DE CORTANZE (ESSEC Business School, Grande Ecole Program – Master in Management, 2019-2022).