In this article, Nithisha CHALLA (ESSEC Business School, Grande Ecole Program – Master in Management (MiM), 2021-2024) delves into the top five companies in the luxury sector by market capitalization and provides information into their origins, latest announcements, and notable developments to provide financial professionals and students with actionable insights.
Introduction: The State of the Global Luxury Market
The global luxury goods market, a sector synonymous with exclusivity, craftsmanship, and enduring value, stands at a pivotal juncture. Characterized by its resilience and deep connection to global wealth dynamics, the market reached a valuation of approximately USD 346.19 billion in 2024. Projections indicate a robust growth trajectory, with forecasts anticipating the market will expand at a Compound Annual Growth Rate (CAGR) of between 4.40% and 6.5%, potentially reaching a value between USD 532.50 billion and USD 724.99 billion by 2034. This expansion is not merely a function of economic cycles but is propelled by fundamental shifts in consumer behavior, wealth distribution, and technological integration.
The industry’s leading firms are navigating this complex environment by anchoring their strategies to three core pillars: digitalization, sustainability, and brand heritage. Digital innovation, through the deployment of Artificial Intelligence (AI) for personalization, Augmented Reality (AR) for immersive shopping, and sophisticated omnichannel retail strategies, has become a critical tool for engaging with a tech-savvy consumer base. Sustainability has transitioned from a peripheral concern to a central tenet of brand value, with consumers demanding transparency in sourcing, ethical production, and the availability of circular models such as resale and repair services. Finally, in an increasingly crowded market, the authentic heritage and unparalleled craftsmanship of a brand remain its most defensible assets, providing the narrative and quality that justify a premium price point.
This report provides a comprehensive financial and strategic analysis of the top five firms that define the global luxury sector. These titans are ranked primarily by their market capitalization, a metric that reflects the market’s collective, forward-looking assessment of a company’s brand equity, strategic positioning, and future earnings potential.
The picture below shows the world’s top 5 valuable companies by market capitalization (Companies Market Cap, August 2025).
World’s top 5 valuable companies by market capitalization in luxury industry
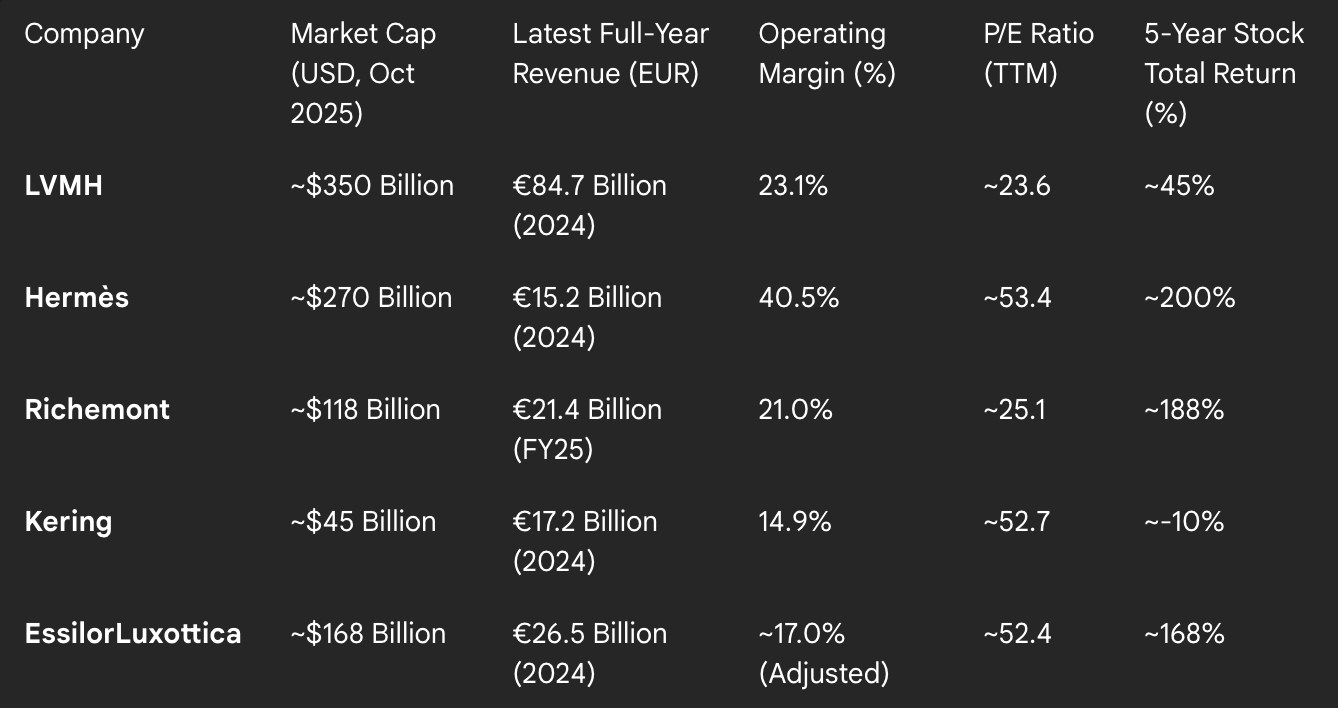
Source: Companies Market Cap.
The market capitalization, commonly called a “market cap”, is the total market value of a publicly traded company’s outstanding shares and is widely used to measure how much a company is worth. In most cases, it can be easily calculated by multiplying the share price with the amount of outstanding shares.
LVMH Moët Hennessy Louis Vuitton
LVMH Moët Hennessy Louis Vuitton SE stands as the undisputed titan of the luxury industry, a sprawling conglomerate whose scale and influence are without parallel. The modern group was formed in 1987 through the strategic merger of two iconic French entities: Moët Hennessy, itself a product of the 1971 union between champagne producer Moët & Chandon and cognac maker Hennessy, and Louis Vuitton, the legendary trunk-maker founded in 1854. Since 1989, the group has been steered by the vision of its Chairman and Chief Executive Officer, Bernard Arnault, who has meticulously transformed it into the world’s preeminent luxury powerhouse. LVMH’s core mission is to embody “The Art of Crafting Dreams,” a philosophy that guides the long-term development of its diverse portfolio while ensuring each brand’s unique identity, heritage, and expertise are meticulously preserved and nurtured.
LVMH’s primary strategic advantage lies in its decentralized “House of Brands” model. The group’s portfolio comprises over 75 distinct brands, referred to as “Maisons,” organized across six synergistic business groups: Wines & Spirits, Fashion & Leather Goods, Perfumes & Cosmetics, Watches & Jewelry, Selective Retailing, and Other Activities.
The Wines & Spirits group includes legendary names such as Dom Pérignon, Hennessy, Moët & Chandon, and Veuve Clicquot. The Fashion & Leather Goods division, the group’s largest revenue and profit driver, is home to icons like Louis Vuitton, Christian Dior, Fendi, and Celine. Perfumes & Cosmetics features powerhouses like Parfums Christian Dior, Guerlain, and the globally dominant retailer Sephora. The Watches & Jewelry segment boasts titans such as Tiffany & Co., Bulgari, TAG Heuer, and Hublot. Finally, the Selective Retailing group includes Sephora and the luxury department store Le Bon Marché, providing a powerful direct-to-consumer channel.
Logo of LVMH
Source: the company.
LVMH’s financial results underscore its dominant market position. For the fiscal year 2024, the group delivered a solid performance despite a challenging global economic environment, reporting total revenue of €84.7 billion. Profit from recurring operations stood at €19.6 billion, with a group share of net profit amounting to €12.55 billion. The Fashion & Leather Goods group was the primary contributor, generating €41.06 billion in revenue, followed by Selective Retailing at €18.26 billion.
Recent performance indicates a potential stabilization in the luxury market. In the third quarter of 2025, LVMH reported revenue of €18.28 billion ($21.25 billion), representing a 1% organic increase year-over-year that surpassed analyst expectations. This result was seen as a positive signal for the entire sector, suggesting that consumer demand may be steady after a period of normalization.
As of mid-October 2025, LVMH’s market capitalization was approximately $350 billion, cementing its status as the most valuable luxury company in the world by a significant margin. The company’s stock has delivered a 5-year total return of approximately 40-45%, reflecting its consistent growth and profitability. Key valuation metrics, such as its price-to-earnings (P/E) and price-to-sales (P/S) ratios, are closely watched by investors, and the stock maintains a broadly positive consensus among analysts, with a majority issuing “Buy” ratings.
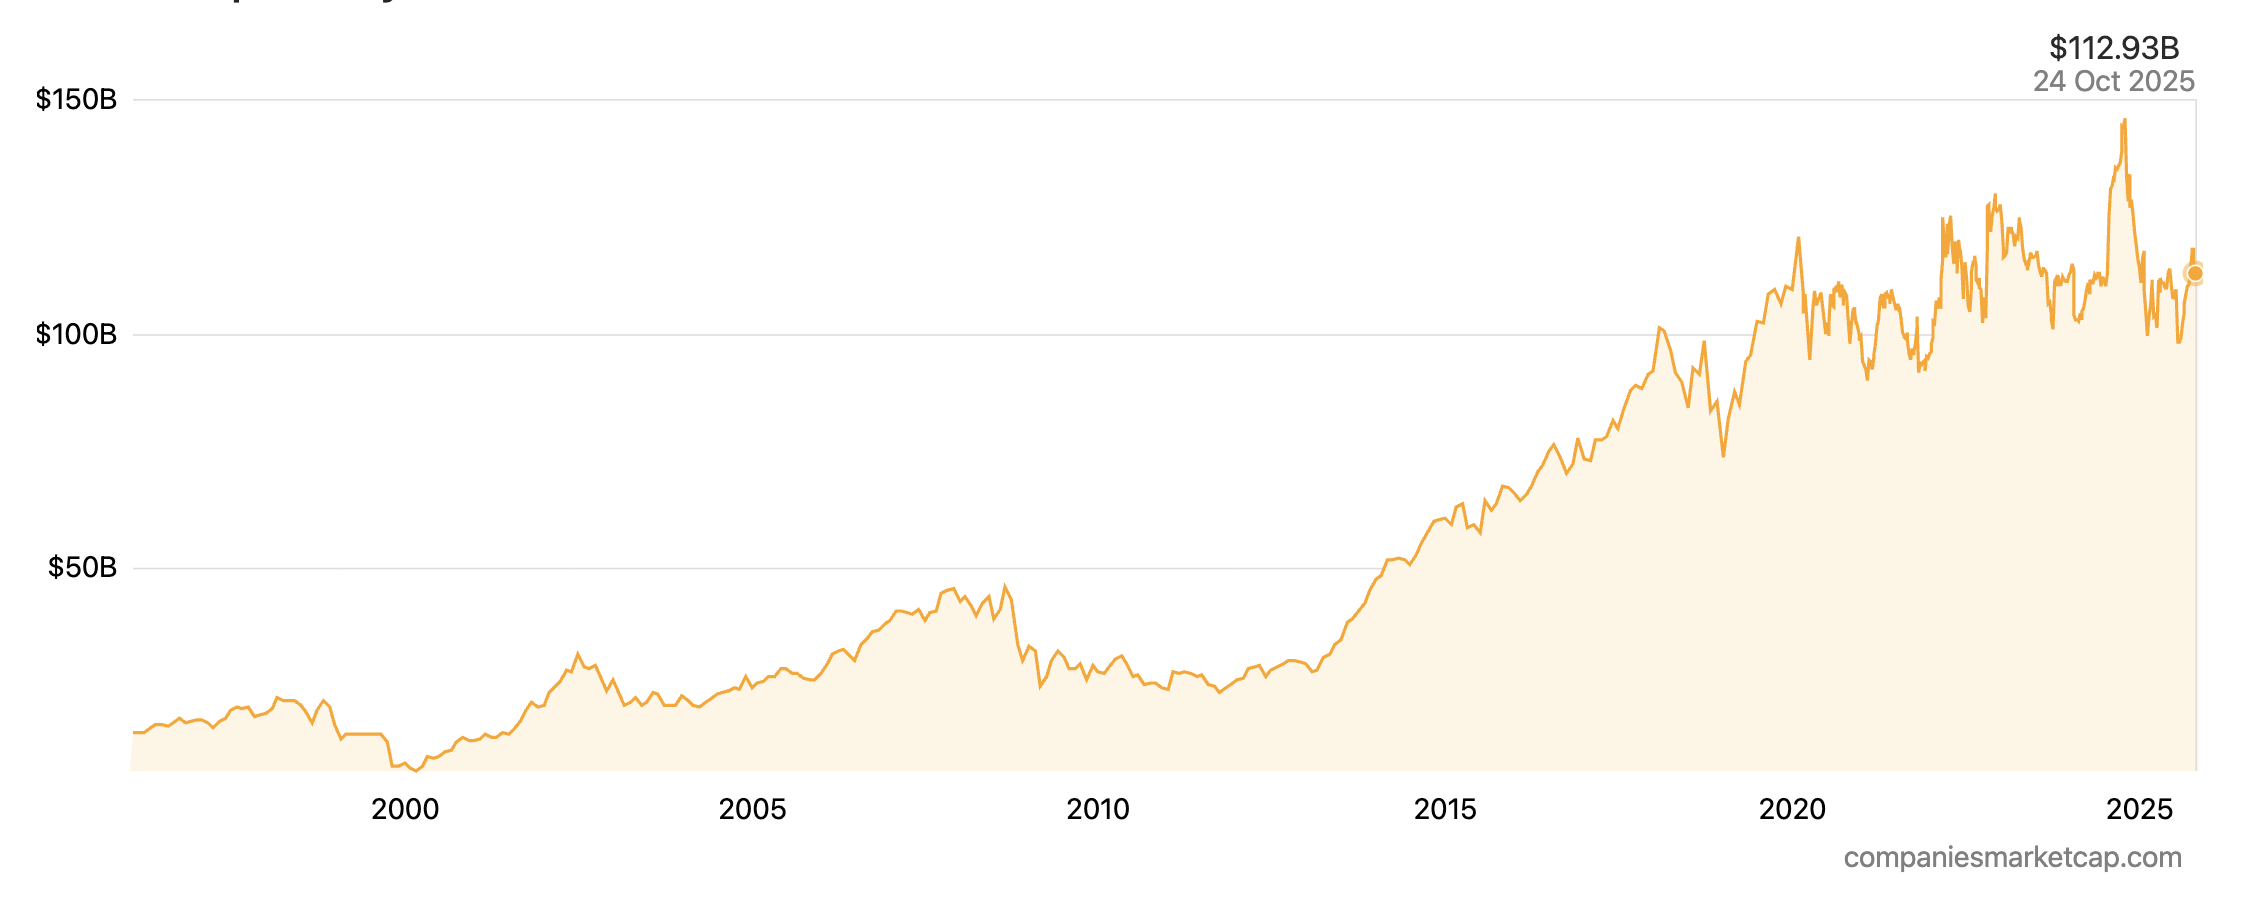
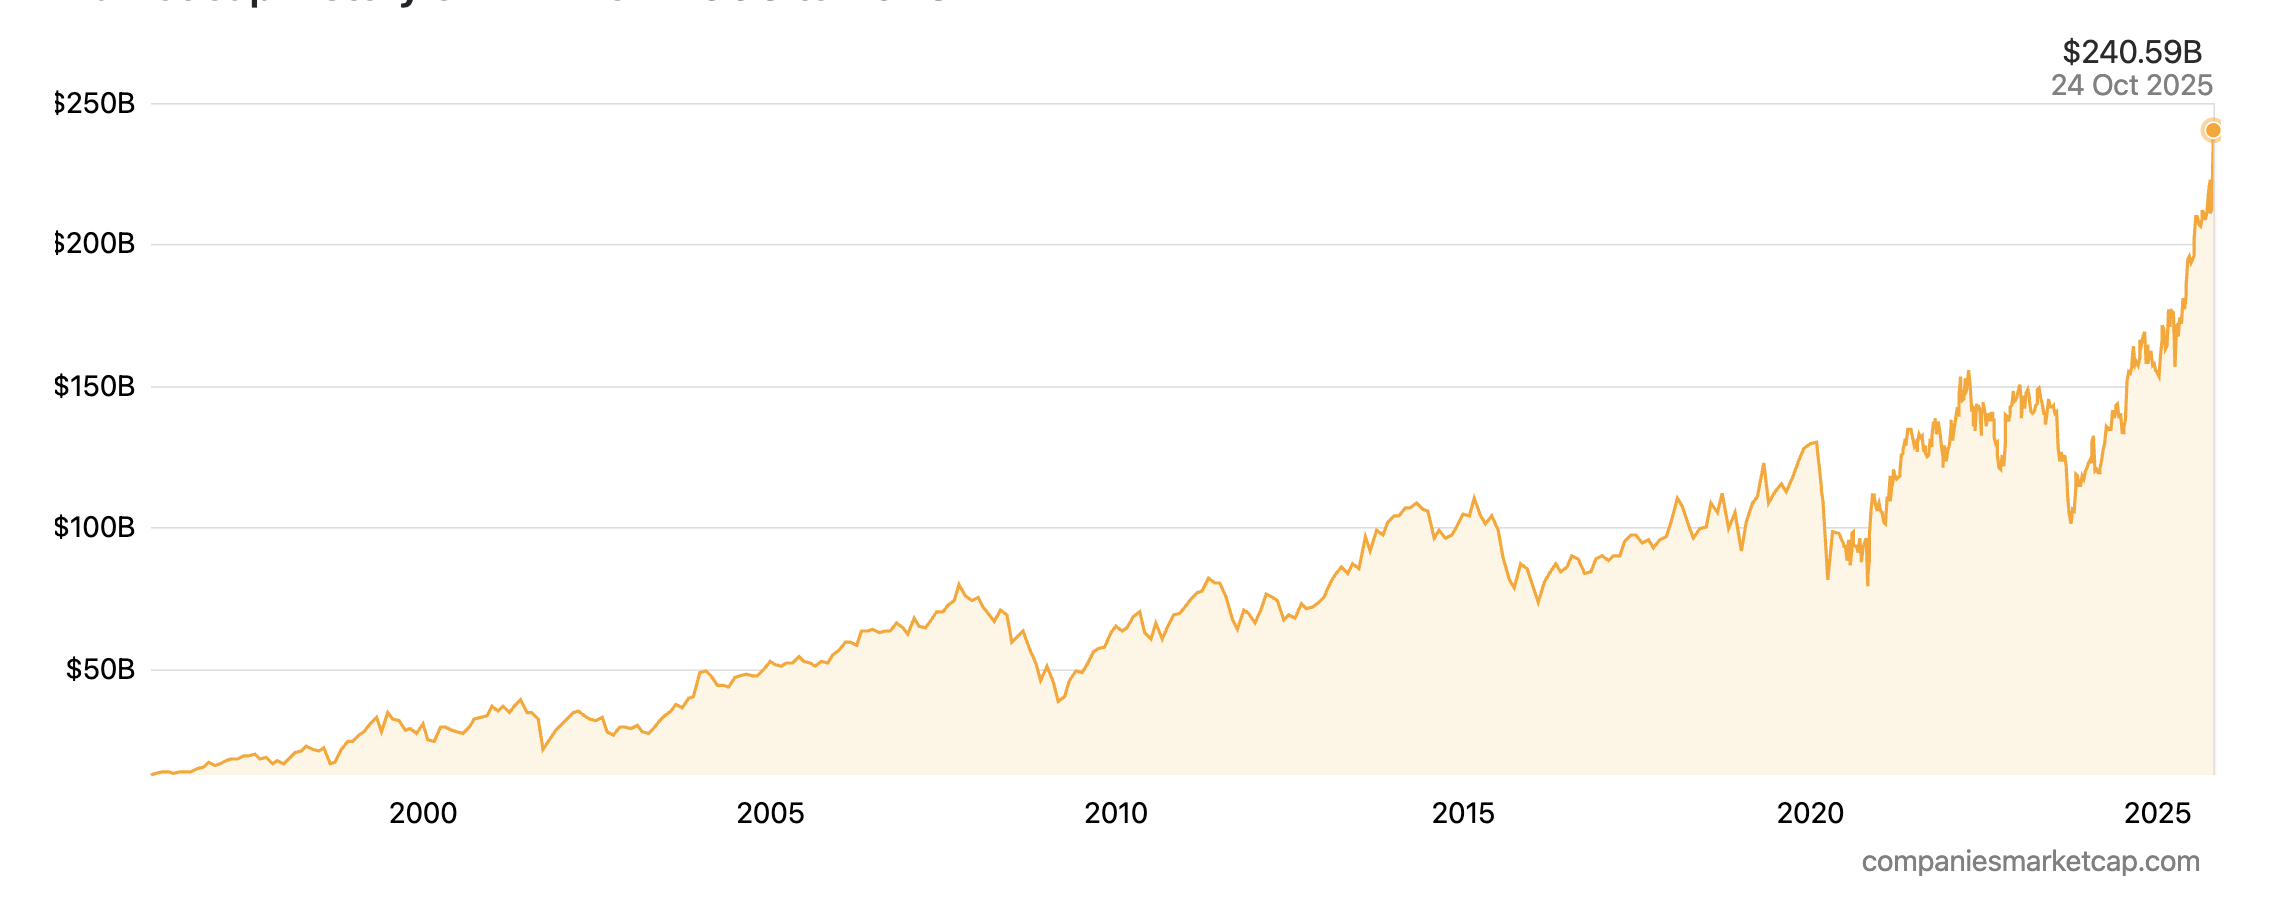
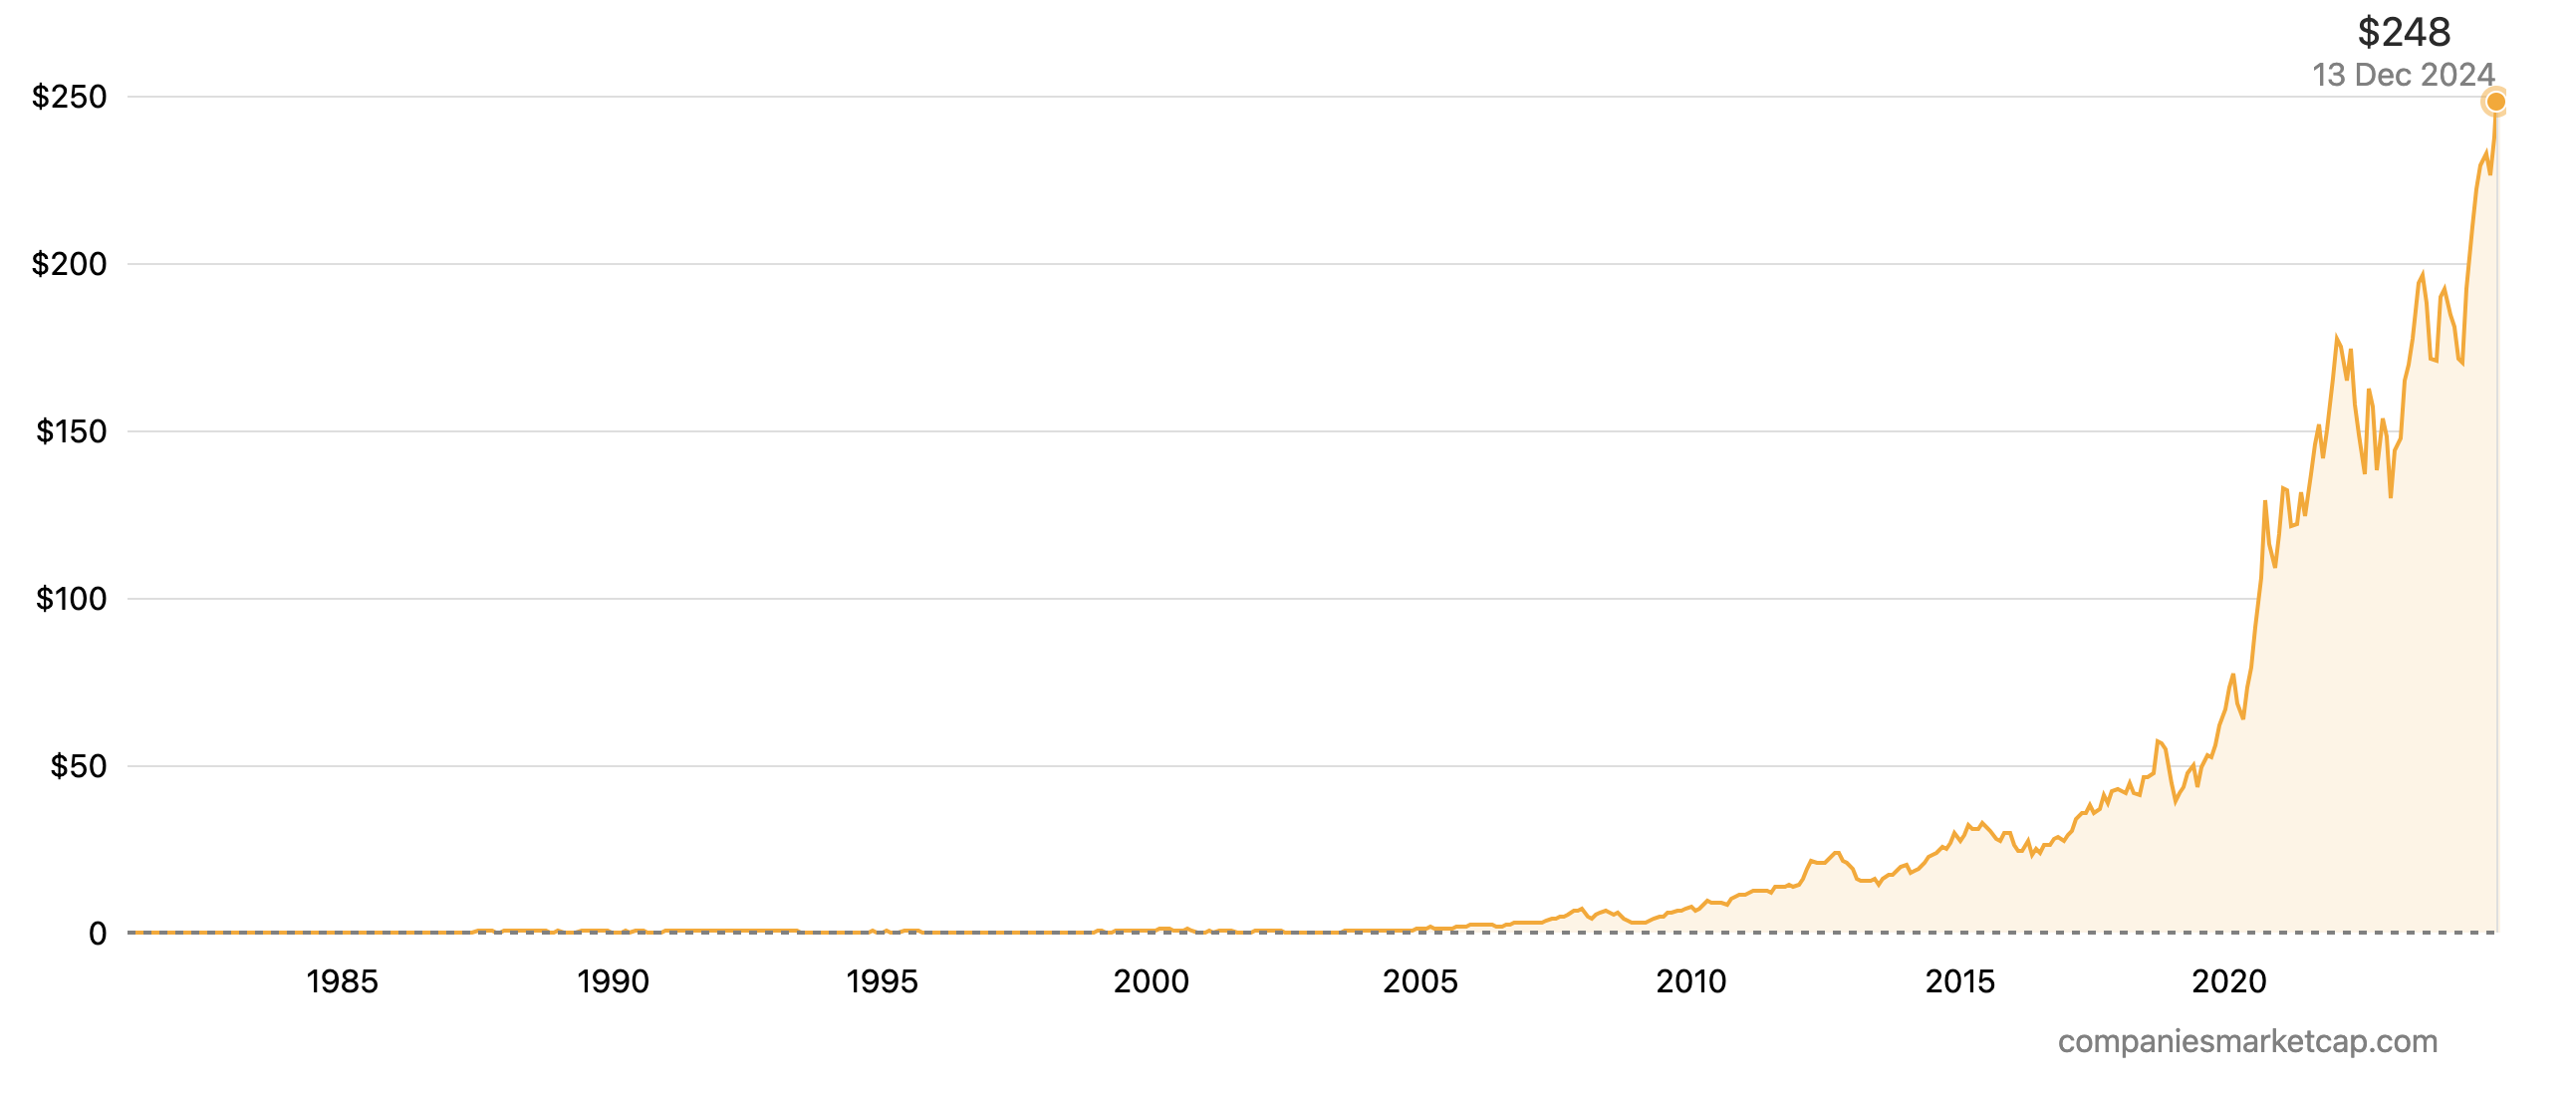
The picture below shows the market capitalization history of LVMH from 2002 to 2025.
Market cap history of LVMH from 2002 to 2025
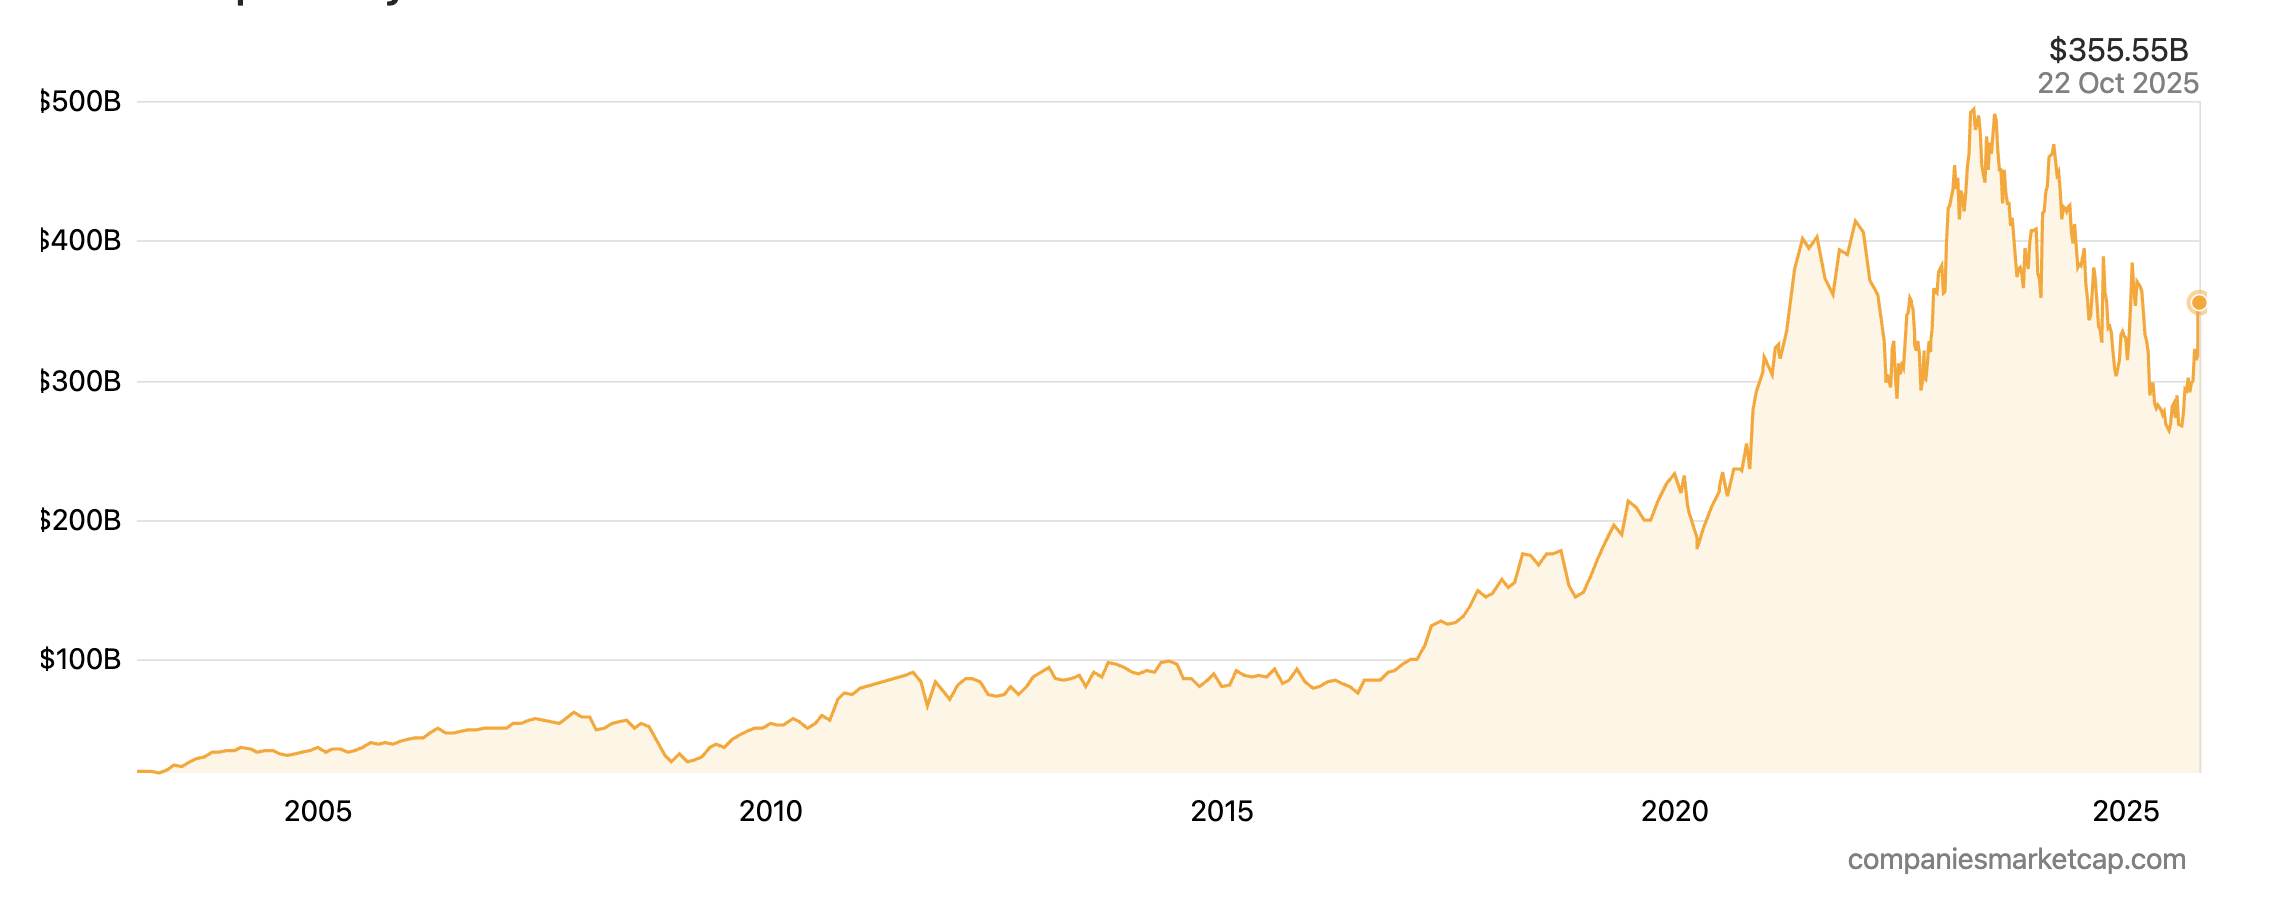
Source: Companies Market Cap.
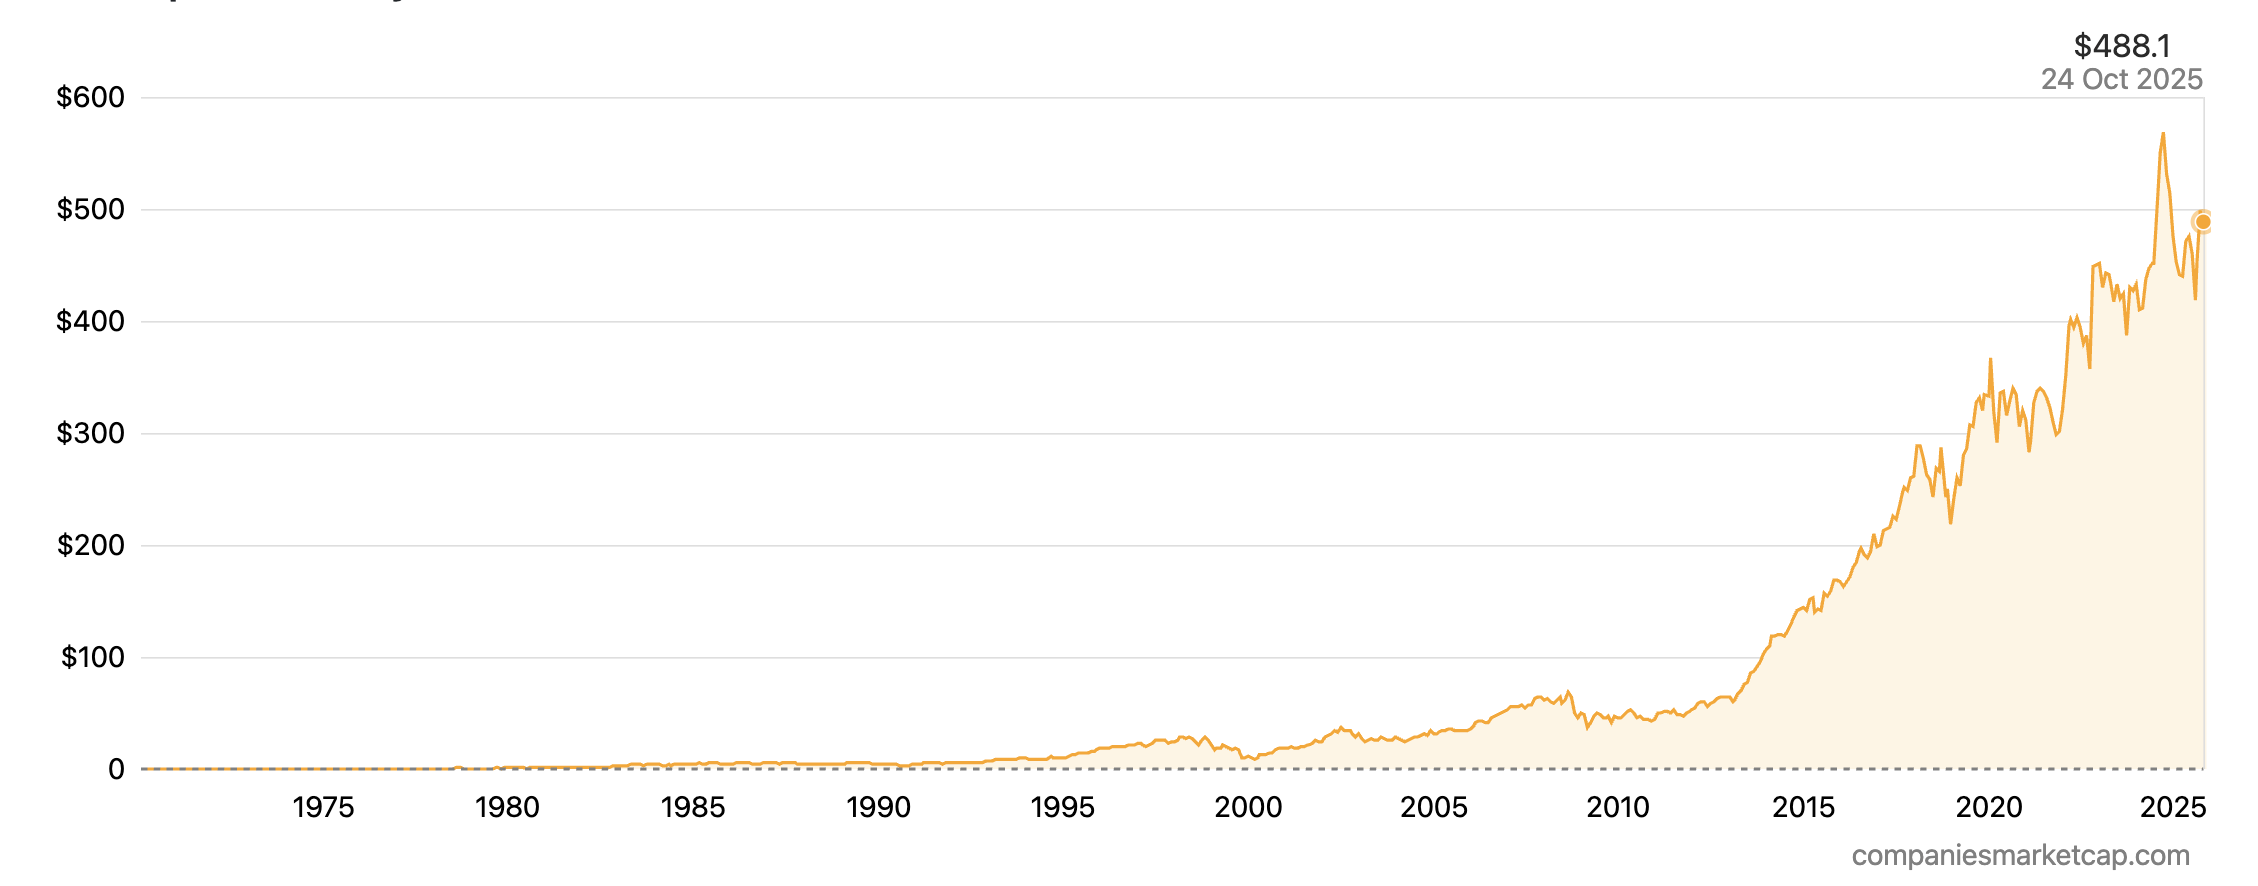
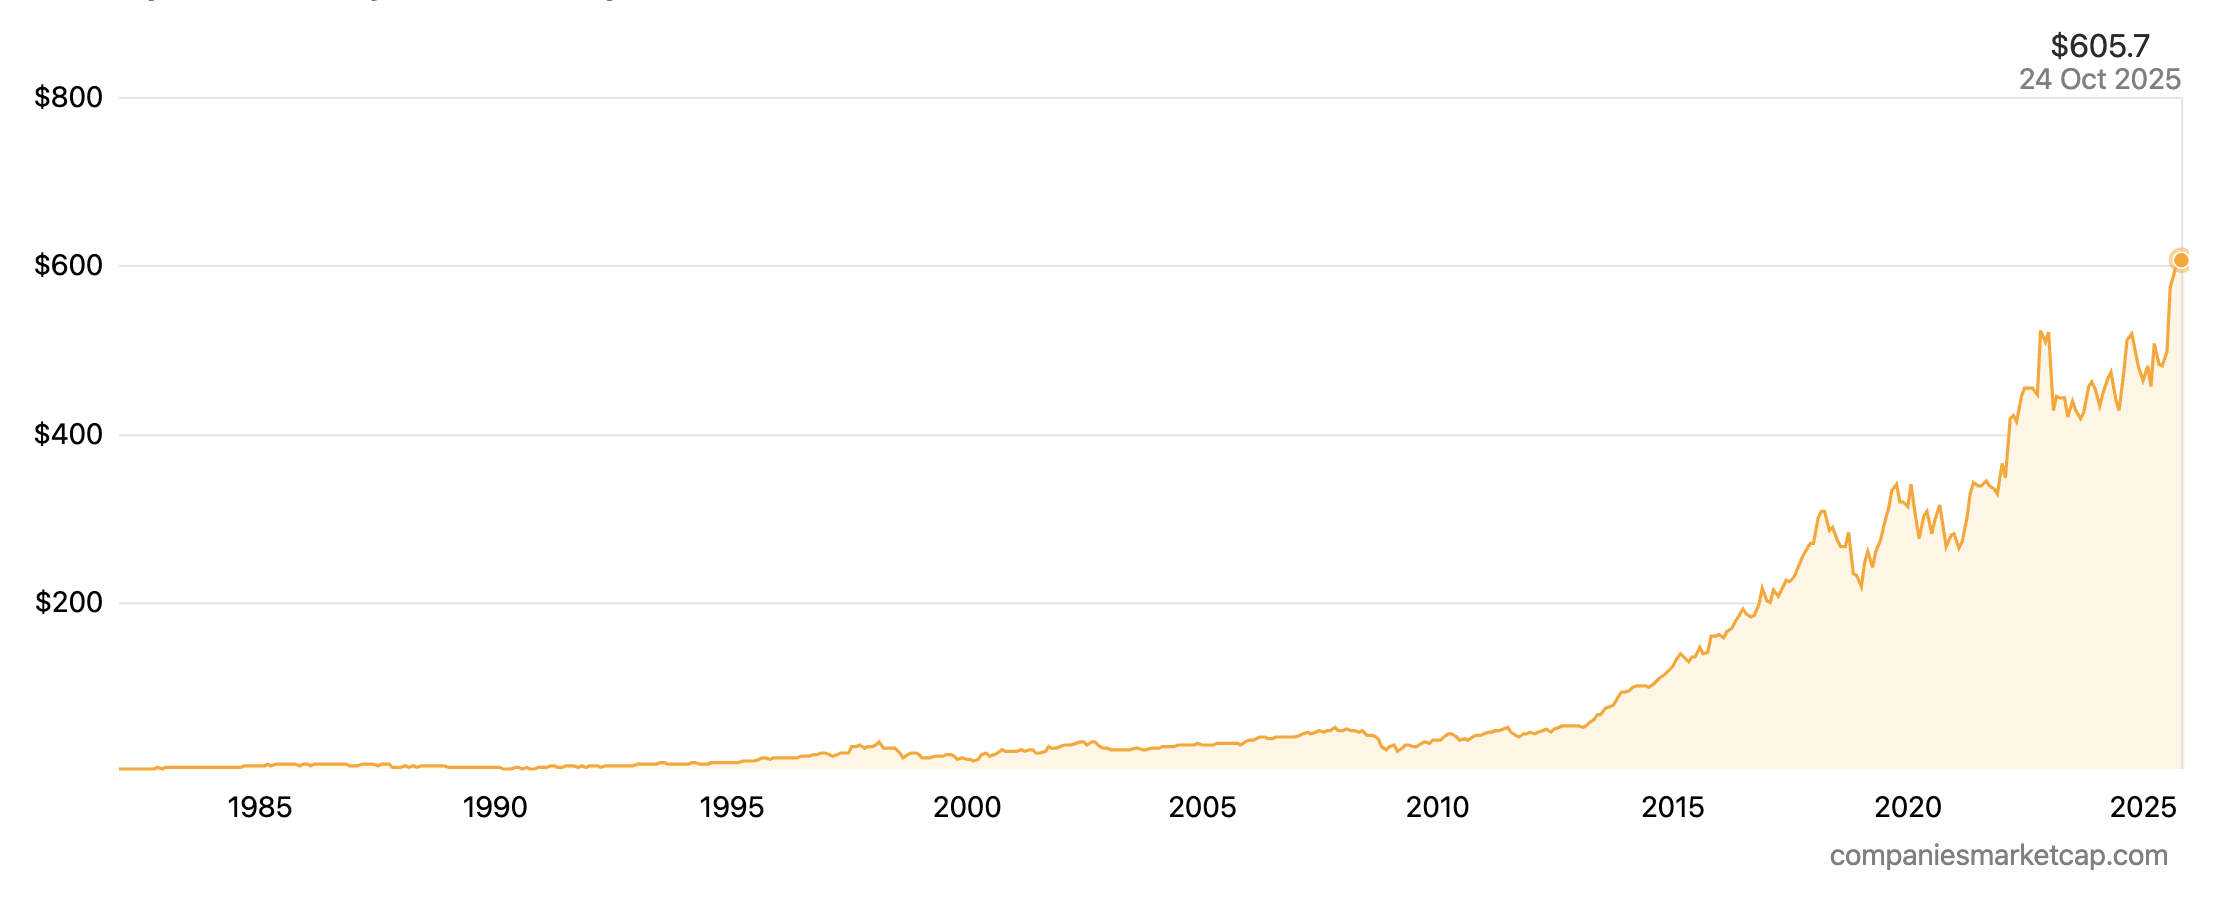
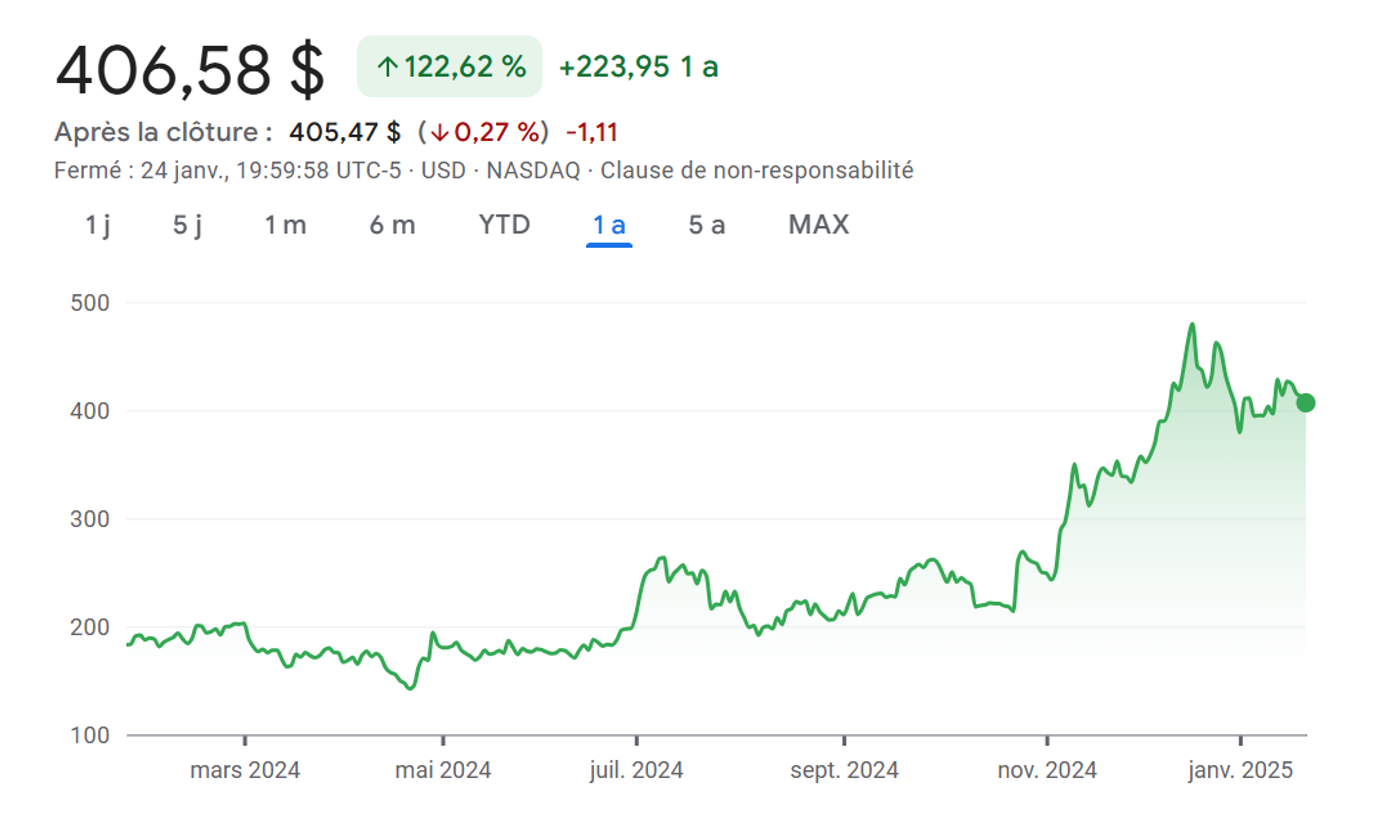
The picture below shows the stock price history of LVMH from 2000 to 2025.
Stock price history of LVMH from 2000 to 2025
Source: Companies Market Cap.
Looking forward, LVMH’s strategy is heavily focused on leveraging technology to enhance its competitive advantages. The group’s digital transformation is spearheaded by its “Omnichannel & Data” division, which aims to create a seamless and personalized customer journey across all touchpoints. Central to this effort are two key initiatives: the AI Factory and the 3D Factory.
Sustainability is another core pillar of LVMH’s long-term vision. The group’s commitments are detailed in its comprehensive 2024 Social and Environmental Responsibility Report, which outlines ambitious targets for reducing its environmental footprint, promoting circularity, and ensuring responsible sourcing across its vast supply chain. By integrating these digital and sustainability initiatives, LVMH aims not only to drive operational efficiency but also to deepen its connection with a new generation of consumers who demand both technological sophistication and corporate responsibility.
Hermès International
Hermès International represents the apex of the luxury pyramid, a brand whose name is synonymous with uncompromising quality, artisanal craftsmanship, and unparalleled exclusivity. The company’s story began in 1837, when founder Thierry Hermès established a harness-making workshop in Paris, dedicated to serving the needs of European nobility. Over six generations, the family-run business has evolved from its equestrian roots into a global symbol of high luxury, guided by a singular vision of creating timeless objects designed to be passed down through generations. Today, the company is led by Executive Chairman Axel Dumas, a sixth-generation family member who continues to uphold the house’s foundational values of creativity, quality, and long-term vision.
In stark contrast to the conglomerate strategy of LVMH, Hermès has built its empire on the power of a single, iconic brand. The company’s business model is a masterclass in managing scarcity to create extreme desirability. Rather than chasing volume, Hermès consciously limits the production of its most sought-after items, most notably the legendary Birkin and Kelly handbags. This strategy is not an artificial marketing ploy but a direct result of its commitment to craftsmanship; each bag is handcrafted by a single artisan in one of the company’s workshops in France, a process that can take many hours to complete.
This scarcity model transforms Hermès products from mere consumer goods into a distinct asset class. Data on the resale market (secondary market for luxury goods) provides compelling evidence of this phenomenon. The Hermès Constance and Picotin bags, for example, have been shown to retain 127% and 120% of their retail value (meaning that bags are more expensive on the secondary market than the primary market), respectively, while the Louis Vuitton Neverfull, another iconic bag from a different house, retains 136%. For rarer items, the appreciation is even more dramatic, with special editions like the Himalaya Birkin fetching markups of 300-500% at auction. For investors, this means that Hermès stock is valued not just on its ability to manufacture and sell goods, but on its capacity to meticulously manage and preserve the “asset value” of its core products, justifying its premium market valuation.
Logo of Hermès International
Source: the company.
Hermès’ financial performance is a direct reflection of its successful scarcity model, characterized by industry-leading profitability and consistent growth. For the fiscal year 2024, the company delivered outstanding results, with consolidated revenue reaching €15.2 billion, a remarkable increase of 15% at constant exchange rates. Recurring operating income grew to €6.2 billion, translating to a recurring operating margin of 40.5%—a figure that is the envy of the luxury sector and a testament to the brand’s immense pricing power. Growth was robust across all regions, with particularly exceptional performance in Japan (+23% at constant exchange rates) and Europe excluding France (+19%). This momentum continued into the first half of 2025, with revenues reaching €8 billion.
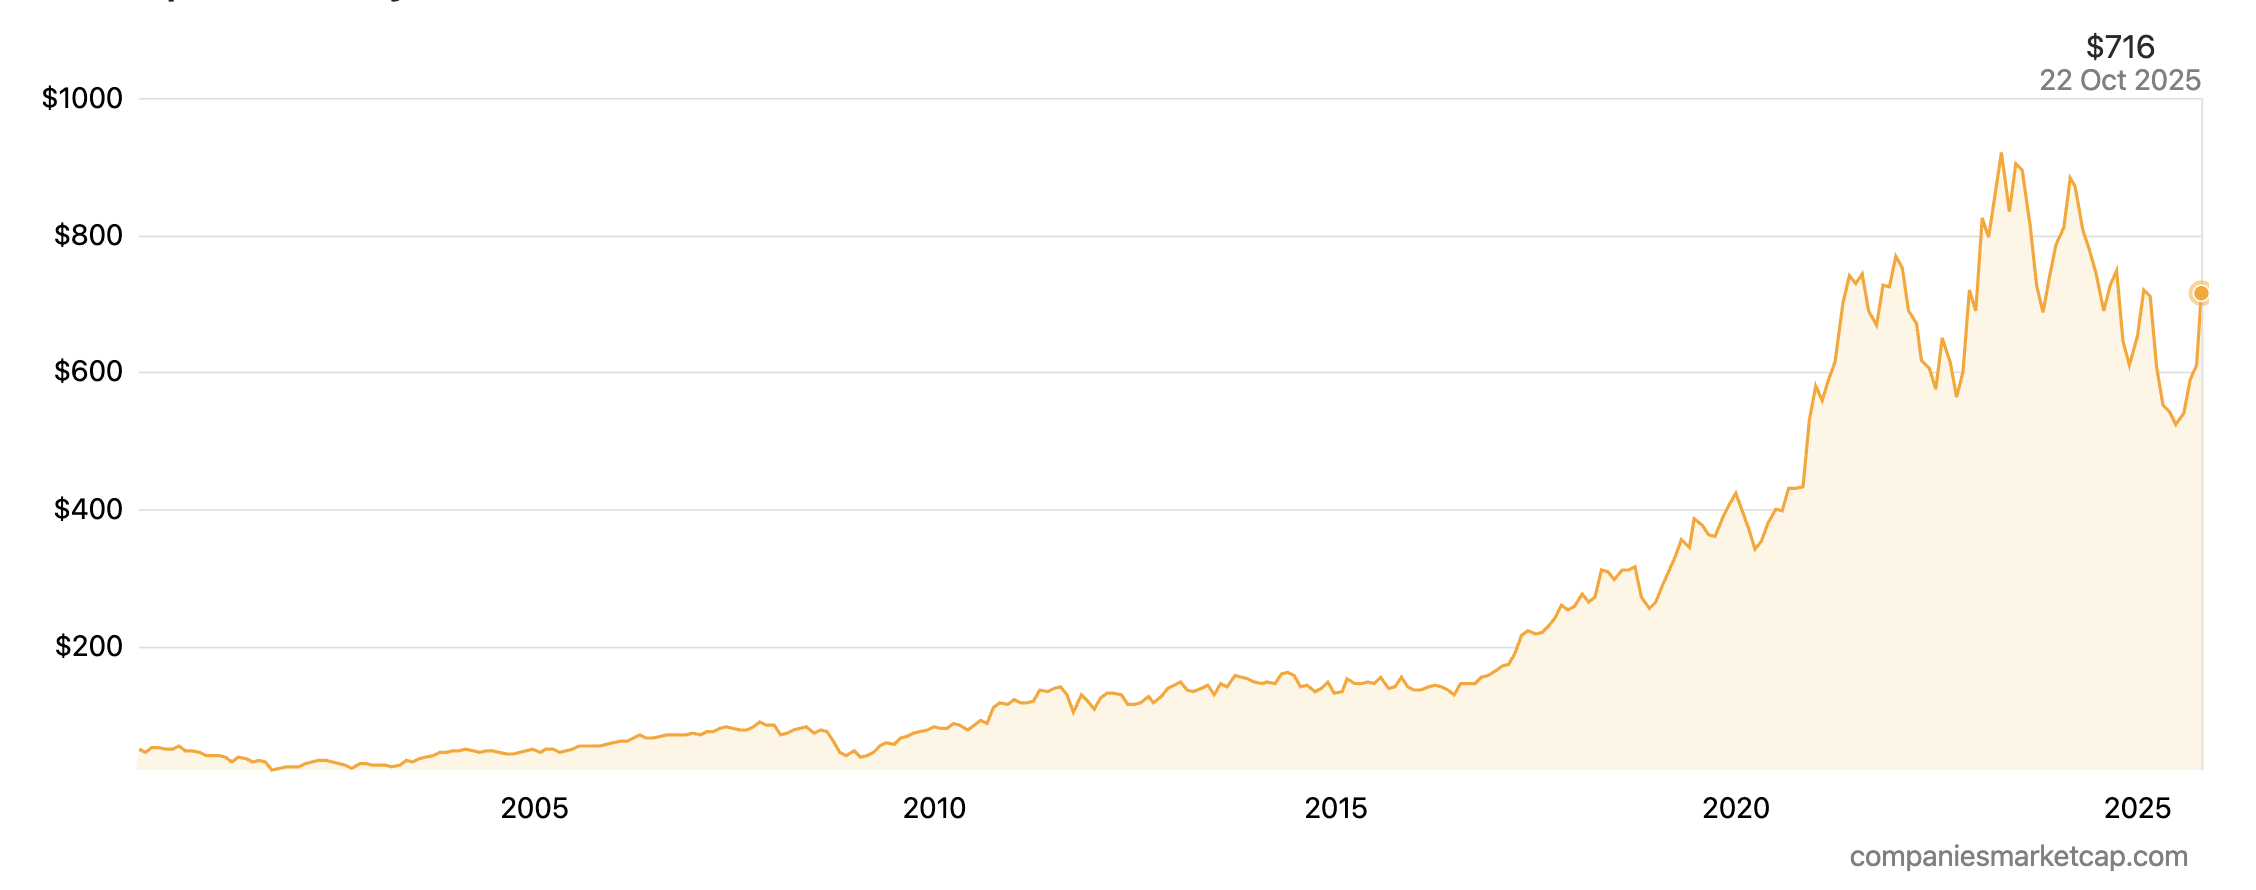
This exceptional profitability and steady growth have earned Hermès a market capitalization of approximately $270 billion as of mid-October 2025, making it the second most valuable luxury company in the world despite having revenues that are a fraction of LVMH’s.1 The stock’s performance reflects this “scarcity premium,” with a 5-year total return of approximately 200%.2 Its valuation multiples are accordingly high, with a P/E ratio often exceeding 50, as investors price in the brand’s unique and highly defensible competitive position.3 The stock maintains a generally positive, though often cautious, rating from analysts who acknowledge its quality but are wary of its high valuation.
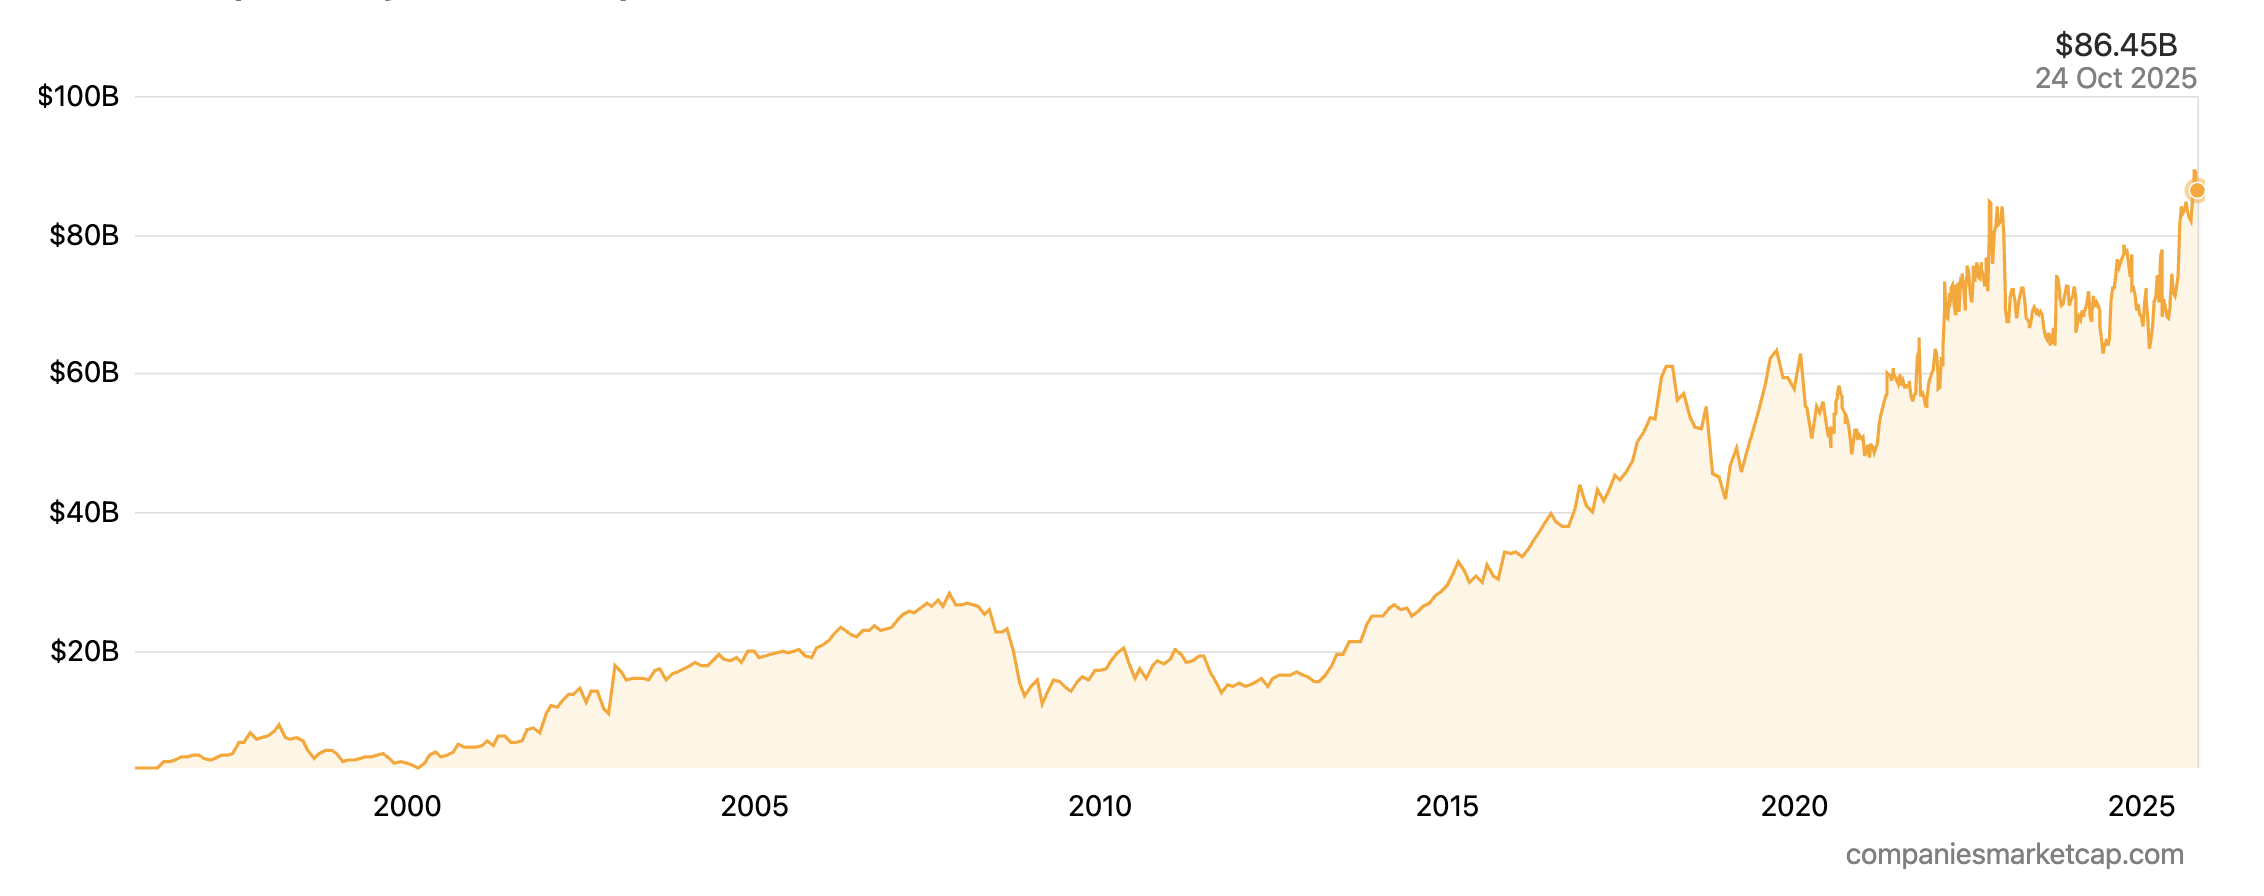
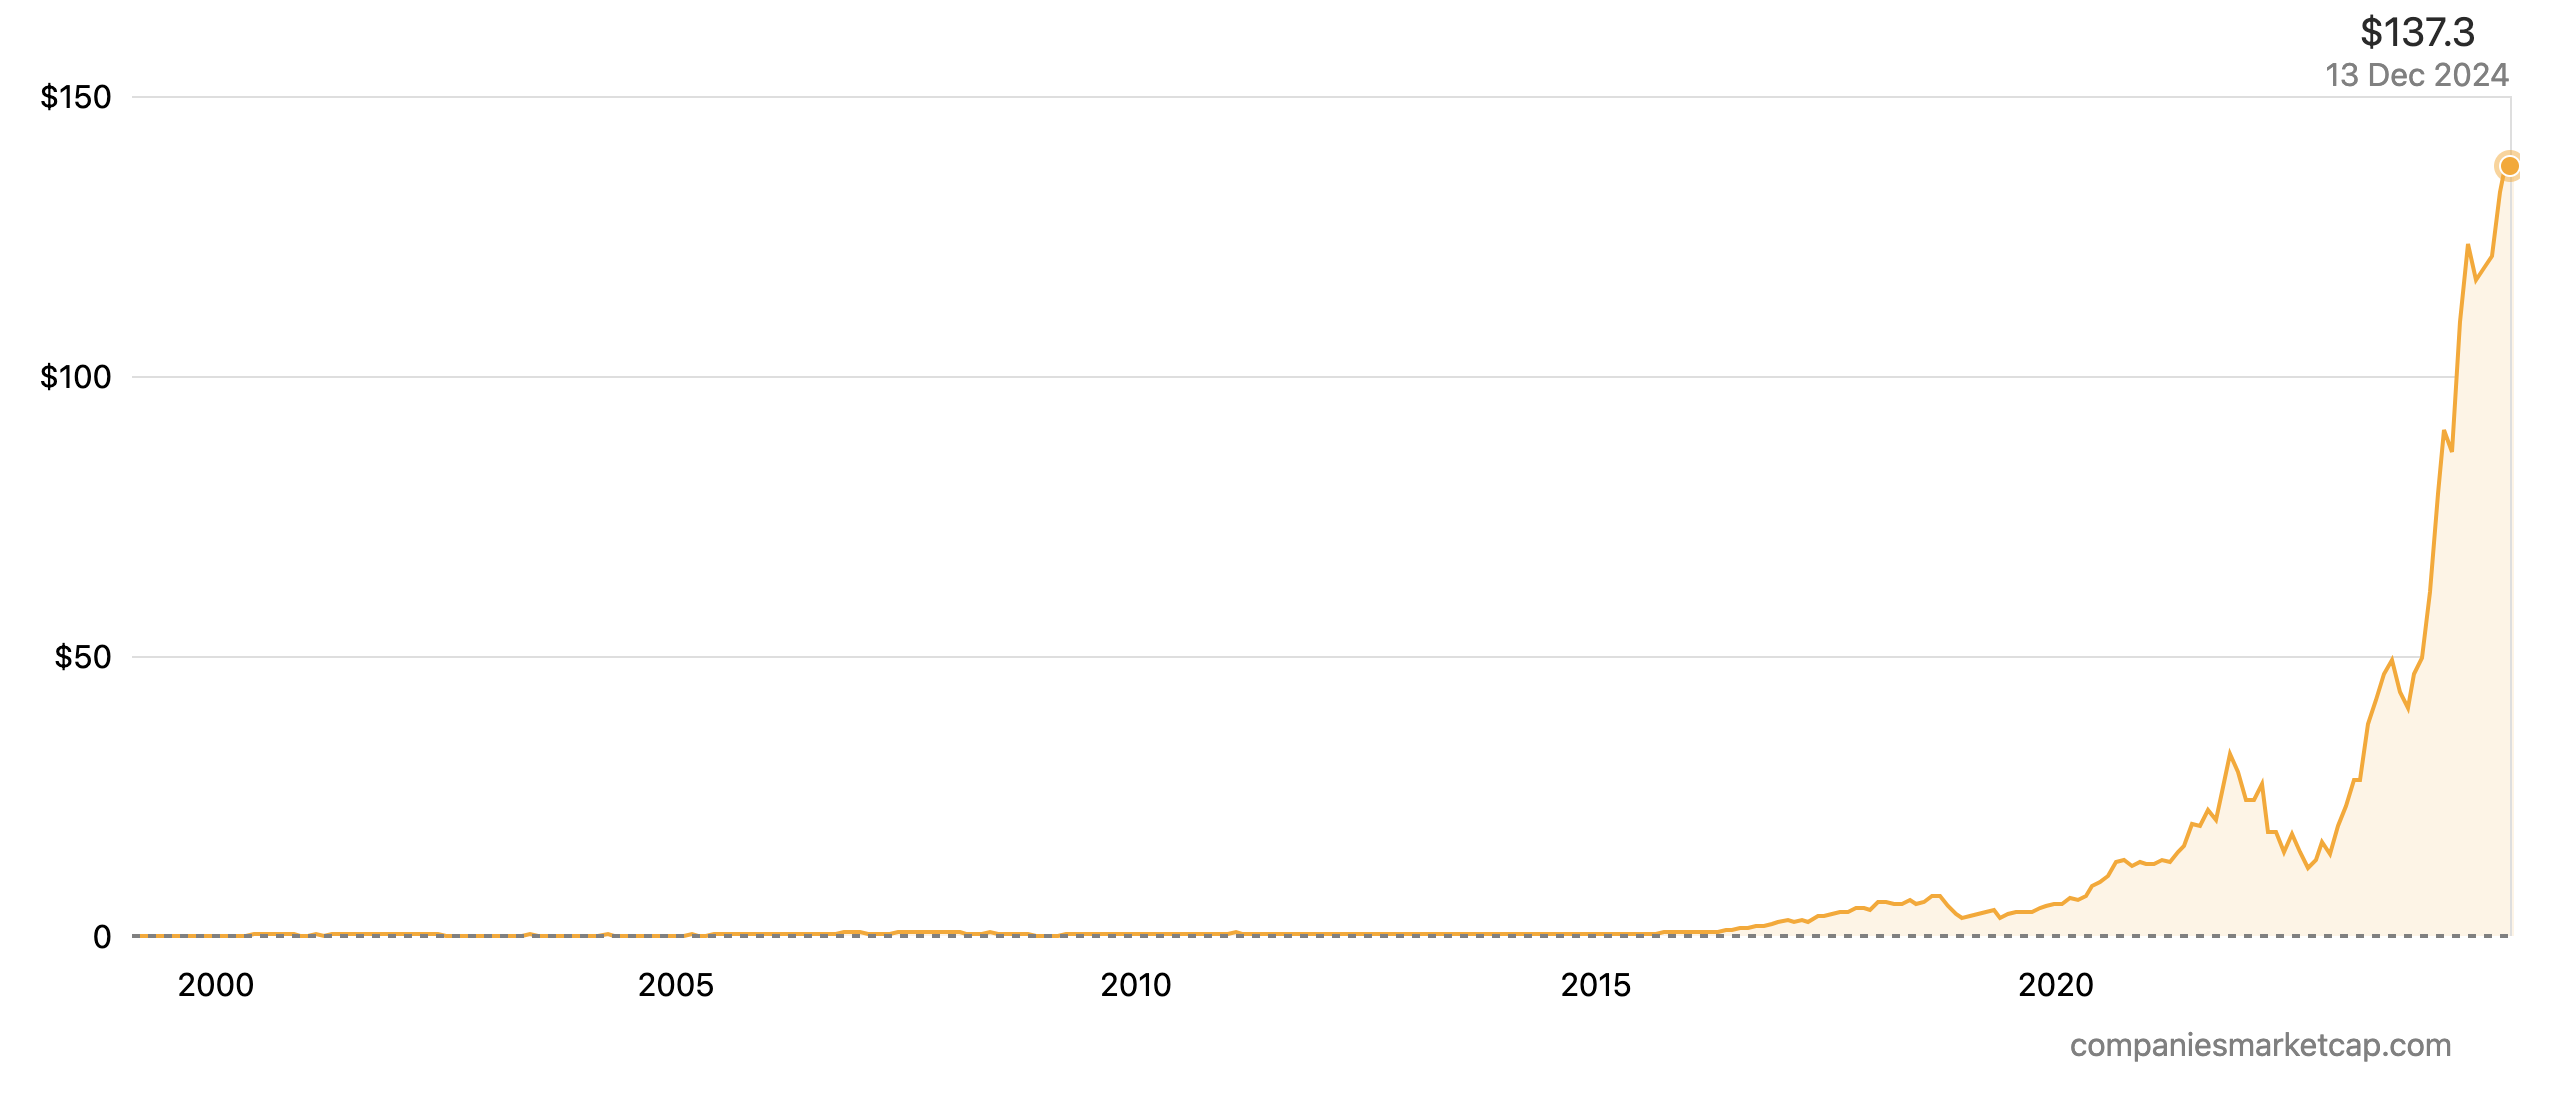
The picture below shows the market capitalization history of Hermès International from 2003 to 2025.
Market cap history of Hermès International from 2003 to 2025
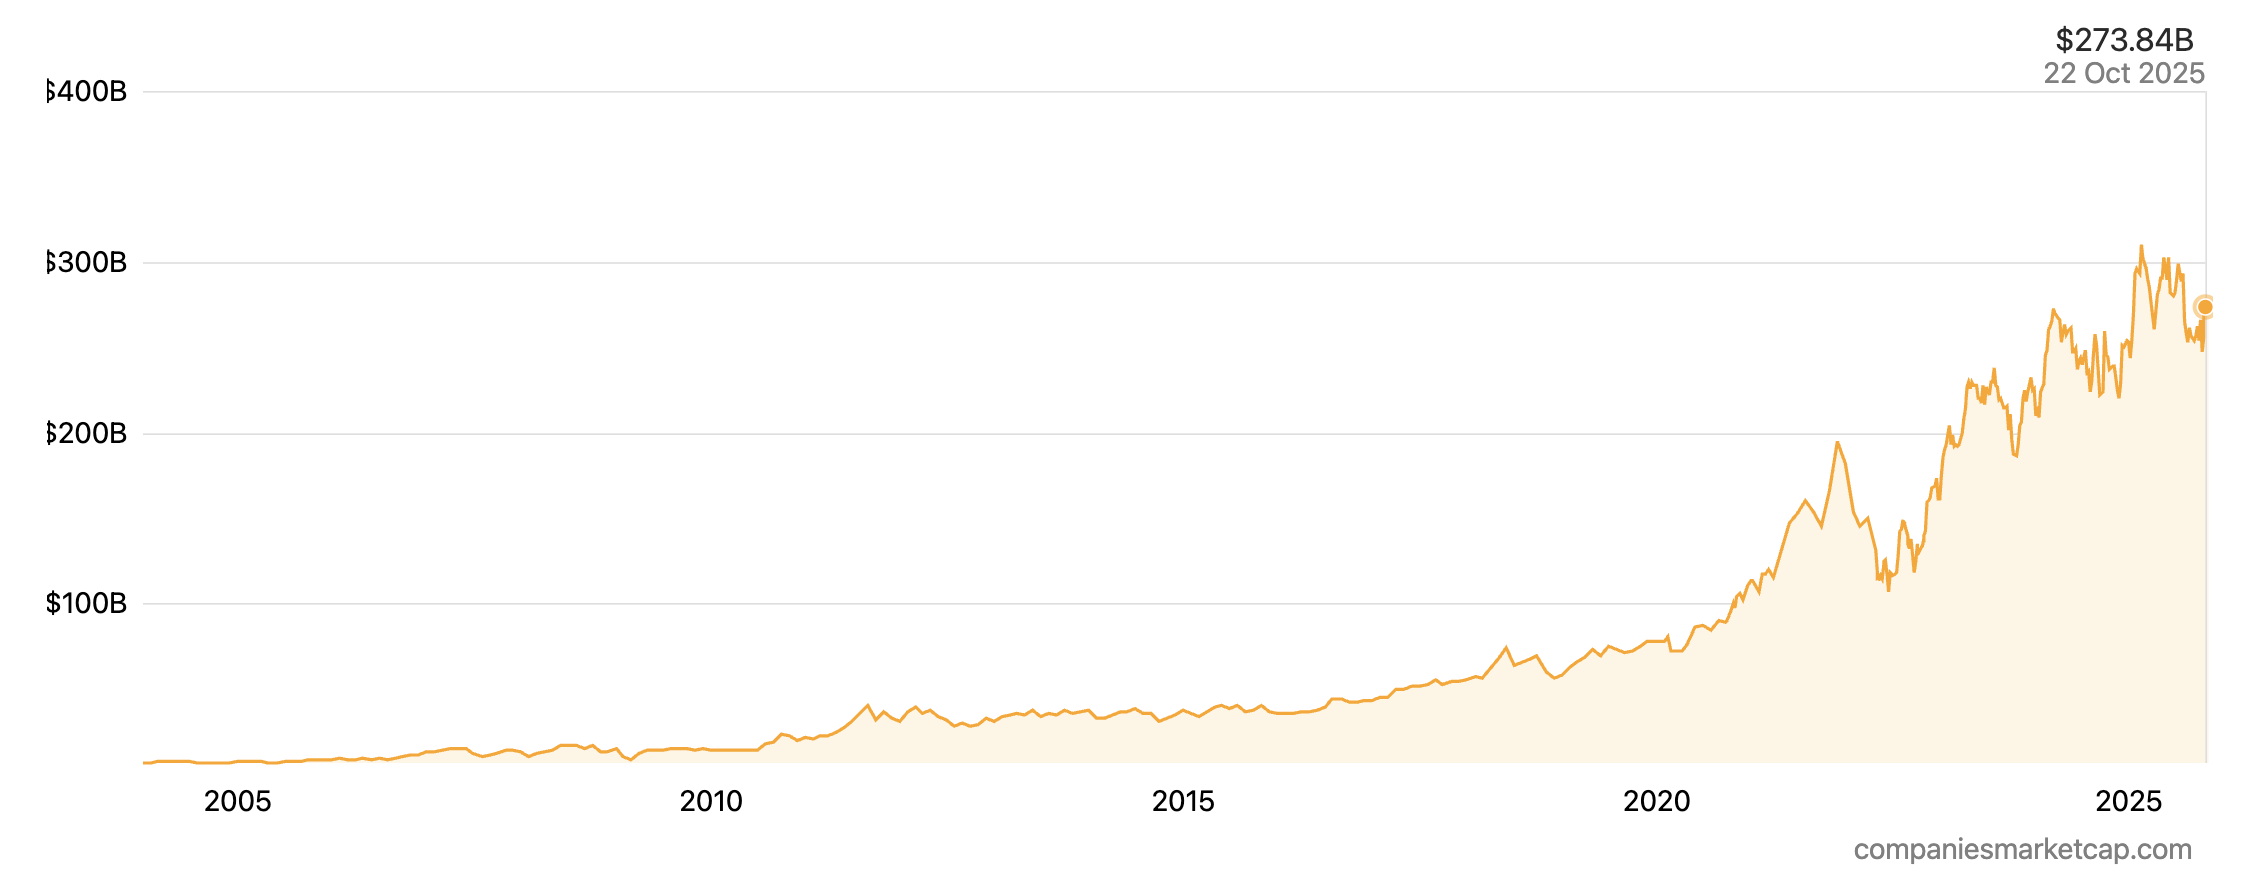
Source: Companies Market Cap.
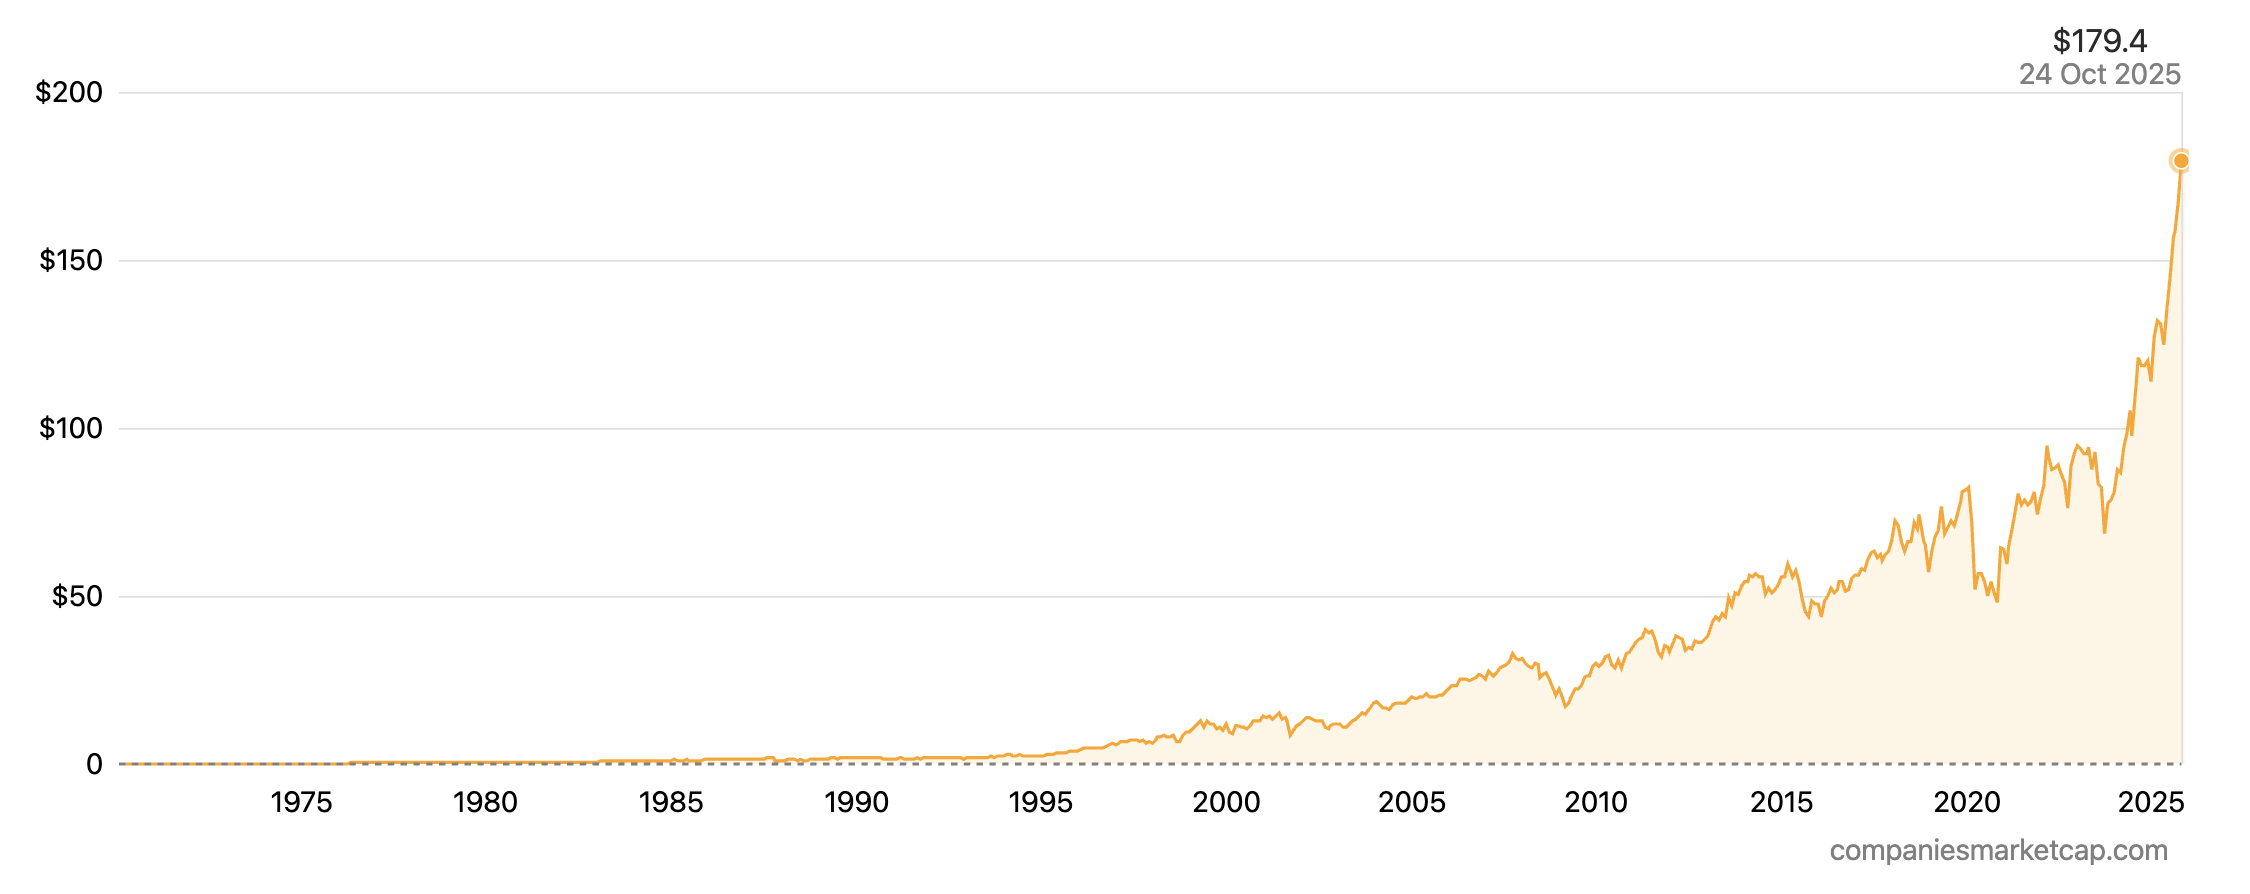
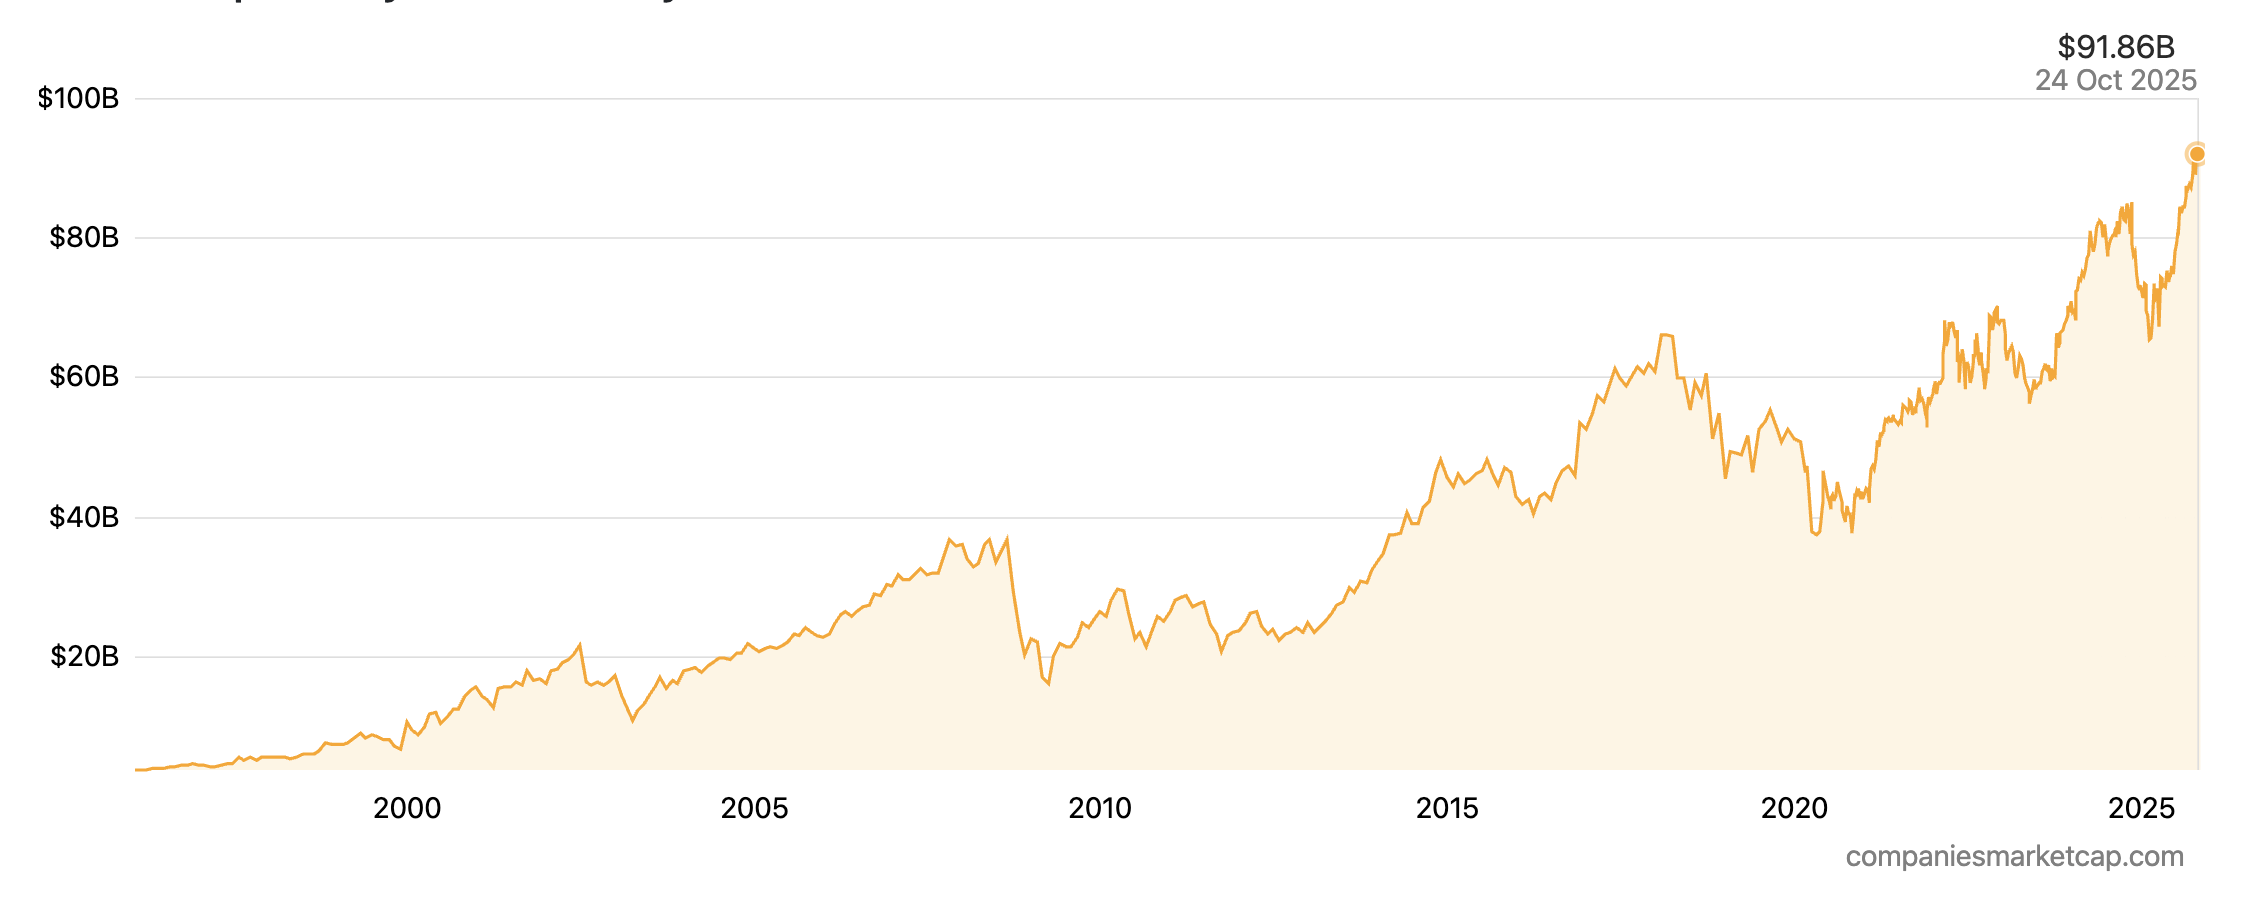
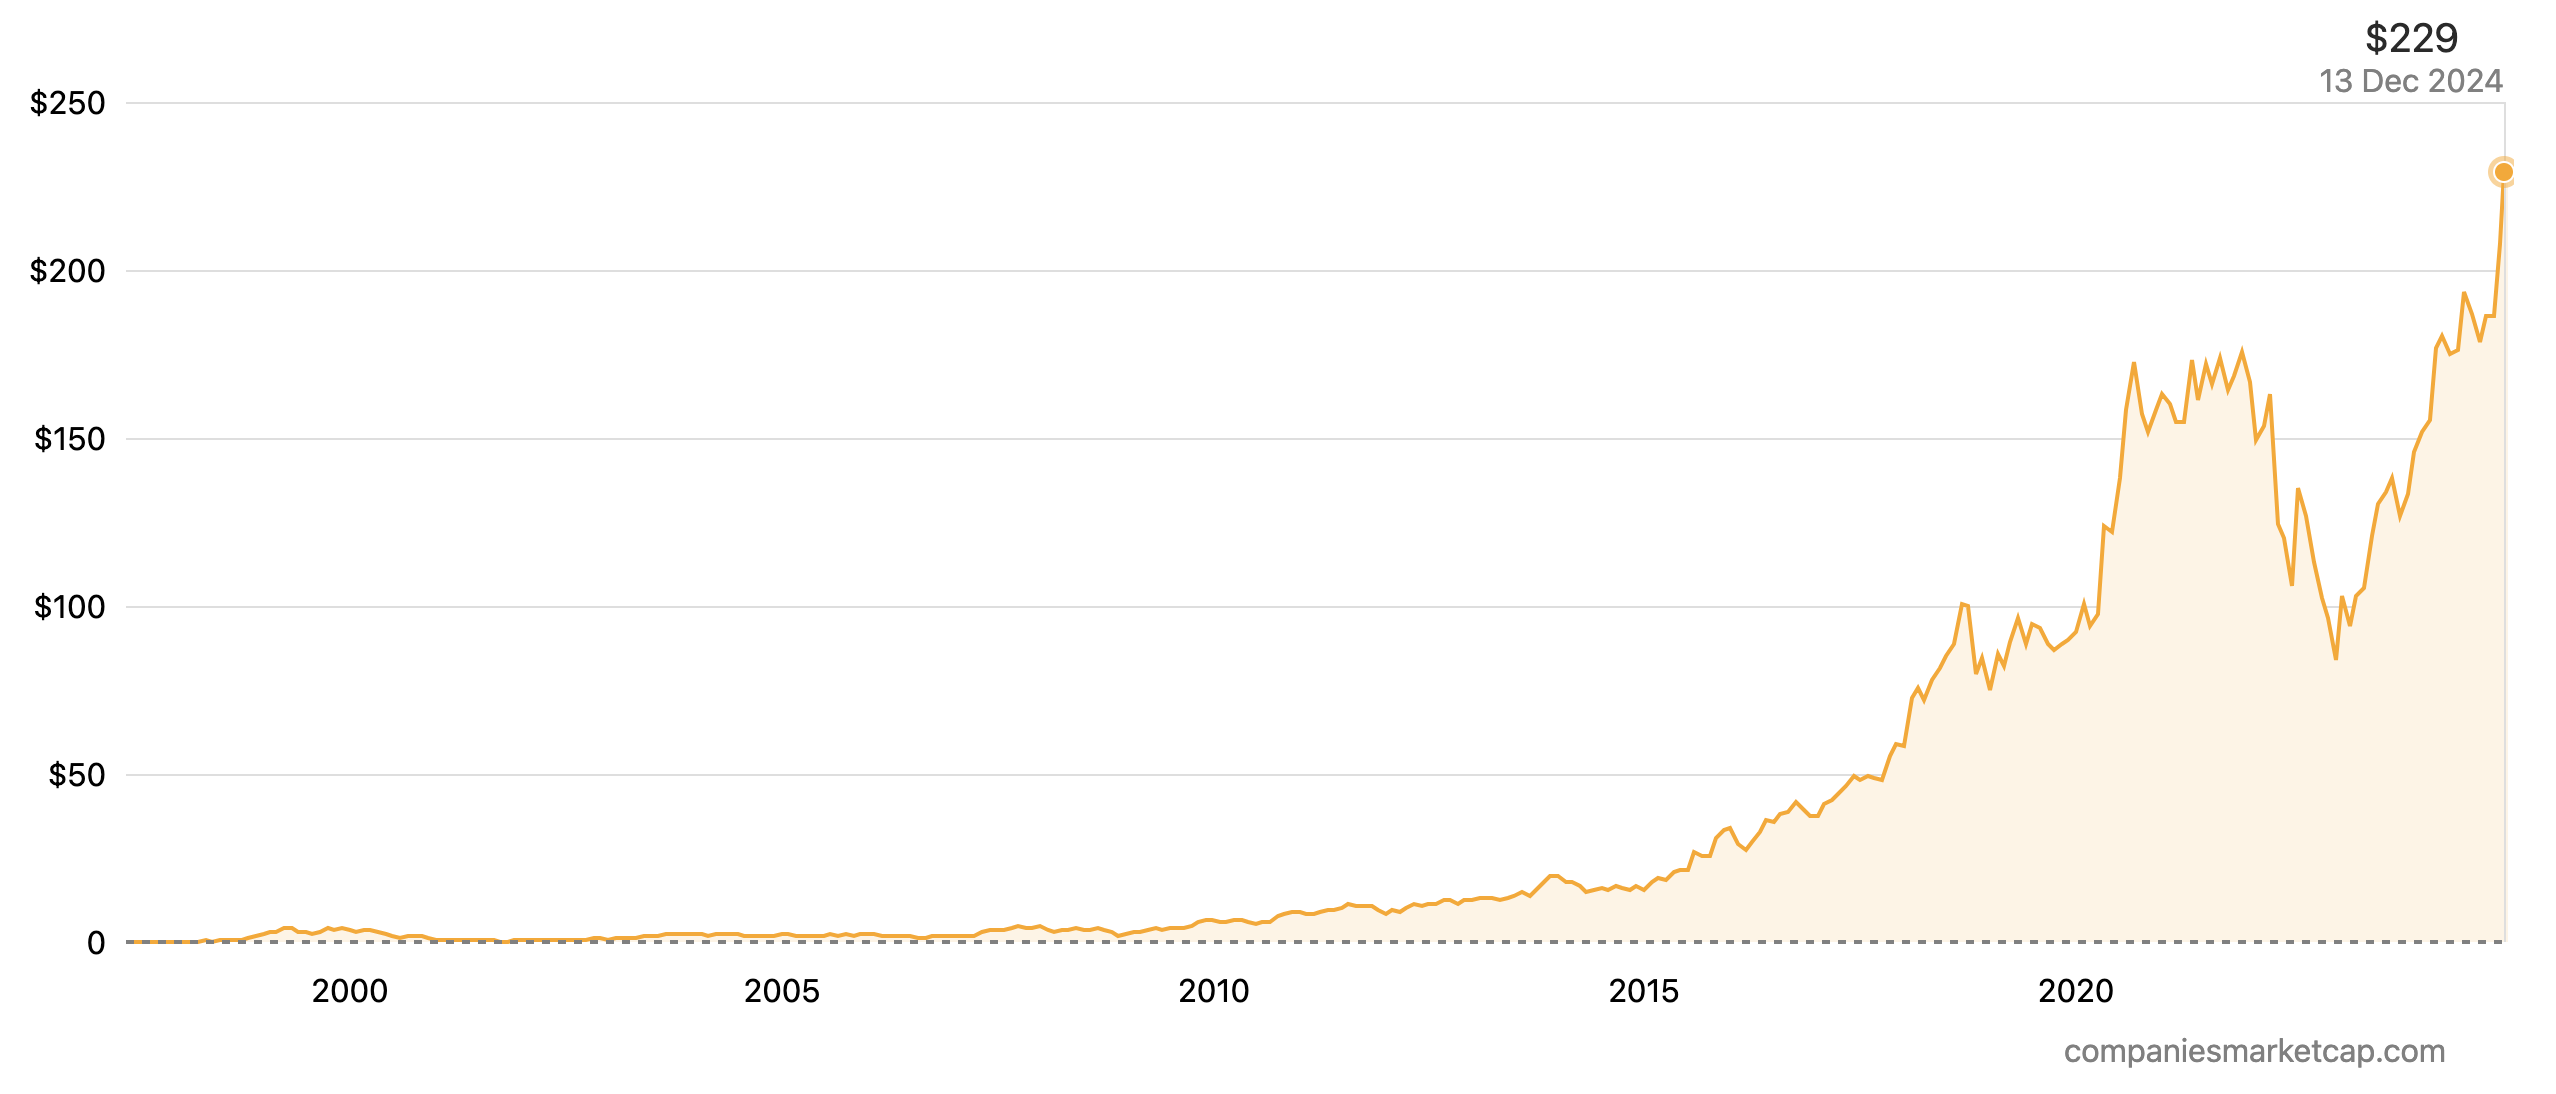
The picture below shows the Stock price history of Hermes International from 2000 to 2025.
Stock price history of Hermes International from 2000 to 2025
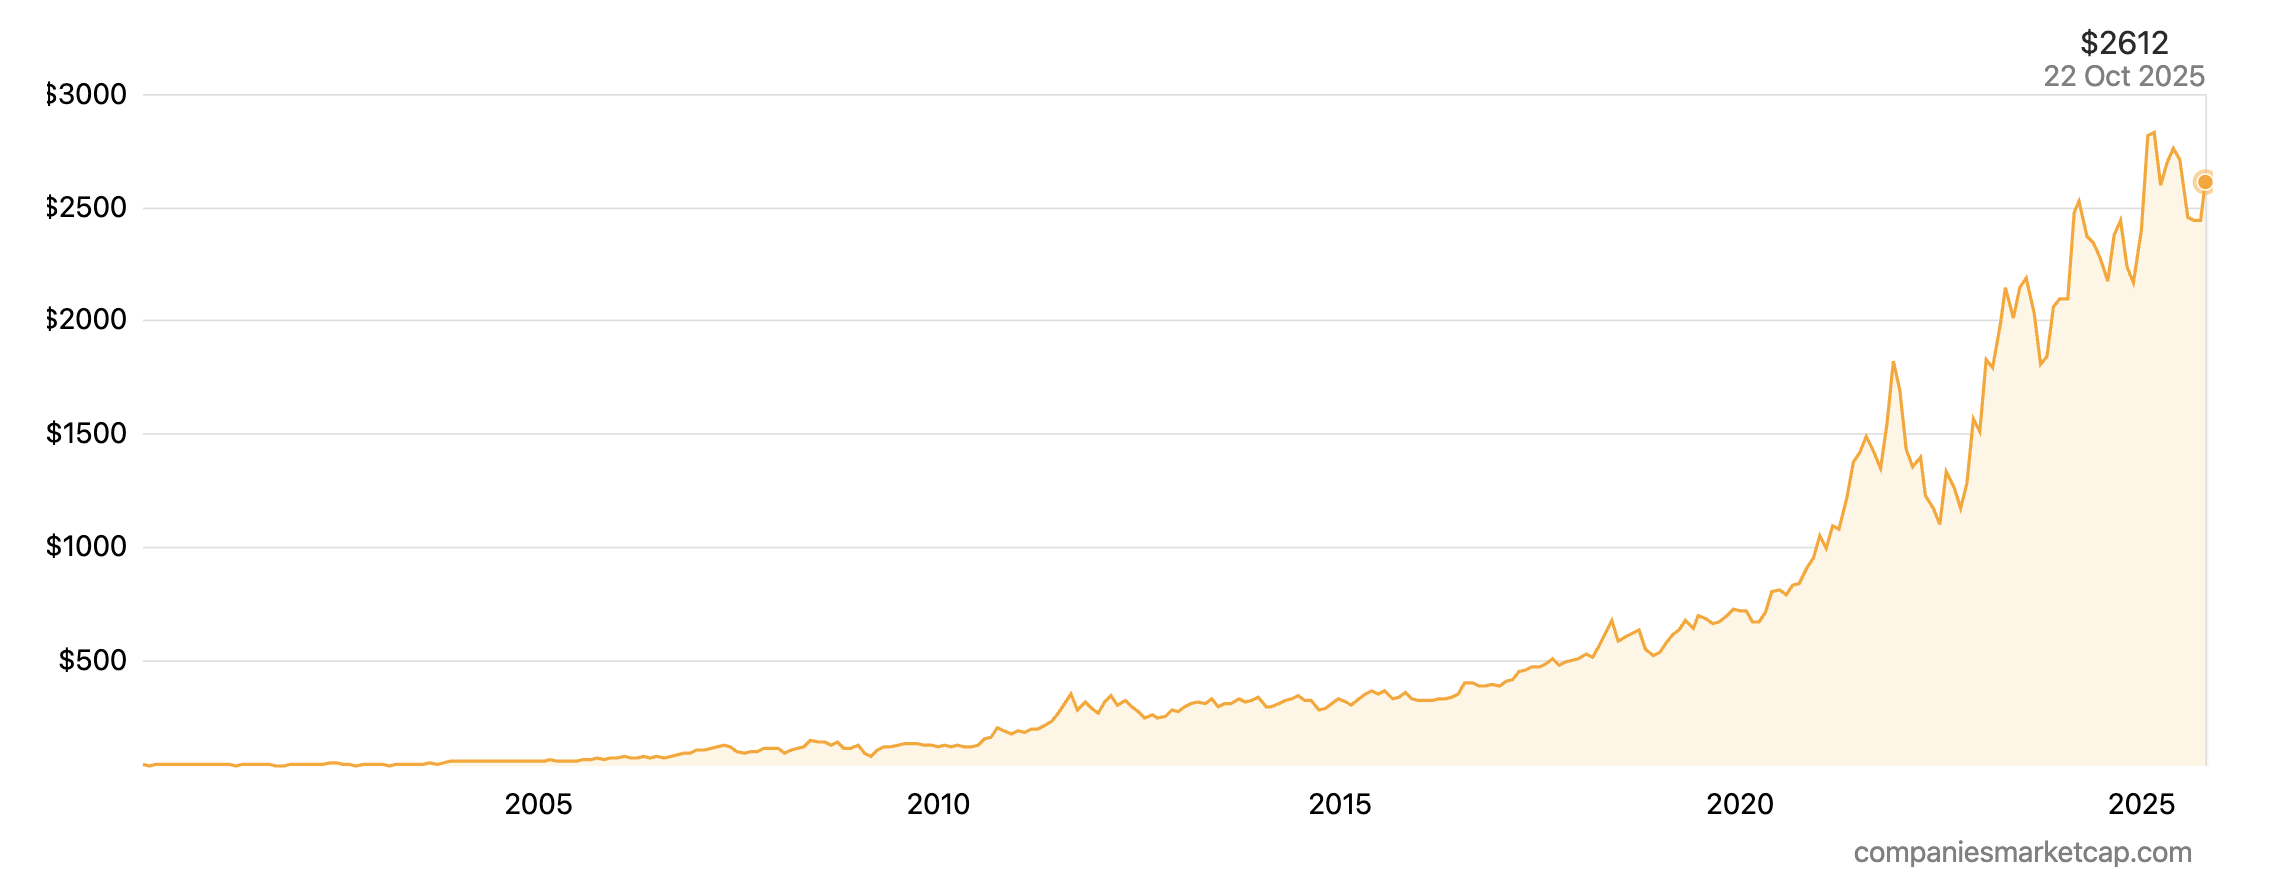
Source: Companies Market Cap.
Hermès’ forward-looking strategy is one of steadfast continuity and disciplined investment. The company is committed to deepening its vertical integration by continuing to invest in its production capabilities. This includes the regular opening of new leather goods workshops, or “maroquineries,” across France, with three new sites planned between 2025 and 2027.
In contrast to its peers, Hermès has adopted a more measured and deliberate approach to digitalization. Its online presence serves more as a brand-building and storytelling platform than a high-volume sales channel, ensuring that the digital experience complements, rather than dilutes, the brand’s aura of exclusivity. The company’s comprehensive approach to sustainability, which emphasizes the durability, repairability, and timelessness of its products, is detailed in its 2024 Universal Registration Document and is inherent to its business model of creating objects that last a lifetime.
Compagnie Financière Richemont
Compagnie Financière Richemont SA, the Swiss-based luxury goods group, occupies a distinct and powerful position in the industry as the preeminent specialist in “hard luxury” (durable products like trunks, suitcases, etc.). Founded in 1988 by South African businessman Johann Rupert, who remains the company’s Chairman, Richemont has cultivated a portfolio of some of the world’s most prestigious Maisons in jewelry and watchmaking. The group’s strategic direction is now guided by CEO Nicolas Bos, who previously led the highly successful Van Cleef & Arpels Maison. Richemont’s corporate structure is deliberately focused on preserving the heritage and autonomy of its brands while providing them with the resources and strategic oversight of a global powerhouse.
Richemont’s strength lies in the depth and prestige of its portfolio, which is organized into three main divisions: Jewelry Maisons, Specialist Watchmakers, and Other Businesses. The Jewelry Maisons division is the group’s financial engine, anchored by two of the most iconic names in high jewelry: Cartier and Van Cleef & Arpels. These brands alone account for the vast majority of the group’s revenue and profits, representing a formidable duopoly in the branded jewelry market.
The Specialist Watchmakers division is a veritable hall of fame of Swiss haute horlogerie, including revered names such as Vacheron Constantin, A. Lange & Söhne, Jaeger-LeCoultre, IWC Schaffhausen, and Piaget. This collection of brands gives Richemont an unparalleled position in the high-end watch market, from classic complications to modern sports timepieces. The “Other” division includes fashion and accessories brands like Chloé and Montblanc, as well as the group’s online distributors. This heavy concentration in hard luxury provides Richemont with a unique risk and return profile. The value of its products is tied to timeless design, precious materials, and mechanical craftsmanship, making them less susceptible to the volatile, trend-driven cycles of the fashion industry. This positions the company as a pure play on long-term global wealth creation and the enduring appeal of tangible assets as a store of value.
Logo of Compagnie Financière Richemont
Source: the company.
Richemont’s financial performance reflects its strong position in the resilient hard luxury segment. For the fiscal year ending March 31, 2025 (FY25), the group reported robust sales of €21.4 billion and an operating profit of €4.5 billion. The company maintains a very strong balance sheet, with a net cash position of €8.3 billion. Geographically, the group’s sales are well-diversified, with Asia Pacific accounting for 33% of revenue, followed by the Americas (25%), Europe (23%), Japan (10%), and the Middle East & Africa (9%).
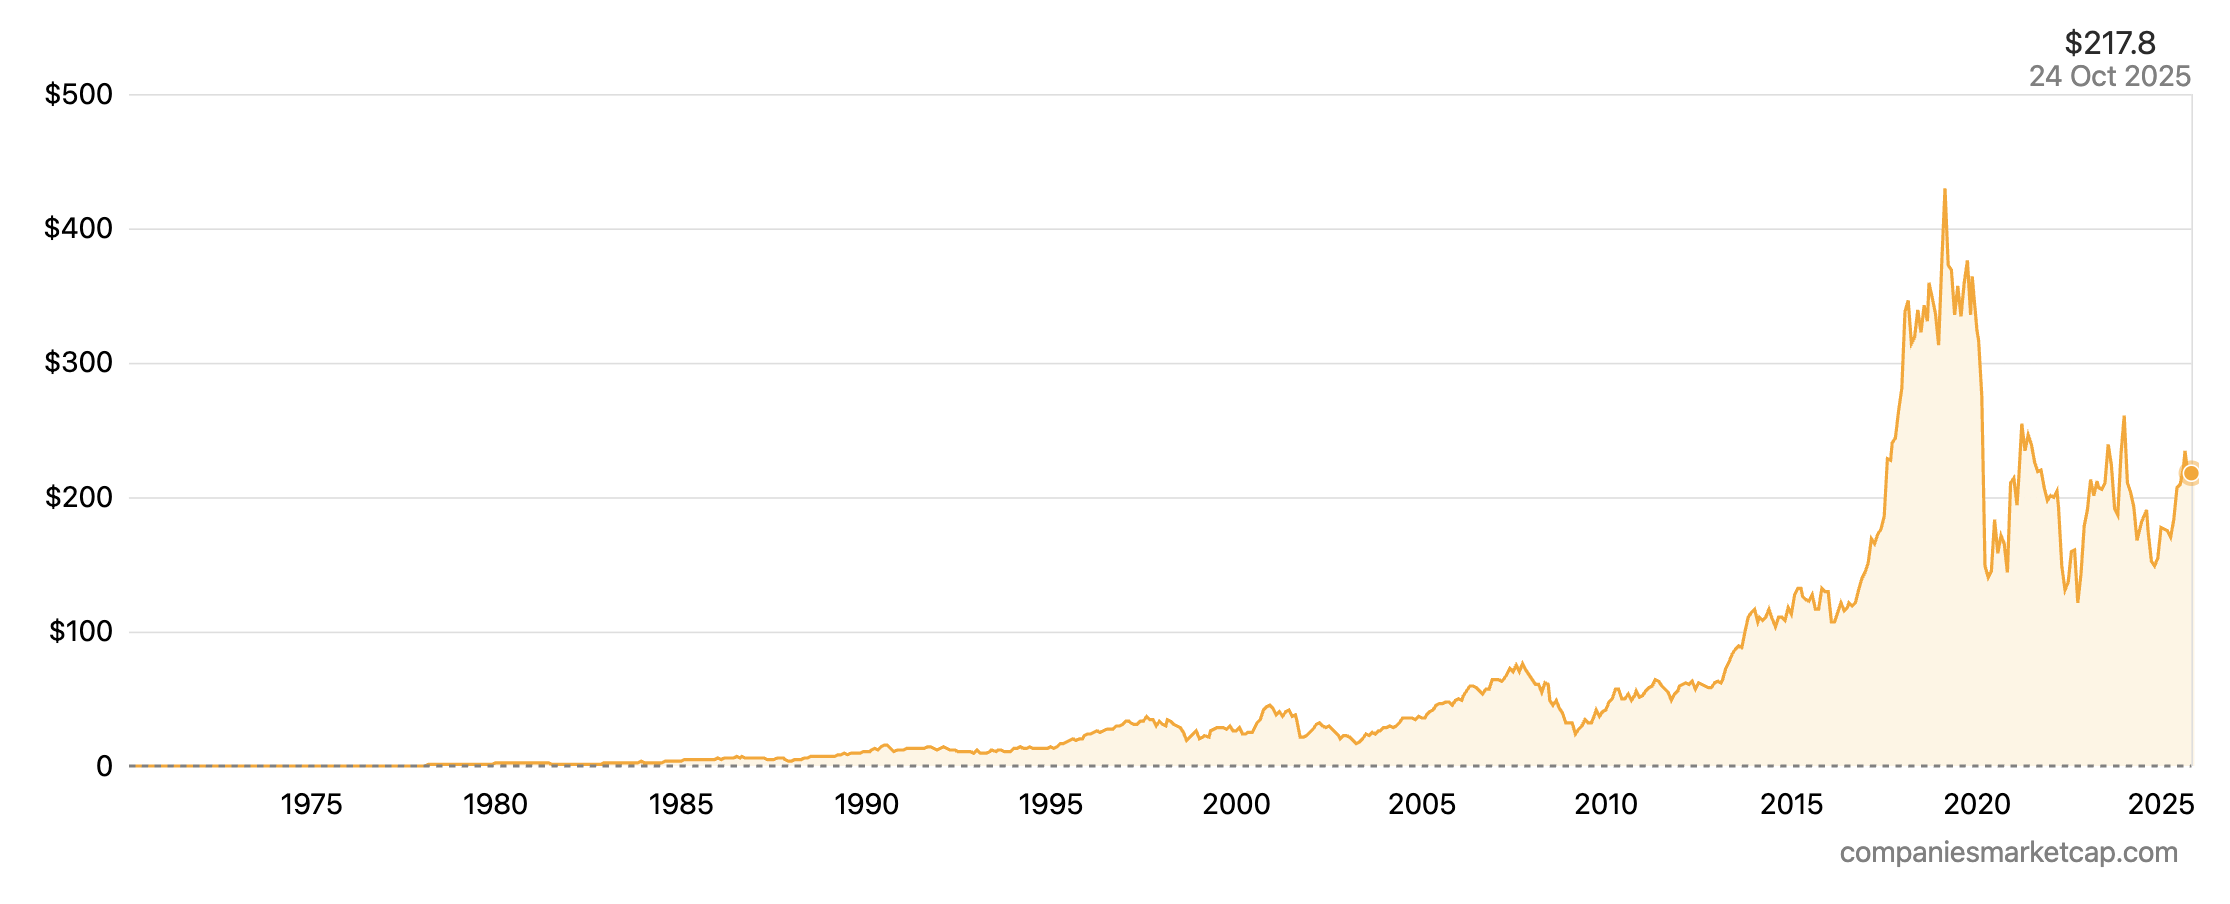
With a market capitalization of approximately $118 billion as of mid-October 2025, Richemont is the third-largest publicly traded luxury goods company. Its stock has been a strong performer, delivering an impressive 5-year total return in the range of 174% to 188%, outperforming many of its peers. Its valuation metrics are typically viewed as more moderate than those of Hermès, reflecting its different business mix and growth profile. The consensus among financial analysts is generally positive, with a majority holding “Buy” ratings on the stock.
The picture below shows the market capitalization history of Compagnie Financière Richemont from 2003 to 2025.
Market cap history of Compagnie Financière Richemont from 2003 to 2025
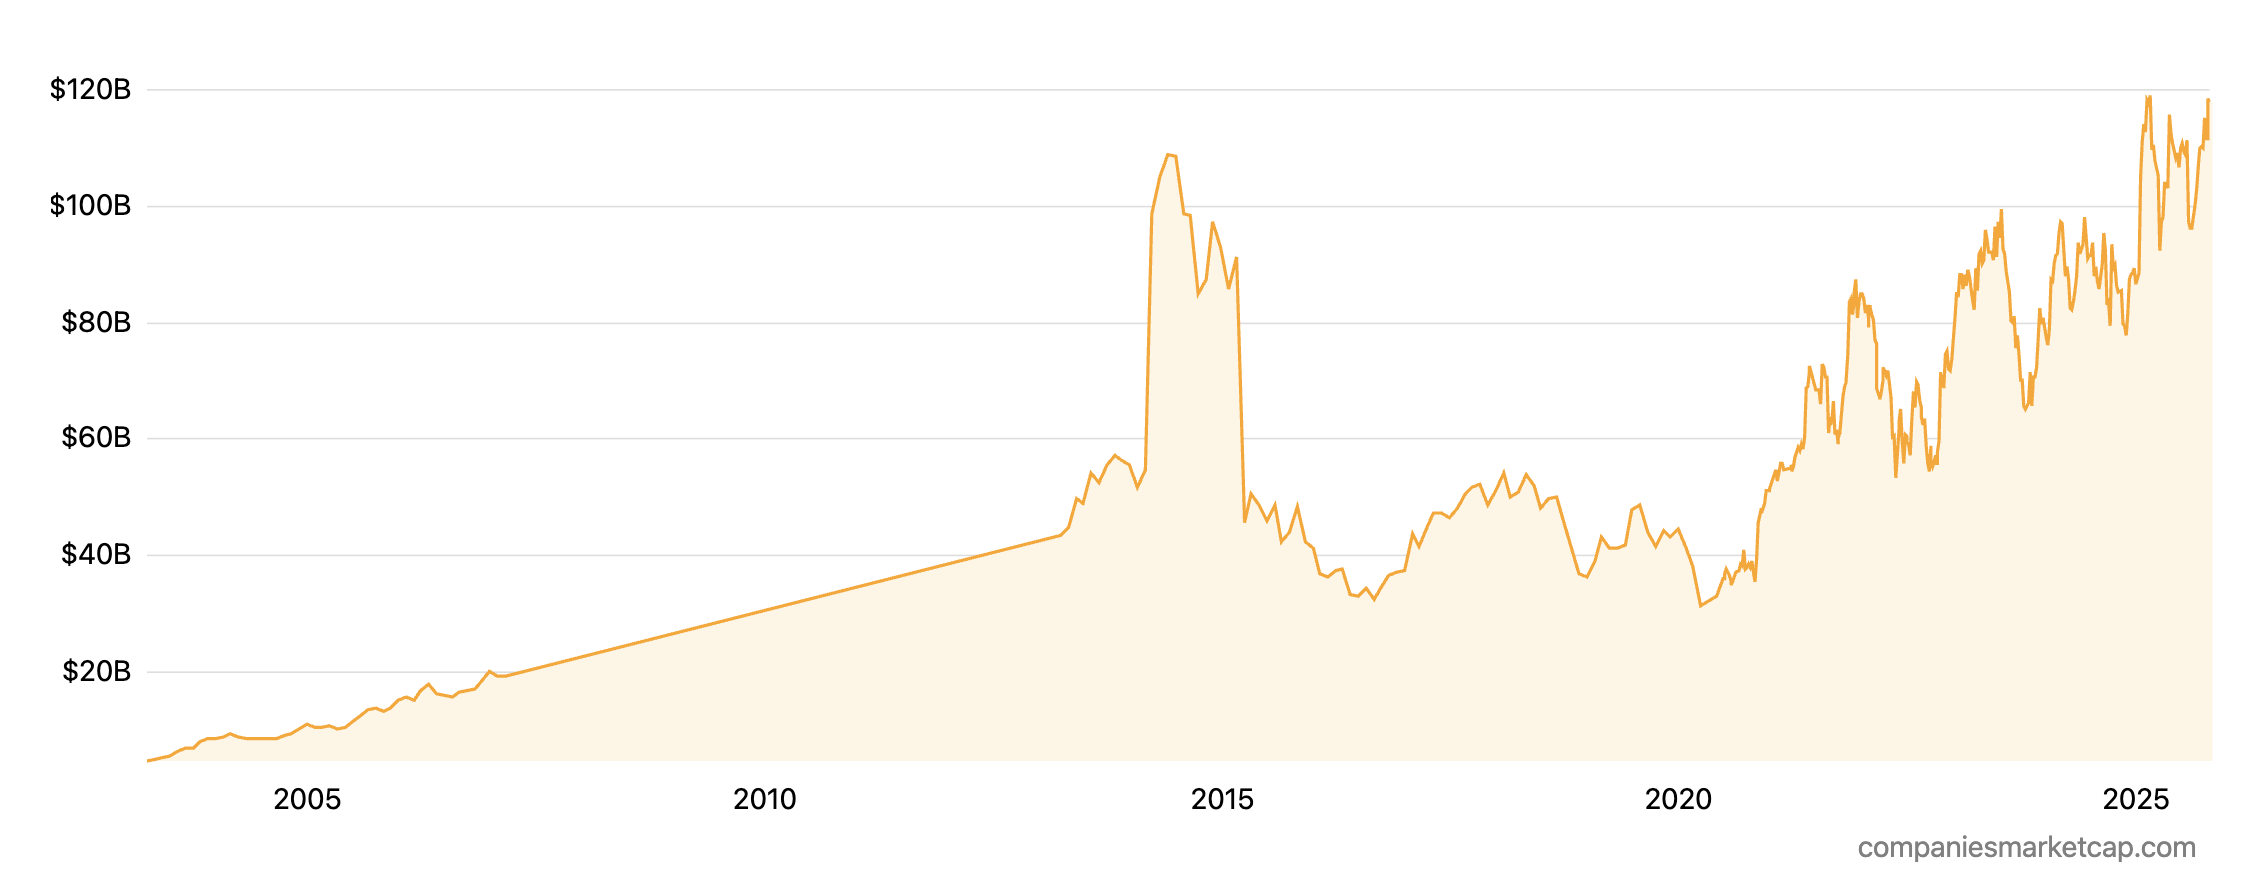
Source: Companies Market Cap.
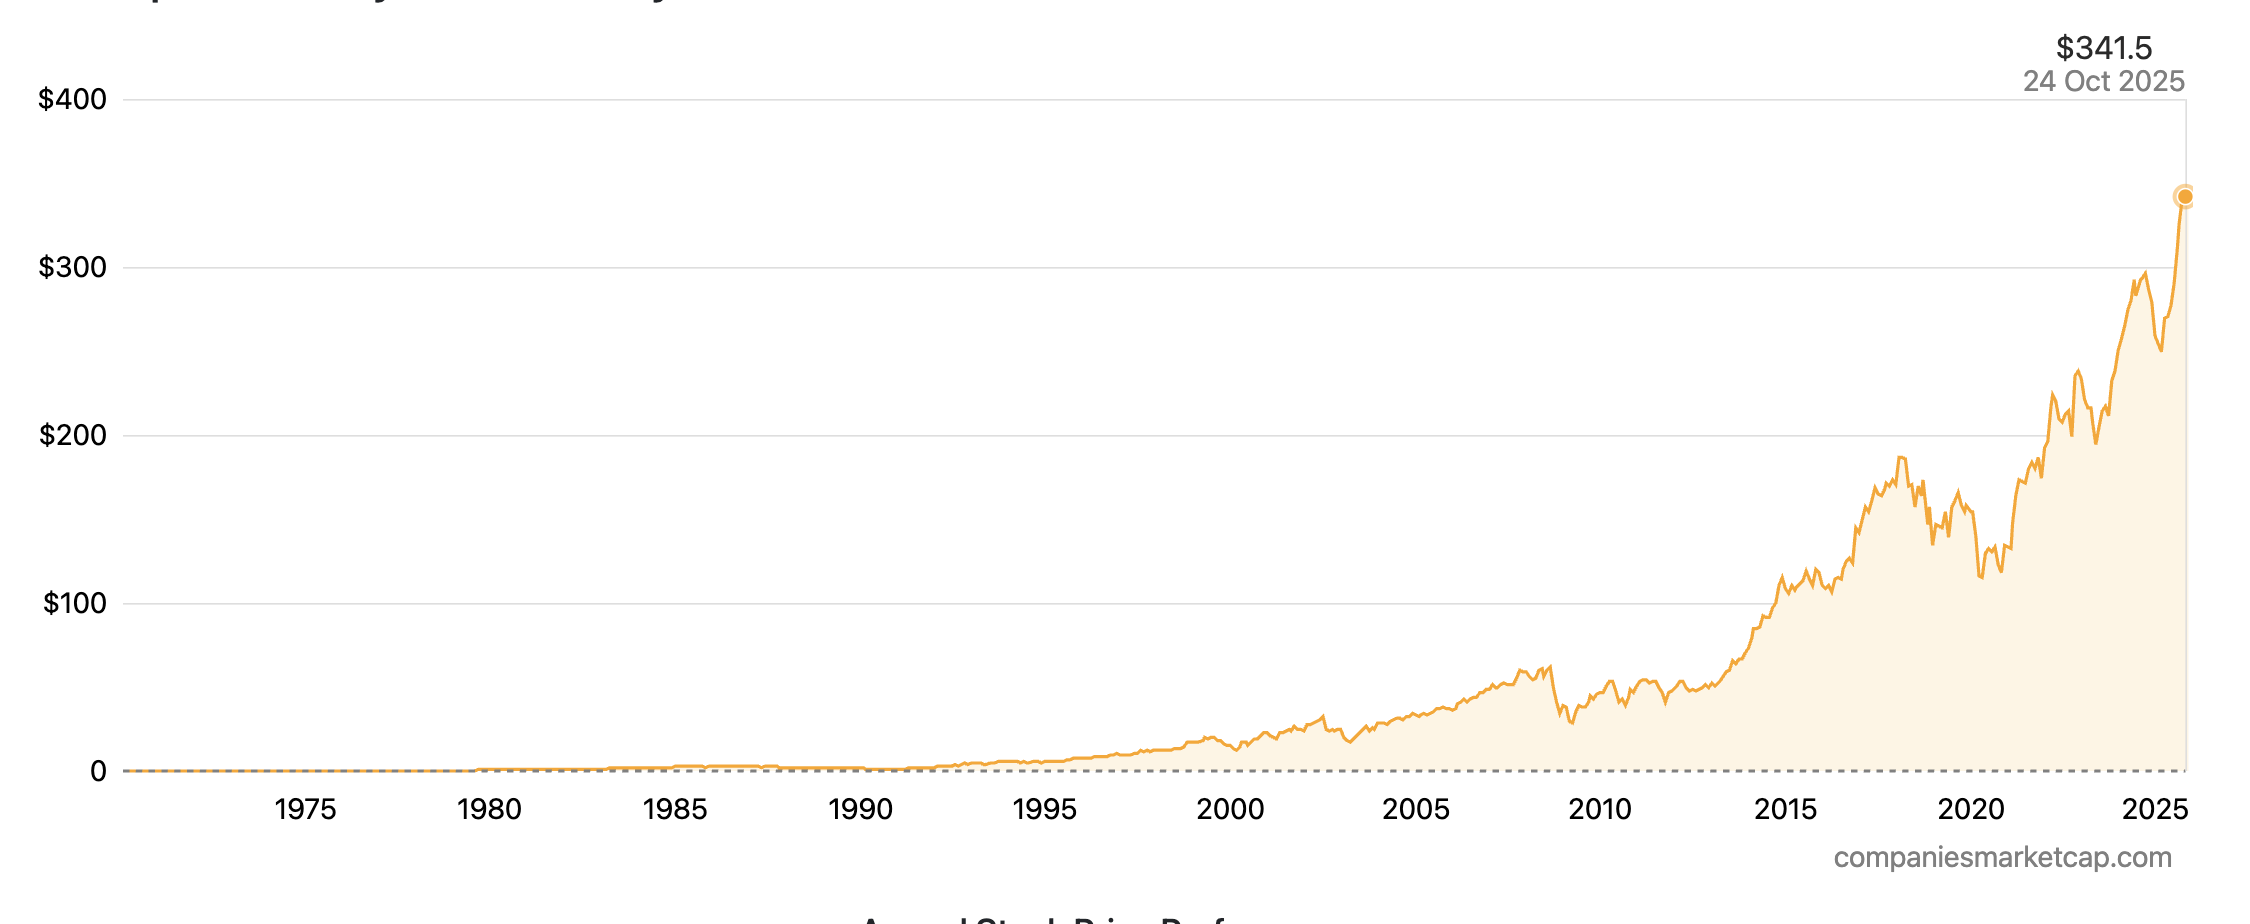
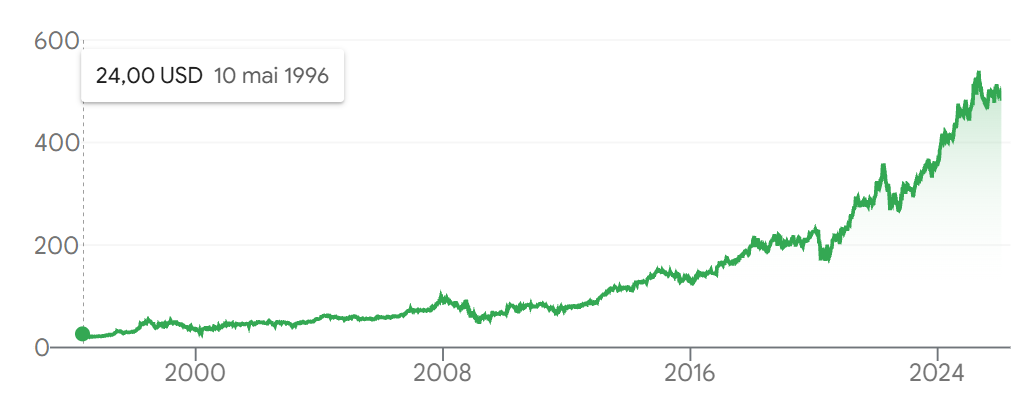
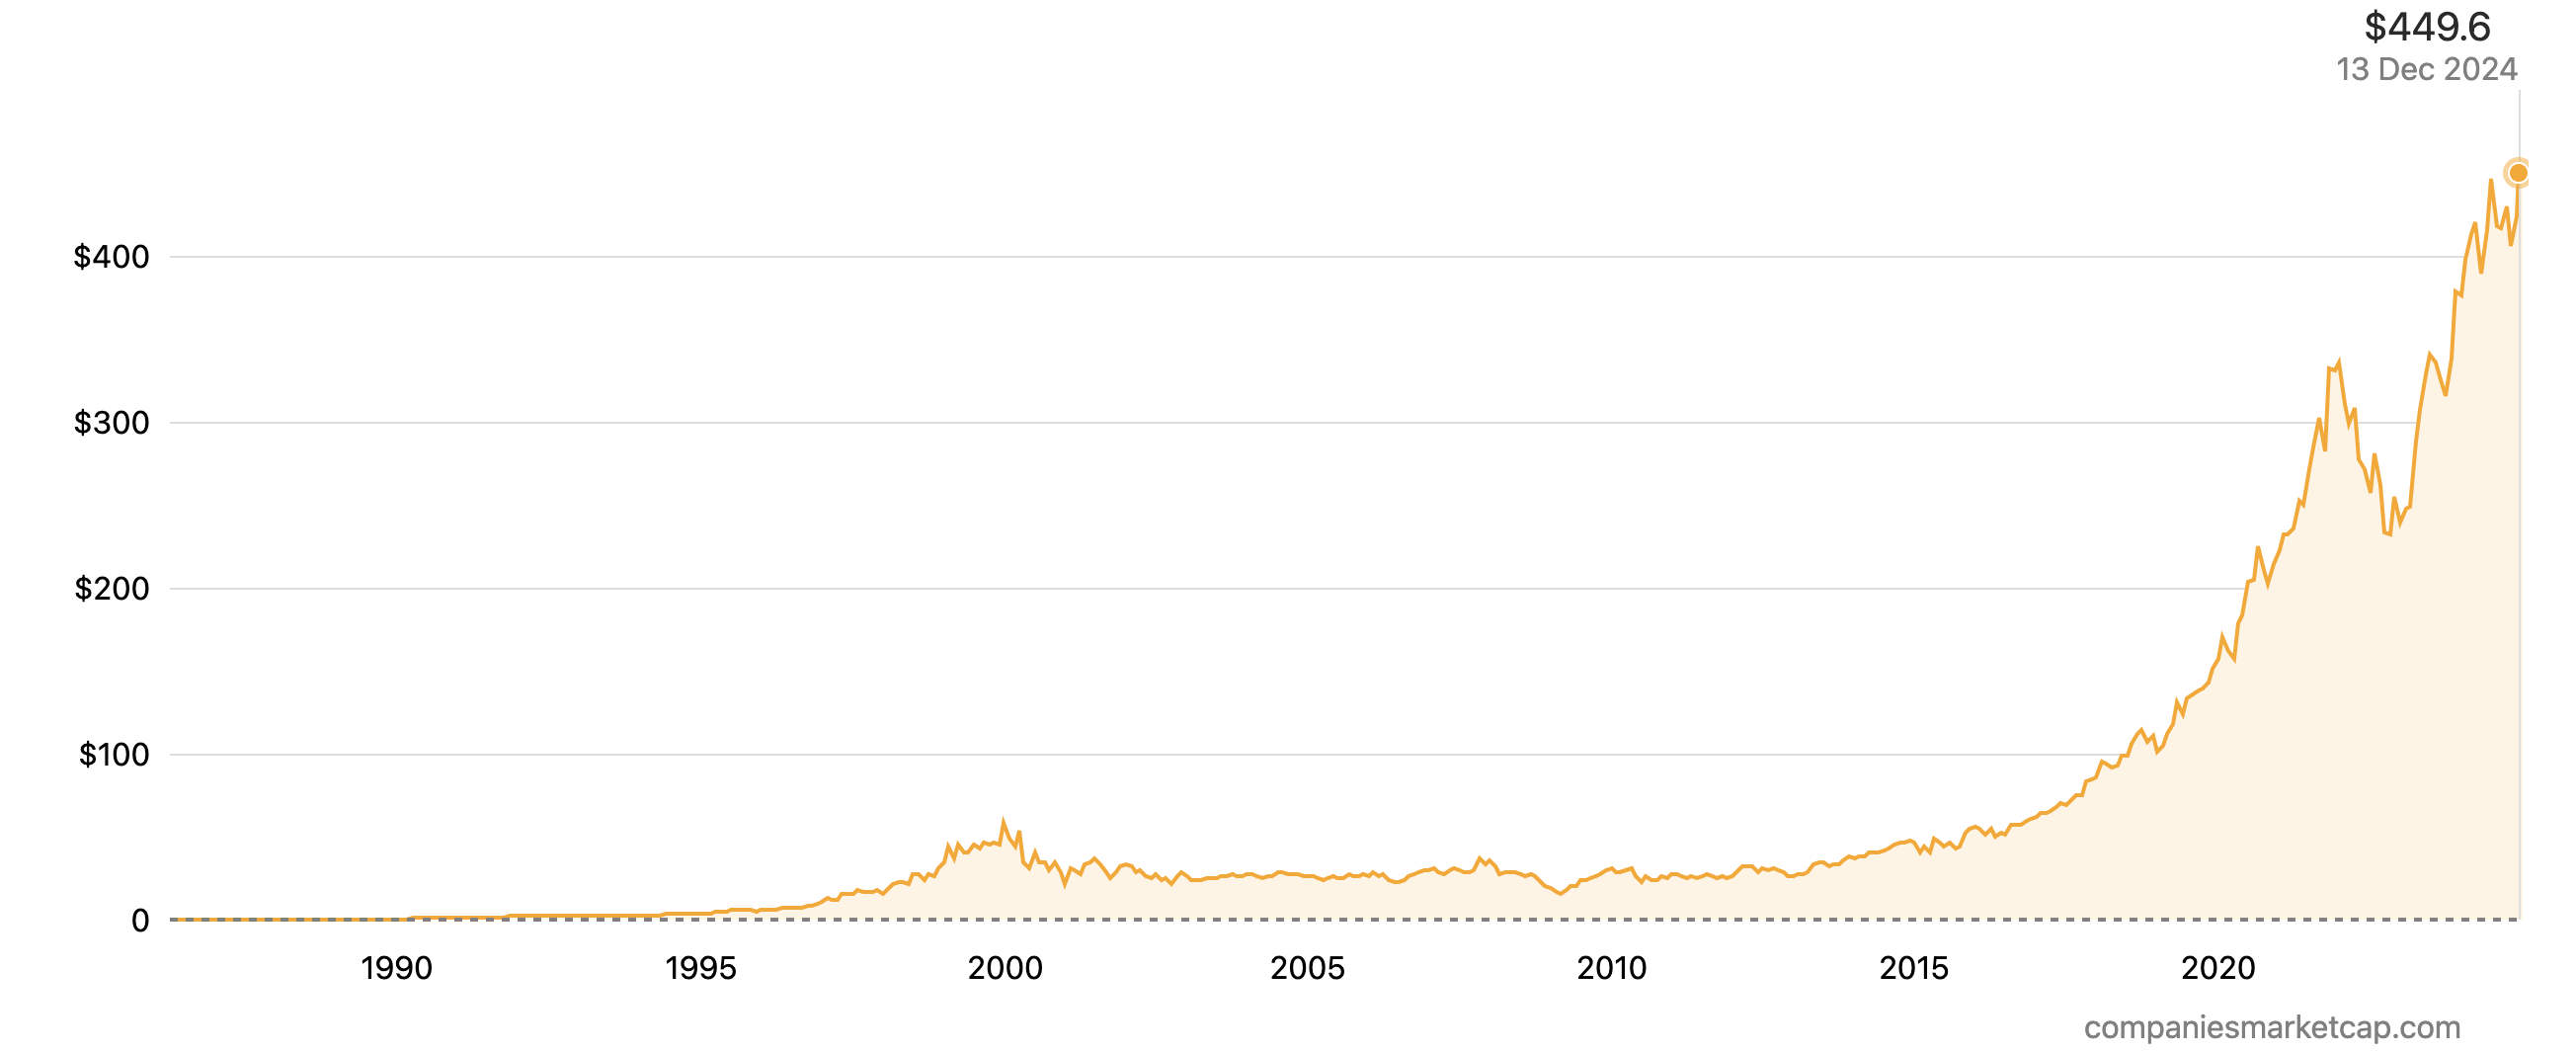
The picture below shows the stock price history of Compagnie Financière Richemont from 1995 to 2025.
Stock price history of Compagnie Financière Richemont from 1995 to 2025
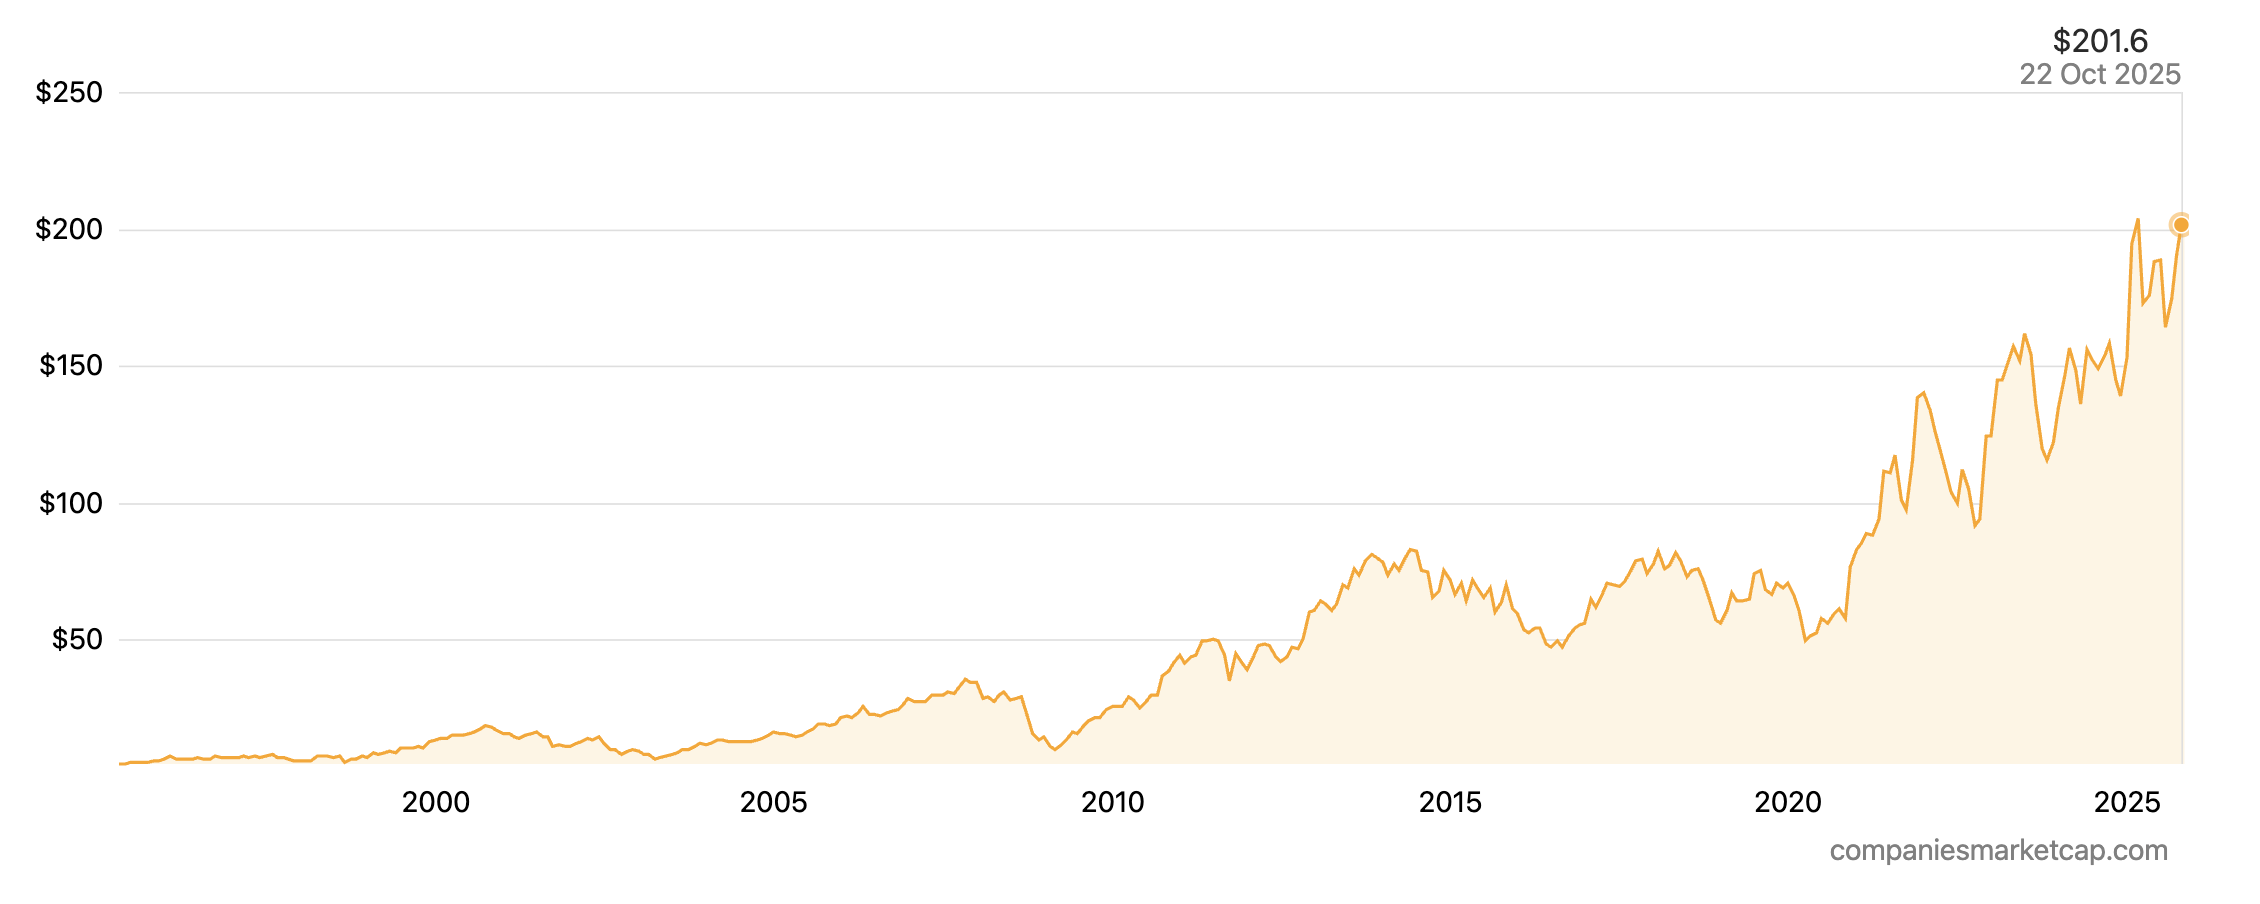
Source: Companies Market Cap.
Richemont’s strategic priorities are centered on enhancing its direct-to-consumer engagement and navigating the digital transformation of the luxury market. A key initiative is the “Luxury New Retail” (LNR) model, which aims to create a seamless omnichannel experience (contacts from different selling channels like internet websites, social networks, phone calls, etc.) for customers. This strategy has been supported by a strategic partnership with Alibaba in China to leverage its Tmall Luxury Pavilion platform, providing Richemont’s Maisons with unparalleled access to the vast Chinese consumer market.
Sustainability is also a core focus, as detailed in the company’s FY25 Non-Financial Report. Richemont is moving towards a “Double Materiality Assessment” to evaluate both its impact on the environment and society, and the corresponding risks and opportunities for the business. This approach highlights the group’s commitment to responsible sourcing, talent development, and the preservation of cultural heritage—values that are intrinsic to the world of high jewelry and watchmaking.
Kering S.A.
Kering SA represents a unique model in the luxury sector, one built on the principle of acquiring and creatively reinvigorating high-fashion houses. The group’s origins are unconventional for a luxury titan; it was founded as a timber trading company, Pinault S.A., in 1962 by French entrepreneur François Pinault. Through a series of strategic acquisitions in the retail sector, the company evolved into Pinault-Printemps-Redoute (PPR). The pivotal moment in its transformation came in 1999 with the audacious acquisition of a controlling stake in the Gucci Group. This move marked the company’s definitive shift towards luxury and set the stage for its future. In 2013, the group was rebranded as Kering to reflect its new identity. Today, it is led by François-Henri Pinault, son of the founder, who serves as Chairman and CEO.
Kering’s portfolio is a curated collection of some of the most influential names in fashion and leather goods, including Gucci, Saint Laurent, Bottega Veneta, Balenciaga, and Alexander McQueen. The group’s strategy is distinct from its peers; it operates more like a “private equity” model for high-fashion brands, granting significant creative freedom to its appointed artistic directors to drive brand identity and commercial success. This approach has historically yielded spectacular results, such as the explosive growth of Gucci under Alessandro Michele and Saint Laurent under Hedi Slimane.
The model is inherently cyclical and carries a higher degree of risk, as the group’s fortunes are heavily dependent on the success of these creative visions. When a creative cycle flourishes, the growth can be exponential; however, when a brand’s momentum wanes, the financial impact can be severe due to the portfolio’s concentration. Kering has also strategically expanded into adjacent categories, establishing Kering Eyewear and Kering Beauté to gain greater control over these profitable licensed businesses.
Logo of Kering

Source: the company.
Kering’s recent financial performance illustrates the inherent volatility of its creative-led model. The fiscal year 2024 proved to be a challenging period of transition for the group. Total revenue declined by 12% on a comparable basis to €17.2 billion. This downturn was driven primarily by its largest brand, Gucci, which saw its revenue fall by 21% on a comparable basis to €7.7 billion as it undergoes a major creative and strategic reset. Other major houses also faced headwinds, with Saint Laurent’s revenue declining by 9%. In contrast, Bottega Veneta showed resilience with a 6% increase in comparable revenue. The impact on profitability was significant, with the group’s recurring operating income falling by 46% to €2.6 billion, and the operating margin contracting from 24.3% in 2023 to 14.9% in 2024. Geographically, retail revenue declined across most major regions, including the Asia-Pacific (-24%) and North America (-11%), with Japan being the only region to post growth.
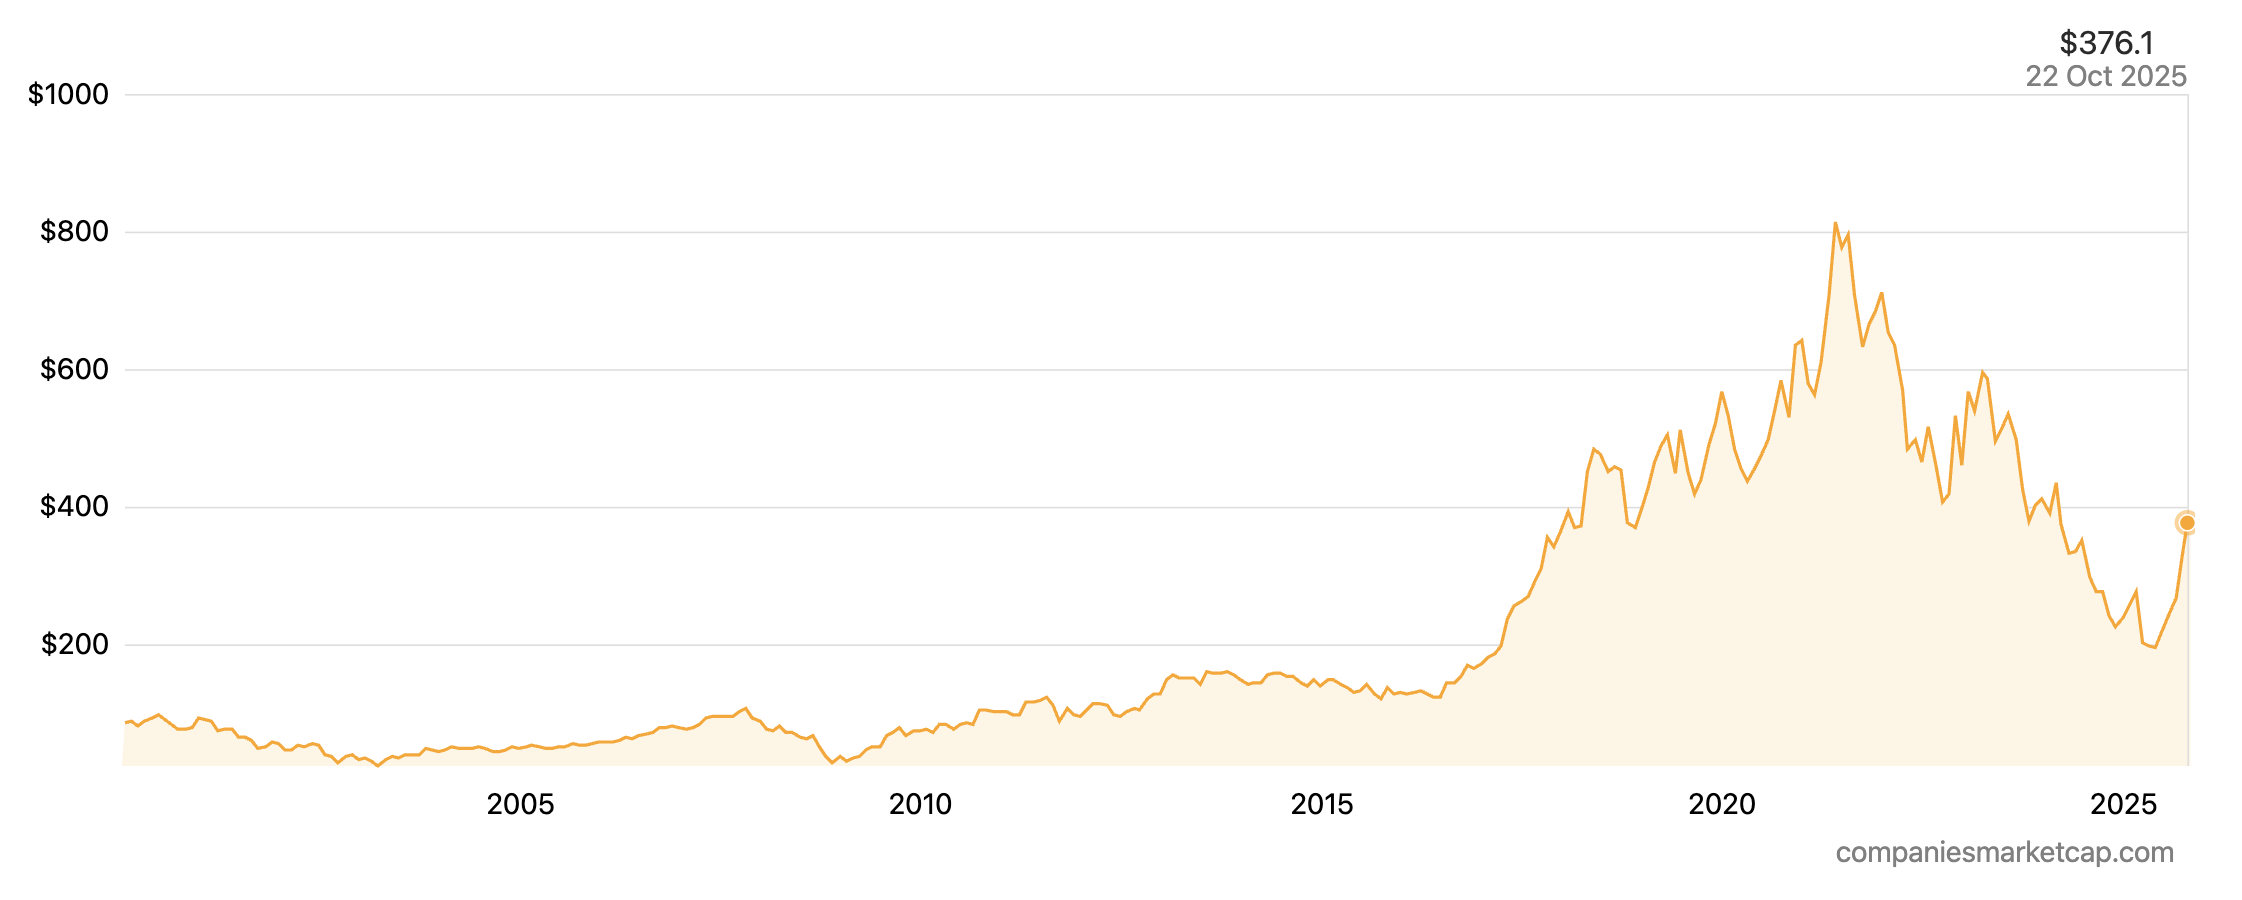
This performance has been reflected in the company’s market valuation. As of mid-October 2025, Kering’s market capitalization stood at approximately $45 billion, a significant discount to its peers. The stock has underperformed, with a 5-year total return of approximately -10% to -43%, highlighting investor concerns over the Gucci turnaround. Analyst ratings are currently mixed, with a significant number of “Hold” recommendations, as the market awaits tangible signs of a successful creative relaunch at its flagship brand.
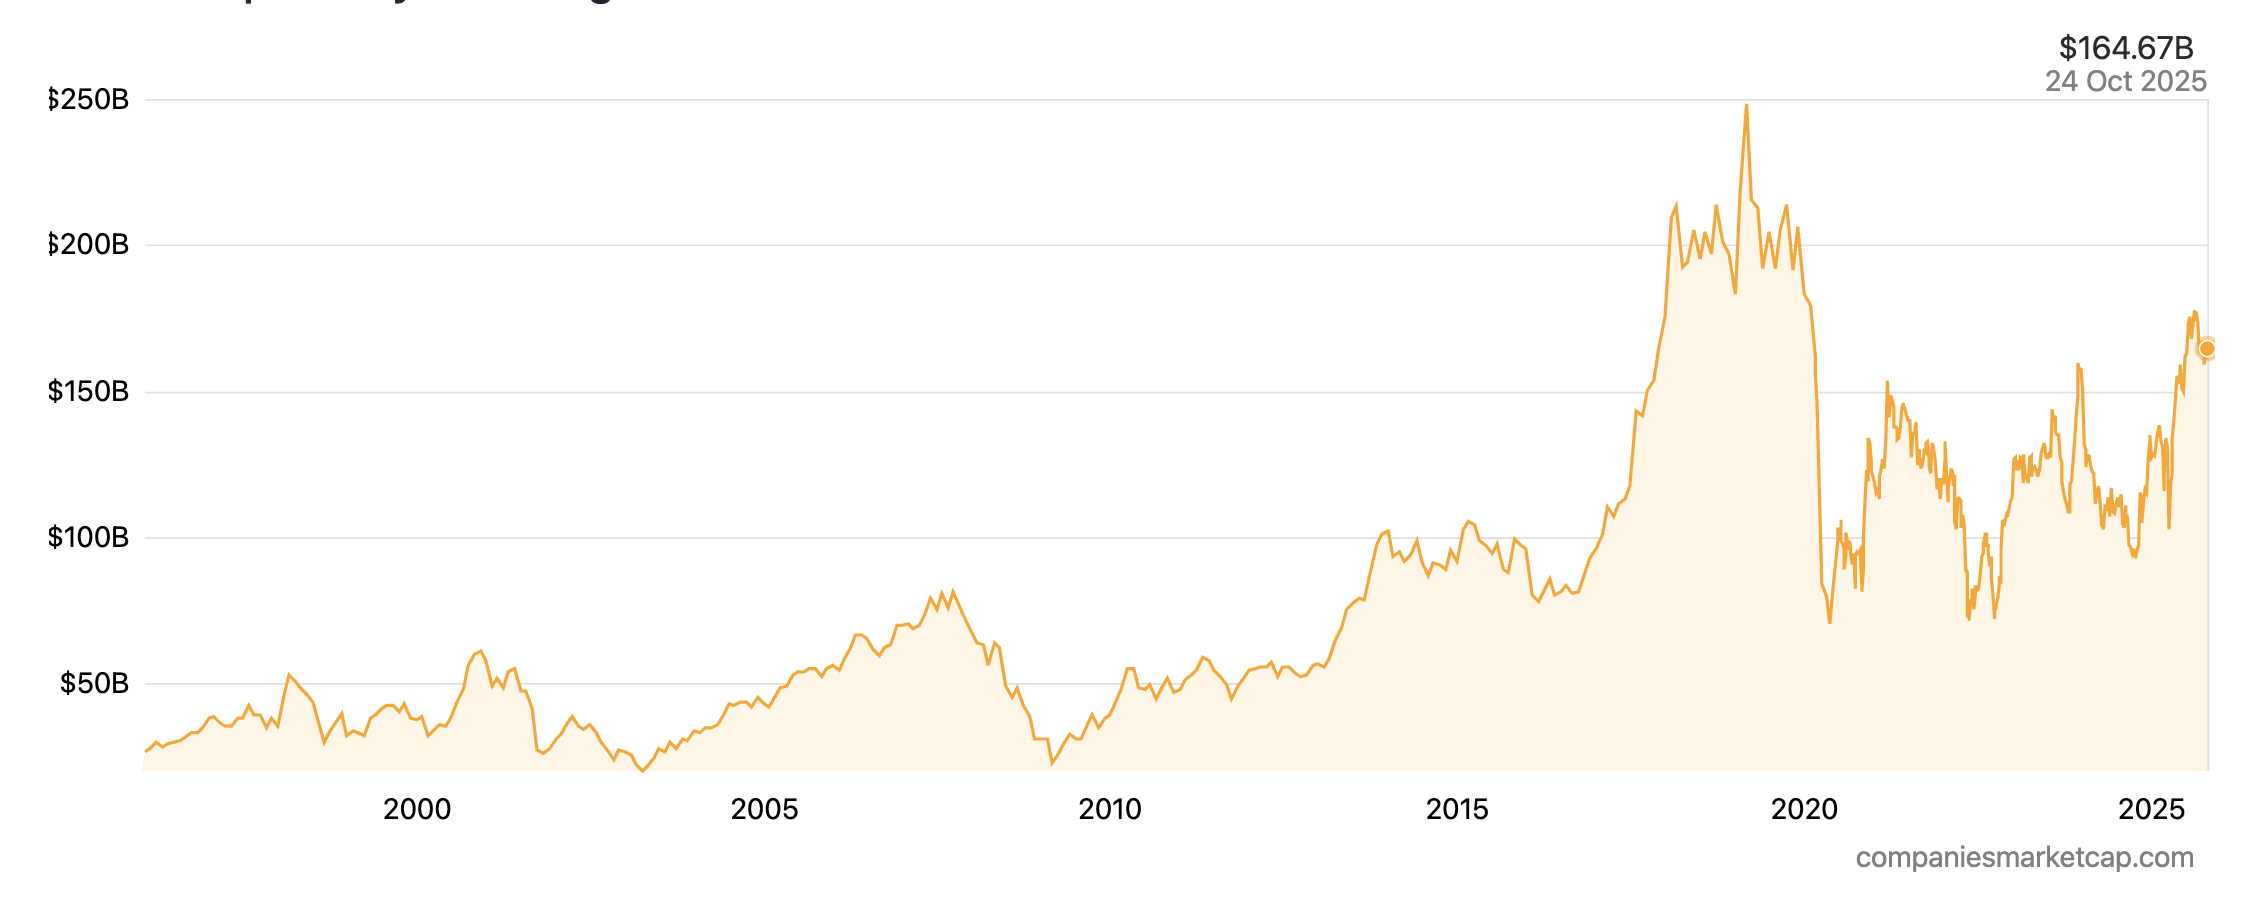
The picture below shows the market capitalization history of Kering from 2003 to 2025.
Market cap history of Kering from 2003 to 2025
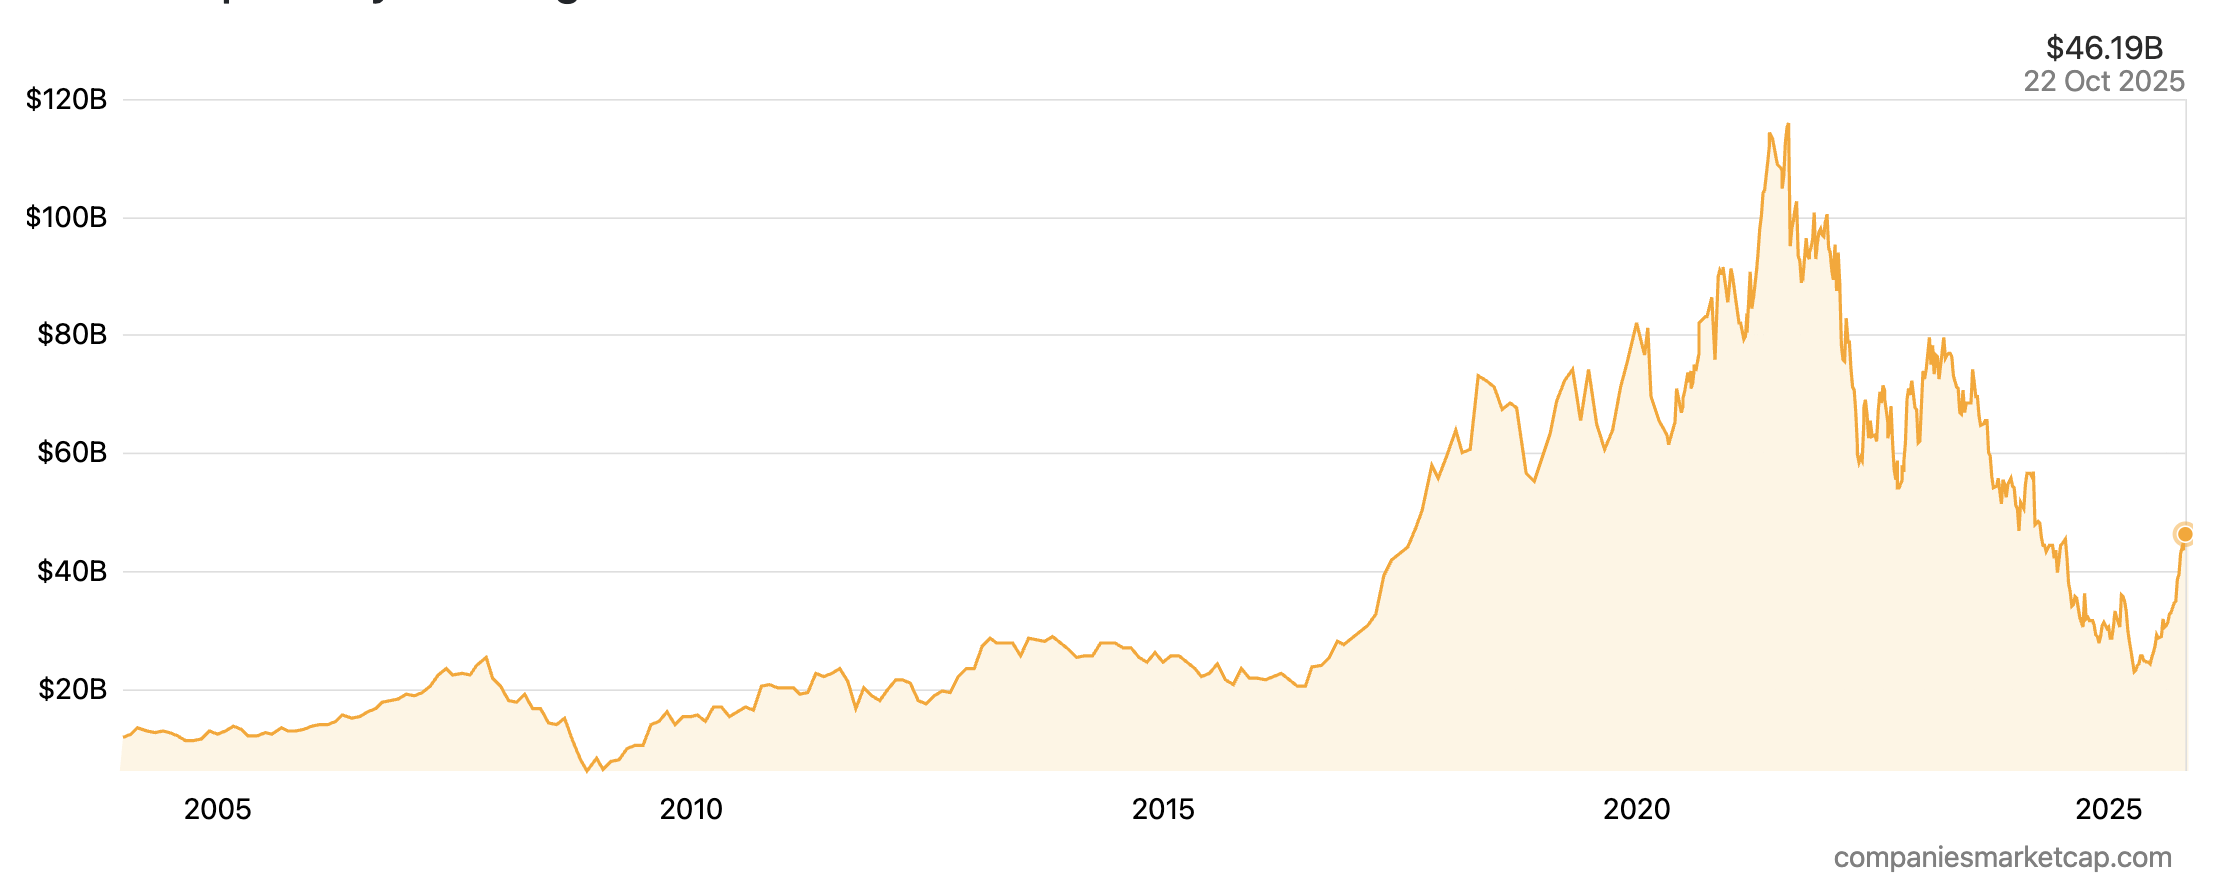
Source: Companies Market Cap.
The picture below shows the Stock price history of Kering from 2000 to 2025.
Stock price history of Kering from 2000 to 2025
Source: Companies Market Cap.
Kering’s foremost strategic imperative is the successful execution of its brand transformations, particularly at Gucci. The group is focused on strengthening the desirability and exclusivity of its houses through elevated communications, refined product strategies, and higher-quality distribution networks. This includes continuing to reduce its exposure to the wholesale channel to gain greater control over pricing and brand presentation.
Beyond the immediate turnarounds, Kering remains a leader in sustainability within the luxury sector. It was a pioneer in implementing an Environmental Profit & Loss (EP&L) account, a tool that measures and monetizes the environmental impact of its operations and supply chain from raw materials to retail.
The group’s digital strategy is also a key focus, with investments in data science and customer relationship management (CRM) to support its houses’ growth and enhance the client experience. An investment in Kering is therefore not a bet on the stable growth of the luxury market, but a specific, higher-risk wager on management’s proven ability to orchestrate successful creative and commercial turnarounds
Essilor Luxottica
Essilor Luxottica SA represents a unique and dominant force at the intersection of luxury, healthcare, and technology. The Franco-Italian conglomerate was formed in 2018 through the landmark merger of Essilor, the world’s leading manufacturer of ophthalmic lenses, and Luxottica, the global leader in eyewear frames. This combination created a vertically integrated behemoth with an unparalleled position across the entire eyewear value chain, from lens technology and frame manufacturing to a global retail footprint. The company is led by Chairman and CEO Francesco Milleri and Deputy CEO Paul du Saillant, who oversee its complex and highly synergistic operations.
Essilor Luxottica’s market power is derived from its comprehensive control over the eyewear industry. The company’s portfolio includes over 150 brands, a mix of powerful proprietary names and a vast array of highly profitable licensed brands. Its proprietary portfolio is anchored by global icons such as Ray-Ban, Oakley, Persol, and Oliver Peoples. On the lens technology side, it owns industry standards like Varilux, Crizal, and Transitions. The company also holds the exclusive licenses to design, manufacture, and distribute eyewear for a who’s who of luxury fashion houses, including Chanel, Prada, Giorgio Armani, Burberry, and Versace.
This dominance in product is matched by its control over distribution. Essilor Luxottica operates a global retail network of approximately 18,000 stores, including major chains like LensCrafters, Sunglass Hut, and Pearle Vision, as well as a growing e-commerce presence. Furthermore, its ownership of EyeMed, one of the largest vision insurance providers in the United States, gives it significant influence over the consumer’s purchasing journey. This level of vertical integration, from manufacturing to insurance, is unprecedented in the industry and has led to scrutiny regarding its market power, with some critics characterizing its position as a near-monopoly.
Logo of Essilor Luxottica

Source: the company.
The financial strength of EssilorLuxottica’s integrated model is evident in its results. For the fiscal year 2024, the group achieved revenues of €26.5 billion, representing a 6% increase at constant exchange rates, and an adjusted net profit of €3.1 billion. Growth was geographically balanced, with strong performances in Latin America (+9.7%) and Asia Pacific (+9.3%).
The company’s momentum continued with a record-breaking third quarter in 2025, which saw revenues climb to €6.87 billion, an 11.7% increase at constant exchange rates. This strong performance was driven by robust demand across all regions and channels, with a notable contribution from the burgeoning wearables category.
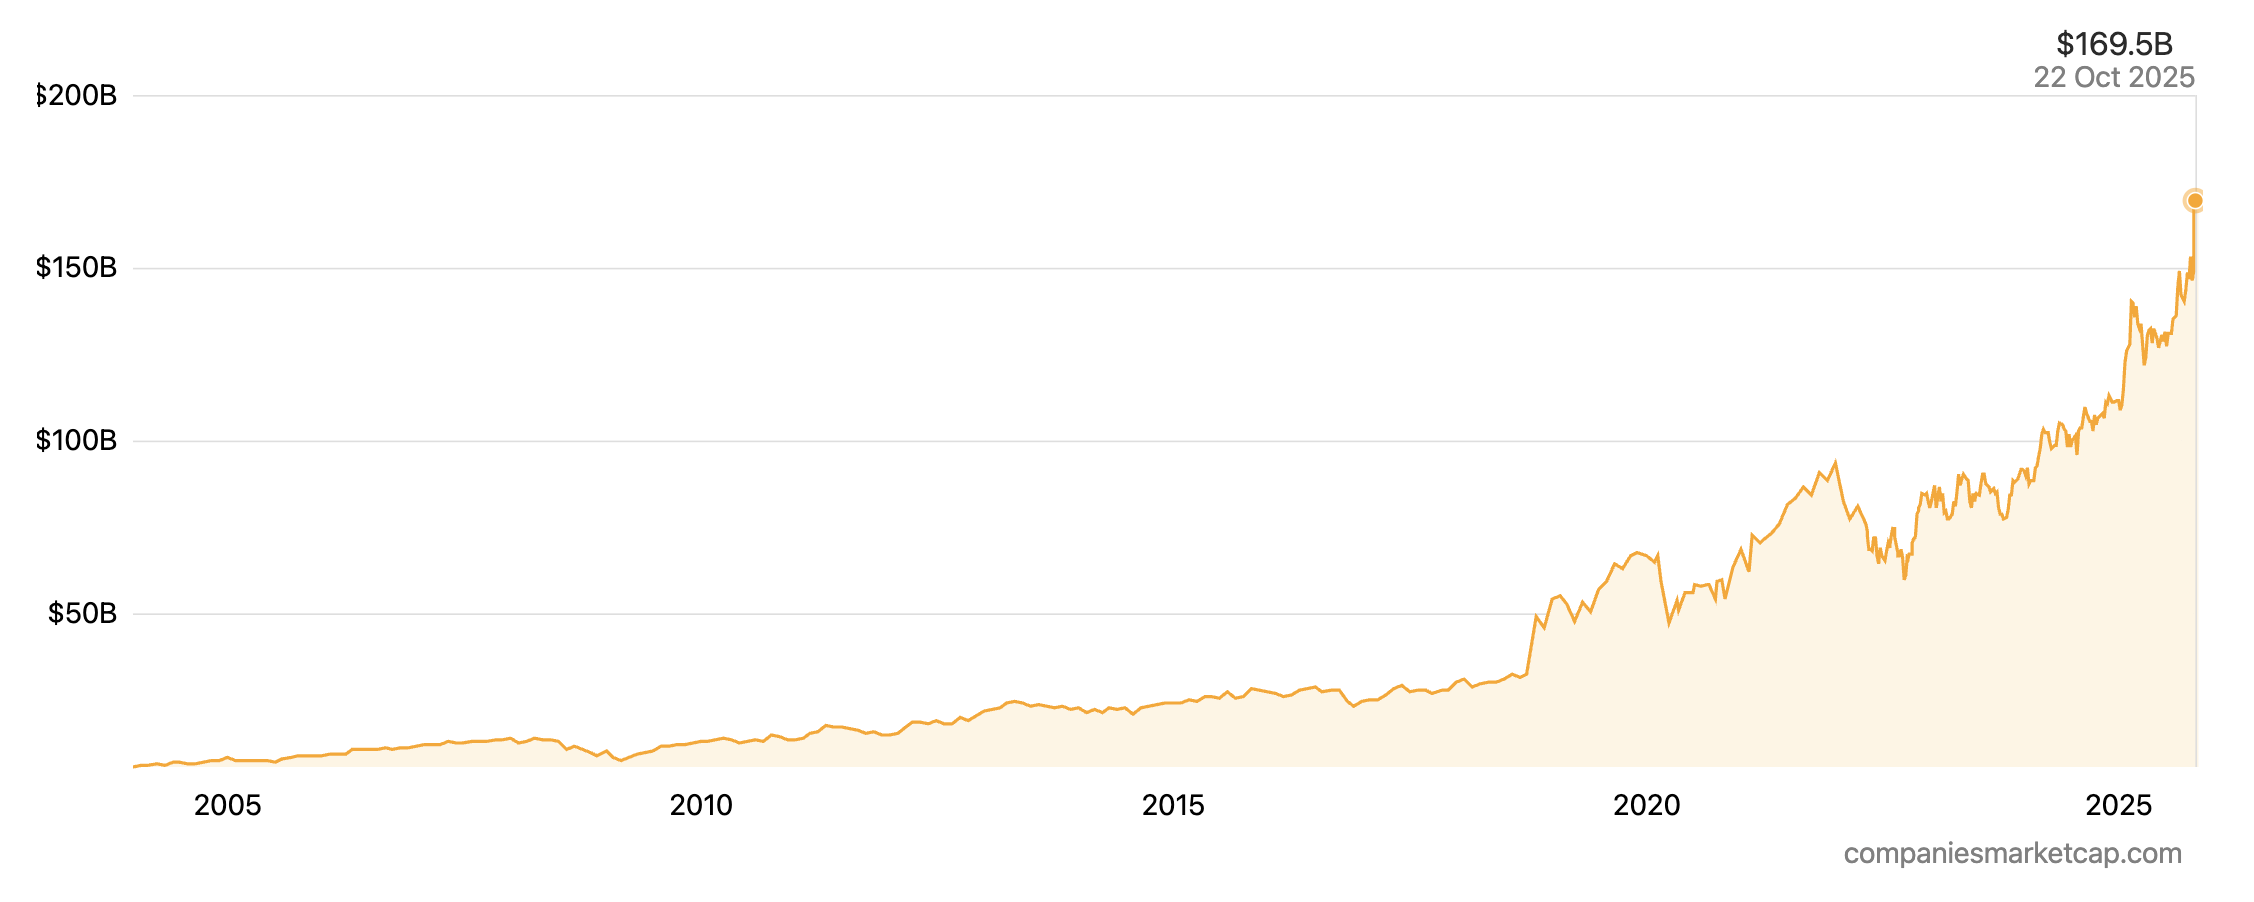
With a market capitalization of approximately $168 billion as of mid-October 2025, EssilorLuxottica is firmly positioned among the top-tier global luxury and consumer goods companies.1 The company’s stock has performed exceptionally well, delivering a 5-year total return of approximately 126% to 168%.2 Its valuation reflects its dominant market position and future growth prospects, and it holds a generally positive consensus rating from financial analysts.3
The picture below shows the market capitalization history of Essilor Luxottica from 2003 to 2025.
Market cap history of Essilor Luxottica from 2003 to 2025
Source: Companies Market Cap.
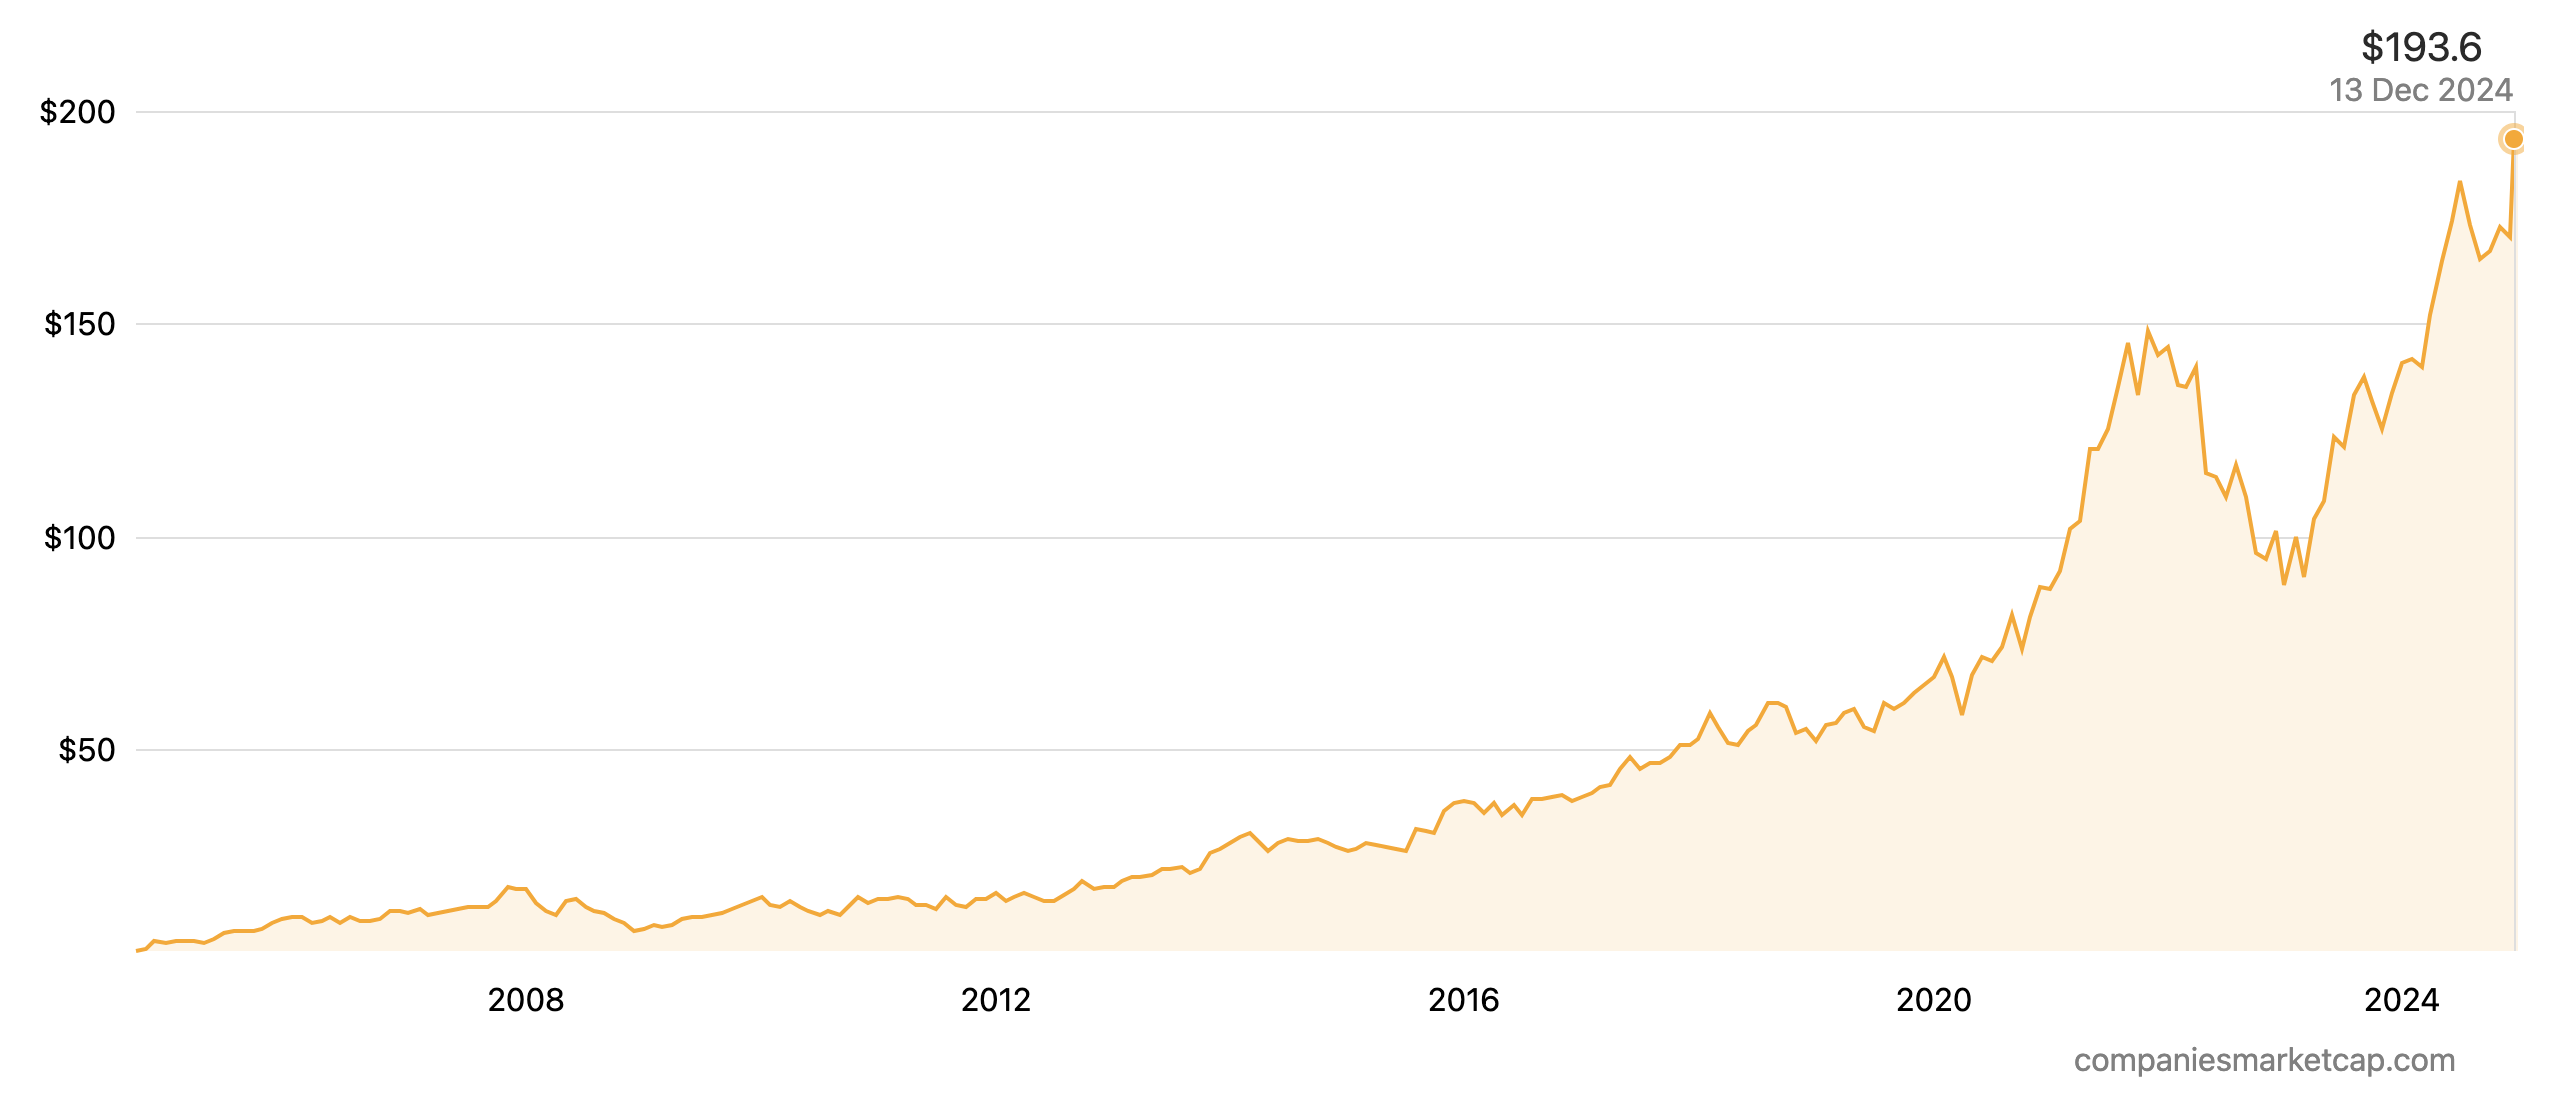
The picture below shows the Stock price history of Essilor Luxottica from 2000 to 2025.
Stock price history of Essilor Luxottica from 2000 to 2025
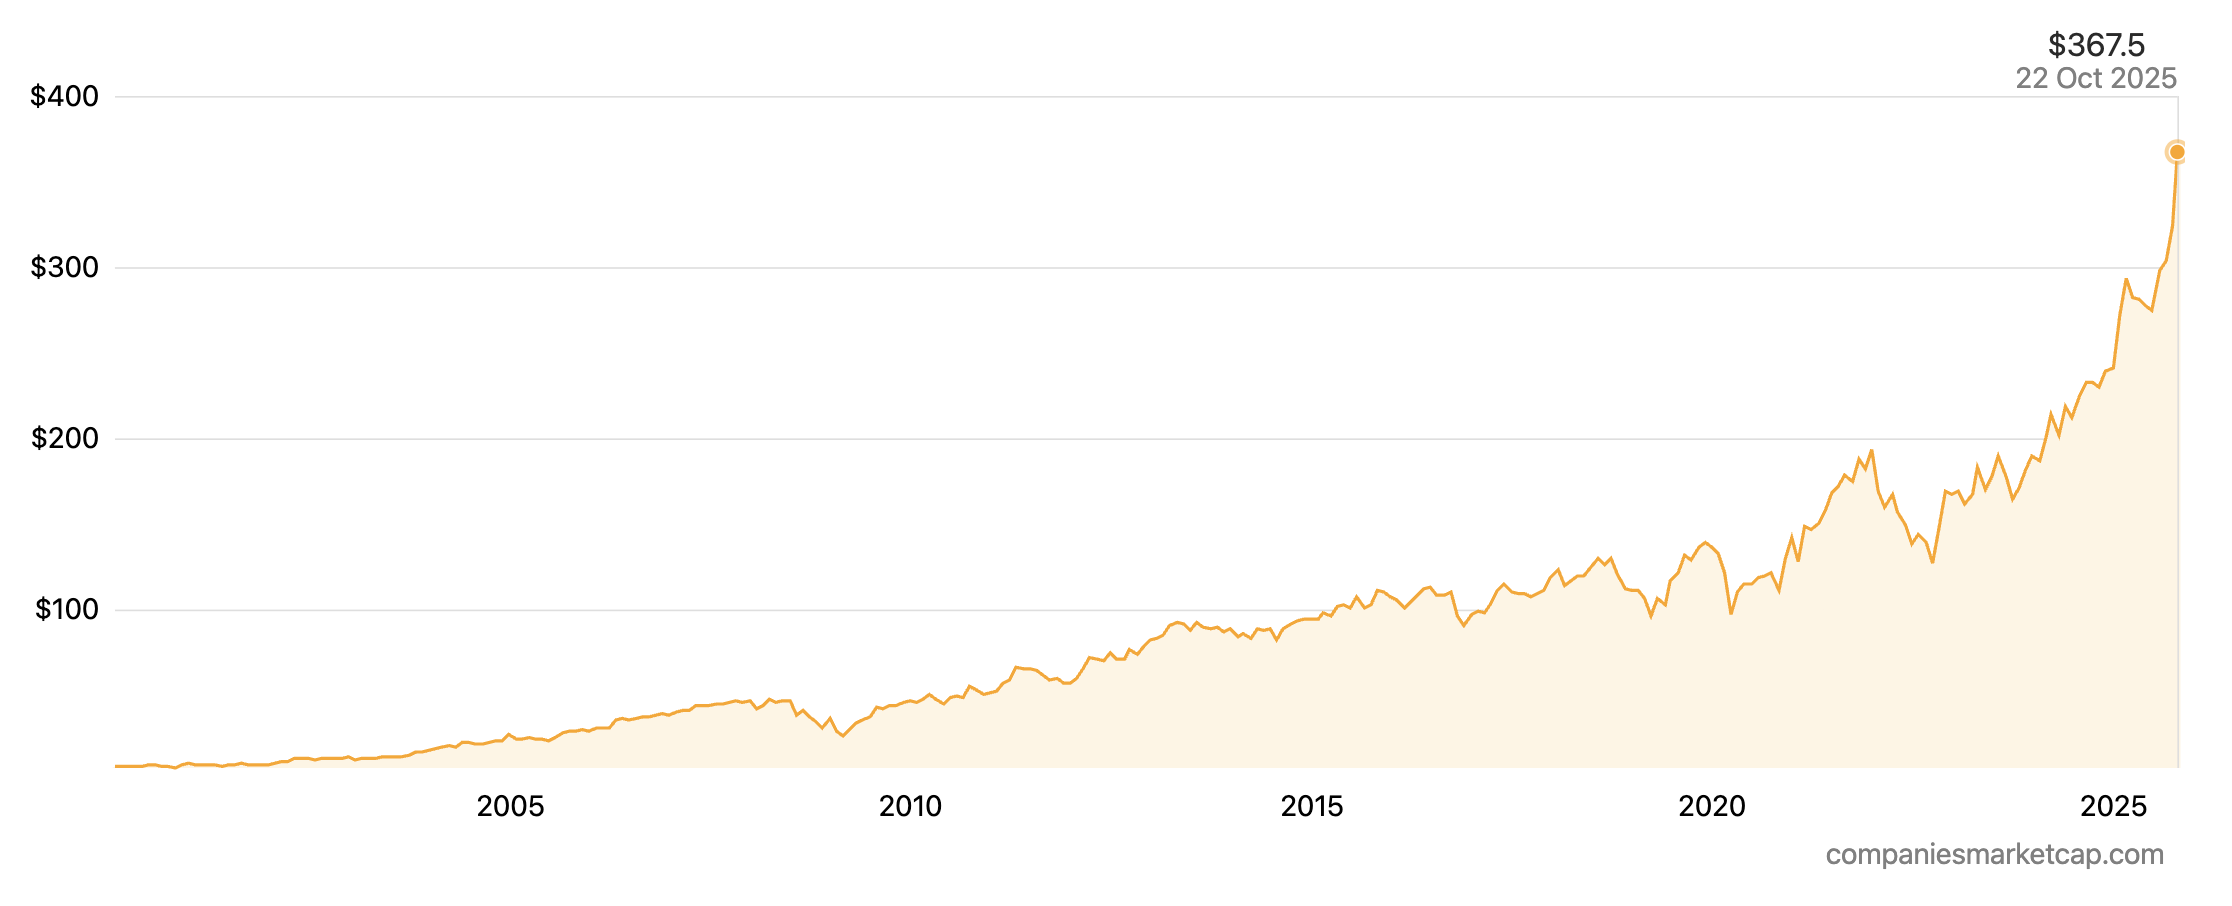
Source: Companies Market Cap.
EssilorLuxottica’s strategy is focused on blurring the lines between eyewear, technology, and healthcare. The company is moving beyond traditional vision correction to establish itself as a leader in the broader “wearable technology” ecosystem. The most prominent example of this is its collaboration with Meta on Ray-Ban | Meta smart glasses, which integrate live streaming and AI capabilities into an iconic fashion accessory. By leveraging the brand power of Ray-Ban and its vast retail network, EssilorLuxottica is positioned to succeed in a market where pure-play tech companies have previously struggled.
The company is also expanding into the hearing solutions market with its proprietary Nuance Audio technology, which integrates hearing assistance into fashionable eyewear, targeting the 1.2 billion consumers with mild to moderate hearing loss. This strategic pivot into “med-tech” and wearables, combined with its ongoing innovation in lens technology and its “Eyes on the Planet” sustainability program, positions EssilorLuxottica not just as an eyewear company, but as a comprehensive vision and hearing health technology platform with a powerful luxury and lifestyle component.
Conclusion
The global luxury market is in a state of dynamic evolution, shaped by the crosscurrents of economic uncertainty, demographic shifts, and technological disruption. The five firms profiled in this analysis—LVMH, Hermès, Richemont, Kering, and EssilorLuxottica—are not merely participants in this market; they are its primary architects, each with a distinct strategy for navigating the path forward.
Why should I be interested in this post?
Finance students should study the luxury industry and its giants to learn about resilient business models, exceptional pricing power, and how to value and manage intangible assets like brand equity. Analyzing this sector offers a deeper understanding of financial strategies that are less sensitive to economic downturns and achieve high profitability.
Related posts on the SimTrade blog
▶ Nithisha CHALLA Top 5 companies by market capitalization in the US
▶ Nithisha CHALLA Market Capitalization
▶ Nithisha CHALLA The NASDAQ index
Useful resources
Companies market cap Largest luxury companies by market cap
LVMH Key figures of LVMH
Essilor Luxottica Brand portfolio of Essilor Luxottica
Kering 2024 annual Kering results
Richemont Ranked: Richemont Maisons
About the author
The article was written in October 2025 by Nithisha CHALLA (ESSEC Business School, Grande Ecole Program – Master in Management (MiM), 2021-2024).