Extreme correlation

Extreme correlation

Shengyu ZHENG

In this article, Shengyu ZHENG (ESSEC Business School, Grande Ecole Program – Master in Management, 2020-2024) explains the concept of extreme correlation.

Background

In financial risk management, there is a concept that is often overlooked, the extreme correlation also known as tail dependence. Tail dependence reveals how extreme events in two variables are linked. The oversight could leave portfolios exposed to amplified risks during market turbulence. In this post, we will get to see the definition and implications of this concept.

Linear correlation and copula

As presented in the post on copula, using linear correlation to model the dependence structure between random variables poses many limitations, and copula is a more generalized tool that allows to capture a fuller picture of the dependence structure.

Let’s recall the definition of copula. A copula, denoted typically as C∶[0,1]d→[0,1] , is a multivariate distribution function whose marginals are uniformly distributed on the unit interval. The parameter d is the number of variables. For a set of random variables U1, …, Ud with cumulative distribution functions F1, …, Fd, the copula function C satisfies:

C(F1(u1),…,Fd(ud)) = ℙ(U1≤u1,…,Ud≤ud)

Here we introduce Student t-copula as an example, which will also be used as an illustration in the part of extreme correlation.

Tail dependence coefficient

The tail dependence coefficient captures the dependence level of a bivariate distribution at its tails. Let’s denote X and Y as two continuous random variables with continuous distribution F and G respectively. The (upper) tail dependence coefficient between X and Y is defined as:

with the limit of λU∈[0,1]

We can conclude that the tail dependence coefficient between two continuous random variables is a copula property, and it remains invariant with strict increasing transformations of the two random variables.

If λU∈(0,1], X and Y are considered asymptotically dependent in their (upper) tail. If λU=0, X and Y are considered asymptotically independent in their (upper) tail.

It is important to note that the independent of X and Y implies that λU=0, but the converse is not necessarily true. λU describes only the dependence level at the tails.

Examples of extreme correlation

Longin and Solnik (2001) and Gkillas and Longin (2019) employ the logistic model for the dependence function of the Gumbel copula (also called the Gumbel-Hougaard copula) for Fréchet margins, as follows:

This model contains the special cases of asymptotic independence and total dependence. It is parsimonious, as we only need one parameter to model the bivariate dependence structure of exceedances, i.e., the dependence parameter α with 0<α≤1. The correlation of exceedances ρ (also called extreme correlation) can be computed from the dependence parameter α of the logistic model as follows: ρ= 1-α^2. The special cases where α is equal to 1 and α converges towards 0 correspond to asymptotic independence, in which ρ is equal to 0, and total dependence, in which ρ is equal to 1, respectively (Tiago de Oliveira, 1973).

Related posts on the SimTrade blog

About extreme value theory

   ▶ Shengyu ZHENG Extreme Value Theory: the Block-Maxima approach and the Peak-Over-Threshold approach

   ▶ Shengyu ZHENG Optimal threshold selection for the peak-over-threshold approach of extreme value theory

   ▶ Gabriel FILJA Application de la théorie des valeurs extrêmes en finance de marchés

Useful resources

Academic resources

Gkillas K. and F. Longin (2018) Is Bitcoin the new digital Gold?, Working paper, ESSEC Business School.

Longin F. (2016) Extreme events in finance: a handbook of extreme value theory and its applications Wiley Editions.

Longin F. and B. Solnik (2001) Extreme Correlation of International Equity Markets, The Journal of Finance, 56, 649-676.

Zeevi A. and R. Mashal (2002) Beyond Correlation: Extreme Co-Movements between Financial Assets. Available at SSRN: https://ssrn.com/abstract=317122

Other resources

Extreme Events in Finance

Rieder H. E. (2014) Extreme Value Theory: A primer (slides).

About the author

The article was written in January 2024 by Shengyu ZHENG (ESSEC Business School, Grande Ecole Program – Master in Management, 2020-2024).

Optimal threshold selection for the peak-over-threshold approach of extreme value theory

Optimal threshold selection for the peak-over-threshold approach of extreme value theory

Shengyu ZHENG

In this article, Shengyu ZHENG (ESSEC Business School, Grande Ecole Program – Master in Management, 2020-2024) explains the different methods used to select the threshold for the tails for the peak-over-threshold (POT) approach of extreme value theory (EVT).

The Peak-over-Threshold threshold approach

As we have seen in the previous post, Extreme Value Theory: the Block-Maxima approach and the Peak-Over-Threshold approach, there are two main paradigms to model the extreme behavior of a random variable (say asset returns in finance).

Amongst the two, the POT approach makes use of all data entries above a designated high threshold u. The threshold exceedances could be fitted into a generalized Pareto distribution (GPD):

Illustration of the POT approach

Threshold selection

Along with the POT approach arises the issue of threshold selection to define when the tail of the distribution starts. Estimating parameters for extreme value distributions becomes more stable when based on exceedances beyond an appropriate threshold. In the tail, the distribution may behave more consistently, leading to more reliable parameter estimates. This stability is crucial for making accurate predictions about extreme events.

An efficient method for the computation of an optimal threshold optimizes the trade-off between bias and inefficiency (Jansen and de Vries, 1991). As explained by Gkillas, Katsiampa, and Longin (2021): “on the one hand, a low threshold value induces an estimation bias, due to observations not belonging to the distribution tails considered as exceedances. On the other hand, a high threshold value leads to inefficient estimates with high standard errors, due to the reduced size of the estimation sample”.

Methods of optimal threshold selection

There are several methods to this issue. We explain in detail the methods based on the plot analysis and Monte Carlo simulations. We also briefly discuss other methods: bootstrapping techniques, bias reduction, etc.

Plot analysis

The most known plot for deriving the optimal threshold is the Hill plot.

The Hill estimator is commonly used to estimate the tail index of a generalised Pareto distribution and to estimate the optimal threshold. The tail index is a measure of the heaviness of the tails of a distribution. According to the statistical order X_(1:n), the Hill estimator for the tail index α=1/ξ is given by

with k being the highest statistical order.

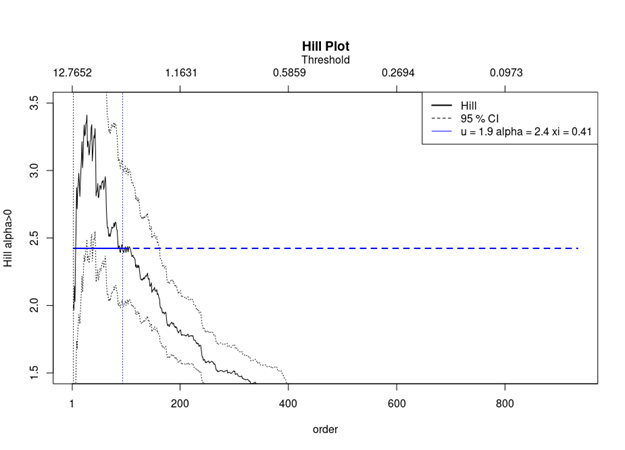
The Hill plot is a graphical representation of the Hill estimators. In a Hill plot, the sample data is sorted in descending order, and the plot shows the logarithm of the sample quantiles against their corresponding order statistics. The slope of the line in the plot provides information about the tail behaviour of the distribution. What we are looking for here is the point from where the plot starts to stabilise.

Here we have an example of a Hill Plot of the logarithmic losses of the S&P 500 index.

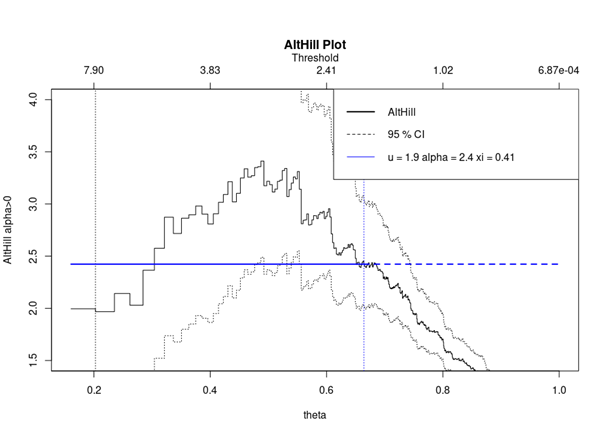
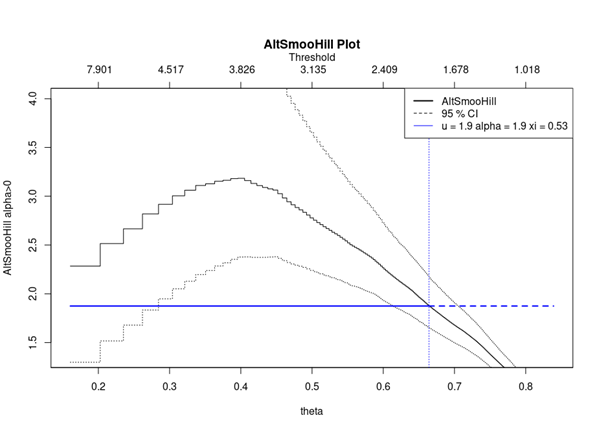
There exist alternative plots based on the standard Hill plot, such as Alternative Hill plot, smoothed Hill plot. These two alternatives are available in the evmix R package.

Monte Carlo simulations

Jansen and de Vries (1991) proposed a Monte Carlo simulation method as follows. Imagine we would like to study the behaviour of a random variable at its extreme. First a family of specific models for this random variable is assumed (say the family of Student-t distributions). Based on the assumption of a specific distribution, Monte Carlo simulations are launched. For each simulation, the optimal number of return exceedances is computed, and this corresponds to the optimal threshold. The mean squared error (MSE) of simulated optimal numbers of return exceedances is then calculated. With this result, we can derive the optimal threshold for the observed series. As Theil (1971) explains, the MSE criterion takes into account of a double effect of bias and inefficiency. The MSE of S simulated observations of the estimator of a parameter X could be represented as:

Where X̄ represents the mean of S simulated observations. The first part on the right of the equation represents the bias, and the second part represents the inefficiency.

Other methods

There are many other methods based on various mechanisms, such as bootstrap and bias reduction. The tea package in R has in place multiple methods for estimating optimal thresholds from a series of scholars. In the R file that can be downloaded below, we can find various examples. For instance, the “danielsson” function from the package is based on a double bootstrap procedure for choosing the optimal sample fraction. (Danielsson et al., 2001). The “DK” function is a Bias-based procedure for choosing the optimal threshold. (Drees & Kaufmann, 1998)

Download R file to model extreme behavior of the index

You can find below an R file to calculate optimal threshold for the POT approach.

Download R file

Related posts about extreme value theory

   ▶ Shengyu ZHENG Extreme Value Theory: the Block-Maxima approach and the Peak-Over-Threshold approach

   ▶ Gabriel FILJA Application de la théorie des valeurs extrêmes en finance de marchés

Useful resources

Academic resources

Danielsson, J. and Haan, L. and Peng, L. and Vries, C.G. (2001). Using a bootstrap method to choose the sample fraction in tail index estimation. Journal of Multivariate analysis, 2, 226-248.

Drees H. and E. Kaufmann (1998) Selecting the optimal sample fraction in univariate extreme value estimation. Stochastic Processes and their Applications, 75(2), 149–172.

Embrechts P., C. Klüppelberg and T. Mikosch (1997) Modelling Extremal Events for Insurance and Finance.

Embrechts P., R. Frey and A.J. McNeil (2022) Quantitative Risk Management, Princeton University Press.

Gumbel, E. J. (1958) Statistics of extremes New York: Columbia University Press.

Jansen D. and C. de Vries (1991) On the Frequency of Large Stock Returns: Putting Booms and Busts into Perspective, The Review of Economics and Statistics, 73, 18-24.

Longin F. (2016) Extreme events in finance: a handbook of extreme value theory and its applications Wiley Editions.

Longin F. and B. Solnik (2001) Extreme Correlation of International Equity Markets, The Journal of Finance, 56, 649-676.

Other resources

Extreme Events in Finance

Rieder H. E. (2014) Extreme Value Theory: A primer (slides).

About the author

The article was written in December 2023 by Shengyu ZHENG (ESSEC Business School, Grande Ecole Program – Master in Management, 2020-2024).

Securities and Exchange Board of India (SEBI)

Securities and Exchange Board of India (SEBI)

Nithisha CHALLA

In this article, Nithisha CHALLA (ESSEC Business School, Grande Ecole – Master in Management (MiM), 2021-2024) presents the Securities and Exchange Board of India (SEBI) which is empowering markets and ensuring integrity.

Introduction to SEBI

The Securities and Exchange Board of India (SEBI) serves as a regulator over the country’s financial markets and has a significant impact on how the economy of the country is shaped. Established in 1988, SEBI’s regulatory authority is responsible for a broad range of activities, including promoting open and honest market processes and protecting investors’ rights and interests. Protecting investors’ rights and interests is SEBI’s main goal. Market manipulation, insider trading, and other fraudulent activities are also in the scope of the regulatory authority. Investors receive reliable and timely information to help them make informed decisions thanks to SEBI’s strict standards and requirements for listed companies on Indian exchanges. This emphasis on openness and disclosure encourages investor trust, which increases market activity.

Logo of Securities and Exchange Board of India.  Logo of Securities and Exchange Board of India
Source: SEBI.

Market development and innovation

The purpose of SEBI goes beyond simple regulation; it also actively promotes market expansion and innovation. SEBI has broadened the investment options available to both institutional and individual investors by introducing mutual funds, derivatives, and alternative investment vehicles. These cutting-edge financial products have expanded the investment landscape and drawn institutional investors from abroad, helping India integrate into the world financial markets.

A barrier to malpractices is SEBI’s effective market surveillance systems. To identify and stop market manipulation, SEBI uses an integrated surveillance system to track trade patterns, price changes, and unusual activity. Its ability to punish offenders shows how committed it is to upholding market integrity.

Global Integration and Investor Confidence

Market-friendly policies and international acclaim have been won by SEBI’s regulatory initiatives. Increased foreign direct investment, portfolio investment, and institutional investor activity in Indian markets are the results of this. India’s reputation as a desirable investment location is greatly influenced by SEBI’s role in establishing a favorable investment climate.

While SEBI’s achievements are noteworthy, it faces challenges such as the rapid pace of technological advancements, ensuring effective implementation of regulations, and maintaining a balance between innovation and investor protection. Moreover, as the financial markets evolve, SEBI’s role in regulating emerging areas like cryptocurrencies and digital assets becomes increasingly critical.

Conclusion

The distinctiveness of SEBI rests not only in its ability to regulate, but also in its innovative projects that go beyond conventional regulatory functions. The SEBI stands as a testament to India’s regulatory foresight, from empowering investors through cutting-edge processes to stimulating innovation while safeguarding investor protection. Its dedication to sustainability, education, and technology-driven surveillance distinguishes it as a regulatory pathfinder that keeps up with changes in the financial world.

Why should I be interested in this post?

For a Master in Management student like me, delving into SEBI’s operations provides a real-world context to the theories we study. Understanding SEBI’s unique initiatives, such as the Regulatory Sandbox (a framework that allows businesses, especially in the financial technology sector, to test innovative products, services, business models in a controlled environment) and its emphasis on sustainability, offers insights into modern regulatory challenges and innovative solutions. Exploring SEBI’s role in investor protection and market integrity enhances my grasp of ethical governance and responsible business practices. SEBI’s dynamic approach aligns with the multidisciplinary nature of my studies, allowing me to connect theoretical knowledge with practical implications in the financial world.

Related posts on the SimTrade blog

   ▶ All posts about financial techniques

   ▶ Akshit GUPTA Securities and Exchange Commission (SEC)

   ▶ Akshit GUPTA Autorité des Marchés Financiers (AMF)

Useful resources

SEBI What’s new in SEBI?

About the author

The article was written in January 2024 by Nithisha CHALLA (ESSEC Business School, Grande Ecole – Master in Management, 2021-2024).

My professional experience as a credit analyst at Targobank

My professional experience as a credit analyst at Targobank

Matthieu MENAGER

In this article, Matthieu MENAGER (ESSEC Business School, Bachelor in Business Administration (BBA), 2017-2021) shares his professional experience as credit analyst at Targobank (a subsidiary of the Crédit Mutuel group).

The Company

Targobank, a subsidiary of the Crédit Mutuel group, is a German bank operating mainly in the retail and corporate customer segments. Founded in 1926, it is one of the major players in Germany. With €2.6 billion in equity (8.6% of its total liabilities), Targobank AG generated €1.2 billion in income and interest in 2021.

Targobank has 7,000 employees in 2022.

The Crédit Mutuel Alliance Fédérale group is one of the largest and financially strongest banks in Europe (18 billion euros in interest and similar income in 2022), with a very good credit rating (S&P: A). It combines the advantages of a cooperative bank with strong local roots with those of an international bank, Crédit Industriel et Commercial.

Logo of the company.
Logo of  Targobank
Source: Targobank.

What is really a credit analyst?

Credit analyst is an important position in the organization of a bank. It generally belongs to the back office (in my case I was in the front office). This department determines a company’s ability to repay one or more different types of loan (syndicated loan, current account overdraft, club deal, etc.) and the degree of risk for the bank. It carries out a financial, macroeconomic, microeconomic, CSR (Corporate Social Responsibility) and overall analysis of all the criteria that can have an impact on repayment capacity.

In addition to carrying out a complete analysis on established customers and prospects (potential new customers), the credit analyst must also ensure that the systems are properly maintained (internal rating commitments, updating the group’s status, etc.). This is a task that should not be neglected, as it allows all the other divisions to be informed about the situation of each agency.

What were my missions in the VIE ?

I arrived in June 2022 as a VIE (Volontariat International en Entreprise in French) for a period of 1 year and 6 months (I’ve extended by 4 months until April 2024). My objective at Targobank was initially, to look after the 42 existing customer files at our Frankfurt branch by carrying out each year either a simple annual review (simple review of our borrower’s group without any major decisions), a renewal (complete review and renewal of one or more lines that are due to expire at the time of the administrative deadline for the file), or a new application (complete review and new application(s) in addition to the review or renewal of other existing lines).

We offer companies every possible type of loan (traditional loans, facilities, leasing, factoring, SDM, or even guarantees). I also analyze certain prospects to determine whether they could become our customers. This analysis can have several objectives: either the customer is solid and profitable or belongs to a group with which we would like to have a future commercial relationship.

Finally, it is also my task to keep the various files on our internal systems up to date. I’m in constant contact with the Back Office to obtain the various documents needed to carry out internal tasks. These tasks may include filling in financial data, listing the various commitments, updating the company’s status, etc.

Required skills and knowledge

To be a credit analyst, you need several hard skills. You need to know how to use Excel and all the internal programs (we have a few days to familiarize ourselves with the systems), you need to be able to produce complete and concise analyses (financial, risk, data, etc.), you need to have a good grasp of accounting and be able to draw up financial forecasts. In my personal case (I work in Germany), I also need to be able to speak several languages (German, English and French).

Soft skills are just as important as hard skills. As a credit analyst, you have to turn in reports on time. You have to be meticulous about every detail so as not to mislead those who are going to validate the reports (commitments can amount to €20 million). Another skill is knowing how to collaborate and communicate with your team in order to provide the best file based on the various documents obtained. Finally, it is important to manage time and stress so as not to make mistakes when sending the report to the committee.

What I have learnt

During my almost two years in banking, I was able to broaden my knowledge of the world of finance. I worked in many different sectors and was able to get familiar with several other finance-related jobs (leasing, back office, etc.). My analysis of different financial situations has only improved and I’m now very comfortable with technical terms and their repercussions on a company. I can quickly form an initial impression of a group by carrying out a simple financial and market analysis. I’m also increasingly careful in my research to avoid being misled by a group’s appearance (some groups may claim to be doing well but are actually in decline).

My communication (email exchanges, Skype, Meeting Calls) has also improved. I try to give clear, concise answers so that I don’t get bogged down in a flood of emails and so that my interlocutor and I waste as little time as possible.

I’ve also acquired knowledge of the different markets (trends, clients, best manufacturers, etc.) in which I’ve worked (construction, pharmaceuticals, automotive, etc.). This is a quality that could be very useful to me in any field in which I might later wish to work.

Financial concepts related my internship

Group Annual Report

A group’s annual report is essential to its analysis. It must or may be published depending on a number of conditions and the surrounding standards (IFRS or HGB in Germany). The annual report provides a detailed picture of the group’s profitability (income statement), financial strength (balance sheet) and liquidity (cash flow statement). Annual reports also include a market analysis and financial forecasts (PLAN and FORECAST).

Environmental Social Governance (ESG)

Environmental Social Governance (ESG) is playing an increasingly important role in finance. For some time now, I have had to carry out an internal analysis of these 3 non-financial factors for each group and assign a rating, which can have an impact on the increase or decrease in financial interest on each commitment. The group must pay attention to its carbon footprint, diversity within the group, and the health and well-being of its employees.

Covenant

A covenant is a clause in a contract that allows the loan to be repaid if targets are not met. Covenants often relate to financial aspects and require the Group to send a Compliance Certificate, which verifies whether or not the objectives have been met and which is to be delivered on the date specified in the contract. Examples of covenants I have dealt with are: leverage >3.0x; Maintain equity >= 30%; or Gearing <100%.

Why should I be interested in this post?

If you’re interested in the world of finance, the position of credit analyst will undoubtedly be very popular. You’ll be exposed to several areas of finance, you’ll acquire a lot of knowledge and skills, and you’ll be responsible for monitoring several files. It’s a job that requires a lot of qualities and rigor, but also a lot of experience and knowledge. You’ll be doing financial analysis, macroeconomic analysis, microeconomic analysis, ratings, reports, simplified excel sheets and lots of other tasks.

I’d highly recommend the job and I’d advise starting out in a banking institution. It will be easier to get into the swing of things in a bank because you have less risk-averse credits. You could then consider joining an investment fund, where the decisions taken will have greater importance.

Related posts on the SimTrade blog

   ▶ All posts about Professional experiences

   ▶ Arthur EVERARD My experience as a Real Estate Analyst at Eaglestone

   ▶ Aamey MEHTA My experience as a credit analyst at Wells Fargo

   ▶ Bijal GANDHI Credit Rating

   ▶ Raphaël ROERO DE CORTANZE Credit Rating Agencies

   ▶ Jayati WALIA Credit risk

Useful resources

Targobank

Crédit Mutuel

About the author

The article was written in January 2024 by Matthieu MENAGER (ESSEC Business School, Bachelor in Business Administration (BBA), 2017-2021).