

In this article, Youssef LOURAOUI (Bayes Business School, MSc. Energy, Trade & Finance, 2021-2022) presents the Security Market Line (SML), a key concept in asset pricing derived from the Capital Asset Pricing Model (CAPM).
This article is structured as follows: we first introduce the concept of Security Market Line (SML). We then present the mathematical foundations of the SML. We finish by presenting an investment strategy that can be implemented relying on the SML.
Security Market Line
The SML reflects the risk-return combinations accessible in the capital market at any given time for all risky assets. Investors would choose investments based on their risk appetites; some would only consider low-risk investments, while others would welcome high-risk investments. The SML is derived from the Capital Asset Pricing Model (CAPM), which describes the trade-off between risk and expected return for efficient portfolios.
The expected relationship between risk and return is depicted in Figure 1. It demonstrates that as perceived risk increases, investors’ required rates of return increase.
Figure 1. Security Market Line.
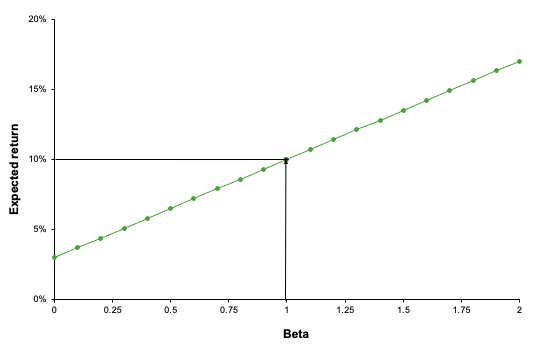
Source: Computation by the author.
Under the CAPM framework, all investors will choose a position on the capital market line by borrowing or lending at the risk-free rate, since this maximizes the return for a given level of risk. Whereas the CML indicates the rates of return of a specific portfolio, the SML represents the risk and return of the market at a given point in time and indicates the expected returns of individual assets. Also, while the measure of risk in the CML is the standard deviation of returns (total risk), the measure of risk in the SML is the systematic risk, or beta. Figure 2 depicts the SML line combined with four different assets. Asset A and B are above the SML line, which implies that they are overvalued. Asset C and D are below the SML which implies that they are undervalued. From Figure 2, we can implement an investment strategy by going long if the asset or portfolio lies under the SML and going short if the asset or portfolio is greater than the SML.
Figure 2. Security Market Line with a plot of different assets.
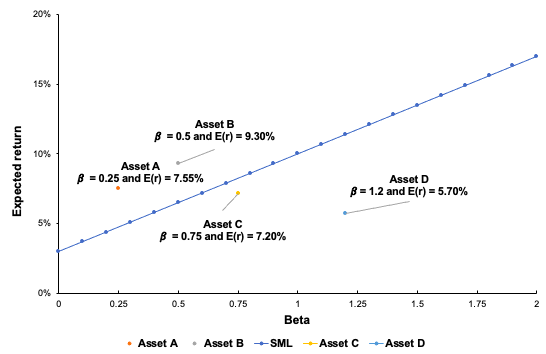
Source: Computation by the author.
Mathematical foundation
The SML plots an individual security’s expected rate of return against systematic, undiversifiable risk. The risk associated with an individual risky security is determined by the volatility of the security’s return, not by the market portfolio’s return. Individual risky securities bear a proportional share of the systematic risk. The only risk that an investor should be compensated for is systematic risk, which cannot be neutralized through diversification. This risk is quantified using the beta, which refers to a security’s sensitivity to market fluctuations. The slope of the SML is equal to the market risk premium and reflects the risk-reward trade-off at a particular point in time. We can define the line of the SML as:
![]()
Mathematically, we can deconstruct the SML as:
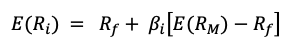
Where
- E(Ri) represents the expected return of asset i
- Rf is the risk-free interest rate
- βi measures the systematic risk of asset i
- E(RM) represents the expected return of the market
- E[RM – Rf] represents the market risk premium.
Beta and the market factor
William Sharpe (1964), John Lintner (1965), and Jan Mossin (1966) independently developed the Capital Asset Pricing Model (CAPM). The CAPM was a significant evolutionary step forward in capital market equilibrium theory because it allowed investors to value assets correctly in terms of risk. The CAPM makes a distinction between two forms of risk: systematic and specific risk. Systematic risk refers to the risk posed by the market’s basic structure, its participants, and all non-diversifiable elements such as monetary policy, political events, and natural disasters. By contrast, specific risk refers to the risk inherent in a particular asset and so is diversifiable. As a result, the CAPM solely captures systematic risk via the beta measure, with the market’s beta equal to one, lower-risk assets having a beta less than one, and higher-risk assets having a beta larger than one.
In the late 1970s, the portfolio management industry sought to replicate the market portfolio return, but as financial research advanced and significant contributions were made, it enabled the development of additional factor characteristics to capture additional performance. This resulted in the development of what is now known as factor investing.
Estimation of the Security Market Line
You can download an Excel file with data to estimate the Security Market Line.

Why should I be interested in this post?
The security market line is frequently used by portfolio managers and investors to determine the suitability of an investment product for inclusion in a portfolio. The SML is useful for determining whether a security’s expected return is favourable in comparison to its level of risk. The SML is frequently used to compare two similar securities that offer approximately the same rate of return to determine which one has the lowest inherent market risk in relation to the expected rate of return. Additionally, the SML can be used to compare securities of comparable risk to determine which one offers the highest expected return for that level of risk.
If you are a business school or university undergraduate or graduate student, this content will help you in broadening your knowledge of finance.
Related posts on the SimTrade blog
▶ Youssef LOURAOUI Portfolio
▶ Youssef LOURAOUI Systematic and specific risk
▶ Youssef LOURAOUI Beta
▶ Youssef LOURAOUI Factor Investing
▶ Youssef LOURAOUI Origin of factor investing
▶ Youssef LOURAOUI Markowitz Modern Portfolio Theory
▶ Jayati WALIA Capital Asset Pricing Model (CAPM)
▶ Youssef LOURAOUI Capital Market Line (CML)
Useful resources
Academic research
Drake, P. and Fabozzi, F., 2010. The Basics of Finance: An Introduction to Financial Markets, Business Finance, and Portfolio Management. John Wiley and Sons Edition.
Lintner, J. 1965a. The Valuation of Risk Assets and the Selection of Risky Investments in Stock Portfolios and Capital Budgets. The Review of Economics and Statistics 47(1): 13-37.
Lintner, J. 1965b. Security Prices, Risk and Maximal Gains from Diversification. The Journal of Finance, 20(4): 587-615.
Mossin, J. 1966. Equilibrium in a Capital Asset Market. Econometrica, 34(4): 768-783.
Reilly, R. K., Brown C. K., 2012. Investment Analysis & Portfolio Management, Tenth Edition.
Sharpe, W.F. 1963. A Simplified Model for Portfolio Analysis. Management Science, 9(2): 277-293.
Sharpe, W.F. 1964. Capital Asset Prices: A Theory of Market Equilibrium under Conditions of Risk. The Journal of Finance, 19(3): 425-442.
About the author
The article was written in November 2021 by Youssef LOURAOUI (Bayes Business School, MSc. Energy, Trade & Finance, 2021-2022).
2 thoughts on “Security Market Line (SML)”
Comments are closed.