Litecoin: Analysis of the Pioneering Cryptocurrency’s Impact on Digital Finance

 Snehasish CHINARA

In this article, Snehasish CHINARA (ESSEC Business School, Grande Ecole Program – Master in Management, 2022-2024) explains cryptocurrency Litecoin, shedding light on its impact and value propositions for digital finance.

Historical context and background

Litecoin, often referred to as the “silver to Bitcoin’s gold,” emerged in 2011 as one of the earliest altcoins, or alternative cryptocurrencies, following the launch of Bitcoin in 2009. It was created by Charlie Lee, a former Google engineer and Coinbase employee. Lee designed Litecoin with the intention of addressing some of the perceived limitations of Bitcoin, such as transaction speed and scalability.

One of the key innovations of Litecoin was its adoption of the Scrypt hashing algorithm instead of Bitcoin’s SHA-256 algorithm. This choice made Litecoin more accessible to individual miners using consumer-grade hardware, as it reduced the advantage of specialized mining equipment known as ASICs (Application-Specific Integrated Circuits). As a result, Litecoin initially gained popularity among miners and enthusiasts who sought a more democratic and decentralized mining ecosystem.

Litecoin also introduced a faster block generation time compared to Bitcoin, with new blocks being created approximately every 2.5 minutes instead of every 10 minutes. This faster block time enabled quicker transaction confirmations, making Litecoin more suitable for everyday transactions.

Over the years, Litecoin has established itself as one of the most prominent cryptocurrencies in the market, often considered a reliable and stable digital asset. Its longevity and consistent development have contributed to its reputation as a credible alternative to Bitcoin.

Litecoin’s journey has been marked by various milestones, including network upgrades, partnerships, and integrations into payment systems and exchanges. Despite facing competition from other cryptocurrencies and undergoing market fluctuations, Litecoin has maintained a strong community of supporters and continues to be actively traded and utilized for various purposes, including payments, remittances, and investment.

Litecoin Logo

Source: Litecoin

Figure 1. Key Dates in Litecoin History

Source: Yahoo! Finance.

Key features

    Scrypt Algorithm

    Unlike Bitcoin’s SHA-256 algorithm, Litecoin utilizes the Scrypt hashing algorithm for its proof-of-work consensus mechanism. This algorithm was chosen to enable faster block generation and to promote more decentralized mining by reducing the advantage of specialized mining hardware (Application-Specific Integrated Circuits (ASIC) versus consumer-grade hardware like standard PCs).

    Faster Block Time

    Litecoin has a target block time of approximately 2.5 minutes, compared to Bitcoin’s 10 minutes. This faster block time allows for quicker transaction confirmations, making Litecoin more suitable for everyday transactions.

    Higher Maximum Coin Supply

    Litecoin has a maximum coin supply limit of 84 million coins, four times the maximum supply of Bitcoin. This larger supply aims to facilitate more widespread adoption and usage while still maintaining scarcity.

    Segregated Witness (SegWit) Activation

    Litecoin was one of the first major cryptocurrencies to activate Segregated Witness (SegWit), a protocol upgrade aimed at improving transaction throughput and scalability. SegWit also paved the way for the implementation of the Lightning Network on Litecoin, enabling off-chain transactions for faster and cheaper payments.

    Atomic Swaps

    Litecoin has been at the forefront of implementing Atomic Swaps, a technology that allows for the trustless exchange of cryptocurrencies across different blockchains without the need for intermediaries like crypto platforms. This feature enhances interoperability and decentralization within the cryptocurrency ecosystem.

    Litecoin Improvement Proposals (LIPs)

    Similar to Bitcoin Improvement Proposals (BIPs), Litecoin has its own proposal system called Litecoin Improvement Proposals (LIPs). These proposals allow community members to suggest changes or improvements to the Litecoin protocol, fostering a transparent and collaborative development process.

Use cases

    Peer-to-Peer Payments

    Litecoin’s fast transaction confirmations and low fees make it suitable for peer-to-peer transactions. Users can quickly send and receive funds across the globe without relying on traditional banking systems, making Litecoin an efficient option for remittances and international payments.

    Online Purchases

    As of 2023, over 2,000 online merchants and service providers accept Litecoin as a form of payment globally. Litecoin’s transaction volume has steadily increased, with an average of over 100,000 transactions per day. In 2022, Litecoin processed over 35 million transactions, highlighting its growing use for everyday payments. Many online merchants and service providers accept Litecoin as a form of payment. There are over 5,000 cryptocurrency ATMs worldwide that support Litecoin, allowing users to buy and sell LTC with cash. Users can use Litecoin to purchase a wide range of goods and services, including electronics, clothing, digital products, and more.

    Micropayments

    Litecoin’s low transaction fees and fast processing times make it well-suited for micropayments, enabling users to make small transactions economically. This use case is particularly relevant for content creators, online tipping, and pay-per-view services.

    Cross-Border Transactions

    Litecoin’s borderless nature makes it an attractive option for cross-border transactions, as users can avoid the high fees and long processing times associated with traditional remittance services and bank transfers.

    Privacy Transactions

    While not as focused on privacy as some other cryptocurrencies like Monero or Zcash, Litecoin offers a degree of privacy through features like confidential transactions and the option to use privacy-enhancing wallets. This makes Litecoin appealing for users who prioritize privacy in their transactions.

Technology and underlying blockchain

Litecoin operates on a blockchain-based decentralized network, sharing many similarities with Bitcoin while incorporating several key technical differences. At its core, Litecoin’s blockchain serves as a distributed ledger that records all transactions made with its native cryptocurrency, LTC. One of the distinguishing features of Litecoin is its utilization of the Scrypt proof-of-work algorithm, which differs from Bitcoin’s SHA-256 algorithm. This algorithm was chosen to promote a more equitable mining process, allowing individuals to mine LTC using consumer-grade hardware and reducing the dominance of specialized mining equipment.

The Litecoin blockchain maintains a target block time of approximately 2.5 minutes, significantly faster than Bitcoin’s 10-minute block time. This faster block generation rate enables quicker transaction confirmations, making Litecoin well-suited for use in everyday transactions and enhancing its scalability. Additionally, Litecoin implemented Segregated Witness (SegWit) in 2017, a protocol upgrade aimed at improving transaction throughput and reducing network congestion by separating transaction signatures from transaction data.

Furthermore, Litecoin has experimented with technologies like the Lightning Network, a layer-2 scaling solution designed to facilitate instant and low-cost transactions by leveraging payment channels. This technology enables off-chain transactions that can be settled on the Litecoin blockchain, further enhancing its transaction speed and efficiency.

Supply of coins

Figure Figure 2. Litecoin Supply

Source: Yahoo! Finance.

Litecoin’s coin supply is governed by its protocol, which dictates the issuance rate and maximum supply limit. Unlike traditional fiat currencies that are subject to centralized control by governments and central banks, Litecoin operates on a decentralized network secured by blockchain technology. The issuance of new Litecoin coins occurs through a process called mining, where miners use computational power to validate transactions and add new blocks to the blockchain.

Litecoin employs a deflationary monetary policy, with a fixed issuance schedule that halves the block reward approximately every four years. Initially, the block reward was set at 50 Litecoins per block, but it reduces by half every 840,000 blocks. This process, known as “halving,” aims to curb inflation over time and maintain scarcity, similar to Bitcoin’s issuance schedule. As of now, the block reward stands at 12.5 Litecoins per block, and this rate will continue to halve periodically until the maximum supply of 84 million Litecoins is reached.

The predictable issuance schedule and maximum supply cap of Litecoin contribute to its scarcity and value proposition, aligning with principles of sound money and monetary decentralization. This transparent and algorithmic approach to coin issuance fosters confidence among users and investors, as it prevents arbitrary inflation and ensures the integrity of Litecoin’s monetary policy over the long term.

Historical data for Litecoin

How to get the data?

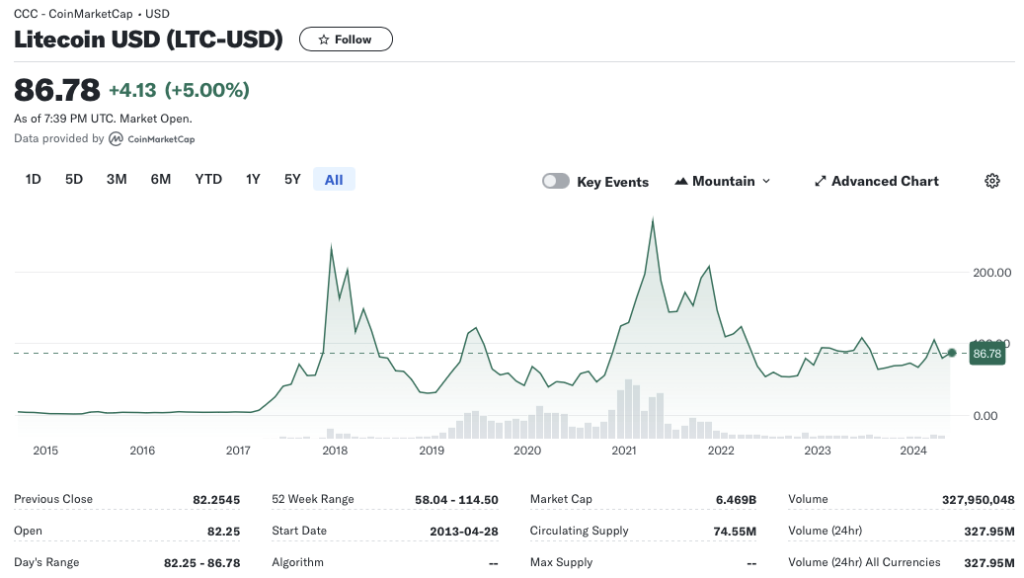
The Litecoin is popular cryptocurrency on the market, and historical data for the Litecoin such as prices and volume traded can be easily downloaded from the internet sources such as Yahoo! Finance, Blockchain.com & CoinMarketCap. For example, you can download data for Litecoin on Yahoo! Finance (the Yahoo! code for Litecoin is LTC-USD).

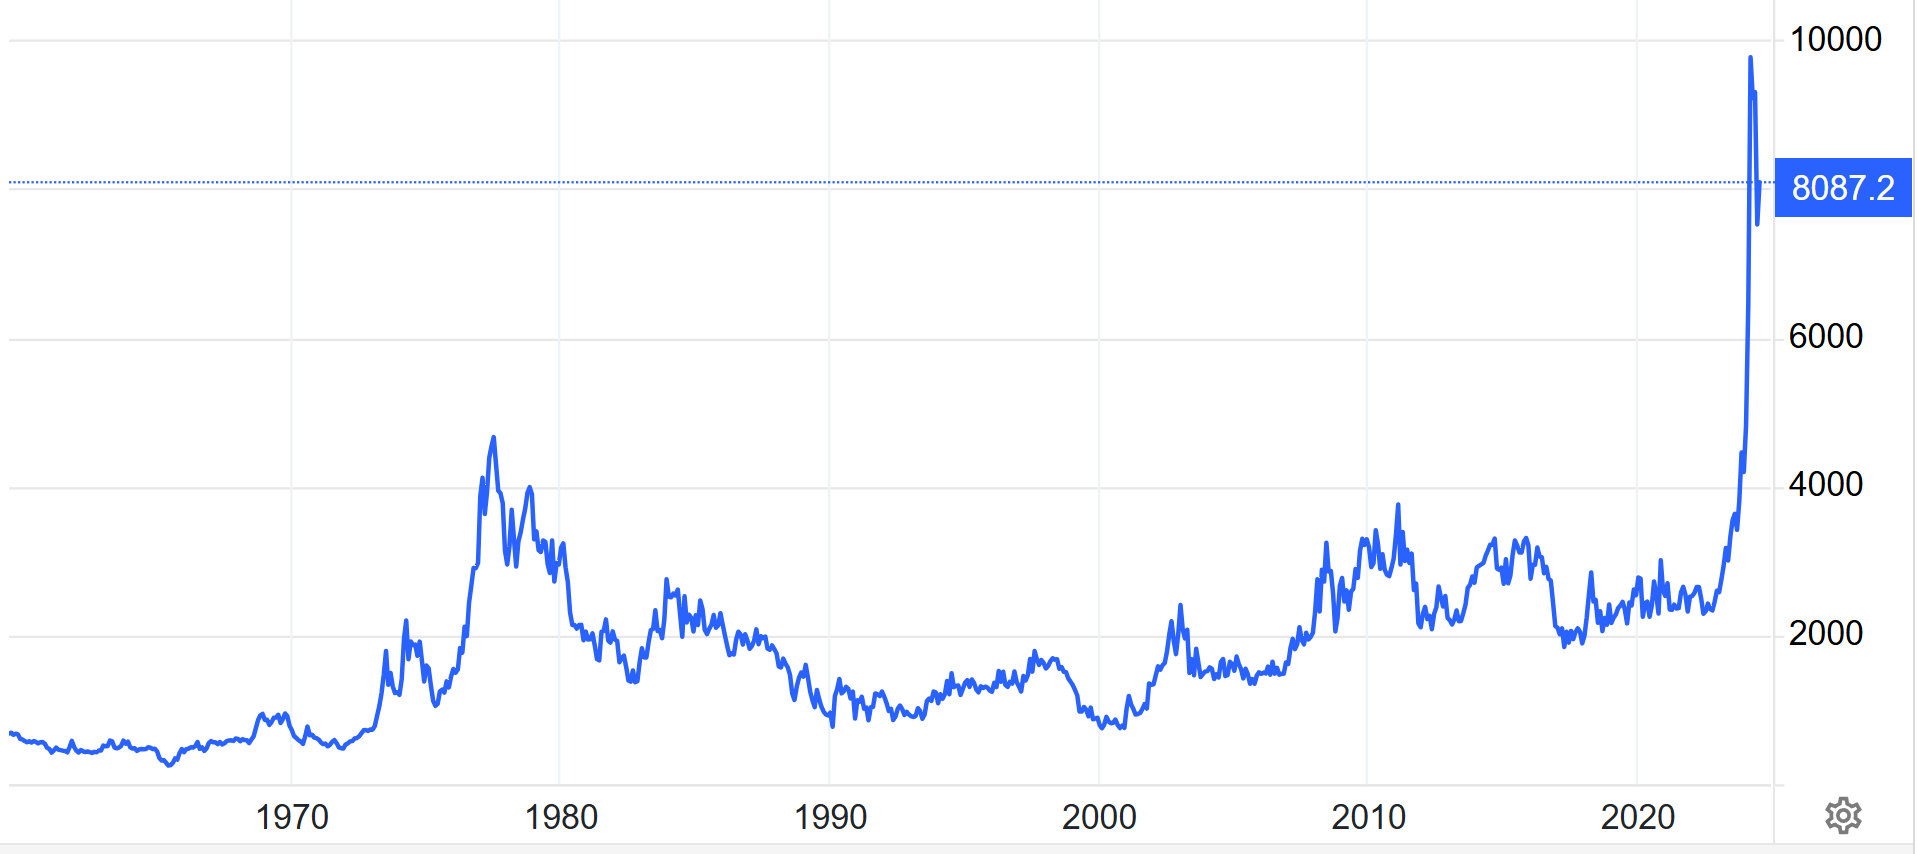
Figure Figure 3. Litecoin data
Source: Yahoo! Finance.

Historical data for the Litecoin market prices

Since its inception in 2011, Litecoin has undergone multiple bull and bear cycles, with its price witnessing remarkable volatility. In its early years, Litecoin’s market price remained relatively low, often trading at a fraction of Bitcoin’s value. However, as the cryptocurrency market gained traction and Litecoin’s utility as a fast and affordable payment method became recognized, its price began to appreciate steadily. The price of Litecoin experienced its first major surge in late 2013, reaching an all-time high above $50 USD. This rally was fueled by increased adoption, media attention, and speculation within the cryptocurrency community.

Following the 2013 peak, Litecoin underwent a prolonged bear market, with its price declining significantly over the subsequent years. However, Litecoin’s resilience and active development continued to attract interest, leading to periodic price rallies and subsequent corrections. The cryptocurrency market’s overall volatility, regulatory uncertainty, and competition from other digital assets also influenced Litecoin’s price movements during this period.

One of the most significant price rallies in Litecoin’s history occurred during the cryptocurrency bull market of 2017-2018. During this period, Litecoin’s price surged to unprecedented levels, reaching an all-time high of over $300 USD in December 2017. This rally was fueled by factors such as increased mainstream adoption, the integration of Segregated Witness (SegWit) and the Lightning Network, and speculative buying spurred by the broader cryptocurrency market rally.

Since the 2017-2018 bull market, Litecoin has experienced periods of both consolidation and volatility. While its price has not reached the same highs as during the peak of the bull market, Litecoin has maintained a relatively stable position within the cryptocurrency market, often regarded as one of the top digital assets by market capitalization. The ongoing development of Litecoin’s protocol, partnerships, and adoption efforts continue to shape its market prices, as investors and enthusiasts closely monitor its evolution in the broader cryptocurrency landscape.

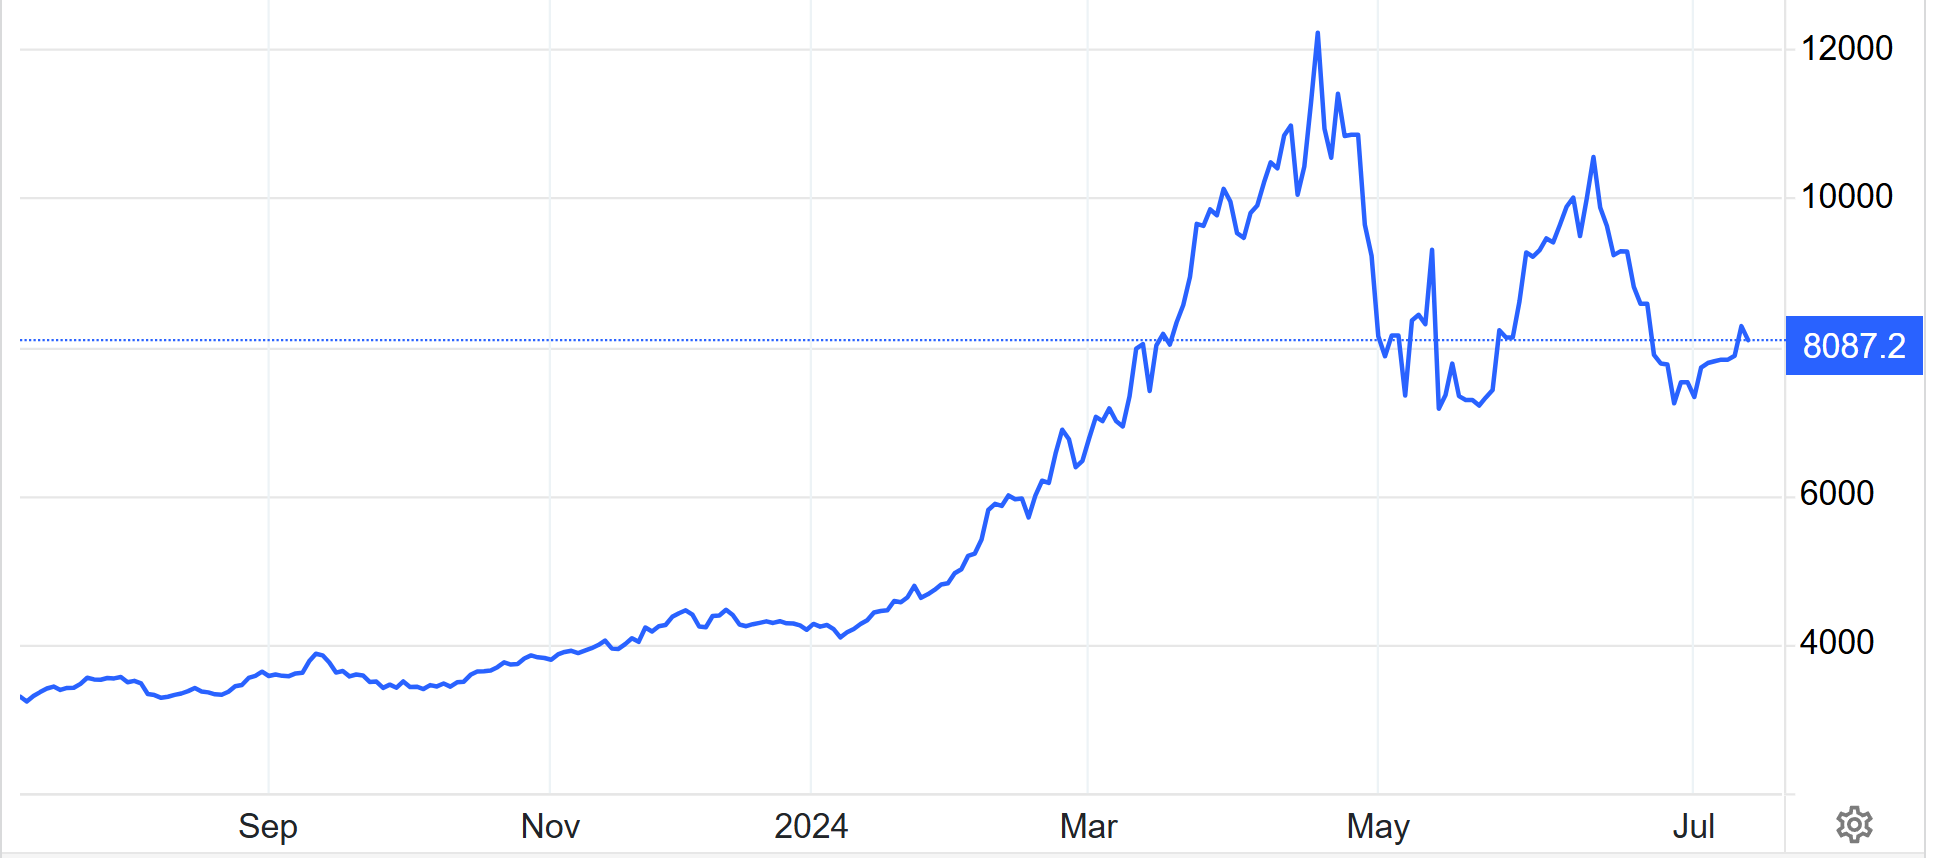
Figure 4 below represents the evolution of the price of Litecoin in US dollar over the period September 2014 – May 2024. The price corresponds to the “closing” price (observed at 10:00 PM CET at the end of the month).

Figure 4. Evolution of Litecoin price

Source: Yahoo! Finance.

R program

The R program below written by Shengyu ZHENG allows you to download the data from Yahoo! Finance website and to compute summary statistics and risk measures about the Litecoin.

Download R file

Data file

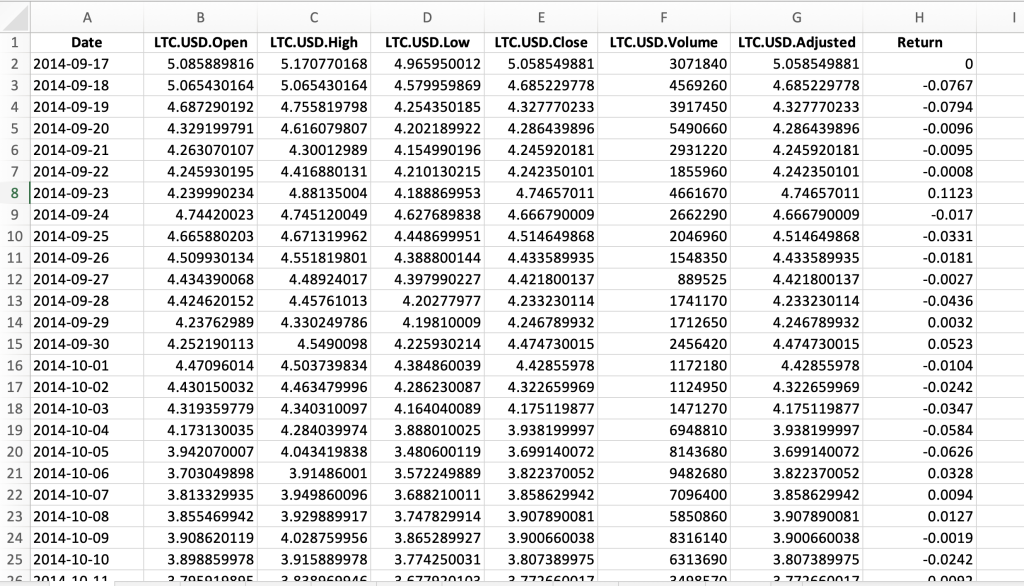
The R program that you can download above allows you to download the data for the Litecoin from the Yahoo! Finance website. The database starts on September 2014.

Table 1 below represents the top of the data file for the Litecoin downloaded from the Yahoo! Finance website with the R program.

Table 1. Top of the data file for the Litecoin
Source: computation by the author (data: Yahoo! Finance website).

Python code

You can download the Python code used to download the data from Yahoo! Finance.

Download the Python code for USD Coin data

Python script to download Litecoin historical data and save it to an Excel sheet:

import yfinance as yf

import pandas as pd

# Define the ticker symbol for Cardano “ADA-USD”

Litecoin_ticker = “LTC-USD”

# Define the date range for historical data

start_date = “2014-09-01”

end_date = “2024-04-30”

# Download historical data using yfinance

CLitecoin_data = yf.download(Litecoin_ticker, start=start_date, end=end_date)

# Create a Pandas DataFrame from the downloaded data

Litecoin_df = pd.DataFrame(Litecoin_data)

# Define the Excel file path

excel_file_path = ” Litecoin_historical_data.xlsx”

# Save the data to an Excel sheet

Litecoin_df.to_excel(excel_file_path, sheet_name=”Litecoin Historical Data”)

print(f”Data saved to {excel_file_path}”)

# Make sure you have the required libraries installed and adjust the “start_date” and “end_date” variables to the desired date range for the historical data you want to download.

Evolution of the Litecoin

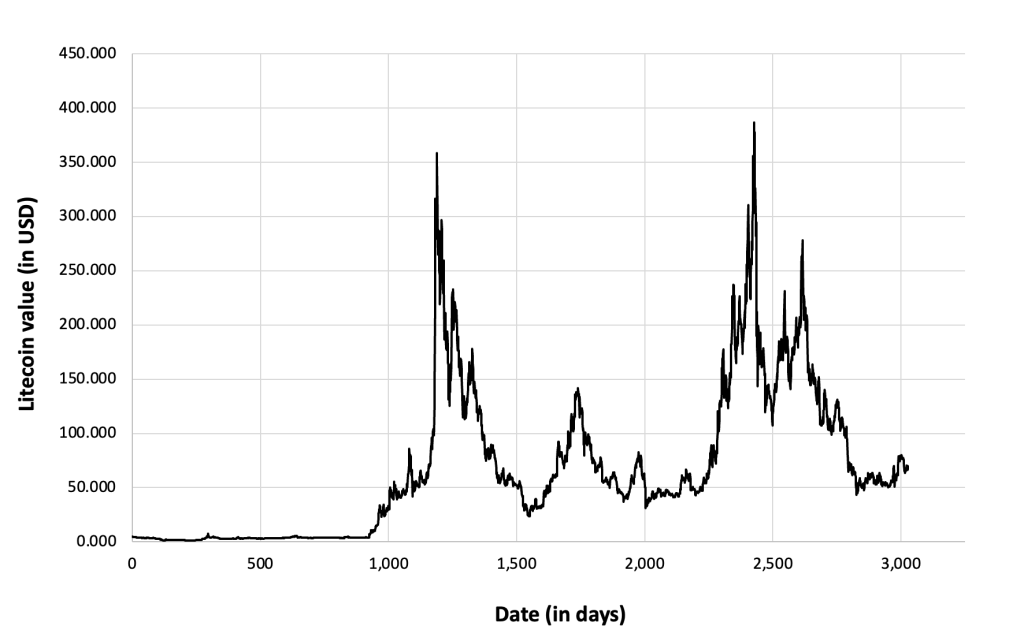
Figure 5 below gives the evolution of the Litecoin on a daily basis.

Figure 5. Evolution of the Litecoin
Source: computation by the author (data: Yahoo! Finance website).

Figure 6 below gives the evolution of the Litecoin returns from September 2014 to May 2024 on a daily basis.

Figure 6. Evolution of the Litecoin returns.

Source: computation by the author (data: Yahoo! Finance website).

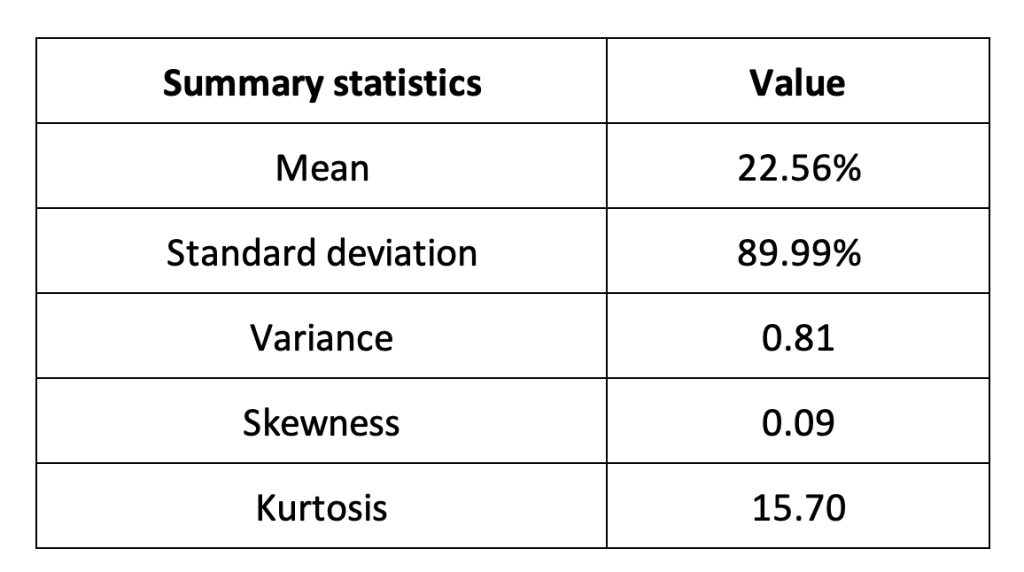
The R program that you can download above also allows you to compute summary statistics about the returns of the Litecoin.

Table 2 below presents the following summary statistics estimated for the Litecoin:

  • The mean
  • The standard deviation (the squared root of the variance)
  • The skewness
  • The kurtosis.

The mean, the standard deviation / variance, the skewness, and the kurtosis refer to the first, second, third and fourth moments of statistical distribution of returns respectively.

Table 2. Summary statistics for Litecoin
Source: computation by the author (data: Yahoo! Finance website).

Statistical distribution of the Litecoin returns

Historical distribution

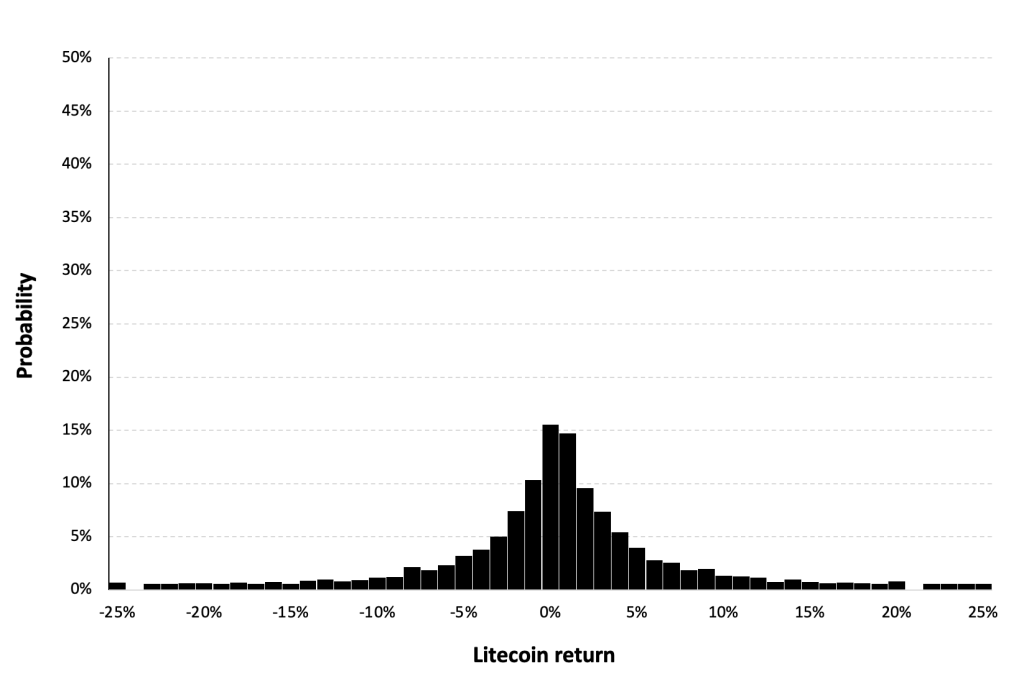
Figure 7 represents the historical distribution of the Litecoin daily returns for the period from September 2014 to May 2024.

Figure 7. Historical distribution of Litecoin returns.
Source: computation by the author (data: Yahoo! Finance website).

Gaussian distribution

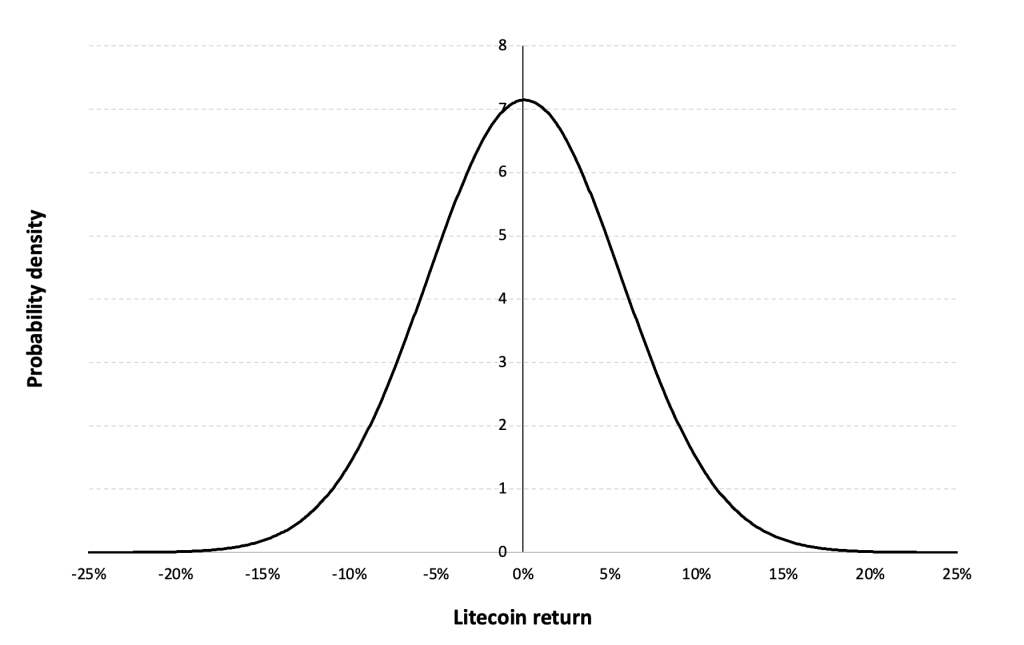
The Gaussian distribution (also called the normal distribution) is a parametric distribution with two parameters: the mean and the standard deviation of returns. We estimated these two parameters over the period from September 2014 to May 2024.

Figure 9 below represents the Gaussian distribution of the Litecoin daily returns with parameters estimated over the period from September 2014 to May 2024.

Figure 8. Gaussian distribution of the Litecoin returns.
Source: computation by the author (data: Yahoo! Finance website).

Risk measures of the Litecoin returns

The R program that you can download above also allows you to compute risk measures about the returns of the Litecoin.

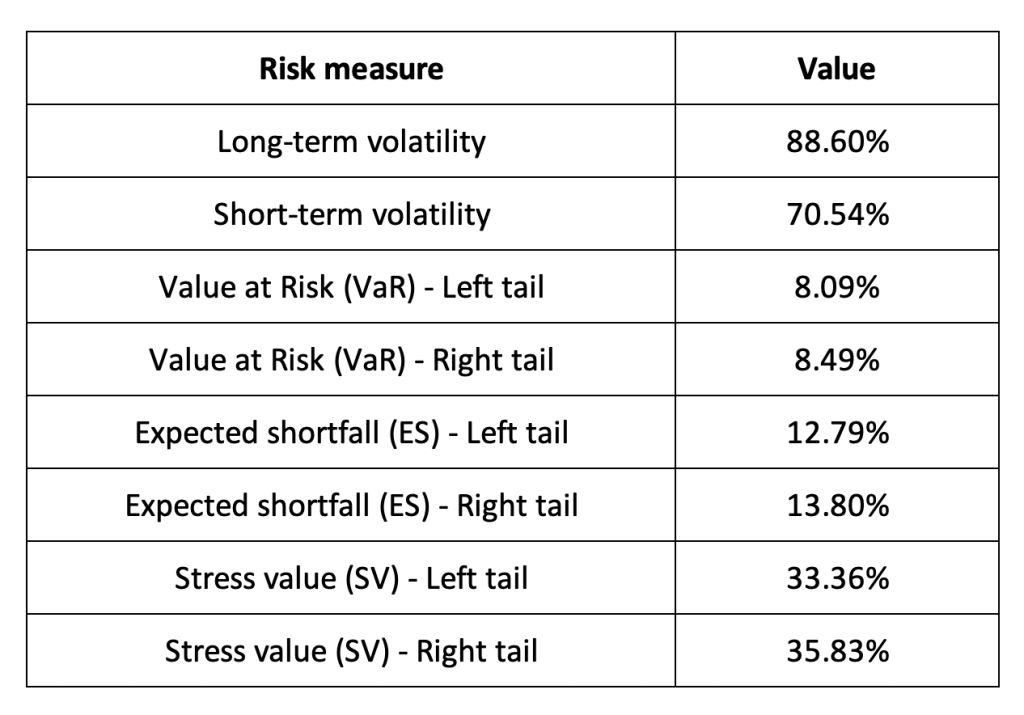
Table 3 below presents the following risk measures estimated for the Litecoin:

  • The long-term volatility (the unconditional standard deviation estimated over the entire period)
  • The short-term volatility (the standard deviation estimated over the last three months)
  • The Value at Risk (VaR) for the left tail (the 5% quantile of the historical distribution)
  • The Value at Risk (VaR) for the right tail (the 95% quantile of the historical distribution)
  • The Expected Shortfall (ES) for the left tail (the average loss over the 5% quantile of the historical distribution)
  • The Expected Shortfall (ES) for the right tail (the average loss over the 95% quantile of the historical distribution)
  • The Stress Value (SV) for the left tail (the 1% quantile of the tail distribution estimated with a Generalized Pareto distribution)
  • The Stress Value (SV) for the right tail (the 99% quantile of the tail distribution estimated with a Generalized Pareto distribution)

Table 3. Risk measures for the Litecoin
Source: computation by the author (data: Yahoo! Finance website).

The volatility is a global measure of risk as it considers all the returns. The Value at Risk (VaR), Expected Shortfall (ES) and Stress Value (SV) are local measures of risk as they focus on the tails of the distribution. The study of the left tail is relevant for an investor holding a long position in the Litecoin while the study of the right tail is relevant for an investor holding a short position in the Litecoin.

Why should I be interested in this post?

This blog offers an intriguing journey into the world of Litecoin, tailored for both newcomers and seasoned cryptocurrency enthusiasts alike. It unveils the innovative features and unique characteristics that set Litecoin apart in the digital currency landscape. From its inception to its current standing, we explore Litecoin’s historical journey, shedding light on its pivotal moments and market dynamics. Whether you’re intrigued by its faster block time or its active development community, this post provides a comprehensive understanding of Litecoin’s significance and potential. Whether you’re a curious observer or an investor seeking new opportunities, join us as we delve into the fascinating world of Litecoin and uncover its role in shaping the future of decentralized finance.

Related posts on the SimTrade blog

About cryptocurrencies

   ▶ Snehasish CHINARA Bitcoin: the mother of all cryptocurrencies

   ▶ Snehasish CHINARA How to get crypto data

   ▶ Alexandre VERLET Cryptocurrencies

About statistics

   ▶ Shengyu ZHENG Moments de la distribution

   ▶ Shengyu ZHENG Mesures de risques

   ▶ Jayati WALIA Returns

Useful resources

Academic research about risk

Longin F. (2000) From VaR to stress testing: the extreme value approach Journal of Banking and Finance, N°24, pp 1097-1130.

Longin F. (2016) Extreme events in finance: a handbook of extreme value theory and its applications Wiley Editions.

Data

Yahoo! Finance

Yahoo! Finance Historical data for Litecoin

CoinMarketCap Historical data for Litecoin

About the author

The article was written in July 2024 by Snehasish CHINARA (ESSEC Business School, Grande Ecole Program – Master in Management, 2022-2024).

Investissements Durables : Le Nouveau Visage de la Finance

Investissements Durables : Le Nouveau Visage de la Finance

Eya FARHOUD

Dans cet article, (ESSEC Business School, Grande Ecole – Master in Management, 2023-2026) explore le nouveau visage de la finance avec les investissements durables.

Introduction

Dans un monde où les enjeux environnementaux, sociaux et de gouvernance (ESG) prennent une place de plus en plus prépondérante, les investissements durables émergent comme une alternative de choix sur les marchés financiers. Cette tendance, autrefois marginale, gagne désormais en popularité et en influence, offrant aux investisseurs la possibilité de concilier rentabilité financière et impact positif sur la société et l’environnement.

Qu’est-ce que les investissements durables ? Les investissements durables, également connus sous le nom d’investissements socialement responsables (ISR) ou d’investissements à impact, consistent à allouer des fonds à des entreprises et des projets qui intègrent des critères ESG dans leur stratégie et leur gouvernance. Ces critères peuvent inclure la réduction des émissions de carbone, la promotion de la diversité et de l’inclusion, ou encore le respect des droits de l’homme.

Les avantages des investissements durables

Les investissements durables offrent plusieurs avantages tant aux investisseurs qu’à la société dans son ensemble. Sur le plan financier, de nombreuses études ont montré que les entreprises qui intègrent des pratiques durables tendent à être plus résilientes et à générer des rendements financiers supérieurs à long terme. De plus, investir dans des entreprises qui contribuent positivement à la société et à l’environnement peut être source de satisfaction morale pour les investisseurs, qui voient leur argent travailler en faveur d’un monde meilleur.

L’essor de l’investissement durable

Au cours des dernières années, l’investissement durable a connu une croissance exponentielle, attirant l’attention des investisseurs institutionnels, des fonds de pension et même des particuliers. Les actifs sous gestion intégrant des critères ESG ont atteint des niveaux record, témoignant de l’engagement croissant en faveur d’une finance plus responsable et éthique.

Les défis et les opportunités

Malgré son essor rapide, l’investissement durable fait face à plusieurs défis, notamment celui de la standardisation des critères ESG et de la mesure de l’impact réel des investissements. Cependant, ces défis sont également source d’opportunités, d’innovation et de progrès dans le domaine de la finance durable.

Articles connexes sur le blog SimTrade

   ▶ Anant JAIN Dow Jones Sustainability Index

   ▶ Anant JAIN The World 10 Most Sustainable Companies in 2021

Ressources utiles

Muriel Motte (29/01/2024) Les Américains désertent les fonds d’investissement durables, L’opinion.

A propos de l’auteur

Cet article a été écrit en Avril 2024 par Eya FARHOUD (ESSEC Business School, Grande Ecole – Master in Management, 2023-2026).

Le règne des Algorithmes de Trading Haute Fréquence : Bénéfices et Risques

Le règne des Algorithmes de Trading Haute Fréquence : Bénéfices et Risques

Eya FARHOUD

Dans cet article, Eya FARHOUD (ESSEC Business School, Grande Ecole – Master in Management, 2023-2026) explique les bénéfices et risques du Trading Haute Fréquence (THF).

Introduction

Depuis les dernières décennies, les marchés financiers ont été témoins d’une révolution silencieuse mais omniprésente : l’avènement des algorithmes de trading haute fréquence (THF) ou High Frequency Trading (HFT). Ces systèmes informatiques ultra-rapides sont devenus des acteurs majeurs sur les marchés mondiaux, modifiant profondément la dynamique traditionnelle du trading et suscitant à la fois admiration et inquiétude.

Qu’est-ce que le trading haute fréquence ? Le THF est une méthode de négociation qui utilise des algorithmes informatiques pour exécuter un grand nombre d’ordres à des vitesses extrêmement élevées. Ces algorithmes analysent en temps réel les données du marché, prennent des décisions d’achat ou de vente et exécutent les transactions en une fraction de seconde, parfois même en microsecondes. Selon un rapport publié en 2023 par la Securities and Exchange Commission (SEC), le trading haute fréquence représentait environ 50% et 60% des transactions sur les marchés boursiers américains.

Les avantages du trading haute fréquence

Les partisans du trading haute fréquence mettent en avant plusieurs avantages de cette approche. Tout d’abord, la vitesse. Les algorithmes HFT permettent aux traders de saisir les opportunités de marché en temps réel, exploitant les écarts de prix minuscules qui peuvent survenir en l’espace de quelques millisecondes. Ensuite, l’efficacité. Les transactions étant automatisées, le trading haute fréquence permet de réduire les coûts de transaction et d’optimiser l’exécution des ordres. Plus concrètement, selon une étude de la Banque Centrale Européenne, le THF a contribué à réduire les coûts de transaction de l’ordre de 5 à 10 % sur les marchés européens entre 2015 et 2020.

Les défis et les risques

Cependant, le trading haute fréquence n’est pas sans ses critiques et ses risques. L’un des principaux défis est lié à la volatilité. La nature ultra-rapide du trading HFT peut parfois amplifier les mouvements de marché, créant des flash crashes et des situations de panique. Il existe également des préoccupations concernant l’équité et la transparence du marché, certains accusant les traders haute fréquence de bénéficier d’un accès privilégié à l’information et de manipuler les marchés à leur avantage.

La réglementation et l’avenir du trading haute fréquence

Face à ces défis, les régulateurs financiers du monde entier ont commencé à prendre des mesures pour encadrer le trading haute fréquence. Aux États-Unis, par exemple, la SEC a adopté des règles visant à améliorer la transparence et la surveillance des marchés, notamment en imposant des obligations de reporting plus strictes pour les opérations effectuées par les traders haute fréquence. Malgré ces préoccupations et réglementations, le trading haute fréquence continue de prospérer et d’évoluer. Les avancées technologiques telles que l’intelligence artificielle et le machine learning promettent de rendre les algorithmes encore plus sophistiqués et réactifs aux conditions du marché. L’avenir du trading haute fréquence reste donc incertain, mais une chose est sûre : son impact sur les marchés financiers continuera d’être au cœur des débats et des discussions pour les années à venir.

Articles connexes sur le blog SimTrade

   ▶ Akshit GUPTA High-frequency trading

   ▶ Clara PINTO High-frequency trading and limit orders

   ▶ Shruti CHAND High-frequency trading: pros and cons

Ressources utiles

Luc Goupil (2013) Trading à haute fréquence : empreinte de marché et enjeux de régulation Revue d’économie financière 110, 277-294.

A propos de l’auteure

Cet article a été écrit en Juillet 2024 par Eya FARHOUD (ESSEC Business School, Grande Ecole – Master in Management, 2023-2026).

Une journée dans la vie d’un stagiaire en Middle Office

Une journée dans la vie d’un stagiaire en Middle Office

Esten CHAUVIN

Dans cet article, Esten CHAUVIN (ESSEC Business School, Grande Ecole – Master in Management, 2023-2026) partage son expérience sur ce qu’implique une journée typique en tant que stagiaire en Middle Office. Cet article est destiné aux étudiants de gestion (universités, écoles de commerce) qui vont commencer leur premier stage en finance de marché.

Introduction

Le Middle Office joue un rôle crucial dans les institutions financières, assurant la liaison entre le Front Office et le Back Office. Si vous êtes curieux de savoir à quoi ressemble une journée type en tant que stagiaire en Middle Office, cet article est pour vous. Je vais vous emmener à travers une journée ordinaire, de l’arrivée matinale aux derniers instants avant de partir.

Matinée

Arrivée et préparation (7h30 – 8h)

Je commence ma journée tôt, généralement entre 7h30 et 8h00. Après avoir pris un café pour bien démarrer la journée, je commence par vérifier mes emails et prendre note des tâches prioritaires. Cette première étape est cruciale pour organiser ma journée efficacement. Les marchés européens ouvrent à 9h00, il est donc important d’être prêt avant l’ouverture pour réagir rapidement aux événements de la nuit.

Revue des positions et des expositions (8h – 9h)

La première tâche de la journée consiste à revoir les positions de la veille. Cela inclut l’examen des transactions effectuées et des positions détenues en fin de journée pour s’assurer qu’elles sont conformes aux attentes et aux stratégies définies. Je vérifie les expositions aux risques, c’est-à-dire l’ampleur de nos investissements dans différentes classes d’actifs, et identifie toute anomalie ou écart. Par exemple, une anomalie pourrait être une transaction non enregistrée correctement ou une position de change qui ne correspond pas aux prévisions initiales en raison d’une erreur de saisie ou d’une fluctuation imprévue des taux de change. Cette vérification matinale permet de détecter rapidement tout problème potentiel et de les résoudre en collaboration avec le Front Office. Par exemple, un écart significatif dans les expositions de change pourrait nécessiter une action immédiate, comme ajuster des positions ou couvrir des risques, avant l’ouverture du marché pour éviter des impacts négatifs.

Réunions du matin (9h – 10h)

Ensuite, je participe à une réunion d’équipe pour discuter des priorités de la journée. Ces réunions sont l’occasion de partager des mises à jour sur les nouvelles régulations ou les événements de marché récents. Par exemple, pendant mon stage chez Oddo BHF, nous avons discuté des implications des fluctuations du marché des changes sur nos portefeuilles. Ces réunions permettent également de coordonner les efforts entre les différents membres de l’équipe pour s’assurer que toutes les tâches critiques sont couvertes.

Traitement des transactions (10h – 12h)

Après la réunion, je me plonge dans le traitement des transactions. Cela implique la confirmation et la validation des transactions effectuées par le Front Office. J’utilise des systèmes internes pour saisir et valider les données. Par exemple, traiter une transaction complexe impliquant des dérivés OTC peut être un véritable défi, mais c’est aussi une excellente occasion d’apprendre. Il est essentiel de vérifier que toutes les transactions sont correctement enregistrées et conformes aux régulations en vigueur.

Après-midi

Gestion des risques (13h – 15h)

L’après-midi est souvent consacrée à la gestion des risques. Je surveille les expositions aux risques de marché, de crédit et de liquidité. Utiliser des modèles quantitatifs pour évaluer les risques fait partie de mon quotidien. Un exemple concret est l’ajustement des marges suite à une volatilité accrue du marché. Il est crucial de réagir rapidement aux changements de marché pour minimiser les risques potentiels.

Interaction avec d’autres départements (15h – 16h)

La collaboration est essentielle en Middle Office. Je travaille régulièrement avec le Back Office pour le règlement des transactions et avec le département de compliance pour s’assurer de la conformité des transactions. Par exemple, il m’est arrivé de coordonner avec le service IT pour résoudre un problème technique urgent. Ces interactions permettent de s’assurer que les opérations se déroulent sans accroc et que toutes les parties prenantes sont alignées.

Analyse et reporting (16h – 18h)

Une partie importante de mon travail consiste à préparer des rapports pour la direction et les régulateurs. Cela inclut l’analyse des performances des portefeuilles et des stratégies de couverture. Pendant mon stage, j’ai par exemple présenté un rapport hebdomadaire sur les risques de marché à l’équipe de gestion, ce qui m’a permis de développer mes compétences en communication et en analyse. Les rapports doivent être précis et fournir une vue claire des risques et des opportunités.

Fin de journée

Suivi des tâches en cours (18h – 18h30)

En fin de journée, je vérifie les tâches accomplies et prépare celles pour le lendemain. Cela inclut de répondre aux emails de dernière minute et de suivre les points en suspens. Clôturer une transaction en suspens avec une contrepartie internationale peut être un défi, mais c’est aussi très gratifiant. Il est important de s’assurer que toutes les tâches critiques sont traitées avant de quitter le bureau.

Réunion de fin de journée (18h30 – 19h)

Nous terminons souvent la journée par un bilan avec l’équipe. Ces réunions sont l’occasion de discuter des défis rencontrés et des solutions apportées. Par exemple, partager les leçons apprises suite à un incident de marché imprévu est une excellente façon d’améliorer continuellement nos processus. Ces réunions permettent également de s’assurer que tout le monde est aligné pour les tâches du lendemain.

Départ (19h)

Je pars généralement après 19h. Avant de partir, je prends un moment pour réfléchir aux tâches prioritaires et aux objectifs à court terme pour le lendemain. Cette réflexion aide à rester organisé et prêt pour la journée suivante.

Conclusion

Chaque journée en Middle Office est unique, remplie de défis et d’opportunités d’apprentissage. En tant que stagiaire, vous serez au cœur de l’action, travaillant en étroite collaboration avec différents départements pour assurer le bon fonctionnement de l’institution. L’organisation, la gestion du temps et la capacité à collaborer efficacement sont des compétences clés que vous développerez.

Conseils pour les futurs stagiaires

  • Organisation et gestion du temps : Planifiez votre journée et priorisez vos tâches.
  • Communication : Développez des compétences en communication pour interagir efficacement avec les différents départements.
  • Apprentissage continu : Restez curieux et cherchez constamment à apprendre et à vous améliorer.

Ressources utiles

Gestionnaire Middle Office par ABC Bourse (2023)

Middle Office par Philip Lawton (2012)

À propos de l’auteur

Cet article a été écrit en juillet 2024 par Esten CHAUVIN, étudiant en Master de Management à l’ESSEC Business School, ancien stagiaire OTC Derivatives, Stock Loans, Repo Loans chez Oddo BHF.

Introduction aux produits dérivés de gré à gré (OTC Derivatives)

Introduction aux produits dérivés de gré à gré (OTC Derivatives)

Esten CHAUVIN

Dans cet article, Esten CHAUVIN (ESSEC Business School, Grande Ecole – Master in Management, 2023-2026) partage son expérience et ses connaissances sur les produits dérivés de gré à gré (OTC Derivatives), leur fonctionnement et leurs applications en finance de marché.

Introduction

Les produits dérivés de gré à gré (OTC Derivatives) sont des instruments financiers négociés directement entre deux parties, sans passer par une bourse. OTC signifie “Over-The-Counter”, indiquant que ces transactions se font en dehors des marchés réglementés. Ces produits jouent un rôle crucial dans la gestion des risques financiers et l’optimisation des portefeuilles d’investissement. Cet article vise à introduire les concepts fondamentaux des produits dérivés OTC et à expliquer leur importance dans les marchés financiers.

Fonctionnement des produits dérivés OTC

Les produits dérivés OTC incluent une variété d’instruments tels que les swaps, les forwards et les options. Contrairement aux dérivés échangés en bourse, les dérivés OTC sont personnalisés en fonction des besoins spécifiques des parties impliquées. Par exemple, une entreprise peut utiliser un swap de taux d’intérêt pour échanger des paiements d’intérêts à taux fixe contre des paiements à taux variable afin de mieux correspondre à ses flux de trésorerie. De même, un forward peut être ajusté pour répondre à une date de livraison spécifique ou à des quantités exactes de produits, et une option peut être conçue avec des conditions particulières qui répondent aux stratégies de couverture ou de spéculation spécifiques d’un investisseur.

Types de produits dérivés OTC

  • Swaps : Contrats dans lesquels deux parties échangent des flux de trésorerie futurs selon des conditions préétablies. Par exemple, un swap de taux d’intérêt peut impliquer l’échange de paiements à taux fixe contre des paiements à taux variable.
  • Forwards : Contrats où deux parties s’engagent à acheter ou vendre un actif à une date future à un prix fixé aujourd’hui. Ces contrats sont souvent utilisés pour couvrir le risque de prix des matières premières.
  • Options : Contrats donnant le droit, mais non l’obligation, d’acheter ou de vendre un actif à un prix fixé à l’avance, à ou avant une date spécifiée. Les options OTC sont souvent personnalisées pour répondre aux besoins spécifiques des contreparties.

Processus de négociation des dérivés OTC

  1. Négociation des termes : Les termes des dérivés OTC sont négociés directement entre les parties, incluant le type de dérivé, la durée du contrat, et les conditions spécifiques.
  2. Évaluation et gestion des risques : Les deux parties doivent évaluer les risques associés au contrat et mettre en place des mesures pour les gérer, telles que la fourniture de garanties.
  3. Suivi et gestion des contrats : Une fois le contrat en place, les parties doivent suivre et gérer activement le contrat pour s’assurer qu’il reste conforme aux termes négociés et aux conditions du marché.

Avantages et risques des produits dérivés OTC

Avantages

  • Flexibilité : Les dérivés OTC peuvent être personnalisés pour répondre aux besoins spécifiques des parties impliquées.
  • Gestion des risques : Les dérivés OTC permettent aux entreprises de couvrir divers types de risques, tels que les risques de taux d’intérêt, de change et de prix des matières premières.
  • Optimisation des portefeuilles : Les dérivés OTC peuvent être utilisés pour améliorer l’efficacité des portefeuilles d’investissement en permettant une gestion plus fine des expositions aux risques.

Inconvénients

  • Risque de contrepartie : Le risque que l’une des parties fasse défaut sur ses obligations contractuelles. Pour minimiser ce risque, les institutions financières mettent en place des accords de garanties.
  • Complexité : La complexité des dérivés OTC peut rendre leur gestion difficile, nécessitant des compétences spécialisées et une surveillance continue.
  • Transparence : Les marchés OTC sont moins transparents que les marchés régulés, ce qui peut rendre l’évaluation des risques plus difficile.

Réglementation et compliance

Les produits dérivés OTC sont soumis à des réglementations strictes pour garantir la transparence et la sécurité des transactions. Par exemple, la réglementation EMIR (European Market Infrastructure Regulation) en Europe impose des exigences de reporting et de compensation pour les dérivés OTC. Durant mon stage chez Oddo BHF, nous devions nous assurer que toutes les transactions étaient conformes à ces régulations, souvent en collaboration avec le département de compliance.

Impact sur les marchés financiers

Les produits dérivés OTC jouent un rôle crucial dans les marchés financiers en offrant des outils pour la gestion des risques et l’optimisation des portefeuilles. Cependant, ils peuvent également contribuer à la volatilité et à l’instabilité des marchés en période de crise financière. Un exemple notable est la crise financière de 2008, où l’utilisation excessive des dérivés OTC a amplifié les risques systémiques.

Cas pratiques et exemples

Lors de mon stage chez Oddo BHF, j’ai été directement impliqué dans la gestion des dérivés OTC. Par exemple, nous avons travaillé sur des swaps de taux d’intérêt pour couvrir les risques de fluctuations des taux pour une entreprise multinationale. Cette entreprise souhaitait échanger ses paiements d’intérêts à taux variable contre des paiements à taux fixe pour stabiliser ses coûts de financement. Nous avons négocié les termes du swap en tenant compte des conditions spécifiques de l’entreprise et des prévisions de marché, ce qui a permis à l’entreprise de réduire son exposition aux risques de taux d’intérêt. Par ailleurs, selon la Banque des Règlements Internationaux (BRI), le volume total des transactions de produits dérivés OTC s’élevait à plus de 640 000 milliards de dollars au second semestre 2023, reflétant l’importance croissante de ces instruments dans les marchés financiers. De plus, les swaps de taux d’intérêt représentaient environ 75% de ce volume, soulignant leur prédominance. Les forwards et les options ont également connu une activité significative, avec des volumes atteignant respectivement 90 000 milliards et 65 000 milliards de dollars.

Comparaison avec d’autres instruments financiers

Dérivés OTC vs dérivés échangés en bourse

Les dérivés OTC offrent une plus grande flexibilité et personnalisation par rapport aux dérivés échangés en bourse, mais ils comportent également des risques accrus en termes de contrepartie et de transparence. Les dérivés échangés en bourse sont standardisés et compensés par une chambre de compensation, réduisant ainsi le risque de contrepartie.

Dérivés OTC vs autres produits financiers

Les dérivés OTC peuvent être utilisés en complément d’autres produits financiers tels que les obligations, les actions et les options échangées en bourse. Ils offrent des moyens supplémentaires pour la gestion des risques et l’optimisation des portefeuilles, mais nécessitent une expertise spécifique pour être gérés efficacement.

Conclusion

Les produits dérivés de gré à gré (OTC Derivatives) sont des outils puissants pour la gestion des risques et l’optimisation des portefeuilles en finance de marché. Ils offrent une flexibilité et une personnalisation accrues par rapport aux dérivés échangés en bourse, mais comportent également des risques importants qui doivent être gérés avec soin. Pour les étudiants et les futurs professionnels de la finance, comprendre les mécanismes et les enjeux des dérivés OTC est crucial pour naviguer efficacement dans ce domaine complexe.

Ressources utiles

Regulation on Over-the-Counter Derivatives and Market infrastructures – Frequently Asked Questions

À propos de l’auteur

Cet article a été écrit en juillet 2024 par Esten CHAUVIN, étudiant en Master de Management à l’ESSEC Business School, ancien stagiaire OTC Derivatives, Stock Loans, Repos chez Oddo BHF.

Guide de survie d’un stagiaire en finance de marché : Faut-il croire ChatGPT ?

Guide de survie d’un stagiaire en finance de marché : Faut-il croire ChatGPT ?

Esten CHAUVIN

Dans cet article, Esten CHAUVIN (ESSEC Business School, Grande Ecole – Master in Management, 2023-2026) partage son expérience et ses conseils pour survivre et réussir en tant que stagiaire en finance de marché. Cet article est destiné aux étudiants qui s’apprêtent à commencer leur premier stage dans ce domaine exigeant mais passionnant.

Introduction

Un stage en finance de marché peut être intimidant, mais avec les bons outils et les bonnes astuces, vous pouvez non seulement survivre mais aussi prospérer. Voici un guide pratique pour vous aider à naviguer dans cet environnement dynamique et souvent stressant, en comparant les conseils généraux avec mon expérience réelle chez Oddo BHF.

1. Soyez ponctuel et organisé

Conseil général : La ponctualité est essentielle en finance de marché. Arrivez tôt, préparez votre journée et soyez prêt avant l’ouverture des marchés. Utilisez des outils comme des listes de tâches et des agendas pour rester organisé et gérer efficacement votre temps.

Mon expérience : Ce conseil est crucial. Arriver entre 7h30 et 8h me permettait de bien préparer ma journée avant l’ouverture des marchés à 9h. Utiliser des listes de tâches et des agendas électroniques m’a aidé à suivre les nombreuses responsabilités et à respecter les délais serrés. Mais attention, une liste de tâches interminable ne doit pas vous transformer en robot de la finance. Prenez le temps de respirer, un café à la main, tout en admirant la vue matinale sur l’A86 qui bouchonne sous la pluie.

Conseils supplémentaires :

  • Utilisez un carnet ou une application pour noter vos tâches quotidiennes.
  • Prévoyez un temps chaque matin pour organiser votre journée.
  • Anticipez les délais et planifiez à l’avance pour éviter les surprises de dernière minute.

2. Posez des questions et soyez curieux

Conseil général : Ne vous inquiétez pas si vous ne comprenez pas tout au début. La finance de marché est complexe et il est normal d’avoir des questions. Montrez votre intérêt et votre volonté d’apprendre en posant des questions pertinentes.

Mon expérience : Poser des questions est indispensable, mais il faut le faire de manière stratégique. J’ai appris à poser des questions après avoir fait mes propres recherches, ce qui montrait que j’étais proactif et désireux de comprendre en profondeur. Une recherche Google de 15 secondes peut souvent résoudre plus de problèmes qu’on ne le pense.

Conseils supplémentaires :

  • N’ayez pas peur de demander des clarifications à vos collègues ou supérieurs.
  • Faites des recherches supplémentaires pour approfondir votre compréhension.
  • Participez activement aux réunions et discussions.

3. Soyez proactif et prenez des initiatives

Conseil général : Ne vous contentez pas d’attendre que l’on vous donne des tâches. Proposez votre aide et cherchez des moyens d’apporter de la valeur à votre équipe. Votre initiative sera remarquée et appréciée.

Mon expérience : Être proactif est effectivement très apprécié. Proposer d’aider sur des projets ou d’améliorer certains processus m’a permis de me démarquer et de gagner la confiance de mon équipe. Attention cependant à ne pas vouloir tout révolutionner dès la première semaine. Commencez par de petites améliorations et gagnez petit à petit la confiance de vos collègues. Souvenez-vous, Rome ne s’est pas faite en un jour, et votre crédibilité non plus.

Conseils supplémentaires :

  • Identifiez les domaines où vous pouvez contribuer et proposez des solutions.
  • Saisissez les opportunités d’assumer de nouvelles responsabilités.
  • Montrez que vous êtes un membre actif et engagé de l’équipe.

4. Développez vos compétences techniques

Conseil général : En finance de marché, des compétences techniques solides sont indispensables. Familiarisez-vous avec les outils et logiciels utilisés dans votre entreprise et cherchez à améliorer continuellement vos compétences.

Mon expérience : Ce conseil est essentiel. Maîtriser Excel et d’autres outils analytiques m’a permis de gérer efficacement les tâches complexes. J’ai également appris à utiliser des plateformes de trading et des systèmes de gestion des risques spécifiques à mon entreprise. Maîtriser Excel en profondeur permet vraiment de gagner un temps fou et réussir à utiliser Excel sans toucher à votre souris vous permettra de gagner à coup sûr le respect de tous l’open space.

Conseils supplémentaires :

  • Maîtrisez Excel et d’autres outils analytiques couramment utilisés.
  • Apprenez à utiliser les plateformes de trading et les systèmes de gestion des risques.
  • Participez à des formations ou des webinaires pour rester à jour.

5. Soyez flexible et adaptable

Conseil général : Les marchés financiers sont imprévisibles et les priorités peuvent changer rapidement. Soyez prêt à vous adapter et à changer de cap lorsque nécessaire.

Mon expérience : La flexibilité est cruciale en finance de marché. Les situations peuvent évoluer rapidement, et il est important de rester calme et adaptable. Par exemple, lors de l’annonce de nouvelles économiques importantes, nous devions réagir rapidement pour ajuster nos stratégies. Rappelez-vous que l’imprévu fait partie du jeu et que chaque crise est aussi une opportunité de montrer votre capacité à gérer le stress avec grâce… ou du moins sans paniquer ouvertement.

Conseils supplémentaires :

  • Restez calme et professionnel, même en période de stress.
  • Adaptez-vous aux nouvelles situations et soyez prêt à apprendre de nouvelles compétences.
  • Maintenez une attitude positive et proactive.

6. Prenez soin de vous

Conseil général : Il est facile de se laisser submerger par le travail, mais il est important de prendre soin de votre santé physique et mentale. Faites des pauses régulières, mangez équilibré et assurez-vous de bien dormir.

Mon expérience : Ce conseil ne peut pas être sous-estimé. Travailler de longues heures peut être épuisant. J’ai trouvé qu’il était essentiel de prendre des pauses, de faire de l’exercice régulièrement et de maintenir une alimentation saine pour rester performant et éviter le burn-out. N’oubliez pas que le café et les 3 cigarettes du matin ne remplacent pas un bon petit déjeuner, et qu’une bonne nuit de sommeil vaut mieux que tous les compléments et produits énergisants possibles et imaginables.

Conseils supplémentaires :

  • Faites de l’exercice régulièrement pour réduire le stress.
  • Adoptez une alimentation saine et équilibrée.
  • Assurez-vous de dormir suffisamment chaque nuit.

Conclusion

Un stage en finance de marché est une expérience exigeante mais extrêmement enrichissante. En suivant ces conseils et en adoptant une attitude proactive et positive, vous maximiserez vos chances de succès et tirerez le meilleur parti de cette opportunité. Les conseils généraux peuvent vous donner une bonne base, mais adapter ces conseils à votre propre expérience et contexte est crucial pour réussir. Bonne chance !

Ressources utiles

How to Get an Internship in Finance par Handshake (2023)

HBR Guide to Finance Basics for Managers par Harvard Business Review (2012)

À propos de l’auteur

Cet article a été écrit en juillet 2024 par Esten Chauvin, étudiant en Master de Management à l’ESSEC Business School, ancien stagiaire OTC Derivatives, Stock Loans, Repo Loans chez Oddo BHF.

Compliance et régulation dans le secteur financier : focus sur les prêts de titres et les dérivés OTC

Compliance et régulation dans le secteur financier : focus sur les prêts de titres et les dérivés OTC

Esten CHAUVIN

Dans cet article, Esten CHAUVIN (ESSEC Business School, Grande Ecole – Master in Management, 2023-2026) partage son expérience et ses connaissances sur la compliance et la régulation dans le secteur financier, avec un focus particulier sur les prêts de titres et les dérivés OTC.

Introduction

La compliance et la régulation jouent un rôle fondamental dans le secteur financier, garantissant la transparence et la sécurité des transactions. Cet article vise à expliquer les principaux aspects de la régulation en finance, en se concentrant sur les prêts de titres et les dérivés de gré à gré (OTC).

Importance de la compliance et de la régulation

Les régulations financières sont mises en place pour protéger les investisseurs, maintenir la stabilité des marchés et prévenir les pratiques frauduleuses. La compliance, quant à elle, assure que les institutions financières respectent ces régulations. Ensemble, elles forment le socle de la confiance dans le système financier.

Différence entre régulation et réglementation

La réglementation se réfère aux textes de lois, directives et règlements émis par les autorités compétentes pour encadrer les activités financières. Elle définit les règles et les normes que les institutions financières doivent suivre. La régulation financière, en revanche, est le processus par lequel ces règles sont mises en œuvre et appliquées. Elle inclut les activités de surveillance et de contrôle menées par les régulateurs pour s’assurer que les institutions se conforment aux réglementations en vigueur.

Origine et importance du reporting

Le reporting financier est né de la nécessité de fournir des informations transparentes et fiables aux régulateurs, investisseurs et autres parties prenantes. Il permet de suivre et d’évaluer les risques systémiques, de détecter les irrégularités et de garantir la stabilité du système financier. Par exemple, le reporting des transactions de prêt de titres et de dérivés OTC aide les régulateurs à surveiller les expositions et à prévenir les crises financières.

Principales régulations

  • Réglementation SFTR : La Securities Financing Transactions Regulation (SFTR) en Europe impose des exigences de reporting détaillées pour toutes les transactions de financement de titres. Cette régulation vise à augmenter la transparence et à réduire les risques systémiques.
  • Réglementation EMIR : L’European Market Infrastructure Regulation (EMIR) impose des obligations de compensation et de reporting pour les dérivés OTC. Elle a été mise en place pour améliorer la transparence et réduire le risque de contrepartie.
  • Dodd-Frank Act : Aux États-Unis, cette loi impose des réglementations strictes sur les dérivés OTC, visant à prévenir une autre crise financière.

Compliance dans les prêts de titres

Les prêts de titres, ou stock loans, sont soumis à une surveillance réglementaire stricte. Les institutions doivent s’assurer que les transactions sont correctement déclarées et que les garanties sont adéquates.

Exigences de reporting

Les transactions de prêt de titres doivent être déclarées aux régulateurs dans un délai spécifique. Cela inclut des informations détaillées sur les parties impliquées, les titres prêtés et les garanties fournies.

Gestion des garanties

Les garanties doivent être évaluées régulièrement pour s’assurer qu’elles couvrent adéquatement le risque de contrepartie. Par exemple, si la valeur des titres prêtés augmente ou diminue significativement, des ajustements des garanties peuvent être nécessaires.

Exemple pratique

Pendant mon stage chez Oddo BHF, j’ai travaillé sur des transactions de prêt de titres où nous devions ajuster les garanties en fonction des fluctuations du marché. Nous collaborions étroitement avec le département de compliance pour nous assurer que toutes les transactions étaient conformes aux régulations en vigueur.

Compliance dans les dérivés OTC

Les dérivés OTC sont également fortement régulés pour garantir la transparence et la sécurité des marchés financiers.

Compensation et clearing

L’European Market Infrastructure Regulation (EMIR) impose que certaines transactions de dérivés OTC soient compensées par des chambres de compensation centrales pour réduire le risque de contrepartie. Cela signifie que les parties impliquées dans une transaction doivent passer par une entité tierce qui garantit la transaction.

Exigences de reporting

Toutes les transactions de dérivés OTC doivent être déclarées aux régulateurs, incluant des détails sur les termes du contrat, les parties impliquées et les expositions au risque. Ces informations permettent aux régulateurs de surveiller les risques systémiques.

Exemple pratique

Durant mon stage, j’ai aidé à préparer des rapports de conformité pour les transactions de dérivés OTC. Cela impliquait de s’assurer que toutes les transactions étaient correctement enregistrées et que les expositions étaient gérées conformément aux régulations. Par exemple, une transaction de swap de taux d’intérêt nécessitait une déclaration précise et la mise en place de garanties adéquates.

Impact des régulations sur les opérations quotidiennes

Les régulations influencent fortement les opérations quotidiennes des institutions financières. Elles nécessitent des systèmes robustes pour le reporting et la gestion des risques, ainsi qu’une collaboration étroite entre différents départements.

Systèmes et technologies

Les institutions doivent investir dans des systèmes informatiques avancés pour gérer les exigences de reporting et de compliance. Cela inclut des logiciels de gestion des risques, des plateformes de reporting et des systèmes de suivi des garanties.

Formation et sensibilisation

Il est essentiel que tous les employés soient formés aux régulations et aux politiques de compliance. Cela inclut des sessions de formation régulières et des mises à jour sur les nouvelles réglementations.

Conclusion

La compliance et la régulation sont essentielles pour maintenir la confiance et la stabilité dans le secteur financier. Pour les étudiants et futurs professionnels de la finance, comprendre ces régulations est crucial. Les prêts de titres et les dérivés OTC sont deux domaines où la régulation joue un rôle particulièrement important, nécessitant une attention constante et une gestion rigoureuse.

Ressources utiles

ESMA – SFTR

ESMA – EMIR

À propos de l’auteur

Cet article a été écrit en juillet 2024 par Esten CHAUVIN étudiant en Master de Management à l’ESSEC Business School, ancien stagiaire OTC Derivatives, Stock Loans, Repo Loans chez Oddo BHF.

Le marché des Repos : Principe et stratégie

Le marché des Repos : Principe et stratégie

Esten CHAUVIN

Dans cet article, Esten CHAUVIN (ESSEC Business School, Grande Ecole – Master in Management, 2023-2026) partage son expérience et ses connaissances sur le marché des Repos, leur principe et les stratégies associées en finance de marché.

Introduction

Les Repos, ou “repurchase agreements”, sont des instruments financiers couramment utilisés pour gérer la liquidité des institutions financières et financer leurs positions. Cet article vise à clarifier le principe des Repos et à expliquer les stratégies couramment utilisées.

Principe des Repos

Les Repos, ou accords de pension, sont des contrats financiers dans lesquels une partie (le vendeur) vend des titres à une autre partie (l’acheteur) avec l’engagement de les racheter à une date ultérieure à un prix convenu, généralement légèrement supérieur. Ce mécanisme permet au vendeur d’obtenir des liquidités à court terme tout en utilisant les titres comme garantie, tandis que l’acheteur bénéficie d’un placement sécurisé pour ses fonds excédentaires. En d’autres termes, le repo est une opération de financement à court terme qui offre une solution flexible pour la gestion de la trésorerie.

Parties prenantes

Les principaux acteurs dans un accord de repo sont le vendeur (souvent une institution financière cherchant à lever des liquidités) et l’acheteur (souvent une autre institution financière ou un investisseur institutionnel cherchant à investir des liquidités à court terme). Lors de mon stage chez Oddo BHF, j’ai pu observer ces interactions de première main. Nous collaborions fréquemment avec des contreparties telles que BNP Paribas, Société Générale, ainsi que des investisseurs institutionnels internationaux.

Processus des Repos

  1. Négociation des termes : Les termes de l’accord de repo sont négociés par les front offices des deux contreparties, incluant le type de titres, la durée de l’accord et le taux de repo. Le taux de repo représente les intérêts que le vendeur doit payer pour emprunter des liquidités à court terme en utilisant ses titres comme garantie et est généralement exprimé en pourcentage annuel.
  2. Transfert des titres : Une fois les termes acceptés, les titres sont transférés de manière sécurisée à l’acheteur.
  3. Fourniture des fonds : L’acheteur fournit les fonds au vendeur en échange des titres.
  4. Rachat des titres : À la fin de la période de repo, le vendeur rachète les titres au prix convenu et récupère ses titres. Les intérêts dus sur la période de l’accord sont calculés et payés au moment du rachat des titres. Par exemple, pour un accord de repo de 1 million d’euros avec un taux de 2% sur une période de trois mois, les intérêts seraient de 5 000 euros (1 000 000 € x 0,02 x 0,25), payés lors du rachat.

Types de garanties

Les garanties dans un accord de repo peuvent être des obligations d’État, des titres de créance d’entreprise ou d’autres titres financiers. Pour minimiser les risques de volatilité, nous travaillions principalement avec des obligations d’État, considérées comme des actifs à faible risque.

Calcul des taux de repo

Les taux de repo sont déterminés en fonction de plusieurs facteurs, dont le niveau de liquidité sur le marché, la durée du prêt et la qualité des titres utilisés comme garantie. Ces taux représentent les intérêts que le vendeur doit payer pour emprunter des liquidités à court terme en utilisant ses titres comme garantie. Durant mon stage, j’ai appris à négocier et à calculer ces taux en tenant compte des conditions du marché. Par exemple, les repos à court terme sur des obligations d’État françaises pouvaient avoir des taux plus bas en raison de la stabilité et de la liquidité de ces titres.

Stratégies des Repos

Stratégies pour les vendeurs

  • Gestion de la liquidité : Les vendeurs utilisent les repos pour lever des liquidités à court terme sans avoir à vendre définitivement leurs actifs. Par exemple, une banque peut utiliser un repo pour financer ses besoins de trésorerie quotidiens.
  • Optimisation du portefeuille : Les repos permettent aux institutions financières de gérer efficacement leurs portefeuilles en utilisant les actifs détenus comme garantie pour obtenir des fonds à court terme.

Stratégies pour les acheteurs

  • Placement sécurisé : Les acheteurs utilisent les repos pour placer des liquidités à court terme de manière sécurisée, en obtenant des titres en garantie.
  • Génération de revenus : En prêtant des fonds à des taux de repo compétitifs, les acheteurs peuvent générer des revenus supplémentaires sur leurs excédents de liquidité.

Enjeux des Repos

Avantages pour les parties prenantes

  • Pour le vendeur : Accès rapide à des liquidités, maintien de la propriété des titres, optimisation de la gestion de trésorerie.
  • Pour l’acheteur : Placement sécurisé des liquidités, génération de revenus à court terme, obtention de titres en garantie.

Risques associés

  • Pour le vendeur : Risque de défaut de l’acheteur, fluctuations de la valeur des titres en garantie.
  • Pour l’acheteur : Risque de ne pas récupérer les fonds prêtés si le vendeur fait défaut, volatilité des titres en garantie. Pour minimiser ces risques, nous ajustions régulièrement les garanties et surveillions les positions des contreparties. Par exemple, si nous utilisons des obligations d’État italiennes en garantie et que leur valeur chute soudainement, nous devons être prêts à demander une garantie supplémentaire pour couvrir le risque accru.

Réglementation et compliance

Les Repos sont soumis à une réglementation stricte pour garantir la transparence et la sécurité des transactions. Par exemple, en Europe, la régulation SFTR (Securities Financing Transactions Regulation) impose des exigences de reporting détaillées pour toutes les transactions de financement de titres. Durant mon stage de juillet à décembre 2023, nous devions nous assurer que toutes les transactions étaient conformes à ces régulations, souvent en collaborant étroitement avec le département de compliance.

Impact sur les marchés financiers

Les Repos contribuent à la liquidité des marchés en permettant une plus grande fluidité des titres et des fonds. Cependant, ils peuvent aussi influencer la volatilité et la stabilité des marchés, notamment en période de stress financier. Un exemple notable est l’impact des repos pendant la crise financière de 2008, où ces instruments ont joué un rôle crucial dans la gestion de la liquidité des institutions financières.

Cas pratiques et exemples

Pendant mon stage chez Oddo BHF, j’ai été directement impliqué dans la gestion de repos lors d’une période de tension sur les marchés financiers. Un exemple concret est survenu lors de l’annonce surprise de la Réserve fédérale américaine (Fed) en septembre 2023, lorsqu’ils ont décidé de maintenir les taux d’intérêt plus élevés que prévu. Cette annonce a entraîné une volatilité accrue sur les marchés des obligations d’État. Nous avions plusieurs accords de repo en cours avec des obligations françaises et italiennes. Avec la volatilité soudaine, nous avons dû ajuster rapidement les garanties et communiquer avec les contreparties pour s’assurer que les positions étaient couvertes. Cela a impliqué des négociations rapides et une coordination étroite avec les équipes de gestion des risques et de compliance pour s’assurer que toutes les transactions restaient conformes aux régulations en vigueur.

Comparaison avec d’autres mécanismes financiers

Repos vs prêts de titres

Les repos et les prêts de titres partagent des similitudes, comme l’utilisation de garanties. Cependant, les repos impliquent la vente temporaire d’un actif avec un accord de rachat , tandis que les prêts de titres concernent uniquement le prêt temporaire des titres sans vente.

Repos vs options et futures

Les repos et les dérivés financiers comme les options et futures sont utilisés pour la gestion des risques et la couverture. Cependant, les dérivés offrent des options de trading plus flexibles et des stratégies de gestion de portefeuille plus complexes par rapport aux repos.

Conclusion

Les Repos sont une pratique essentielle dans les marchés financiers, offrant des avantages significatifs aux vendeurs et aux acheteurs tout en présentant des risques qu’il convient de gérer avec soin. Pour les étudiants et les futurs professionnels de la finance, comprendre les mécanismes et les enjeux des Repos est crucial.

Autres articles sur le blog SimTrade

   ▶ Esten CHAUVIN Mon expérience chez OTC Securities Lending & Derivatives – Repo Loan

Ressources utiles

Pour approfondir vos connaissances sur les prêts de titres, voici quelques ressources recommandées :

SFTR (Securities Financing Transactions Regulation)

À propos de l’auteur

Cet article a été écrit en juillet 2024 par Esten CHAUVIN (ESSEC Business School, Grande Ecole – Master in Management, 2023-2026) et ancien stagiaire OTC Derivatives, Stock Loans, Repo Loans chez Oddo BHF.

Les prêts de titres (stock loans) : fonctionnement et enjeux

Les prêts de titres (stock loans) : fonctionnement et enjeux

Esten CHAUVIN

Dans cet article, Esten CHAUVIN (ESSEC Business School, Grande Ecole – Master in Management, 2023-2026) partage son expérience et ses connaissances sur les prêts de titres, leur fonctionnement et leurs enjeux en finance de marché.

Introduction

Les prêts de titres, aussi connus sous le terme “stock loans”, sont une pratique courante dans le monde financier. Ils permettent aux investisseurs d’optimiser l’utilisation de leurs titres tout en générant des revenus supplémentaires. Cet article a pour objectif de clarifier le fonctionnement des prêts de titres et d’expliquer les enjeux associés à cette pratique.

Fonctionnement des prêts de titres

Les prêts de titres sont un mécanisme où un propriétaire de titres prête ses titres à un emprunteur en échange d’une garantie et d’intérêts. Cela permet au prêteur de générer des revenus supplémentaires sans vendre ses actifs, optimisant ainsi l’utilisation de son portefeuille. Pour l’emprunteur, cette pratique offre la possibilité d’accéder temporairement à des titres sans avoir à les acheter, ce qui peut être crucial pour des stratégies telles que la vente à découvert ou la couverture de positions existantes.

Parties prenantes

Les principaux acteurs dans un prêt de titres sont le prêteur (souvent un fonds de pension ou une institution financière), l’emprunteur (généralement un trader cherchant à vendre les titres à découvert) et les intermédiaires comme les courtiers et les agents de prêt. Lors de mon stage chez Oddo BHF, j’ai pu observer ces interactions de première main, en travaillant avec divers acteurs pour assurer la fluidité des transactions. Par exemple, nous collaborions fréquemment avec des contreparties aussi bien nationales telles que BNP Paribas et Société Générale, qu’internationales comme Barclay’s ou Goldman Sachs.

Processus de prêt de titres

  1. Négociation des termes : Les termes du prêt sont négociés par les front offices des deux contreparties, incluant le type de titres, la durée du prêt et les frais. Ces frais, ou intérêts, sont calculés en fonction de la durée du prêt et du type de titres impliqués. Les modalités de paiement des intérêts, telles que la fréquence (mensuelle, trimestrielle) et la date de paiement, sont également définies lors de cette phase.
  2. Transfert des titres : Une fois les termes acceptés, les titres sont transférés de manière sécurisée à l’emprunteur.
  3. Gestion de la garantie : L’emprunteur fournit une garantie sous forme d’espèces ou d’autres titres. Cette garantie est ajustée régulièrement pour refléter les fluctuations de la valeur des titres prêtés. Par exemple, supposons qu’un emprunteur prête des actions d’une valeur de 1 million d’euros et qu’il fournisse une garantie de 1,1 million d’euros. Si la valeur des actions prêtées augmente à 1,2 million d’euros, l’emprunteur devra ajouter 100 000 euros supplémentaires à la garantie pour maintenir un ratio de couverture adéquat. À l’inverse, si la valeur des actions baisse à 900 000 euros, l’emprunteur peut récupérer 100 000 euros de la garantie. Ces ajustements, appelés appels de marge, sont cruciaux pour gérer le risque de marché et s’assurer que les intérêts des deux parties sont protégés.
  4. Restitution des titres : À la fin de la période de prêt, les titres sont restitués au prêteur et la garantie est libérée. Les intérêts accumulés pendant la durée du prêt sont payés à des intervalles définis (par exemple, mensuellement ou trimestriellement) et un dernier paiement d’intérêts est effectué lors de la restitution des titres. Ces paiements sont essentiels pour compenser le prêteur pour l’utilisation de ses actifs.

Il est primordial d’utiliser des systèmes avancés afin de garantir la sécurité et l’efficacité des très nombreuses transactions quotidiennes. Ces systèmes incluent des logiciels de gestion de risques, des plateformes de trading automatisées, et des systèmes de suivi et de reporting en temps réel. Par exemple, le tout premier deal que j’ai eu à gérer en débutant mon stage fut un prêt d’actions de TotalEnergies à un hedge fund basé à Londres. Nous avons utilisé une plateforme de trading pour exécuter la transaction et un système de gestion des risques pour évaluer et ajuster la garantie, qui était composée d’obligations d’État françaises. Ce type de transaction demande une coordination minutieuse pour s’assurer que les valeurs des actifs prêtés et reçus restent équilibrées, et cela n’est possible qu’avec des outils technologiques sophistiqués qui permettent de suivre et de sécuriser chaque étape du processus.

Types de garanties

Les garanties peuvent être des espèces, des obligations ou d’autres titres. Le type de garantie accepté dépend des termes du prêt et des politiques internes de l’institution financière. Afin de minimiser les risques de volatilité, j’ai principalement travaillé avec des garanties sous forme d’espèces.

Calcul des frais de prêt

Les frais de prêt sont calculés en fonction de plusieurs facteurs, dont le taux d’intérêt, la durée du prêt et le type de titres. Ces frais représentent le coût pour l’emprunteur d’accéder aux titres prêtés. Durant mon stage, j’ai appris à calculer ces frais en tenant compte des conditions du marché et des politiques internes. Par exemple, en novembre 2023, le prêt d’actions de TotalEnergies avait un taux d’intérêt annuel de 1,5%. Pour un prêt de 1 million d’euros sur trois mois, les frais étaient de 3 750 euros (1 000 000 € x 0,015 x 0,25). En comparaison, les actions de Tesla avaient un taux de prêt de 3,2%, ce qui entraînait des frais de 8 000 euros pour la même période (1 000 000 € x 0,032 x 0,25) en raison de leur forte demande.

Pair Off

Les “pair off” sont une technique couramment utilisée dans la gestion des prêts de titres. Il s’agit de l’annulation simultanée de deux transactions opposées, ce qui permet de réduire le volume des transactions en cours et de minimiser les risques associés. Par exemple, si une institution financière a prêté des titres à deux contreparties différentes qui souhaitent ensuite restituer les titres à la même période, les transactions peuvent être “pair off” pour simplifier le processus de restitution.

Enjeux des prêts de titres

Avantages pour les parties prenantes

  • Pour le prêteur : Génération de revenus supplémentaires à partir des titres détenus, optimisation de l’utilisation des actifs. Par exemple, un fonds de pension peut prêter des titres pour augmenter ses rendements.
  • Pour l’emprunteur : Accès temporaire à des titres sans achat direct, possibilité de couvrir des positions courtes. Un trader peut aussi emprunter des titres pour vendre à découvert.

Risques associés

  • Pour le prêteur : Risque de défaut de l’emprunteur, volatilité des garanties pouvant affecter leur valeur.
  • Pour l’emprunteur : Coût du prêt, risque de rappel des titres prêtés avant la fin prévue du prêt. Pour minimiser ces risques, nous ajustions régulièrement les garanties et surveillions les positions des emprunteurs. Par exemple, si nous prêtons des actions Apple à un hedge fund et que ces actions chutent soudainement, nous devions être prêts à appeler une garantie supplémentaire pour couvrir le risque accru.

Réglementation et compliance

Les prêts de titres sont soumis à une réglementation stricte pour garantir la transparence et la sécurité des transactions. Par exemple, en Europe, la régulation SFTR (Securities Financing Transactions Regulation) impose des exigences de reporting détaillées pour toutes les transactions de financement de titres. Durant mon stage, nous devions nous assurer que toutes les transactions étaient conformes à ces régulations, souvent en collaborant étroitement avec le département de compliance.

Impact sur les marchés financiers

Les prêts de titres contribuent à la liquidité des marchés en permettant une plus grande fluidité des titres. Cependant, ils peuvent aussi influencer la volatilité et la stabilité des marchés, notamment lorsqu’ils sont utilisés pour des ventes à découvert massives. Un exemple notable est l’impact des ventes à découvert pendant la crise financière de 2008, où les prêts de titres ont joué un rôle crucial dans la dynamique des marchés.

Cas pratiques et exemples

Pendant mon stage chez Oddo BHF, j’ai été directement impliqué dans la gestion de prêts de titres lors d’une période de forte volatilité du marché. Un exemple concret est survenu lors de la publication des résultats du Q3 d’un géant américain de la tech. Ces résultats étaient significativement en dessous des attentes, ce qui a entraîné une chute rapide du cours de l’action. Nous avions prêté des actions de cette entreprise à plusieurs hedge funds, et avec la baisse soudaine, la valeur de la garantie (collatéral) que nous avions reçue devait être ajustée rapidement pour couvrir le risque accru.

Dans cette situation, nous avons immédiatement contacté les contreparties pour augmenter la garantie en espèces afin de compenser la chute de la valeur des actions. Cela a impliqué des négociations rapides et une coordination étroite avec les équipes de gestion des risques et de compliance pour s’assurer que toutes les transactions étaient conformes aux régulations en vigueur.

Comparaison avec d’autres mécanismes financiers

Repos vs prêts de titres

Les repos (repurchase agreements) et les prêts de titres partagent des similitudes, comme l’utilisation de garanties. Cependant, les repos impliquent la vente temporaire d’un actif avec un accord de rachat, tandis que les prêts de titres concernent uniquement le prêt temporaire des titres sans vente.

Prêts de titres vs options et futures

Les prêts de titres et les dérivés financiers comme les options et futures sont utilisés pour la gestion des risques et la couverture. Cependant, les dérivés offrent des options de trading plus flexibles et des stratégies de gestion de portefeuille plus complexes par rapport aux prêts de titres.

Conclusion

Les prêts de titres sont une pratique essentielle dans les marchés financiers, offrant des avantages significatifs aux prêteurs et aux emprunteurs tout en présentant des risques qu’il convient de gérer avec soin. Pour les étudiants et les futurs professionnels de la finance, comprendre les mécanismes et les enjeux des prêts de titres est crucial.

Avec l’évolution des technologies et des régulations, les pratiques de prêt de titres continuent de se transformer. Les professionnels de la finance doivent rester informés et adaptables pour naviguer efficacement dans ce paysage en mutation.

Autres articles sur le blog SimTrade

   ▶ Esten CHAUVIN Mon expérience chez OTC Securities Lending & Derivatives – Repo Loan

Ressources utiles

Pour approfondir vos connaissances sur les prêts de titres, voici quelques ressources recommandées :

How stock loans financing works

À propos de l’auteur

Cet article a été écrit en juillet 2024 par Esten CHAUVIN (ESSEC Business School, Grande Ecole – Master in Management, 2023-2026) et ancien stagiaire OTC Derivatives, Stock Loans, Repo Loans chez Oddo BHF.

Back office, Middle Office, Front Office: quels rôles, quelles responsabilités ?

Back office, Middle Office, Front Office: quels rôles, quelles responsabilités ?

Esten CHAUVIN

Dans cet article, Esten CHAUVIN (ESSEC Business School, Grande Ecole – Master in Management, 2023-2026) partage son expérience et ses connaissances sur les rôles et responsabilités du back office, middle office et front office en finance de marché.

Introduction

Les institutions financières sont structurées en plusieurs départements essentiels à leur fonctionnement. Parmi eux, le back office, le middle office et le front office jouent des rôles distincts mais complémentaires. Cet article a pour objectif de clarifier les responsabilités spécifiques de chaque département et d’illustrer comment leur interaction contribue à l’efficacité globale de l’institution.

Rôles et responsabilités du Back Office

Le back office est souvent considéré comme le moteur silencieux des institutions financières. Il est principalement responsable du traitement des transactions financières après leur exécution. Cela inclut la confirmation et le règlement des transactions. Par exemple, lorsque vous achetez une action, le back office s’assure que les titres sont correctement livrés et que les fonds sont transférés.

Outre le traitement des transactions, le back office gère les aspects administratifs et comptables. Cela signifie tenir les livres comptables de l’institution et préparer les rapports financiers nécessaires. Imaginez qu’à la fin de chaque journée de trading, toutes les transactions doivent être enregistrées avec précision pour les audits et les rapports financiers. C’est le back office qui veille à cette rigueur.

Des tâches spécifiques incluent le règlement et la livraison des titres, où les détails de la transaction sont confirmés avec les contreparties. Le back office gère également les confirmations et les réconciliations, en rapprochant les transactions entre les systèmes internes et les contreparties pour identifier et résoudre les divergences. Enfin, ils sont responsables du reporting réglementaire et financier, préparant et soumettant des rapports aux régulateurs financiers.

Rôles et responsabilités du Middle Office

Le middle office joue un rôle crucial en matière de gestion des risques et de trésorerie. Il identifie, mesure et gère les différents types de risques : marché, crédit et liquidité. Par exemple, si une banque a un portefeuille de trading important, le middle office utilise des modèles quantitatifs pour évaluer le risque associé.

La gestion de la trésorerie et des marges est une autre responsabilité clé. Le middle office surveille les flux de trésorerie et gère les marges pour s’assurer que l’institution dispose de suffisamment de liquidités pour ses opérations. Imaginez gérer au quotidien les besoins de trésorerie pour éviter les déficits et optimiser l’utilisation des ressources.

Parmi les tâches spécifiques, le middle office suit les positions et les expositions en temps réel pour identifier les risques potentiels. Il gère également les liquidités et le collatéral, optimisant leur utilisation pour maximiser l’efficacité financière. Enfin, il calcule et suit les risques de marché, de crédit et de liquidité, utilisant des modèles de risque pour évaluer et atténuer les risques potentiels.

Rôles et responsabilités du Front Office

Le front office est la vitrine de l’institution financière, en première ligne pour interagir avec les marchés et effectuer des transactions financières. Les traders du front office exécutent des ordres sur les marchés financiers, qu’il s’agisse d’actions, d’obligations, de devises ou de dérivés.

Le front office est également responsable de la génération de revenus pour l’institution. Les traders développent des stratégies de trading et prennent des positions pour maximiser les profits. Par exemple, ils analysent les marchés et prennent des positions en fonction des conditions économiques pour générer des gains.

En plus du trading, le front office offre des conseils et des services aux clients. Cela peut inclure des recommandations d’investissement ou des services de gestion de patrimoine. Ils élaborent également des stratégies de négociation basées sur l’analyse des marchés et des conditions économiques, utilisant leur expertise pour prendre des décisions éclairées.

Comparaison et interactions entre les trois départements

Bien que chaque département ait des fonctions et des responsabilités distinctes, ils sont étroitement liés et dépendent les uns des autres. Le front office, par exemple, dépend du middle et du back office pour le soutien opérationnel et la gestion des risques. Sans une collaboration efficace, les transactions ne pourraient pas être exécutées de manière fluide et les risques ne seraient pas correctement gérés.

La communication et la coordination entre les départements sont essentielles. Prenons l’exemple d’une transaction financière complexe : le front office exécute l’ordre, le middle office surveille le risque et le back office traite la transaction. Une communication efficace entre ces départements garantit que chaque étape du processus est réalisée correctement, minimisant ainsi les erreurs et les risques.

Conclusion

Chaque département – back office, middle office et front office – joue un rôle crucial dans une institution financière. Le back office assure le bon déroulement des transactions et la conformité administrative, le middle office gère les risques et la trésorerie, et le front office génère des revenus et interagit avec les marchés. Ensemble, ils contribuent à l’efficacité et à la rentabilité de l’institution.

Avec l’avènement des nouvelles technologies, comme l’automatisation et l’intelligence artificielle, les rôles traditionnels de ces départements évoluent. Les compétences requises se transforment également, et il est essentiel pour les futurs professionnels de se tenir à jour avec ces changements pour réussir dans le secteur financier.

Autres articles sur le blog SimTrade

   ▶ Youssef LOURAOUI My experience as a portfolio manager in a central bank

   ▶ Alexandre VERLET Working in finance: trading

   ▶ Akshit GUPTA Analysis of The Rogue Trader movie

Ressources utiles

Pour approfondir vos connaissances sur les rôles du back office, middle office et front office, voici quelques ressources recommandées :

Les différences entre le front, le middle et le back office en banque d’investissement

À propos de l’auteur

Cet article a été écrit en juillet 2024 par Esten CHAUVIN (ESSEC Business School, Grande Ecole – Master in Management, 2023-2026) et ancien stagiaire OTC Derivatives, Stock Loans, Repo Loans chez Oddo BHF.

Mon expérience chez OTC Securities Lending & Derivatives – Repo Loan

Mon expérience chez OTC Securities Lending & Derivatives – Repo Loan

Esten CHAUVIN

Dans cet article, Esten CHAUVIN (ESSEC Business School, Grande Ecole – Master in Management, 2023-2026) partage son expérience professionnelle comme stagiaire chez Oddo BHF dans le département OTC Securities Lending & Derivatives – Repo Loan.

A propos de l’entreprise

Oddo BHF est une société financière franco-allemande offrant des services bancaires et financiers diversifiés. Fondée en 1849, l’entreprise s’est développée au fil des décennies pour devenir un acteur majeur dans le secteur de la gestion d’actifs, de la banque d’investissement et des services financiers. Oddo BHF est particulièrement reconnue pour son expertise en matière de recherche et d’analyse financière.

Avec une présence dans plusieurs pays européens, Oddo BHF combine des valeurs traditionnelles avec une approche moderne de la finance, mettant l’accent sur l’innovation et la satisfaction client.

Logo de l’entreprise.
Logo de Oddo BHF
Source : Oddo BHF.

Mon stage / Mon apprentissage

Durant mon stage chez Oddo BHF, j’ai travaillé dans le département OTC Securities Lending & Derivatives – Repo Loan. Ce département est crucial pour la gestion des prêts de titres et des produits dérivés de gré à gré, jouant un rôle essentiel dans la gestion des risques et la liquidité de l’institution.

Mes missions

Mes missions principales consistaient à traiter et à valider les transactions de prêts de titres, à gérer les expositions aux risques, et à assurer la conformité des opérations avec les régulations en vigueur. J’ai également participé à l’optimisation des processus de gestion de la trésorerie et des garanties.

Compétences et connaissances requises

Pour réussir dans ce stage, il était essentiel de posséder des compétences techniques solides en finance et en analyse de données. La maîtrise d’Excel et des systèmes de gestion de risques était indispensable. En termes de soft skills, la rigueur, l’organisation et une excellente communication étaient cruciales pour interagir efficacement avec les différentes équipes.

Ce que j’ai appris

Ce stage m’a permis d’acquérir une compréhension approfondie des mécanismes des prêts de titres et des produits dérivés. J’ai également développé des compétences en gestion des risques et appris à naviguer dans un environnement réglementaire complexe. Ce fut une expérience enrichissante qui a renforcé mon intérêt pour la finance de marché.

Concepts financiers liés à mon stage

Prêts de titres

Les prêts de titres permettent aux investisseurs de prêter leurs titres en échange d’une garantie et de frais, optimisant ainsi l’utilisation de leurs actifs.

Repos Loans

Les repos loans sont des accords où un vendeur vend des titres avec l’engagement de les racheter à une date ultérieure, fournissant ainsi une source de liquidités à court terme.

Gestion des risques

La gestion des risques implique l’identification, l’évaluation et la mitigation des risques financiers, notamment en utilisant des modèles quantitatifs et des stratégies de couverture.

Pourquoi pourrais-je être intéressé par cet article ?

Si vous êtes un étudiant de l’ESSEC intéressé par une carrière en finance de marché, cet article vous donne un aperçu précieux des responsabilités et des compétences nécessaires pour réussir dans ce domaine. Mon expérience chez Oddo BHF vous aidera à mieux comprendre les défis et les opportunités de ce secteur.

Autres articles sur le blog SimTrade

   ▶ All posts about Professional experiences

   ▶ Alexandre VERLET Classic brain teasers from real-life interviews

   ▶ David-Alexandre BLUM My professional experience as an Institutional Sales Assistant with Lazard Frères Gestion

   ▶ Chloé ANIFRANI My experience as an Asset Management Sales Assistant for Amplegest

   ▶ Tanguy TONEL My experience as an Investment Specialist at Amundi Asset Management

Ressources utiles

Voici quelques ressources utiles pour en savoir plus sur Oddo BHF et le secteur financier :

Site officiel d’Oddo BHF

A propos de l’auteur

Cet article a été écrit en juillet 2024 par Esten CHAUVIN (ESSEC Business School, Grande Ecole – Master in Management, 2023-2026).

Top financial innovations in the 20th century

Top financial innovations in the 20th century

Nithisha CHALLA

In this article, Nithisha CHALLA (ESSEC Business School, Grande Ecole Program – Master in Management (MiM), 2021-2024) presents top financial innovations of the 20th century that have brought significant changes in people’s life.

Introduction

Financial innovations have significantly transformed how people make transactions and manage money like saving and investing. These innovations have increased accessibility, convenience, and security in financial activities, benefiting individuals and companies alike. From the introduction of paper money in ancient China to modern-day digital banking, each era has brought new ways to manage finances. The 20th and 21st centuries, in particular, have seen rapid advancements due to technology, leading to groundbreaking changes in financial services.

Top Financial Innovations that Changed People’s Life in the 20th century

Our selection of financial innovations is based on their wide adoption by firms and individuals (usage in many countries worldwide).
  • Credit Cards and Debit Cards: Introduced in the 1950s, credit and debit cards provided a convenient way for consumers to make purchases without cash, leading to a shift towards a cashless society.
  • Automated Teller Machines (ATMs): ATMs revolutionized banking by allowing customers to perform transactions anytime, anywhere, without needing to visit a bank branch.
  • Telephone Banking: The rise of the internet in the 1980s enabled banks to allow customers to perform basic banking transactions, such as checking account balances and transferring funds, via phone.
  • Online Banking: The rise of the internet in the 1990s enabled banks to offer online services, making it easier for customers to manage accounts, pay bills, and transfer money.

We explain below how these financial innovations impacted people’s lives and companies. We also give some statistics to measure the impact.

Credit Cards and Debit Cards

The Diners Club card, introduced by Frank McNamara card in 1950, is considered the first credit. Later, Bank of America launched the BankAmericard (now Visa) in 1958. Later, Visa became one of the largest credit card issuers globally. MasterCard, originally Interbank Card Association, formed in 1966, is another major player in the credit card industry. The concept of a debit card was first introduced by the First National Bank of Seattle in 1966. The first debit card was issued by Barclays in the UK in 1966.

These Credit and Debit cards provided consumers a convenient and secure way to purchase without carrying cash. It allowed for the development of the credit industry, enabling consumers to borrow funds for purchases and pay them back over time. Which also helped customers make larger purchases thus improving purchasing power.

To speak on how much these innovations affected people, by the end of the 20th century, there were over 1 billion credit cards in use globally. And in 2019, Visa and MasterCard together processed over 171 billion transactions worldwide. In terms of debit card transactions, it recorded over 100 billion debit card transactions globally in 2020.

First ever credit card picture
Source: Time news letter

Figure 1 below presents the evolution of the size of the credit card industry in the United States from 2013 to 2023.

Figure 1. The market size of the US credit card industry
US market evolution of Credit cards industry
Source: Time news letter

Automated Teller Machines (ATMs)

John Shepherd-Barron is credited with inventing the first ATM, which was installed by Barclays Bank in London in 1967. Later, Diebold Nixdorf and NCR Corporation became the major manufacturers of ATMs in the 1980’s till date.

These ATMs provided 24/7 access to banking services, allowing customers to withdraw cash, check balances, and perform other transactions without needing to visit a bank branch. Hence enhanced convenience and reduced the need for in-person banking services. Helping in reducing queues at banks and improving transaction speed. Overall, this innovation has increased accessibility, convenience, and efficiency both for banks and for the consumers.

To speak on how much these innovations affected people, by 1990, there were around 100,000 ATMs worldwide. As of 2020, there are approximately 3.2 million ATMs globally. The global ATM market was valued at around $18.4 billion in 2019.

First ever ATM picture
Source: Time news letter

Figure 2 below presents the evolution of the globally installed of ATM bases in the period of 2009 to 2020.

Figure 2. ATM global evolution

Source: Time news letter

Telephone Banking

Midland Bank (now part of HSBC) launched the first telephone banking service in the UK in 1989. HSBC pioneered telephone banking services and Citibank also offered telephone banking as part of its service portfolio being one of the early adopters of telephone banking. This is considered the innovation of the 1980-1990 decade.

This innovation has allowed customers to perform basic banking transactions, such as checking account balances and transferring funds, via phone. Provided a convenient alternative to visiting a bank branch, especially for those without internet access, and reduced risks associated with carrying cash or checks.

To speak on how much these innovations affected people, by the late 1990s, telephone banking was widely adopted, with millions of users globally. Despite the rise of online and mobile banking in the 21st century, telephone banking remains a valuable service for many customers, particularly the elderly and those in rural areas. In 2019, an estimated 5% of U.S. adults still used telephone banking. And by 2000, more than 50% of U.S. banks offered telephone banking services.

First ever touch-tone telephone banking machine in 1973.
 First ever telephone banking machine picture
Source: ZB Media

Figure 1 shows what the first ever telephone banking machine looked like in 1973.

Online Banking

The concept of online baking was developed by banks like Stanford Federal Credit Union, which offered the first online banking services in 1994. Bank of America was one of the early adopters of online banking and Wells Fargo Launched its first internet banking service in 1995.

This innovation has provided customers with the ability to manage their accounts, pay bills, transfer funds, and perform other banking activities from the comfort of their homes. It reduced the need for physical bank branches and made banking services more accessible.

To speak on how much these innovations affected people, by 2019, 76% of U.S. adults used online banking. The global online banking market was valued at $9.2 billion US dollars in 2019. And global online banking users are expected to reach 2.5 billion by 2024.

First ever Online banking machine in 1980.
 First ever Online banking machine picture
Source: Fintech Magazine

Figure 1 shows what the first-ever Online banking machine looked like in 1980.

Conclusion

Financial innovations have profoundly transformed the way individuals and businesses interact with money. From the widespread adoption of credit cards to mobile payments these innovations have made financial services more accessible, efficient, and secure. As technology continues to advance, the financial landscape will undoubtedly see further changes, continuing to shape and improve people’s lives worldwide.

Why should I be interested in this post?

Management students, as future leaders and decision-makers, should understand financial innovations for several compelling reasons. These innovations not only influence the financial landscape but also have significant implications for strategic decision-making, operational efficiency, and competitive advantage.

Related posts on the SimTrade blog

   ▶ Aamey MEHTA Market efficiency: the case study of Yes bank in India

   ▶ Louis DETALLE The importance of data in finance

Useful resources

Wikipedia Financial Innovations

Fintech Magazine Online Banking 1973 – History of Computers

ZB Media Technology in Fintech and the story of Online Banking

Research gate The emergence of financial innovation and its governance – a historical literature review

Axis bank Credit card: A cashless surge

Allied market research Mobile Payment Market Expected to Reach $12.06 Trillion by 2027

Cambridge University Press Banking and Finance in the Twentieth Century

About the author

The article was written in July 2024 by Nithisha CHALLA (ESSEC Business School, Grande Ecole Program – Master in Management (MiM), 2021-2024).

The Yield Curve

The Yield Curve

Ziqian ZONG

In this article, Ziqian ZONG (ESSEC Business School, Global BBA exchange, 2024) presents a comprehensive overview of the yield curve and its importance in bond markets. The article also explores the different types of Treasury securities and the various term structures of yield curves.

This article is structured as follows: we start with an introduction to the concept of the yield curve. Then, we discuss the types of Treasury securities and the different term structures of yield curves. Next, we delve into the reasons for different yield spreads and the importance of the yield curve. Finally, we explain the phenomenon of the inverted yield curve and its implications.

Introduction

The yield curve is a fundamental concept in bond markets that depicts the relationship between interest rates (or yields) and different maturities of debt securities, typically government bonds. It is a powerful tool for analyzing the economic outlook, making investment decisions, and pricing bonds.

The type of the yield curve

The term structure of the yield curve shows the yields of bonds with equal credit quality but different maturity dates. It provides a snapshot of how interest rates vary over short, medium, and long-term maturities. For example, there is a yield curve for the securities issued by the government in each country. In the United States, Treasury securities, issued by the U.S. Department of the Treasury, are called according to their maturity: Treasury bills, Treasury notes, and Treasury bonds.

Treasury Bills (T-Bills)

Treasury bills (T-Bills) are short-term securities with maturities of one year or less. They do not pay periodic interest; instead, they are sold at a discount from their face value, and the interest earned is the difference between the purchase price and the face value paid at maturity. T-Bills are primarily used for short-term government financing needs and generally offer lower yields due to their shorter maturities and lower risk of interest rate fluctuations.

Treasury Notes (T-Notes)

Treasury notes (T-Notes) are medium-term securities with maturities ranging from two to ten years. They pay semi-annual interest at a fixed rate and return the face value at maturity. T-Notes are used for intermediate-term government financing and typically offer higher yields than T-Bills, reflecting the increased risk associated with a longer investment period.

Treasury Bonds (T-Bonds)

Treasury bonds (T-Bonds) are long-term securities with maturities exceeding ten years, often up to 30 years. They also pay semi-annual interest at a fixed rate and return the face value at maturity. T-Bonds are utilized for long-term government financing and offer the highest yields among the three types of Treasury securities, compensating investors for the longer maturity and greater interest rate risk.

Figure 1 below gives the yield curve for the Treasuries in the United States on June 28, 2024.

Yield curve for US Treasuries (28/06/2024)
Source: U.S. Department of Treasury

You can download below the Excel file for the data used to build the figure for the yield curve for US Treasuries.

Download the Excel file for the data used to build the figure for the yield curve for US Treasuries

Different types of yield curves

Normal Yield Curve

This upward-sloping curve indicates that longer-term bonds have higher yields to maturity (YTM) than shorter-term bonds. This shape reflects expectations of rising interest rates and economic growth, as investors demand higher returns for locking in their money over a longer period.

Inverted Yield Curve

This downward-sloping curve occurs when shorter-term bonds have higher YTM than longer-term bonds. This unusual situation often signals an impending economic recession, as investors expect future interest rates to decline.

Flat Yield Curve

When YTM across various maturities are similar, it suggests economic uncertainty, with no clear direction for future interest rates. Investors are indifferent to holding bonds of different maturities, reflecting mixed signals about future economic conditions.

Hump-Shaped Yield Curve

This curve shows higher YTM for medium-term bonds compared to both short-term and long-term bonds. This shape, often referred to as a “hump,” can indicate specific market conditions, such as expectations of moderate economic growth or short-term inflation pressures. This leads to increased demand for intermediate-term securities like T-Notes, pushing up their yields relative to both short-term and long-term bonds.

Figure 2 below gives different types of yield curves.

Types of yield curves
Source: Ziqian ZONG

You can download below the Excel file used to build the figure for the different types of yield curve.

Download the Excel file used to build the figure for the different types of yield curve

Reasons for different yield spreads

Market expectations of future interest rates play a crucial role in shaping the yield curve. The link between spot rates (current interest rates for immediate borrowing or lending) and forward rates (expected future interest rates) is essential in this analysis. In a two-period model, for example, the yield on a two-year bond can be seen as a combination of the yield on a one-year bond today and the expected yield on a one-year bond one year from now. This relationship helps investors infer the market’s expectations of future rates from the current yield curve.

The term premium, which compensates investors for the risk associated with holding longer-term securities, also plays a crucial role in shaping the yield curve. Changes in risk aversion and market uncertainty can lead to fluctuations in the term premium, which in turn can affect the slope of the yield curve independently of monetary policy actions. When investors perceive higher risks, they demand a higher term premium, causing long-term yields to rise relative to short-term yields. Conversely, when market uncertainty decreases, the term premium declines, potentially flattening or inverting the yield curve even if central bank policies remain unchanged.

Importance of the Yield Curve

The yield curve serves as a crucial barometer for various aspects of the financial markets, providing insights into economic conditions, guiding investment decisions, and informing monetary policy.

The shape of the yield curve is a widely recognized predictor of economic growth or recession. Historically, an inverted yield curve, where short-term yields exceed long-term yields, has often preceded economic recessions. For example, prior to the 2008 financial crisis, the yield curve inverted in late 2006 and early 2007, signaling the forthcoming downturn. However, it’s important to note exceptions, such as the 1966 and 1998 inversions, which did not lead to immediate recessions, illustrating that while the yield curve is a powerful tool, it is not infallible.

Investors closely monitor the yield curve to determine the relative attractiveness of short-term versus long-term investments. A steep yield curve, where long-term yields are significantly higher than short-term yields, suggests expectations of economic growth and inflation, encouraging investment in long-term bonds. Conversely, a flat or inverted yield curve might indicate economic uncertainty or a potential recession, prompting investors to favor shorter-term securities. For instance, during the late 1990s dot-com bubble, the yield curve flattened, signaling caution and influencing investment strategies towards shorter maturities.

Central banks, such as the Federal Reserve, scrutinize the yield curve to gauge the impact and effectiveness of their monetary policies. A steepening yield curve often signals that monetary easing, such as lowering interest rates, may be warranted to stimulate economic growth. Conversely, a flattening or inverted yield curve can indicate that monetary tightening is needed to curb inflation. For example, in the early 1980s, the Federal Reserve, under Chairman Paul Volcker, aggressively raised short-term interest rates to combat inflation, leading to a significant inversion of the yield curve.

The Inverted Yield Curve

An inverted yield curve is a financial phenomenon where short-term interest rates surpass long-term rates. An inversion of this curve is seen as an anomaly and is closely monitored by economists and investors for its historical role as a predictor of economic recessions.

Common Indicators to Measure Yield Curve Inversion

10-Year Treasury Note vs. 1-Year Treasury Note is one of the most commonly used indicators to measure the yield curve. It compares the yield on the 10-year U.S. Treasury note with the yield on the 1-year U.S. Treasury note.

Reasons for Inversion

  • Monetary Policy: When central banks raise short-term interest rates to combat inflation, it can lead to an inverted yield curve.
  • Economic Expectations: Investors may expect slower economic growth or a recession, leading them to prefer long-term bonds for their perceived safety, driving down long-term yields.

Why should I be interested in this post?

Understanding the yield curve is essential for analyzing economic conditions, making informed investment decisions, and understanding market expectations. This article provides valuable insights into how interest rates affect the bond market and the broader economy, offering practical knowledge for anyone involved in finance or investment.

Related posts on the SimTrade blog

   ▶ Ziqian ZONG My experience as a Quantitative Investment Intern in Fortune Sg Fund Management

   ▶ Rodolphe CHOLLAT-NAMY Bond markets

   ▶ Jayati WALIA Fixed-income products

Useful resources

Academic resources

Fabozzi, F.J., & Mann, S.V. (2012) Appendix 2: Yield Curves. In The Handbook of Fixed Income Securities (8th ed.). Wiley.

Business resources

U.S. Department of the Treasury. Interest Rate Statistics.

About the author

The article was written in July 2024 by Ziqian ZONG (ESSEC Business School, Global BBA exchange, 2024).

The environmental impact of cocoa

The environmental impact of cocoa

Mathis DIALLO

In this article, Mathis DIALLO (ESSEC Business School, Grande Ecole Program – Master in Management, 2023-2026) explains what the environmental repercussions of the production and supply of cocoa are.

Introduction

The carbon footprint is an which measures the anthropogenic greenhouse gas emissions, i.e. a measure of the emissions that can be attributed to that human activity. Unfortunately, chocolate produces a lot of green gas emissions. Growing and harvesting cocoa, making chocolate, transportation, packaging: each stage of production produces greenhouse gases.

Figure 1 gives the process flowchart for cocoa production designed by Sucden (a French trading company specializing in soft commodities and mainly in sugar).

Process flowchart for cocoa production
Source: Sucden.

Global cocoa production therefore has a significant environmental impact. However, chocolate can also influence the climate and deforestation. Indeed, the manufacture of this product has a negative impact on the environment. Certain prints also have an impact on cocoa plantations.

Cocoa’s carbon footprint

It seems fair to say that chocolate’s carbon footprint is far from acceptable. A kilo of chocolate has a carbon footprint of around 13.7kg of CO² (data from the Agribalyse database). The two factors that will influence the increase or decrease of this figure are either the type of chocolate, or its impact on deforestation. It means that some types of chocolates may need more transformation than others, which implies that there will be more chances to require some other products which have some influence in the green gas emissions.

Cocoa production is responsible for 70% of chocolate’s CO² emissions. All subsequent stages are included in the remaining 30%: processing from cocoa to packaging, addition of other foods and transport to the point of sale.

Most cocoa is grown using conventional agricultural methods such as pesticides, machinery and fertilizers. These processes are energy-intensive and directly produce greenhouse gases, with the result that agriculture currently accounts for around 20% of global emissions.

In the case of cocoa beans, there are also processing steps. The cocoa beans are first ground into cocoa powder, then the other ingredients are added:

  • Cocoa per kilo consumes more greenhouse gases than cow’s milk for milk chocolate or white chocolate, mainly due to the methane associated with livestock farming.
  • Sugar, palm oil (also responsible for deforestation), preservatives, etc. all contribute to the carbon footprint of chocolate.

The carbon footprint of chocolate is further increased by transport, as cocoa is grown only in countries located around the equator.

The current environmental problems of deforestation caused by cocoa

We have cleared areas of primary forest in Côte d’Ivoire to grow more cocoa. This country, which used to export the most cocoa in the world, has destroyed 90% of its forests in 60 years!

The primary cause of deforestation in West Africa is cocoa farming, which accounts for 70% of the world’s cocoa production.

Since 1960, Côte d’Ivoire has lost 90% of its afforestation. If the trend does not change, the entire Ivorian forest will disappear by 2034, according to some ecologists.

So, given all these problems linked to the production and delivery of cocoa to our market, it’s understandable that some people are reacting. For many specialists, chocolate is the symbol of our globalized system, which he does not hesitate to criticize: “The international cocoa-chocolate market today is the portrait of a capitalism at the end of its rope, locked in its own contradictions: the enormous amount of money invested and mobilized to maintain the levels of production and consumption necessary for the survival of the model completely paralyzes action and innovation”, he explains, painting a rather bitter picture of today’s market.

A glimmer of hope for the future

Even if the market seems to be ticking a lot of the wrong boxes, some people are still trying to change things.

In December 2022, a new European regulation was introduced to prevent the import of products derived from deforestation (the European Union (EU) deforestation-free regulation (EUDR)). . This applies to products such as coffee, cocoa, rubber and palm oil.

By requiring the companies concerned to guarantee that the products they export involve zero or negligible risk of deforestation, these regulations will certainly help the cocoa sector to become more responsible in the future, to the benefit of both producers and our planet.

Why should I be interested in this post?

Thus, we can see how much the process of production of cocoa a significant impact in our environment may have, be it with deforestation, but also with the process of supply chain itself.

Related posts

   ▶ Mathis DIALLO The cocoa production

   ▶ Mathis DIALLO The price of cocoa

   ▶ Mathis DIALLO Different types of chocolate

   ▶ Mathis DIALLO The Armarajo hedge fund’s corner in the cocoa market in 2010

Useful resources

Anna Gardner (07/05/2022) The Cocoa Industry: Its Environmental Impacts ClimaTalk

Sucden Products and activities – Cocoa

About the author

The article was written in July 2024 by Mathis DIALLO (ESSEC Business School, Grande Ecole Program – Master in Management, 2023-2026).

The cocoa production

The cocoa production

Mathis DIALLO

In this article, Mathis DIALLO ((ESSEC Business School, Grande Ecole Program – Master in Management, 2023-2026) explains all the process of the cocoa production (cocoa grinding, types of cocoa).

Introduction

Despite a fairly complex process, cocoa production has continued to increase since the 1980s. In the early 2000s, the cocoa-producing countries as a whole were already producing around 2.9 million tonnes of cocoa.

Between 2000 and 2010, cocoa production even increased by 40%, reaching 4 million tonnes in 2010.

A very old crop

The first links between cocoa and mankind date back a very long time. At that time, cocoa was not cultivated intensively; cocoa trees grew naturally in tropical countries. Indigenous populations used to pick the fruits of the cocoa tree to eat the mucilage that surrounds the cocoa beans. It wasn’t until the pre-Columbian era that the Mayans and Aztecs began to process cocoa beans into cocoa paste, mixing it with other ingredients to make a chocolate drink, the ancestor of our hot chocolate!

Types of cocoa and origins

There are three main types of cocoa: trinitario, forastero and criollo.

However, they are not found in equal quantities around the world.

Criollo accounts for only 5% of world production. Its distinctive features are a light-coloured bean and a fruity, slightly acidic flavour, giving it the ability to produce a fairly fine chocolate. Its rarity makes it a much sought-after chocolate.

Forastero, on the other hand, is the type of cocoa most commonly found in nature, accounting for 80% of the world’s production. It has an earthy, woody flavour, and is used to make chocolate with an intense taste.

Finally, the trinitario, which accounts for around 15% of world production, is in fact a cross between the last two mentioned above. It has a fairly fruity taste with earthy undertones, which is why it is so popular with the general public.

These types of cocoa are mainly found in countries such as Ghana and Côte d’Ivoire, which are now the world’s leading cocoa producers.

The grinding process

Cocoa grinding is an essential stage in the chocolate-making process. It is the process of grinding roasted cocoa beans to produce chocolate liquor, which forms the basis of all chocolate products. Cocoa grinding may seem simple, but it is a complex process that requires specialised equipment and expertise.

Cocoa is ground in several stages: roasting, grinding and refining the cocoa beans. The duration of this process varies from a few hours to several days, depending on the equipment and the desired final product.

Roasting the cocoa beans is the first stage in the cocoa-grinding process. By removing excess moisture, the natural flavours and aromas of the cocoa beans are brought out through roasting. The beans are generally roasted for 10-30 minutes at a temperature of 120 to 140°C.

Once the beans have been roasted, they are cooled and ground to obtain cocoa nibs. The beans are then crushed to obtain a fine cocoa paste, known as chocolate liquor or cocoa liquor. Grinding takes several hours and involves the use of specialised equipment such as blade grinders, paddle grinders and conical stones.

The chocolate liquor is then refined to reduce the granulometry and give the chocolate more texture. Refining involves passing the chocolate liquor through a series of rollers that crush the particles to make them finer. This process can take several hours and involves specialised equipment such as chocolate refiners.

Conching is the final stage in the cocoa grinding process and involves continuously mixing and kneading the chocolate liquor at a controlled temperature. Conching improves the flavour and aroma of the chocolate, as well as its texture and mouthfeel. This phase varies from a few hours to several days depending on the final product desired.

Conclusion

In conclusion, despite a fairly complex process, cocoa production has continued to increase since the 1980s. In the early 2000s, the cocoa-producing countries as a whole were already producing around 2.9 million tonnes of cocoa.

Between 2000 and 2010, cocoa production even increased by 40%, reaching 4 million tonnes in 2010.

Today, production stands at around 5 million tonnes.

Why should I be interested in this post?

Understanding cocoa production is crucial to appreciating its economic, environmental and social impacts, as well as encouraging sustainable and ethical farming practices.

Related posts

   ▶ Mathis DIALLO The environmental impact of cocoa

   ▶ Mathis DIALLO The price of cocoa

   ▶ Mathis DIALLO Different types of chocolate

   ▶ Mathis DIALLO The Armarajo hedge fund’s corner in the cocoa market in 2010

Useful resources

International Cocoa Organization (ICCO) Summary of the process of transforming cocoa beans into chocolate

European Cocoa Association (ECA) Cocoa Story: The production process – from cocoa beans to semi finished products

About the author

The article was written in July 2024 by Mathis DIALLO (ESSEC Business School, Grande Ecole Program – Master in Management, 2023-2026).

The price of cocoa

The price of cocoa

Mathis DIALLO

In this article, Mathis DIALLO (ESSEC Business School, Grande Ecole Program – Master in Management, 2023-2026) explains why the price of cocoa may vary so much.

For a long time, the price of cocoa and the fluctuation of its price within the financial markets has been the result of a combination of factors, such as weather conditions (whether favourable or unfavourable), diseases affecting crops (they are not always present, may re-emerge at certain times), etc.

This situation has always raised concerns about the future viability of the cocoa industry and highlights the importance of sustainability and resilience in the global chocolate supply chain.

Evolution of cocoa price.
Evolution of cocoa price
Source: Trading Economics.

Evolution of the cocoa market price : the drivers of the supply and demand for cocoa

Let’s start with the weather:

The major cocoa-producing regions, such as Côte d’Ivoire and Ghana, are confronted with often unpredictable weather conditions, including droughts and climatic accidents. It is clear that these phenomena can contribute to a reduction in production and therefore to a drop in supply on the world market.

In addition to difficult weather conditions, cocoa crops are also affected by diseases such as the swollen shoot virus. These diseases weaken crops and further reduce the production of cocoa beans for processing.

It’s important to remember that the world’s cocoa production is heavily concentrated in West Africa, particularly Côte d’Ivoire and Ghana. The slightest problem affecting these regions will have a real effect on world cocoa supply and therefore on market price volatility.

The role of speculation

Speculative funds can sometimes fuel price rises, with the latest financial crisis prompting hedge funds to position themselves on the commodities markets. The cocoa side of the NYSE or City is even more susceptible to speculation. Whether there is a shortage or a surplus, speculation is based on the actual causes of the physical market, but exaggerates the trends. In 2017, an overproduction of just 200,000 tonnes caused a 30% fall in the market price, leading to a speculative spiral. Today, the rise in speculation is at the root of this all-time record for cocoa prices. In recent months, financial operators have invested a record 8.7 billion dollars on the New York and London stock exchanges to speculate on a rise in cocoa prices.

So hedge funds are not directly responsible for the increase. They are based primarily on actual causes. Despite their massive injections of liquidity, the market no longer reflects the physical realities of cocoa.

Recent market development (2023-2024)

Figure 2 represents the evolution of the price of cocoa from 2023 to 2024 (USD/T).

Figure 2. Evolution of cocoa price (1923-2024).
Evolution of cocoa price
Source: Trading Economics.

Background: The last record price was set in 1977 at $5,300 per tonne. It was broken in February 2024. Barely two months later, and defying all projections, the price of cocoa doubled to $10,600 per tonne on 15 April 2024. The following week, it reached $11,479. In one year, the price of cocoa has risen by 268%.

Explanation:

With Easter approaching, a time of year when people consume much more chocolate than usual (buying chocolate eggs), the price of cocoa is hitting record highs on the international market. The price of cocoa has just passed the 6,000 dollars a tonne mark, a rise unprecedented since 1977.

Worse still, on 27 March 2024, the price of a tonne of cocoa exceeded 10,000 dollars a tonne. This was unprecedented for the raw material of chocolate, to the point where Bloomberg noted that the cocoa bean was overtaking Nvidia at that point.

This is the third year in a row that the market has been in deficit, with harvests in West Africa down due to the vagaries of the weather, strong demand and speculation.

The gap between supply and demand is expected to rise to around 430,000 tonnes of cocoa in 2024 (around 8% of normal world production). It is therefore impossible for there to be enough for everyone at the end of the year, and some populations are likely to experience shortages of this product.

But a few weeks later, the price of cocoa ended up declining, and not without reason: 1) renewed rainfall in Nigeria led to a significant increase in production; 2) the Intercontinental Exchange (the main cocoa market) raised the margin on contracts, making it more difficult to find buyers or sellers on the market.

Recent events have largely confirmed the volatility of this type of product on the international financial markets, which is far too dependent on environmental hazards, the number of players on the market and financial market speculation.

Why should I be interested in this post?

It shows how much volatile may the market of raw materials be and enables us to understand better about the fluctuations of price of cocoa.

Related posts

   ▶ Mathis DIALLO The environmental impact of cocoa

   ▶ Mathis DIALLO The cocoa production

   ▶ Mathis DIALLO Different types of chocolate

   ▶ Mathis DIALLO The Armarajo hedge fund’s corner in the cocoa market in 2010

Useful resources

Trading Economics Cocoa

International Cocoa Organization (ICCO) Cocoa Market Report for March 2024

World Wide Chocolate Cocoa Cost Soars to Historic High – Why is Cocoa’s Cost Rising? | April 20244

About the author

The article was written in July 2024 by Mathis DIALLO (ESSEC Business School, Grande Ecole Program – Master in Management, 2023-2026).

Different types of chocolate

Different types of chocolate

Mathis DIALLO

In this article, Mathis DIALLO (ESSEC Business School, Grande Ecole Program – Master in Management, 2023-2026) explains about the different types of chocolate.

Introduction

There are many different types of chocolate. Chocolate can be classified into different categories according to its colour, composition, uses, taste, price, etc. Nevertheless, the names of many products are subject to strict regulations, whatever its type or form (paste, bar, confectionery, etc.). For instance, it must contain at least 35% cocoa beans inside (according to the international standards).

Varieties of chocolate

Dark chocolate

The first chocolate to come to mind is often dark chocolate. The designation of dark chocolate is regulated. Chocolate must contain at least 35% cocoa beans to be considered chocolate.

Legislation requires a cocoa concentration of at least 43%, including 26% cocoa butter and 14% cocoa, to qualify as fine or superior dark chocolate. The terroir of the cocoa has a considerable influence on the flavour of dark chocolate. Dark chocolate lovers look for its sometimes bitter, intense and deep flavour.

It is possible to create different dark chocolates that are more or less intense or bitter by adding sugar or flavourings. Master chocolatiers can be creative and create innovative dark chocolates by adding other ingredients such as candied or dried fruit, for example, although the chocolate must have a minimum percentage to be considered a dark chocolate.

Milk chocolate, known as tasty and smooth

Taste is the first thing that distinguishes milk chocolate from dark chocolate. Milk chocolate is appreciated not only by children but also by adults because it is sweeter and less bitter than dark chocolate.

Milk chocolate is made up of :

  • At least 30% dry, fat-free cocoa.
  • At least 18% milk.
  • 25% fat, including cocoa butter.
  • At least 3.5% milk fat.

This type of chocolate can be found in the form of tasting products or ingredients for pastries. It is particularly interesting for creating gourmet desserts, especially at Christmas and Easter, because of its cocoa milk flavour.

White chocolate, a must for pastry chefs

White chocolate is often less appreciated because it seems to be a more neutral chocolate. Its white colour is due to the fact that it contains no dry cocoa, which distinguishes it from other types of chocolate. It is ideal for pastries because of its neutral taste, which goes well with red fruits such as lemon, vanilla or coconut.

White chocolate is made up of :

  • At least 20% cocoa butter
  • About 60% sugar
  • At least 14% of milk

Cocoa butter is generally deodorised before being used to make chocolate.

In pastry-making, white chocolate is a precious ally. Cocoa butter captures flavours and can be used in a variety of flavours. It is widely used to make the insides of macaroons.

Blond chocolate

Pastry chef Frédéric Bau created blond chocolate, also known as ‘Dulcey’ chocolate because of its golden colour. According to the story, after melting white chocolate in a bain-marie, he forgot to turn off the heat. The chocolate was left to cook in this way for fifteen hours. The recipe has been refined since this discovery. To create Dulcey chocolate, the chef gently mixes cocoa beans with sugar and milk and cooks the mixture at a temperature of between 93 and 135 degrees Celsius.

Filled chocolate, tasty and delicious

Filled chocolate is a distinct type of chocolate because it is made from different types of chocolate, such as dark, white or milk. Filled chocolate is a type of chocolate with a chocolate exterior. This outer part can be made with any type of chocolate. To qualify as filled chocolate, the chocolate must represent at least 25% of the total weight of the product. When it comes to fillings, there is a wide variety to choose from: liqueur, ganache, candied fruit, dried fruit, marzipan, etc.

Eating chocolate

Chocolate can be eaten in a variety of ways: in bars, in sweets, simply as a snack, in powder form or as butter. For example, when cocoa powder is mixed with sugar, it becomes chocolate powder, which is often used to make hot drinks. Cocoa butter is used in cooking to add fondant, shine and fluidity to chocolate, among other functions. Once crystallised, it is also responsible for the brittleness and crunchiness of a bar. Finally, when it comes to tasting, it’s intriguing to know that chocolate can be enjoyed in combination with other foods. Chocolate can be stored at temperatures below 18 degrees Celsius and is delicious at 20 to 22 degrees Celsius.

Why should I be interested in this post?

This post could help people to make informed consumer choices and to promote the diversity and quality of chocolate.

Related posts

   ▶ Mathis DIALLO The environmental impact of cocoa

   ▶ Mathis DIALLO The cocoa production

   ▶ Mathis DIALLO The price of cocoa

   ▶ Mathis DIALLO The Armarajo hedge fund’s corner in the cocoa market in 2010

Useful resources

Investment Corporation of Dubai (ICD)

About the author

The article was written in July 2024 by Mathis DIALLO (ESSEC Business School, Grande Ecole Program – Master in Management, 2023-2026).

The Armarajo hedge fund’s corner in the cocoa market in 2010

The Armarajo hedge fund’s corner in the cocoa market in 2010

Mathis DIALLO

In this article, Mathis DIALLO (ESSEC Business School, Grande Ecole Program – Master in Management, 2023-2026) explains the story of the hedge fund’s corner in the cocoa market created by Anthony Ward in the 2010’s, and its repercussions.

Speculative funds can sometimes fuel price rises, with the last financial crisis prompting hedge funds to position themselves on the commodities markets. The cocoa side of famour markets such as the NYSE or the City is even more susceptible to speculation. Whether there is a shortage or a surplus, speculation is based on the actual form of the market but exaggerates the trends.

Anthony Ward
Logo of Angie
Source: The Guardian.

The financial operation of the British hedge fund Armajaro

In this way, it is easy to understand that speculation on commodities can reach excessive proportions that could have harmful repercussions on the market. The latest example of this is the purchase in 2010 by the British hedge fund Armajaro of almost 240,100 tonnes of cocoa on the London market of NYSE Liffe. This is equivalent to 7% of world production, or 15% of global stocks.

The aim of this manoeuvre was to dry up the world cocoa market and reduce the supply of cocoa beans in order to drive up cocoa prices, much to the chagrin of chocolate consumers. This action was to take on its full meaning when set against the fall in supply from the world’s two largest cocoa producers, Ghana and Côte d’Ivoire, as well as increased consumption from the emerging countries.

But buying up almost all European stocks in one fell swoop was bound to have consequences, and the action alone caused prices to soar. In fact, shortly after the hedge fund’s operation, the market price per tonne rose to £2,725 (in 2010, equivalent to €3,247), the highest level since 1977, according to Business Insider.

By way of comparison, all those tonnes of cocoa would fill around 160 Olympic-size swimming pools with chocolate beans, which is obviously an aberration.

Faced with these unprecedented dynamics, it was hardly surprising that small manufacturers feared that Armajaro, with its huge stock, would set prices as it saw fit. A week after this financial coup, they launched a petition denouncing price manipulation by the trader.

The high-risk corner strategy

This strategy, which aims to attack the market head-on, is known as the ‘corner strategy’. This was not Anthony Ward’s first attempt at such a strategy. Less than a decade earlier, in 2002, he had already undertaken the same type of action on the commodities market, making huge profits in the process. At the time, however, the banks had no hesitation whatsoever in financing its activities. On the contrary, they financed these activities with complacency, a symbol of a particularly marked affairism at the time, showing the role of speculation within the commodities market.

However, these operations do not always produce winners, precisely because they are risky enough and the promise of future profits is not always there. This is somewhat the case here. In fact, the poor performance of the agricultural commodities market – and therefore of cocoa at the same time – initially made the fund heavily loss-making. Then, over the years, prompted by cases of manipulation of certain prices (aluminium in particular), new regulations were introduced by financial bodies to ensure greater transparency in transactions linked to the purchase of raw materials.

It was against a backdrop of intensifying regulation of this market, and also pushed into a corner by certain non-governmental organisations seeking to stand in the way of these speculators, that the man known as the Chocolate Finger finally withdrew his trading activity from this market just three years later in 2013. Eventually, the trader got rid of his cocoa, coffee and sugar trading arm.

Divesting his cocoa, coffee and sugar trading arm was a major turning point for him at the time, as three years earlier he was extolling the virtues of commodities trading. Since then, this activity has become Armajaro’s ball and chain, with a net loss of 10.3 million dollars in 2012 compared with profits of 24.3 a year earlier. That was the end of the empire.

Why should I be interested in this post?

Is is interesting because the massive purchase of cocoa by the Armajaro fund in 2010 has caused prices to soar, illustrating very well the impact of some speculative strategies on commodity markets and sparking debate on financial regulation. It has also affected a lot producers‘incomes and consumers’ costs.

Related posts

   ▶ Mathis DIALLO The environmental impact of cocoa

   ▶ Mathis DIALLO The cocoa production

   ▶ Mathis DIALLO The price of cocoa

   ▶ Mathis DIALLO Different types of chocolate

Useful resources

Quite interesting article from the New-York Times in 2010, explaining the links between this operation and the fact that prices went up at this time:

New York Times Trader’s Cocoa Binge Wraps Up Chocolate Market

Very good article from the French newspaper Le Monde, which deals about the successes and the bad aspects of that kind of operation:

Marc Roche (12/11/2013) Le plus célèbre spéculateur du cacao rend son tablier Le Monde.

About the author

The article was written in July 2024 by Mathis DIALLO (ESSEC Business School, Grande Ecole Program – Master in Management, 2023-2026).

Exploring the SARR Fund: A New Approach to Innovative Corporate Financing

Exploring the SARR Fund: A New Approach to Innovative Corporate Financing

Gilles de MALBOSC

In this article, Gilles de MALBOSC (Manager of the SARR fund and CIO at Harmony Family Office) explores a new approach to innovative corporate financing : the Stable and Recurring Revenue (SARR) Fund.

Exploring the SARR Fund: A New Approach to Innovative Financing

In the ever-evolving landscape of financial investments, the SARR Fund stands out as a pioneering solution for growing enterprises. This fund is designed to provide innovative financing options that cater to companies with stable and recurring revenue models. Here’s a closer look at what makes SARR Fund a unique investment opportunity.

Introduction to SARR Fund

SARR stands for Stable and Recurring Revenue. The SARR Fund is a private fund that aims to invest a minimum of 95% of its total assets in private subscription investments. Unlike traditional investment vehicles, SARR focuses on purchasing future revenues from companies, offering them a financing method that doesn’t rely on real estate or personal guarantees. This approach allows companies to secure funding quickly, without diluting ownership or adversely affecting their debt ratios.

Why SARR Fund?

SARR both finances real-life growing companies in an entrepreneur friendly fashion, and it leverages technology like no other fund :

Innovative Financing Solutions

SARR helps entrepreneurs.

  • Quick Financing: Companies can receive financing within 48 hours, which is crucial for businesses needing rapid capital to seize growth opportunities.
  • Non-Dilutive Capital: By selling future revenues instead of equity, companies retain full control over their operations. For entrepreneurs, it’s like being granted some debt, in 48 hours, and without impacting their debt-ratio
  • Data-Driven Decisions: Financing decisions are based purely on data, ensuring fairness and transparency regardless of the entrepreneur’s background. Because SARR relies on “clean” data since it’s provided by trusted third parties

Timing and Technology

The fund leverages two modern concepts to provide its innovative solutions:

  • Open Banking: This technology gives investors comprehensive insights into companies’ financial health, enhancing the accuracy of risk assessments. This allows them to make decisions based on data that comes directly from 3 trusted third parties: the bank, the accountant and the subscription manager
  • XaaS Model: Companies operating on a subscription-based model offer predictable and stable revenue streams, making them ideal candidates for the fund.

How Does SARR Fund Work?

A typical transaction involves a company, such as a growing CRM software provider, seeking additional funding to expand its product offerings. The step-by-step process is described below:

  1. Marketplace Registration: The company registers on a fintech marketplace, which evaluates their financial data to determine a trading limit and risk profile.
  2. Funding Request: The company submits a funding request based on their trading limit.
  3. Revenue Sale: SARR Fund purchases a portion of the company’s future recurring revenue at a discount, providing the necessary capital upfront.
  4. Revenue Collection: The fund collects the full value of the purchased revenue in monthly installments over the next 12 months.

Process of a transaction.
 Process of a transaction
Source: The company.

Benefits for Investors

Investing in the SARR fund presents the following Benefits for Investors: Low Risk and High Stability, Performance and Security.

Low Risk and High Stability

  • Senior Repayment Position: SARR Fund is positioned ahead of most senior lenders, reducing the risk of default.
  • Diversification: The fund invests in more than 100 companies, ensuring that no single investment exceeds 2% of the total Asset under Management (AUM).
  • Monthly Liquidity: Investors have access to 7.5% of the fund’s total AUM each month, providing a level of liquidity uncommon in similar investment vehicles.

Performance and Security

  • Collateral: Investments are secured by collateral from the outset, and covenants are in place to protect the principal.
  • Consistent Returns: The fund aims for positive performance each month, leveraging the stability of recurring revenue models.

Target Audience

The SARR Fund is suitable for a wide range of investors, including company treasurers, family offices, business angels, financial advisors, and high net worth individuals. Its structure and risk management strategies make it appealing even to conservative investors seeking stable returns with low volatility.

Conclusion

The SARR Fund represents a significant innovation in the field of private equity and venture financing. By focusing on stable and recurring revenue streams, it offers a low-risk, high-stability investment option that benefits both investors and growing enterprises. This unique approach not only provides quick and non-dilutive financing but also ensures robust returns for investors through meticulous data-driven decision-making and strategic partnerships with leading fintech platforms.

For more detailed information on the SARR Fund, prospective investors are encouraged to review the fund’s prospectus and consult with financial advisors to understand the full scope of benefits and risks associated with this innovative investment vehicle.

Useful resources

The Future of Data-Driven Finance and RegTech: Lessons from EU Big Bang II European Banking Institute Working Paper Series 2019/35

From FinTech to TechFin: The Regulatory Challenges of Data-Driven Finance

New York University Journal of Law and Business, Forthcoming European Banking Institute Working Paper Series 2017 – No. 6

Risk-based Investment Management in Practice (Global Financial Markets), by Frances Cowell

Banks and the real economy: An assessment of the research, Allen N. Berger, Phil Molyneux, John O.S. Wilson

About the author

The article was written in July 2024 by Gilles de MALBOSC (Manager of the SARR fund and CIO at Harmony Family Office).

Top 5 Private Equity firms in Germany

Top 5 Private Equity firms in Germany

Margaux DEVERGNE

In this article, Margaux DEVERGNE (ESSEC Business School, Global BBA, 2020-2024) presents the top 5 Private Equity Firms in Germany.

Introduction

Germany is home to some of the largest and most influential private equity firms in Europe. These firms manage billions of euros in assets and invest in high-growth potential companies through buyouts, growth financing, and turnarounds. Key players in the German private equity landscape include international heavyweights such as Permira, Cinven, and EQT, alongside German-origin firms like Triton and Advent International. With strategically located offices in cities such as Frankfurt, Munich, and Berlin, these firms are well-positioned to identify and finance premier investment opportunities in one of Europe’s most dynamic and innovative markets.

Methodology

To define the top five private equity firms in Germany, several criteria and financial metrics are typically considered: Assets Under Management, Transaction Volume. Investment Profitability, Geographical Presence, Investment Sectors, Tenure and Reputation, and Recent Fundraising

Assets Under Management (AUM)

One of the primary criteria for evaluating the significance of a private equity firm is the size of its assets under management. AUM represents the total capital managed by the firm across its various investment funds. Higher AUM indicates greater capacity for making substantial investments.

Transaction Volume

The total volume of acquisition deals conducted by a private equity firm over a given period (typically the past 3-5 years) is a good indicator of its activity and market presence in Germany. Large-scale transactions, or mega-deals, are particularly scrutinized.

Investment Profitability

The financial performance of the funds managed by the firm is analyzed, focusing on internal rates of return (IRR) and multiples of invested capital. Firms demonstrating high IRRs on past investments are more highly valued.

Geographical Presence

A strong local presence in Germany, with offices in major cities such as Frankfurt, Munich, or Berlin, is advantageous for capitalizing on domestic investment opportunities.

Investment Sectors

Private equity firms specializing in key sectors of the German economy, such as industry, financial services, healthcare, or technology, receive higher ratings.

Tenure and Reputation

The experience, longevity, and established reputation of a private equity firm in the German market play a significant role in its ranking.

Recent Fundraising

The amount of recent funds raised by the firm, reflecting the confidence of institutional investors, is also considered.

By cross-referencing these quantitative and qualitative metrics, analysts and specialized media compile rankings of the leading private equity firms active in Germany. Although subjective, these rankings provide a comprehensive overview of the landscape and major players in the sector.

How did I get these ranking results?

To establish a ranking of the top 5 private equity firms in Germany (Permira, Cinven, EQT, Triton and Advent International), the most important criteria used were as follows:

Assets under management (AUM): EQT appears to have a dry powder of €25.28 billion, which puts it in the lead for this criterion.

Transaction volume: Triton is listed in the top 3 most active companies in Germany according to Private Equity Monitor, which suggests that its transaction volume is high.

Investment sectors: EQT stands out as having strong expertise in technology sectors, which may be an advantage given the importance of the TMT sector in Germany.

From this we obtained the 5 firms to rank:

  1. Permira
  2. Cinven
  3. EQT
  4. Triton
  5. Advent International

To compile the ranking, we will analyze each firm using the metrics mentioned above.

Permira

  • Assets Under Management: Approximately €32 billion
  • Notable Recent Transactions: Acquisition of Siemens Logistics in 2020 (€1.1 billion), buyout of Camfil in 2022 (€4.8 billion)
  • Profitability: Net IRR of 22.5% on mature funds
  • Presence: Offices in Frankfurt, Munich, and other German cities
  • Key Sectors: Technology, services, consumer goods
  • Established: 1985

Logo of the company.
Logo of Permira
Source: The company.

Cinven

  • Assets Under Management: Over €30 billion
  • Transactions: Acquisition of Compressors Systems in 2022 (€3.9 billion)
  • Profitability: Gross IRR of 27% on European funds
  • Presence: Offices in Frankfurt and Munich
  • Sectors: Business services, healthcare, technology
  • Established: 1977

Logo of the company.
Logo of Cinven
Source: The company.

EQT

  • Assets Under Management: €84 billion
  • Transactions: Buyout of Freenet in 2022 (€1.3 billion)
  • Profitability: Net IRR of 24% on private equity funds
  • Presence: Offices in Munich, Frankfurt, and other cities
  • Sectors: Technology, healthcare, services, industry
  • Established: 1994

Logo of the company.
Logo of EQT
Source: The company.

Triton

  • Assets Under Management: €18.5 billion
  • Transactions: Acquisition of Flender in 2021 (€1.9 billion)
  • Profitability: Gross IRR of 32% on mature funds
  • Presence: Headquarters in Frankfurt, offices in Munich
  • Sectors: Industrial, services, consumer, healthcare
  • Established: 1997

Logo of the company.
Logo of Triton
Source: The company.

Advent International

  • Assets Under Management: $88 billion (approximately €80 billion)
  • Transactions: Buyout of Obier in 2022 (€1.1 billion)
  • Profitability: Net IRR of 22% on mature funds
  • Presence: Offices in Frankfurt and Munich
  • Sectors: Financial services, healthcare, industry, retail
  • Established: 1984

Logo of the company.
Logo of Advent International
Source: The company.

Conclusion

The private equity landscape in Germany is dominated by a few major players, comprising both leading international firms and well-established German companies. At the forefront of this ranking is Permira, with approximately €32 billion in assets under management, closely followed by Cinven, managing over €30 billion. The Swedish giant EQT ranks third with an impressive portfolio of €84 billion in assets.

German firm Triton, with €18.5 billion under management, and the American firm Advent International, boasting $88 billion (approximately €80 billion) in assets, round out the top five. These substantial figures underscore the financial strength of these firms, enabling them to execute significant transactions, such as EQT’s recent acquisition of Freenet for €1.3 billion.

Beyond the size of the assets managed, these private equity firms also demonstrate remarkable performance, with net internal rates of return (IRR) ranging from 22% to 32% on their mature funds. This high profitability ensures the confidence of institutional investors, allowing these firms to continue raising substantial funds and maintaining their status as key players in the German market for acquisitions and growth financing.

Why should I be interested in this post?

As a French-German ESSEC student enrolled in the SimTrade course, exploring the realm of private equity could be highly beneficial. This post offers an insightful examination of the key players in the German industry, providing valuable insights into their distinctive characteristics. It presents an opportunity to deepen your understanding of the sector and potentially identify your future employer among these influential firms.

Related posts on the SimTrade blog

   ▶ Chloé ANIFRANI Top 5 Asset Management firms in Europe

   ▶ Alessandro MARRAS Top 5 Private Equity firms

   ▶ Dante MARRAMIERO Private Equity and Italy, is it a nice combination?

   ▶ Louis DETALLE A quick presentation of the Private Equity field…

Useful resources

Permira Company

Cinven Company

EQT Group Company

Triton Partners Company

Advent International Company

About the author

The article was written in July 2024 by Margaux DEVERGNE (ESSEC Business School, Global BBA, 2020-2024).