In this article, Daniel MEAGHER (Trinity College Dublin, BESS Final Year, 2021-2025) explains the Irish Real Estate Market with its trends, challenges, and opportunities.
Ireland’s real estate market is at a critical crossroads. With housing shortages, soaring demand, and institutional investment set to surpass €3 billion in 2025, the sector has never been more pivotal. As the country balances rapid urbanisation, sustainability goals, and affordability challenges, its property market continues to shape Ireland’s economic future.
About the Irish Real Estate Market
Ireland’s real estate market remains at the core of its economic growth, driven by a growing population exceeding 5 million, strong foreign direct investment (FDI), and attractive tenant profiles. However, persistent challenges, including housing shortages, price inflation, and planning inefficiencies, continue to hinder progress.
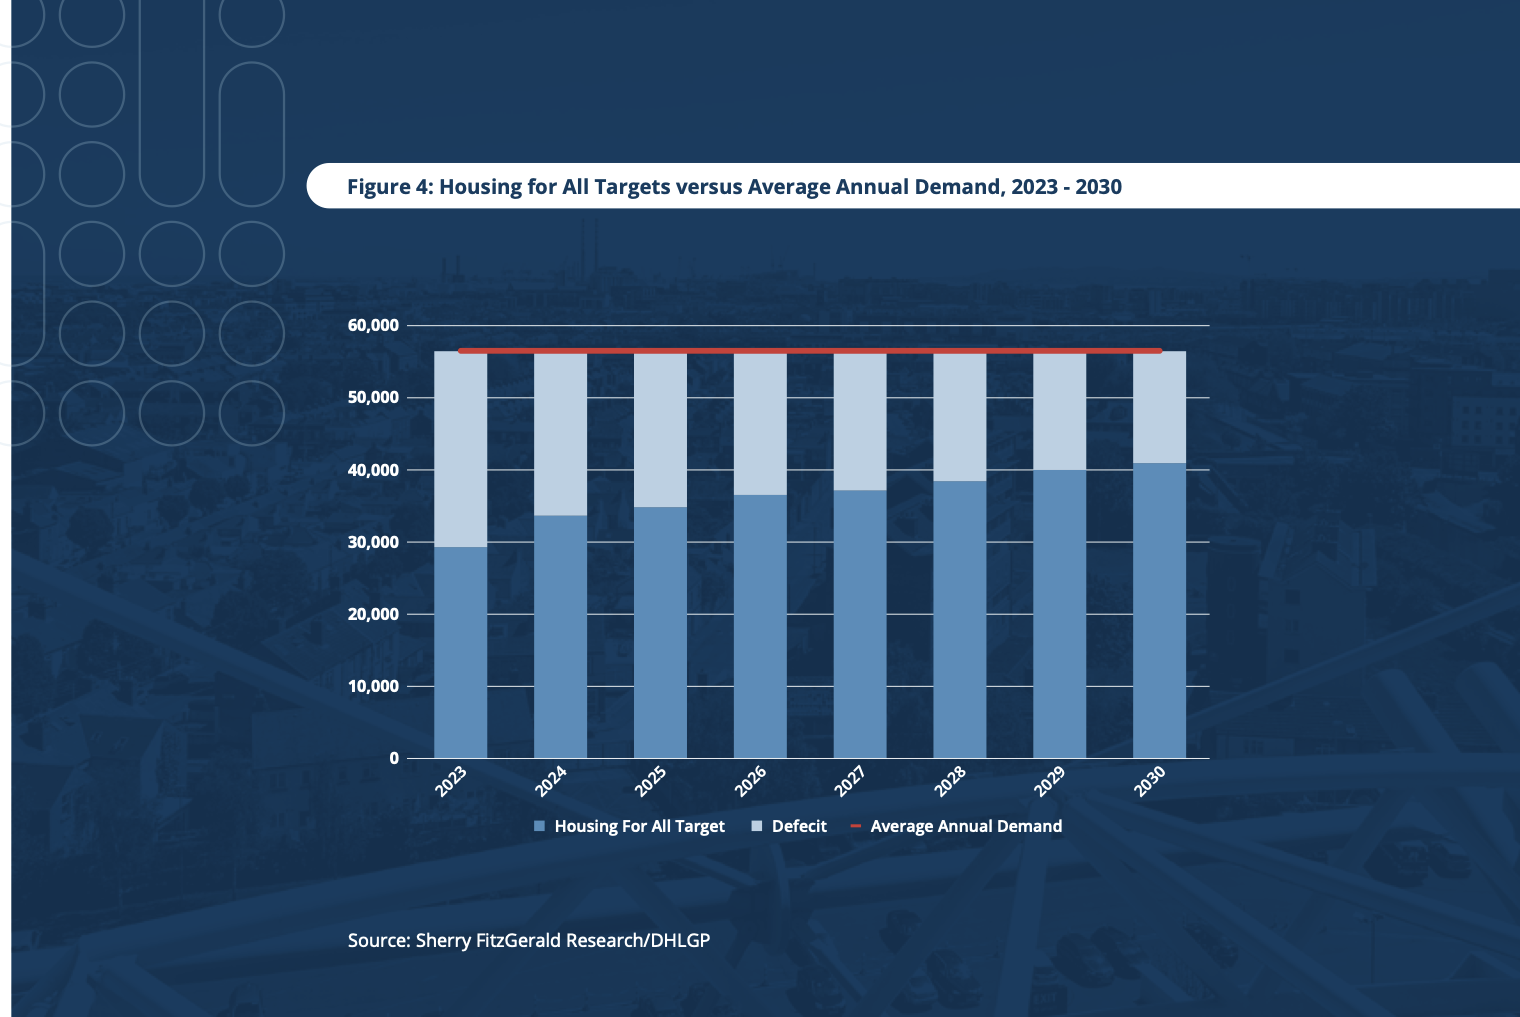
Housing for All Targets vs. Demand
Housing for All Targets vs. Demand.
Source: Sherry FitzGerald Research/DHLGP.
A significant factor behind Ireland’s sustained real estate demand is its status as a leading hub for multinational corporations in the European Union. Following Brexit, companies relocating their European headquarters to Dublin have further strained the office market. Tech giants such as Google, Meta, and Amazon occupy prime spaces in Dublin’s docklands, contributing to rising rental yields in the office sector.
Investment Landscape
Despite global macroeconomic uncertainties, Ireland’s real estate sector remains a highly attractive destination for institutional investors. In 2024, CBRE reported a 30% increase in investment transactions year-on-year, totalling €2.4 billion. While this figure remains 40% below the 10-year market average, the trajectory is positive, with investment activity expected to surpass €3 billion in 2025.
Key Highlights
Multifamily Residential: 4.75%
Prime Offices: 5.00%
Industrial/Logistics: 5.00%
Student Accommodation: 5.00%
Source: Savills Ireland Investment Market Report
Deep Dive into Key Asset Classes
Multifamily Residential: Institutional investors continue to focus on forward sales agreements in the multifamily sector, particularly in Dublin. These agreements enable developers to secure funding before construction begins, reducing their financial risk. With sustained demand from young professionals and families seeking long-term rentals, this sector provides stable, contracted yields.
Industrial and Logistics: The industrial and logistics sector has emerged as a standout performer, driven by the growth of e-commerce and the need for modern warehousing. In 2024, rents for prime logistics properties increased by 7%, reflecting both limited supply and strong demand from retailers expanding their distribution networks.
Notable Transactions in 2024
Eagle Street Partners’ Acquisition of The Square Shopping Centre in Tallaght for €130 million.
The Square Shopping Centre, Tallaght.
Source: The Irish Times.
Davy’s Acquisition of the ‘Hexagon Portfolio’ for €74 million.
The Sale of Blanchardstown Shopping Centre for €575 million.
Blanchardstown Shopping Centre.
Source: The Irish Times.
Funding and Lending Dynamics
The exit of KBC Bank and Ulster Bank has reshaped the funding landscape, with non-bank lenders such as Activate Capital and Castlehaven Finance stepping in to provide financing. While these lenders have contributed to addressing some funding needs, the overall resources remain insufficient to meet the scale of demand required to alleviate Ireland’s housing shortage.
Although the ECB reduced its key interest rate to 3.5% in late 2024, mortgage rates in Ireland have remained elevated at 3.95%, posing challenges for developers and buyers alike. Rising borrowing costs have further constrained access to affordable financing for housing projects, exacerbating supply challenges.
To bridge this gap, attracting foreign international capital is essential, particularly for large-scale residential developments. Clearer policies, coupled with targeted incentives such as green financing or support for affordable housing, could encourage sustained foreign investment. Establishing a transparent, investor-friendly framework will be critical to unlocking the capital needed to drive housing supply and address the ongoing crisis.
Sustainability and Innovation
Green Certifications and Standards
Developments in Ireland are aligning with EU environmental targets, particularly those outlined in the European Green Deal and Ireland’s Climate Action Plan 2023. Certifications such as LEED (Leadership in Energy and Environmental Design), BREEAM (Building Research Establishment Environmental Assessment Method), and NZEB (Nearly Zero Energy Building) standards have become benchmarks for new and existing properties. These certifications not only improve the sustainability of properties but also enhance their marketability to tenants and investors who are increasingly seeking environmentally responsible spaces.
Technological Advancements in Real Estate
Smart Building Technology: Modern real estate developments are incorporating smart technologies to optimise energy use and improve efficiency. Smart sensors, for example, monitor energy consumption and adjust heating, cooling, and lighting systems based on real-time needs, reducing operational costs and environmental impact.
Renewable Energy Integration: Solar panels, wind turbines, and geothermal systems are becoming common features in larger developments. These systems not only reduce carbon emissions but also appeal to tenants and buyers looking for lower energy costs and greener living environments.
Retrofitting Older Buildings: Retrofitting has become a significant focus for investors and developers. Many older properties, particularly in Dublin, are being upgraded with better insulation, energy-efficient windows, and renewable energy systems to reduce their carbon footprint and extend their life span.
Long-Term Resilience and Value
Sustainability initiatives not only reduce environmental impact but also future-proof investments against tightening regulations and rising energy costs. Green-certified buildings tend to attract premium tenants, enjoy lower vacancy rates, and command higher rental yields, making them a strategic choice for investors.
Why Should I Be Interested in This Post?
This article provides essential insights for students and professionals seeking to understand Ireland’s dynamic real estate market, offering perspectives on key trends, challenges, and future opportunities.
In this article, Camille Keller (ESSEC Business School, Bachelor in Business Administration (BBA), 2020-2024) explores the economic and environmental factors influencing rising coffee prices, shedding light on global futures markets and sustainability efforts.
Environmental Factors: Climate Change and Coffee Production
It’s no secret that coffee is deeply tied to the environment. Arabica coffee, cherished for its smooth flavor, accounts for about 60% of global coffee production—but it’s also notoriously sensitive to climate change. Reardon-Smith et al. (2019) highlight how rising temperatures and unpredictable weather patterns are shrinking suitable growing areas and reducing yields. The regions best known for coffee cultivation, including Brazil and Vietnam, are among the hardest hit.
A study by Tavares et al. (2018) paints a stark picture for Southeast Brazil, a vital hub for Arabica production. Projections indicate that suitable cultivation areas could drop by as much as 60% by the end of the century, with yields potentially falling by 25% under high greenhouse gas scenarios. These environmental hurdles are compounded by deforestation and soil degradation, leaving farmers with limited options to sustain production.
Adding to the pressure, Trading Economics (2025) reports that persistent below-normal rainfall in key Brazilian regions has exacerbated supply constraints. Brazil’s 2024 coffee harvest was estimated at 54.2 million 60-kg bags, down 1.6% from the previous year. Such trends not only strain global supply but also drive prices higher as demand outpaces production.
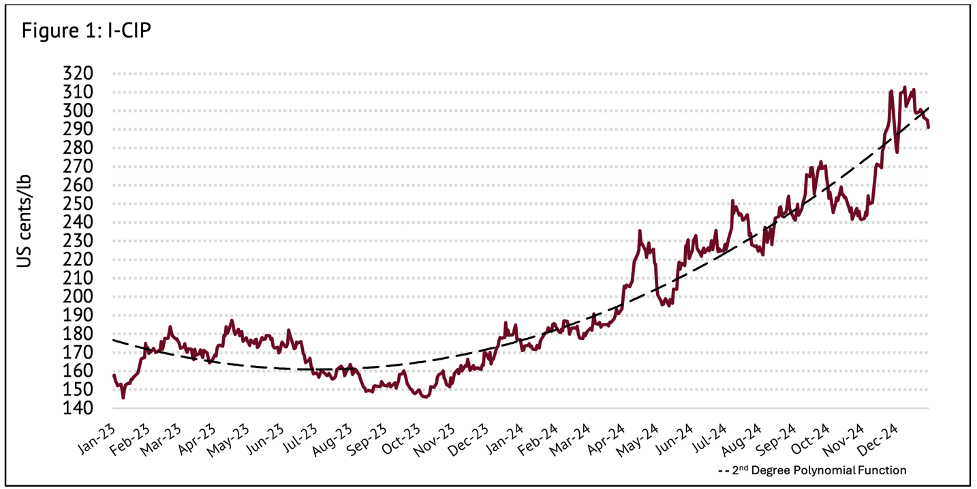
The ICO Composite Indicator Price (I-CIP)
Source: ICO Report 2024.
Economic Factors: Supply Chain Disruptions and Consumer Trends
Beyond environmental woes, economic forces play a crucial role in the coffee market. In recent years, global supply chain disruptions have caused delays and driven up transportation costs, creating additional upward pressure on coffee prices. The COVID-19 pandemic underscored the fragility of global logistics, making it harder to get coffee beans from farms to consumers.
Consumer behavior also holds significant sway. According to Capps et al. (2023), coffee demand in the United States is highly price-sensitive, with a price elasticity of -1.93. This means that as prices rise, many consumers cut back on their purchases. Yet, wealthier households tend to continue buying coffee regardless of price increases, reflecting the complex dynamics of socioeconomic factors in shaping demand.
Meanwhile, the International Coffee Organization (ICO, 2024) notes that global coffee prices rose by 40% in 2024, with the ICO Composite Indicator Price averaging 299.61 US cents/lb in December. This surge has been driven by a combination of tight supply and robust demand, particularly for Arabica coffee. Additionally, logistical challenges, such as container shortages and prolonged shipping times to European markets, have amplified cost pressures throughout the supply chain.
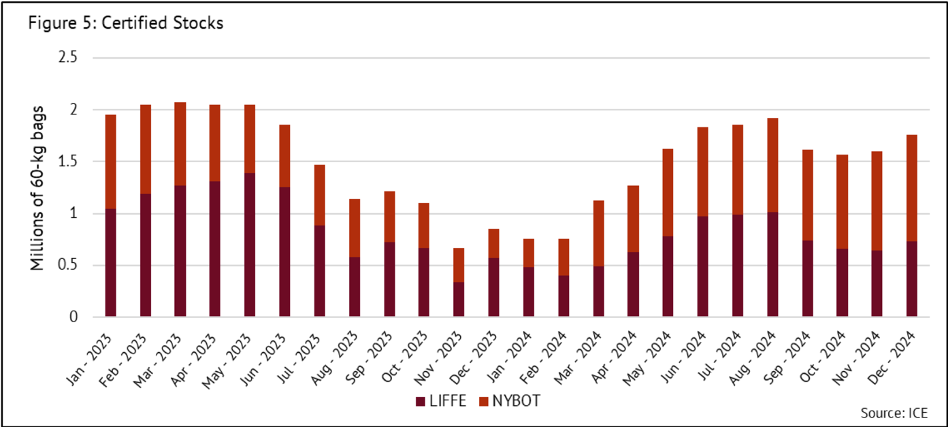
Certified Stocks of Arabica and Robusta Coffee
Source: ICO Report 2024.
EU Regulations and Market Dynamics
Adding to these challenges are new European Union regulations aimed at combating deforestation. Savage (2024) reports that coffee futures hit a 47-year high in November 2024, partly due to fears surrounding these laws. The regulations require companies to ensure their supply chains are free of deforestation, significantly increasing compliance costs for producers. While these measures promote sustainability, they have also added uncertainty and volatility to the market, pushing prices further upward.
Moreover, the ICO (2024) highlights the volatility of coffee prices, with Arabica and Robusta exhibiting sharp fluctuations. Certified stocks of Robusta coffee increased by 13.3% from November to December 2024, while Arabica stocks grew by 7.8%. Despite these increases, the imbalance between supply and demand continues to fuel price volatility, as traders and roasters navigate a challenging market landscape.
Conclusion: Future Outlook of a Volatile Market
The interplay of environmental and economic factors makes it clear: coffee prices are unlikely to stabilize anytime soon. Climate change will continue to constrain supply, while evolving consumer preferences and regulatory changes shape demand. This complex web of factors requires innovative solutions from policymakers, industry leaders, and consumers alike.
For consumers, this may mean accepting higher prices as the new norm. However, increased awareness of the environmental and social costs of coffee production could drive more sustainable consumption patterns. Initiatives such as fair trade certification and carbon-neutral labeling are gaining momentum, offering a pathway to a more equitable and resilient coffee industry.
Why Should I Be Interested in This Post?
This post provides ESSEC students and global business enthusiasts with valuable insights into how environmental changes, economic challenges, and regulatory dynamics are shaping one of the world’s most consumed commodities.
In this article, Hongting LIU (ESSEC Business School, Master in Strategy & Management of International Business (SMIB), 2021-2022) shares her insight regarding the influence of Trump’s wining in the election of the US president in November, 2024 in the technology industries.
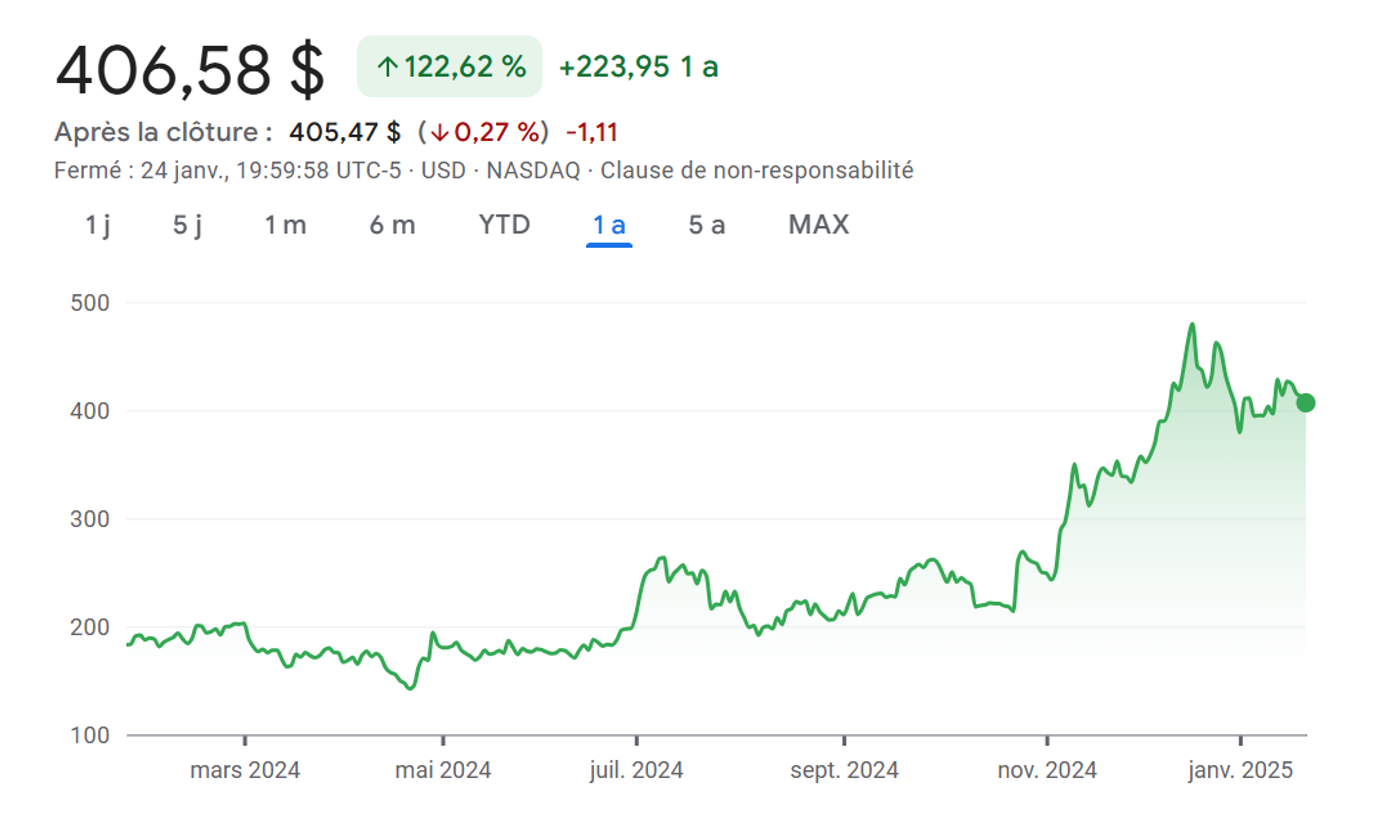
Tesla’s Stock Performance is outstanding during 2024 especially after the result of the election was released
Tesla’s stock exhibited significant volatility and momentum during Trump’s presidency:
Evolution of Tesla’s stock price.
Source: Yahoo! Finance.
Election-Driven Surge: Following Trump’s re-election in 2024, Tesla’s stock surged nearly 13% in a single day due to investor optimism about pro-business policies.
Peaks and Corrections: By December 2024, Tesla’s stock reached a historic high of $479.8 per share but later adjusted to $379.28 in January 2025.
Trading Range Formation: The stock fluctuated between $380 and $480, reflecting divided sentiment on its future potential.
Reasons Behind Tesla’s Stock Surge
Trump may use pro-Business Policies like he did from 2017 to 2021
Donald Trump’s return to the presidency allows for an assessment of potential policies based on his previous term from January 2017 to January 2021. During his first administration, policies such as tax reforms, deregulation, and a pro-business stance were introduced. These measures aimed to foster investor confidence and support domestic industries. Corporate tax cuts and relaxed regulatory requirements provided particular advantages to high-growth sectors, including technology and green energy, benefiting companies like Tesla. The administration also emphasized economic nationalism and prioritized local industries. Policies aimed at reducing taxes and loosening employment regulations were designed to enhance the competitiveness of American businesses, particularly those reliant on research and development (R&D) and capital investment. Additionally, diplomatic and trade relationships with Middle Eastern countries were strengthened, resulting in energy agreements that supported collaboration on clean energy initiatives. These agreements promoted the adoption of renewable energy technologies and created opportunities for companies like Tesla to contribute to the modernization of energy infrastructure in the region.
The winning of Trump triggers the positive emotion to Elon’s businesses
Tesla’s CEO, Elon Musk, is considered to be an informal advisory role in Trump’s administration further bolstered Tesla’s growth trajectory. The victory of Trump gives the market the confidence in Elon’s companies. The global push for electric vehicles (EVs) gained momentum during this period, driven by government incentives and growing environmental awareness. As a leader in the EV industry, Tesla became a focal point for investors aligning with long-term global trends.
Future Trends in U.S. Tech Stocks
AI Integration
Advancements in artificial intelligence (AI) are expected to drive significant gains for tech companies. Tesla, leveraging AI in autonomous driving systems, stands to benefit from these developments.
Sustainability Focus
Global trends toward sustainability, including renewable energy and EV adoption, will continue to bolster companies like Tesla aligned with these priorities.
Regulatory Dynamics
Post-Trump regulatory scrutiny may increase, but the tech sector’s central role in innovation ensures resilience in the face of challenges.
Caution: Avoid Blindly Following Market Trends
While Tesla’s stock has delivered exceptional returns, its high volatility underscores the need for caution. Blindly chasing high-performing stocks can lead to financial losses, especially in speculative environments. In fact, from the middle of December 2024 to the January 2025, there is a volatility of the stock performance. The long term performance of Tesla should be estimated based on its annual report regarding its revenues, new AI technology, profits margins, energy & storage business growth, and also the demand and the competition of the global electric automobile market. We should not judge everything based on the emotion of market even though the emotion of the market should never be ignored.
Conclusion
Donald Trump’s presidency marked a transformative period for the U.S. economy, particularly for the technology sector. Tesla’s growth trajectory reflects the broader trends in innovation and sustainability. Moving forward, technological advancements and global shifts toward sustainability will continue to shape the market. Strategic planning and prudent investment remain essential in navigating these complexities.
The article was written in January 2025 by Hongting LIU (ESSEC Business School, Master in Strategy & Management of International Business (SMIB), 2021-2022).
In this article, Hongting LIU (ESSEC Business School, Master in Strategy & Management of International Business (SMIB), 2021-2022) studies the pricing advantages for American products in the Chinese market, focusing on factors like economies of scale, market competition, and supply chain efficiency. The author has worked on the consultancy of Global procurement for two years for IT equipment and here is the analysis of a phenomenon.
About the phenomenon
For at least 5 years, certain American brand products produced in the US (Cisco’s technological hardware, Fortinet, etc.) are cheaper in the Chinese market than in the US. How can a product become cheaper after all the transportation over the Pacific Ocean? This discrepancy can be attributed to economies of scale. Strong demand from China has led to substantial import volumes, reducing unit procurement costs. Many distributors buy a lot in stock then trade them like commodities. These products are treated like commodities in China, with prices dynamically adjusting to supply and demand.
According to China’s 2023 import-export trade statistics, the annual import value of American technological hardware (including communication and network equipment) reached $55 billion, representing a year-on-year increase of 8.3%.
Key reasons behind the phenomenon
Main reason: China has the Economies of Scale and Bargaining Power
Cisco’s 2023 annual report reveals that the Asia-Pacific region (mainly China) accounts for 30% of its international sales, with average bulk purchase discounts ranging from 15% to 20%. At the same time, such a big market is dominated by several huge distributors. In 2023, a major distributor captured 50% of the market share through cross-border sales across mainland China and Hong Kong, driving down overall product prices. We do not know exactly who is the distributor as the information of it is disclose. However, given the fact that there is such major distributors can dominate in such a big market, the scale they trade can be huge and their bargaining power will be high. A distributor with a dominant market share often has better economies of scale, allowing them to negotiate lower purchase prices from manufacturers
China has low cost in the warehouse solution and the labor compared to the US. Chinese international trade market, especially IT products, is concentrate in Guangdong area which is the nation’s top trading province for the 39th consecutive year. In 2024, Guangdong’s total foreign trade—encompassing both imports and exports—reached 9.11 trillion yuan, accounting for 20.8% of China’s overall foreign trade. At the same time, a significant portion of this trade comprises electromechanical products, which include a wide range of IT-related goods. In 2024, Guangdong exported electromechanical products worth 3.87 trillion yuan, accounting for 65.6% of its total exports. With the economies of scale, the overall cost of logistics solutions in the Guangdong area remains higher cost-efficient than in Southeast Asia, even though labor costs are higher. The region benefits from advanced automated warehouses, well-developed logistics processes, and multiple international ports. Additionally, its proximity to Hong Kong further strengthens its position as a hub for international business. Therefore, the logistic cost in China for IT products can keep low.
The price is more transparent and dynamic due to the high amount of real-time trading and global supply-demand dynamics
It is easy to access to suppliers and ask prices so the price is rather transparent. It can be hard to profit from the information gap. Data from Alibaba International Station shows that in October 2024, the wholesale price of Cisco network switches in China was approximately $650/unit, while the U.S. domestic price was $720/unit.
Also, The rapid growth in demand and the agility of the Asia-Pacific market significantly enhanced China’s bargaining power for these products during the global supply chain recovery after the pandemic, allowing for more dynamic supply-demand adjustments.
The Impact of USD Dominance on Trade
USD Exchange Rate Mechanisms
The dominance of the U.S. dollar as the primary currency for international trade directly influences import and export costs. When the dollar appreciates, the cost of imports priced in dollars rises, making it more expensive for countries to purchase goods and reducing export competitiveness. Conversely, when the dollar depreciates, import costs decrease, and export competitiveness improves, benefiting economies that rely on international trade.
Supporting Data
According to the IMF’s 2023 report, approximately 80% of global trade transactions are settled in U.S. dollars, highlighting the currency’s central role in international trade. Price-sensitive products, such as technological hardware, represented 40% of China’s total imports from the U.S. in 2023, demonstrating the impact of exchange rate fluctuations on critical industries. During the same period, the USD to CNY exchange rate rose from 6.45 to 7.31, leading to an estimated increase in import costs of 13.4%, further emphasizing the financial implications of currency movements.
Policy Implications and Strategies
Managing Exchange Rate Risks
To mitigate the risks associated with currency fluctuations, businesses can utilize forward exchange contracts, allowing them to lock in USD to CNY exchange rates and stabilize costs over time. Additionally, adopting multi-currency settlement can serve as a viable strategy, enabling companies to negotiate transactions in RMB or other relatively stable currencies, such as the euro, to diversify risk and reduce dependency on the U.S. dollar.
Optimizing Procurement Strategies
Proactively managing procurement strategies is essential in navigating USD fluctuations. Companies can monitor market prices in real-time, leveraging various platforms to access larger distributors with stronger negotiation power, ensuring more competitive pricing. Moreover, expanding supplier networks by balancing sourcing between American and international suppliers helps mitigate reliance on a single market, offering greater flexibility and resilience in global supply chains.
Leveraging Market Arbitrage Opportunities
Businesses can capitalize on market arbitrage opportunities by engaging in cross-border resale, where American products are distributed through third-country markets for profit. This strategy is particularly advantageous for regions with restricted access to U.S. goods. While this practice can be legally executed through proper procedures, it is crucial to remain compliant with both international and domestic regulations to avoid potential legal and policy violations.
Strengthening Supply Chain Collaboration
Enhancing supply chain collaboration plays a fundamental role in cost optimization and efficiency. Close cooperation with logistics providers allows companies to streamline transportation and warehousing, ultimately reducing procurement costs. Establishing long-term agreements with suppliers further ensures price stability and a consistent supply of goods, fostering a more secure and predictable trade environment.
Conclusion
The lower pricing of American products in the Chinese market results from economies of scale, market competition, supply chain efficiency, and dollar exchange rate fluctuations. People work in global procurement can take advantage of this phenomenon to optimize the procurement strategy.
The article was written in January 2025 by Hongting LIU (ESSEC Business School, Master in Strategy & Management of International Business (SMIB), 2021-2022).
In this article, Hongting LIU (ESSEC Business School, Master in Strategy & Management of International Business (SMIB), 2021-2022) shares her professional experience as a Business Development and Marketing Strategy Intern at Forvia (Faurecia), in the Sustainable Materials Division.
About the company
Forvia is the new corporate identity created after Faurecia acquired HELLA in 2022. It represents the combined entity of Faurecia + HELLA, forming the 7th largest global automotive supplier. It is renowned for its innovative solutions in seating, interiors, clean mobility, and electronics. Committed to sustainability, the company launched its Sustainable Materials Division to address the increasing demand for eco-friendly automotive solutions. This division, established as an independent entity within the corporate structure, embodies a start-up-like agility while benefiting from the parent company’s resources and expertise.
Logo of the Forvia.
Source: the company.
The Sustainable Materials Division focuses on developing innovative materials for automotive parts while also marketing these solutions to external clients, fostering an entrepreneurial spirit within the organization.
My internship
During my six-month internship from April 2022 to November 2022, I worked in an environment that uniquely combined the structure of a global corporation with the flexibility and dynamism of a start-up. This experience provided me with a deeper understanding of sustainability in the automotive sector and enhanced my professional skills.
My missions
As a Business Development and Marketing Strategy Intern, I analyzed market trends using sales and supplier data, prepared communication materials (e.g., product presentations, portfolio books, and website content), and organized internal events to align stakeholders including clients, corporate team, and other divisions and departments of the company, with our division’s objectives. Additionally, I collaborated with engineering, business teams, and external partners to monitor the progress of various projects, ensuring timely execution and alignment with strategic goals.
Required skills and knowledge
The role required a range of soft skills, including project timeline management, creative marketing ideation, and building new products and strategies from the ground up. It also involved identifying and leveraging internal resources to coordinate efforts and achieve objectives, working independently without direct managerial oversight, and self-organizing teams to accomplish goals effectively. For some projects, you do not have previous examples and you need to start from 0 to 1. You also need to prove your idea/strategy by analysis to persuade your manager and other divisions of the company. It allows you to be responsible and follow up a project by yourself. You are required to set up the timeline and control the pace of the project. You need to communicate with different departments as well as other divisions to accomplish your project. Creativity and adaptability were also essential, as I worked on creating promotional materials from scratch and contributing to the division’s entrepreneurial efforts.
What I learned
This internship not only strengthened my understanding of how large organizations foster innovation but also highlighted the importance of balancing structure with flexibility in driving success. Faurecia provided the advantages of a large company, such as standardized workflows, abundant career opportunities, and a highly international environment. At the same time, the newly established division offered the benefits of a startup, including autonomy, the ability to build promotional materials from the ground up, and exposure to a rapidly developing sector. I appreciated the high level of efficiency and the immediate impact of my work, as well as the absence of the ‘cog in the machine’ experience common in larger firms. Moreover, working in the sustainable materials industry—a burgeoning field—equipped me with B2B (Business to Business) skills that have since been instrumental in launching my entrepreneurial journey after graduating. As it is an automobile company selling car parts (for our division, it is a division selling new material which can be applied to car parts), clients of this company are other car manufacturers which are companies. The marketing strategy for business-to-business market can be quite different from B2C (business to consumers) The experience of making marketing material and designing marketing strategy develop my skills in B2B marketing sectors.
Why should I be interested in this post?
For ESSEC students aiming to work in sustainability or innovative industries, this experience exemplifies how large corporations can offer opportunities that combine structure and creativity like start-ups. The insights I gained are particularly valuable for those seeking roles in business development or marketing within forward-thinking divisions.
The article was written in January 2025 by Hongting LIU (ESSEC Business School, Master in Strategy & Management of International Business (SMIB), 2021-2022).
In this article, Hongting LIU (ESSEC Business School, Strategy Management and International Business Program , 2021-2022) shares her first internship experience during the Bachelor as a Key account manager Assistant at Shenwan Hongyuan Securities Underwriting Sponsor Co., Ltd., one of China’s leading financial institutions.
About the company
Shenwan Hongyuan Securities is one of China’s largest and most prestigious financial service providers, with a history spanning several decades. The company specializes in a wide range of financial services, including investment banking, securities trading, and wealth management. Its underwriting and sponsor division focuses on supporting corporate clients with Initial Public Offering s (IPOs, when a private company sells its shares to the public for the first time on a stock exchange to raise capital), bond issuances (selling of debt in financial markets), and other capital-raising activities in both domestic and international markets.
Logo of Shenwan Hongyuan Securities.
Source: Shenwan Hongyuan Securities.
As a key player in China’s financial ecosystem, the company’s underwriting sponsor division plays a vital role in connecting businesses with investors and facilitating the growth of the capital markets.
My internship
During my two-month internship as a Marketing Communication Assistant, I worked closely with the investment and marketing teams to manage client communications and support capital market activities. This experience provided me with a comprehensive understanding of financial marketing and client relationship management in a dynamic and fast-paced environment.
My missions
As an intern, I supported my manager in providing financial advice to clients by assisting with research and analysis. I helped gather relevant financial news, market trends, and economic activities that could contribute to investment insights. I was involved in compiling and summarizing data on the performance of stocks. I also contributed to the creation of reports and presentations, helping to organize tables, charts, and visual aids to illustrate the performance of our portfolio. This involved tracking portfolio performance and comparing it to market benchmarks to provide a clearer picture for clients. Additionally, I assisted in preparing marketing materials for our financial products and services.
Required skills and knowledge
This role is an entry level internship for students studying in business schools. While it didn’t demand specialized financial expertise, the ability to quickly absorb and apply general financial knowledge from business school courses was essential. The position required strong analytical skills to interpret and synthesize market data into meaningful insights, and an understanding of the tools necessary for analysis, such as Python, PowerBI, and Excel, was also important. These tools were introduced through short training sessions, and I had to quickly get up to speed with them in order to support the team effectively.
Effective communication and relationship management were important for maintaining trust with clients. It was essential to understand the different need of clients, think from the client’s perspective and anticipate their needs to ensure their satisfaction. Their needs can be achieve certain financial goals, take risky choices, take safer choices, prepare for the retirement, prepare for the study of children, etc. Additionally, the role required me to stay updated with financial news and market trends, often reading numerous articles and analyzing charts to gather relevant information. Overall, the position required a quick learning curve, adaptability to new tools, and an ability to keep a client-centric mindset while managing a high volume of information
What I learned
This internship was particularly meaningful as my first experience in the financial industry. It offered a general yet valuable introduction to the securities sector, making it an ideal starting point for anyone without an extensive financial background. The experience allowed me to build a foundational knowledge of capital markets and develop practical skills applicable to future roles in the industry. Additionally, I gained firsthand experience in building and maintaining professional relationships, a skill that is invaluable in any client-facing role.
Financial concepts related to my internship
Investment research
One of my key tasks involved analyzing market information and providing clients with investment insights. This required understanding market trends, stock valuations, and risk factors to guide client decisions.
Securities underwriting
Supporting the preparation of underwriting materials exposed me to the intricacies of the IPO process, including pricing strategies and regulatory compliance.
Risk management
Timely updates on market conditions and financial products emphasized the importance of risk assessment in investment decisions, a critical aspect of client advisory roles in this field.
Personal financial awareness
During my internship, I developed a deeper understanding of personal financial management, recognizing the importance of financial planning and investment strategies. This experience gave me a clearer direction for managing my own finances, from evaluating risk tolerance to exploring diversified investment opportunities, laying a foundation for long-term financial security.
Why should I be interested in this post?
This internship experience is interesting for bachelor students who want to work in finance in the future. It is also a good opportunity for Master students who want to develop in finance but have few financial practical experiences. This experience highlights the importance of blending technical knowledge with client relationship skills. The internship also provides valuable exposure to the dynamic world of securities underwriting and investment advisory, making it an excellent steppingstone for a career in finance.
In this article, Camille Keller (ESSEC Business School, Bachelor in Business Administration (BBA), 2020-2024) explores coffee’s global consumption trends, examining regional habits, cultural significance, and emerging preferences.
Coffee: A Universal Obsession
Coffee holds the distinction of being the second most consumed beverage in the world after water. With an estimated 10 billion kilograms consumed annually in 2023, according to the International Coffee Organization’s latest global report, coffee plays a central role in daily life for millions. While its appeal began in regions like the Middle East and Europe, its reach has extended to every corner of the globe. In traditionally tea-drinking nations like China and India, coffee is steadily gaining popularity, driven by urbanization and an expanding middle class.
The cultural significance of coffee is evident in how it is integrated into the lifestyles of various regions. In Italy, espresso is more than just a drink; it is a tradition, often consumed while standing at the bar. In the United States, coffee fuels the on-the-go culture, with chains like Starbucks shaping global perceptions of coffee consumption. Meanwhile, in Scandinavian countries, coffee consumption is a communal affair, often paired with “fika,” a Swedish custom of taking a break with coffee and pastries. Across regions, coffee’s versatility allows it to adapt to local customs, cementing its place in daily routines worldwide.
Espresso bar in Italy
Source: Shutterstock.
Regional Consumption Patterns: Who Drinks the Most?
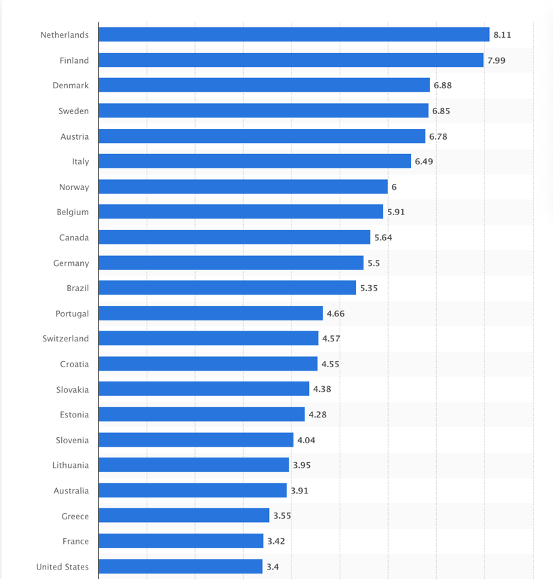
The world’s coffee consumption reveals fascinating disparities across regions. Europe remains the leader, with Northern European countries like the Netherlands, Finland, and Denmark topping the per capita consumption charts. According to Statista in 2023, the Netherlands leads with an impressive 8.11 kilograms per person annually, followed closely by Finland at 7.99 kilograms. These figures underscore a deeply ingrained coffee culture in these regions, where coffee is not just a beverage but a social ritual.
Meanwhile, the United States, the largest single market for coffee, ranks significantly lower in per capita consumption, averaging around 4 kilograms per person annually. This contrast highlights a distinct cultural difference: as noted by Jacobsen (2024), Americans predominantly favor convenience and mass-market coffee, which aligns with the rise of chain brands and ready-to-drink formats. This reflects a broader trend in the U.S., where coffee consumption habits are driven by practicality rather than the artisanal focus seen in Europe.
Per Capita Coffee Consumption in 2023
Source: Statista.
Asia, once dominated by tea, has emerged as a growing market for coffee. Countries like Japan and South Korea have embraced coffee culture, with specialty cafes and innovations like canned coffee becoming mainstream. China’s coffee market, although nascent, is expanding rapidly, driven by a young, urban demographic eager to adopt global trends. Latin America, home to many coffee-producing countries, is seeing a shift from exporting to cultivating local appreciation, with Brazil and Colombia leading domestic consumption in the region.
Urbanization and changing lifestyles play a significant role in driving coffee consumption. As more people move to cities, the demand for convenient and premium beverages increases. Younger generations, in particular, are drawn to coffee not only for its energizing properties but also for its social and aesthetic appeal, as showcased on platforms like Instagram.
Transforming Habits: Sustainability and Evolving Preferences
The coffee industry is undergoing a profound transformation, driven by shifting consumer values and evolving preferences. Sustainability now plays a pivotal role in purchasing decisions, particularly among younger consumers. Research by Robichaud and Yu (2022) highlights that Generation Z (aged 15–24) places increasing importance on ethical and sustainable consumption, with certifications like Fair Trade and Rainforest Alliance acting as key motivators. These certifications ensure that coffee production aligns with ethical labor practices, environmental conservation, and fair wages for farmers, reflecting the growing demand for transparency and social responsibility.
In parallel, the rise of connoisseur consumers—those who seek high-quality specialty coffee—has emphasized the importance of sustainability in production. As noted by Bartoloni et al. (2022), this segment values not only the taste and uniqueness of coffee but also its environmental and ethical footprint. For these discerning drinkers, coffee consumption is as much about supporting sustainable practices as it is about enjoying a premium product.
Evolving preferences are also shaping the industry. The increasing popularity of plant-based diets has led to the widespread adoption of non-dairy alternatives like almond, oat, and soy milk in cafés worldwide. Cold brew, once considered niche, has become a mainstream favorite, particularly among millennials and Gen Z consumers, who gravitate towards innovative and convenient formats. The growth of ready-to-drink coffee beverages reflects this trend, offering busy consumers a blend of convenience, variety, and sustainability in packaging and sourcing.
Health-conscious consumers further influence the market by demanding options such as low-caffeine, organic, and functional coffee infused with superfoods like turmeric and collagen. These preferences align with broader wellness movements and reflect a shift in how coffee is perceived—not just as a beverage but as a lifestyle choice. Together, these changes signal a new era in the coffee industry, where sustainability and innovation go hand in hand.
Why Should I Be Interested in This Post?
Global coffee consumption reflects broader trends in sustainability, wellness, and innovation. For ESSEC students interested in understanding global markets or sustainable trade practices, this article highlights important insights into consumer behavior and industry dynamics.
In this article, Camille KELLER (ESSEC Business School, Bachelor in Business Administration (BBA), 2020-2024) explores coffee as a commodity and cultural staple.
Coffee is more than just a beverage; it is a universal ritual, an economic cornerstone, and a cultural staple. As one of the most traded commodities in the world, coffee fuels not only mornings but also economies. In this post, we will explore the many faces of coffee, the countries that produce it, and the industry’s global composition, setting the stage for a deeper understanding of its role in global markets.
The different types and varieties of coffee
Two primary species dominate the coffee market: Arabica and Robusta. Arabica constitutes approximately 60-70% of global coffee production as of 2023, according to the International Coffee Organization. Known for its mild and nuanced flavors, Arabica thrives in high-altitude regions with cooler climates. In contrast, Robusta, which is hardier and more resistant to pests, grows at lower altitudes and features a bolder, more bitter flavor, with nearly double the caffeine content of Arabica. Lesser-known species such as Liberica and Excelsa contribute unique flavor profiles. Liberica is renowned for its smoky and floral notes, while Excelsa delivers tart, fruity nuances, though both occupy a niche share of the global market.
Coffee’s quality and flavor depend not only on its species but also on how it is processed. Washed or wet processing produces clean, vibrant flavors and is favored for specialty-grade coffee. Natural or dry processing offers fruity, full-bodied profiles as beans dry inside the coffee cherry. The honey process, a hybrid method, balances sweetness and acidity. Specialty coffee, graded on a scale of 100 points by organizations like the Specialty Coffee Association, stands apart from commodity coffee due to its superior flavor, sustainability practices, and traceability.
Coffee mug
Source: Shutterstock
Mapping the world of coffee: key producing countries
The global coffee market relies heavily on a few key players. Brazil is the world’s largest coffee producer, accounting for 39% of global output. Its diverse climate supports both Arabica and Robusta cultivation, with highly mechanized farming methods. Vietnam, the second-largest producer, specializes in Robusta and contributes around 16% of global production. Known for its efficient, high-yield practices, Vietnam is one of the main players in the coffee industry. Colombia, renowned for its high-quality Arabica beans, benefits from mountainous terrain and ideal climate conditions that produce coffee with bright acidity and rich aroma. Indonesia offers coffee with distinct earthy and spicy notes, thanks to unique wet-hulling processes. Ethiopia, often called the birthplace of coffee, produces some of the world’s most sought-after Arabica beans, featuring floral and fruity profiles.
Emerging players like Rwanda, Guatemala, and Honduras are carving out a reputation for high-quality specialty coffee. These countries are gaining recognition in global markets for their unique flavor profiles and commitment to sustainable practices. The global coffee industry thrives on this diverse production landscape, where each region’s distinct climate, soil, and methods contribute to the variety of coffee available to consumers.
Source: The Coffee Belt Map
Source: melacoffee.com
The industry landscape: big players and composition
Coffee’s journey from farm to cup involves a complex supply chain. Smallholder farmers account for over 70% of global coffee production, often working within cooperatives to improve their market access and bargaining power. Exporters act as intermediaries, facilitating the sale of raw coffee to international buyers. Roasters then transform green coffee beans into the aromatic, roasted coffee that consumers recognize, while retailers, including cafes, supermarkets, and e-commerce platforms, serve as the final link between coffee and the end consumer. Certification organizations like Fair Trade and Rainforest Alliance play a critical role in promoting sustainable and ethical practices across the supply chain, ensuring that the industry’s growth does not come at the expense of its workers or the environment.
A few multinational corporations wield significant influence over the coffee market. Nestlé, with its Nescafé and Nespresso brands, dominates the instant coffee and capsule markets. JDE Peet’s, home to brands like Jacobs, Douwe Egberts, and Peet’s Coffee, is a key player in retail coffee. Starbucks, known for its premium offerings, sets global trends and boasts a vast retail footprint. These corporations drive innovation, shape consumer preferences, and impact coffee prices through their purchasing power and marketing strategies. The industry’s composition reflects a delicate balance between the efforts of small-scale farmers and the strategies of large-scale corporations, each playing a vital role in coffee’s global narrative.
Why should I be interested in this post?
Coffee’s journey from farm to cup involves a complex supply chain. For students of ESSEC interested in global economics, commodities, or sustainable trade, understanding the coffee industry offers key insights into market dynamics, sustainability, and global commerce.
In this article, Anouk GHERCHANOC (IE University, Bachelor in Business Administration (BBA), 2021-2025) shares her experience as a financial analyst for companies in the French overseas territories in the 2IF Department of the Inter Invest Group.
About Inter Invest Group
Founded in 1991, the Inter Invest Group is a significant player in the financing and investment sector. Based in Paris, the group operates in various fields, including corporate finance, real estate projects, and wealth management advice. Thanks to its expertise and ability to offer tailor-made solutions, the Inter Invest Group supports its clients’ development strategies. Its authorization by the Autorité de Contrôle Prudentiel et de Résolution (ACPR, CIB 17808) guarantees rigorous and transparent financial practices, reinforcing its reputation as a trusted partner for private individuals, companies, and institutional investors.
Logo of Inter Invest Group.
Source: the company.
During my internship in 2024, I joined the 2IF department, which specializes in providing financing solutions for companies in French overseas territories (Guadeloupe, Martinique, Saint-Martin, Saint-Barthélemy, French Guiana, Réunion, Mayotte, French Polynesia, New Caledonia). Central to the department’s operations is the SOFIDOM offer, a financing scheme designed to address the specific needs of businesses in these regions. This offer supports companies by providing funds for equipment renewal, business expansion, and operational costs, whether the financing falls under tax exemption schemes or not. A key priority of the department is to deliver rapid and efficient responses to financing requests, allowing businesses to move forward with their projects without delays. This approach ensures efficiency and reflects a deep understanding of the unique economic and logistical challenges faced by companies in French overseas territories, enabling tailored financial support that meets local needs.
My internship
My internship in the 2IF department of the Inter Invest Group was a rewarding and formative experience. This department, which specializes in financing companies located in the French overseas territories, enabled me to actively contribute to assessing financing requests for small businesses. These businesses included newly established structures seeking to develop their activities and others facing financial difficulties requiring appropriate support.
An essential part of my job was analyzing the financial files, taking into account the specific economic features of the overseas territories, particularly their geographical remoteness, operating costs, and dependence on key sectors such as construction and food processing. This enabled me to develop an in-depth understanding of the unique challenges faced by these businesses while applying my theoretical knowledge of finance to real-life situations.
The 2IF department stands out for its responsiveness and efficiency, two essential assets for responding to companies’ immediate needs. This dynamic has led me to work to tight deadlines, requiring clear task prioritization and rapid but rigorous decision-making. Combining these demands with detailed financial analysis taught me to balance precision and efficiency, an essential skill in the financial sector.
Financed overseas territories.
Source: the company.
My missions
Verification of document conformity. My first task was to ensure the conformity of the financial and legal documents submitted by companies as part of their application for financing. I rigorously analyzed the conformity of balance sheets, income statements, Kbis (a document that certifies the legal existence of a French company), company articles of association, bank or personal guarantees, and bank statements for the last three months. These checks were carried out in compliance with LCB-FT (Lutte Contre le Blanchiment et le Financement du Terrorisme) obligations to identify any inconsistencies or irregularities in the data provided. For example, some files revealed anomalies in the financial statements or bank movements, which led to an in-depth review of the projects before a financing decision could be made. This verification stage was essential to lay a solid foundation for a reliable financial analysis and to ensure regulatory compliance.
In-depth financial analysis. Once the documents had been validated, I conducted in-depth financial analyses using key indicators such as profitability, solvency, and liquidity ratios. Specific calculations supplemented these analyses to refine the assessment of the companies, including the net debt ratio to measure their dependence on debt, the operating margin to assess the efficiency of core activities, the net operating profitability to analyze their ability to generate sustainable profits, and the level of equity about the total balance sheet to assess their financial strength. My analyses were based mainly on the passive balance sheets of the last two years and the profit and loss accounts, supplemented by a study of interim sales, to obtain an up-to-date and accurate view of the companies’ performance. Thanks to this methodology, I could identify significant elements, such as differences in financial structure or revenue dynamics, which were used to support my favorable or cautious recommendations.
Preparation of structured reports. The conclusions of my analyses were then summarized in detailed reports, structured around several key sections: presentation of the company, its directors and partners, description of the financing plan requested, in-depth analysis of the balance sheets and income statements, assessment of the sureties proposed and viability of the guarantees provided. Finally, I drew a reasoned conclusion on the financing request, with a favorable, reserved, or unfavorable opinion, depending on the case. These reports were then submitted to the Director of Financing, responsible for making the final decision. He could give conditional approval, requiring adjustments to the financing plan depending on his feedback.
Required skills and knowledge
My skills in financial accounting, operations management, corporate finance, and financial analysis, which I applied through my university education, played an essential role in effectively executing my day-to-day analyses. These skills enabled me to evaluate financial data and provide actionable information. My expertise in Excel proved invaluable in accurately processing balance sheets, cash flows, and income statements, enabling me to identify patterns, assess financial health, and make strategic recommendations. In addition, my mastery of Power BI helped me to design dynamic and visually appealing reports for the board of directors. These reports summarize the department’s financial results and strategic objectives, providing a clear and actionable overview that facilitates informed decision-making at the management level, a task I was given during my internship. Together, these tools enhanced the depth and effectiveness of my analyses, ensuring that critical points were addressed and presented with clarity.
On an interpersonal level, my soft skills played a key role in meeting the demands of my assignments. My ability to approach problems analytically enabled me to break down complex issues and propose practical, data-driven solutions. Effective organization and prioritization of tasks were essential in managing competing deadlines, ensuring that every product delivered met the high standards expected within the department. In addition, my strong communication skills enabled me to articulate written and verbal results.
Working in a fast-paced, dynamic environment increased my flexibility and responsiveness, enabling me to adapt to changing priorities and unexpected challenges without compromising quality. This adaptability has proved essential in managing multiple responsibilities simultaneously while maintaining a strategic focus on key objectives. Overall, the combination of technical expertise and non-technical skills I developed during this internship has greatly enhanced my ability to contribute effectively to financial projects.
What I learned
This internship was a vibrant learning experience that enabled me to move from academic theory to professional practice. I developed concrete expertise in financial analysis, particularly in evaluating financing applications and interpreting economic data. I have also honed my ability to detect anomalies in financial documents while producing clear, structured reports essential for supporting strategic decisions.
One of the priorities of my assignments was to provide a rapid, well-argued response to the acceptance or rejection of financing requests. Working to tight deadlines enabled me to strengthen my time management skills and develop my ability to manage multiple priorities effectively. This experience prepared me for complex challenges in the demanding finance sector.
The internship also confirmed my ambition to pursue a career in finance, making the most of my analytical skills and my interest in projects with a strong economic and social impact. The opportunity to work on concrete projects in a demanding, structured environment gave me a better understanding of the complexity of corporate finance and the importance of personalized support to ensure the success of projects.
Financial concepts related my internship
I present below three financial concepts related my internship: net margin, shareholders’ equity, and cash flow.
Net margin
During my internship, net margin came to the fore as a key indicator in company valuations. This ratio, calculated from net income divided by sales, measures a company’s ability to generate profits after covering all its costs, including tax and financial expenses. This analysis enabled me to understand the overall performance of the companies I studied and their ability to maintain a sufficient level of profit to sustain growth or cope with unforeseen financial events. I could identify the companies’ structural strengths and weaknesses by examining the net margin. High profitability reflected effective cost management, reasonable control of monetary expenses, and efficient operational activity. Conversely, low or negative profitability could indicate problems such as insufficient margins, an overly heavy cost structure, or competitive pressure on prices.
For example, one construction company I analyzed had a stable net margin thanks to rigorous management of operating costs and efficient project planning. This cost control, combined with the diversification of its contracts, reinforced my recommendation in favor of financing to modernize its equipment fleet and support its expansion into new markets. Conversely, a company in the agri-food sector showed a negative net margin. This was due to a significant rise in raw material costs, which had not been passed on to its sales prices, considerably reducing its margins.
Shareholders’ equity
Shareholders’ equity is essential for assessing a company’s financial strength. It comprises share capital, reserves, and retained earnings and appears on the liabilities side of the balance sheet. These elements are crucial in measuring a company’s ability to finance its activities over the long term, absorb losses, and limit its dependence on creditors. Share capital represents the contribution made by shareholders at the time of the company’s creation or capital increase, while reserves correspond to retained earnings used to strengthen shareholders’ equity. Retained earnings are profits or losses from previous years, reflecting the company’s past performance. Solid shareholders’ equity reflects the company’s financial stability, enabling it to withstand economic crises and finance its projects without excessive borrowing. This reduces the risk to creditors and allows the company to obtain more advantageous financing terms.
Within the 2IF department, a strict rule applied specifically to tax-exempt financing. The latter, governed by precise criteria, required that the equity shown in the last balance sheet liabilities exceeded half of the company’s share capital. This requirement guaranteed a solid financial base and minimized the risks for tax-exempt projects. If this condition was not met, the application for tax-exempt financing could not be accepted.
Cash flow
Cash flow analysis was essential to my work, in compliance with LCB-FT (Lutte Contre le Blanchiment et le Financement du Terrorisme) standards. It was based on examining the companies’ last three minimum bank statements, enabling me to assess their capacity to absorb the financial burden associated with the requested financing.
Based on these statements, I analyzed the consistency between payments received and contracts provided while checking for any other significant debts that might limit their financial room for maneuvering. This approach also ensured the traceability of financial flows and detected anomalies, such as unjustified transfers or discrepancies between actual transactions and the declarations provided. By ensuring complete transparency of financial operations, this cash flow analysis played a decisive role in formulating my recommendations and ensuring the company had the necessary resources to manage its current commitments and the requested financing.
Why should I be interested in this post?
This article is aimed at students and young professionals wishing to better understand the particularities of corporate finance, especially in the French overseas territories. It focuses on analyzing the unique challenges of these regions and applying key skills in financial analysis, risk management, and strategic decision-making. The Inter Invest Group offers a unique opportunity to gain practical experience and contribute to relevant financial projects.
In this article, Yann FONTAINE (head of Marketing of atometrics) and Sylvain GILIBERT (co-founder of atometrics) explain about the importance of data in finance to support small business managers. They discuss how their platform, atometrics, helps transform complex market data into actionable insights for small businesses and their stakeholders (like accountants, banks, brokers, and consultants) throughout different stages of the business lifecycle – from creation to development, through difficult phases, and during transmission/acquisition processes.
Today economic context
Did you know that 29% of local businesses in France fail within their first three years , often due to a lack of market understanding?
In today’s fast-moving economy, access to relevant and actionable data is critical for businesses—whether they are launching, growing, or overcoming challenges. Yet, small business managers and their advisors often struggle to find and interpret the right information —strategic insights about their market, including prospects, customers, competitors, and the business environment—, particularly at a local level. By local level, we mean the geographic scope tailored to the company’s market: from the catchment area of a neighbourhood for a local retail store to the entire country for national markets.
The power of local data
For businesses operating in local markets, understanding the economic environment, consumer behavior, competition and market transactions is essential. In France, open data sources provide valuable insights, but the sheer volume and complexity of this information can be overwhelming without the right tools.
atometrics: turning data into decisions
At atometrics, we simplify this process. Our platform automates the collection, analysis, and visualization of market data across all sectors and locations of the economy. By combining financial and non-financial information, we provide clear, actionable insights to support small business managers and their trusted partners, such as certified accountants, bankers, and consulting firms.
Logo of atometrics.
Source: the company.
Description of the product: atometrics platform
Atometrics is a cutting-edge platform that connects in real-time to numerous public and private databases via APIs, such as SIRENE (the national directory of businesses in France), BODACC (official bulletins for company announcements, including bankruptcies and mergers), public financial records from Infogreffe, INSEE census data (socio-economic and demographic statistics), DVF property transaction data (detailing real estate sales), Damodaran’s valuation datasets (global financial benchmarks), and more. By leveraging this vast data network, the platform enables users to generate comprehensive market studies instantly.
Searching for a company.
Source: atometrics.
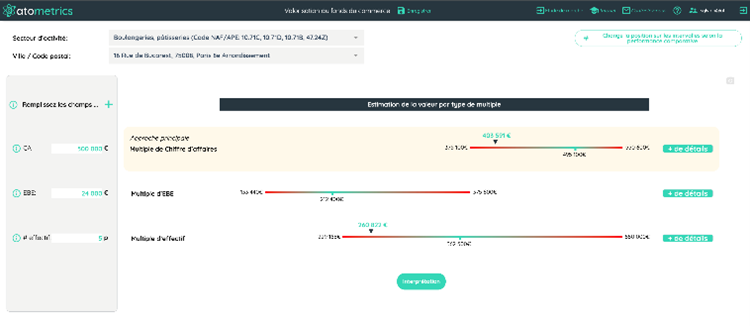
Users simply select an industry (e.g., bakery, hairdressing) and a location, and Atometrics delivers a detailed report. This includes financial insights on competitors, transaction prices for nearby properties or businesses, valuation tools for businesses or shares, competitor mapping, and local demographic and economic data. Additionally, qualitative market insights are provided. The platform also features customizable email alerts to notify users of critical events, such as new tenders or competitors.
Report on a company.
Source: atometrics.
The platform allows users to either work with specific datasets (e.g., Excel exports, map visuals) or generate complete reports in PDF or PPT format.
Supporting small businesses at every stage
atometrics empowers small businesses through their stakeholders — accountants, banks, brokers, consultants — to access key information at the different stages of the business life cycle:
Creation: assess market feasibility, validate business plans, and identify the best locations for new businesses.
Development: monitor trends, spot opportunities, and manage risks. For example, our platform can alert managers to new competitors or relevant public tenders in real time.
Difficulty phases: respond quickly to economic shifts with up-to-date market intelligence, ensuring resilience during challenging times.
Transmission and acquisition: conduct reliable valuations of businesses, assets, or securities based on accurate market multiples.
A concrete example: how atometrics enhances banking efficiency and risk assessment
Banks leveraging atometrics gain a significant advantage by accessing a uniform and structured source of information. When client managers and risk analysts evaluate a funding request or a business plan, they need to determine whether the entrepreneur is likely to achieve their revenue targets. This requires reliable market data: have similar projects succeeded or failed? Does the targeted catchment area show strong potential?
Atometrics simplifies this process by providing objective, data-driven insights that streamline the assessment of funding requests and accelerate the time to market of loan drawdowns. Instead of spending hours collecting and interpreting scattered information, bank advisors can access clear, actionable insights in real time.
Furthermore, the shared use of atometrics across commercial and risk departments fosters a common source of information among them, hence improving communication and collaboration between teams.
Conclusion
In today’s data-driven world, success belongs to those who can transform information into action. atometrics equips small business stakeholders with the tools and insights they need to unlock opportunities, navigate challenges, and drive sustainable growth—at every stage of the journey.
Why should I be interested in this post?
In today’s era of open finance and open data, financial professionals need cutting-edge tools to better serve their clients. This article reveals how atometrics, an innovative French fintech, is transforming the way banks, brokers, accountants, and business advisors support companies through data analytics. Whether you’re an ESSEC student preparing for a career in finance, a banker looking to streamline credit processes, or a consultant aiming to provide better market insights, you’ll want to know how the latest data-driven tools are reshaping financial decision-making and improving client service.
In this article, Snehasish CHINARA (ESSEC Business School, Grande Ecole Program – Master in Management, 2022-2024) presents the Top 10 Cryptocurrencies by Market Capitalization (August 2024).
Market Capitalization of Cryptocurrencies
Market capitalization, often referred to as market cap, signifies the complete monetary worth of a company’s stock or, in the realm of cryptocurrencies like Bitcoin, the collective value of all mined coins. In the cryptocurrency domain, market cap is computed by multiplying the prevailing price of a single coin by the total quantity of coins mined up to that point. Market cap is important because in the crypto ecosystem (and beyond) it measures the success of the cryptocurrency.
In June 2023, the total market capitalization of all cryptocurrencies worldwide stands at $1.22 Trillion, displaying a 9.11% change compared to a year ago. At this moment, Bitcoin (BTC) holds the highest market cap of $569 Billion, corresponding to a Bitcoin dominance of 46.71%.
Market capitalization facilitates comparing the overall value of different cryptocurrencies, aiding in well-informed investment choices. Cryptocurrencies are usually categorized by market cap into three groups: 1) Large cap, such as Bitcoin and Ethereum, with market caps over $10 billion, perceived as lower risk due to their established growth and liquidity resilience; 2) Mid-cap, between $1 billion and $10 billion, offer potential upside but elevated risk; 3) Small-cap, under $1 billion, are highly vulnerable to market sentiment-driven fluctuations.
Volume Traded of Cryptos
The trading volume holds significant importance in the realm of cryptocurrencies and other financial instruments. It signifies the complete count of tokens or coins traded over a particular timeframe, typically denoted in the base currency (like USD or BTC) or the token (for instance, ETH or XRP) within periods like 24 hours, 7 days, or 30 days.
Cryptocurrency liquidity is often gauged by its trading volume, a measure of market activity. Elevated trading volumes denote heightened buyer and seller presence, facilitating smoother trades without abrupt price shifts. Enhanced liquidity is advantageous, streamlining trade entries or exits. A surge in trade frequency yields more data, refining price determination and aligning cryptocurrency value more accurately. Noteworthy shifts in trading volume might signify sentiment changes – increased volume suggests heightened demand or interest, while reduced volume implies waning enthusiasm or market uncertainty. When coupled with price dynamics, volume aids trend validation; a rising cryptocurrency price coupled with elevated trading volume suggests robust momentum and broader market involvement.
#1 Bitcoin (BTC)
Logo of Bitcoin
Statistics
Market capitalization: $568.57 Billion
Market price : $ 29,230.11
Number of coins in circulation: 18.30 Million
Volume traded (over the past year): $3.36 Trillion
Year founded: 2009
Overview of Bitcoin
Introduced in 2009 by an undisclosed group using the pseudonym Satoshi Nakamoto, Bitcoin marked the debut of accessible cryptocurrencies. Emerging in the aftermath of the global financial crisis, it aimed to provide an alternative to conventional financial systems, granting individuals direct control over their assets and bypassing intermediaries.
Functioning on a blockchain foundation, Bitcoin employs the Proof of Work (PoW) consensus mechanism, where miners compete to validate transactions through solving complex puzzles, ensuring system security and integrity. Initially viewed as a digital currency, Bitcoin’s role has evolved to be similar to “digital gold,” attributed to its capped supply of 21 million coins. This scarcity sets it apart from traditional currencies and positions it as a hedge against inflation and economic uncertainty, making it valuable for remittances and global trade, particularly in regions with limited banking access. Utilizing digital wallets, Bitcoin enables autonomous transactions, offering an alternative to the unbanked population and allowing them to engage in financial activities and preserve value.
Market capitalization
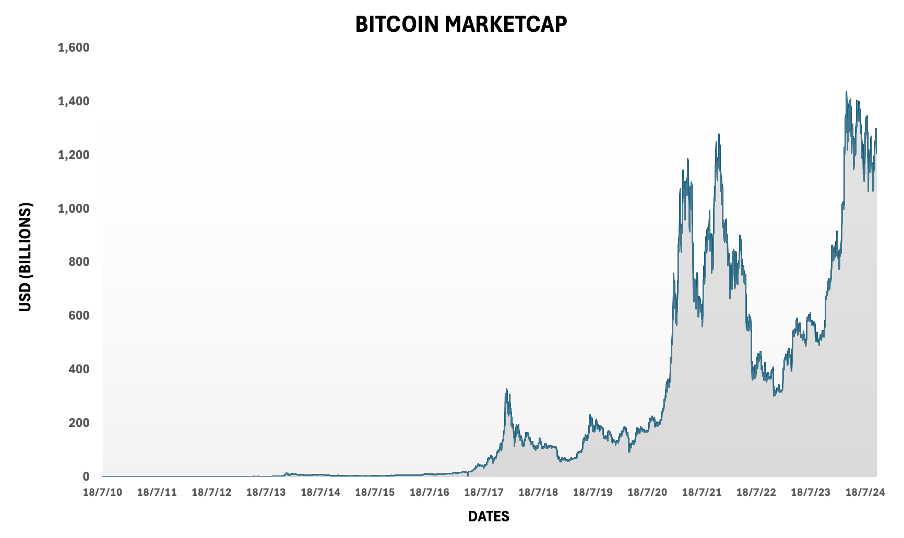
The figure below gives the market capitalization of bitcoin from July 2010 to September 2024. At a given point of time, market capitalization is obtained by multiplying the number of bitcoin in circulation (coin supply) by the price of bitcoin.
Market Capitalization Chart of Bitcoin
Source: Yahoo! Finance. (Computation by Author)
You can download blow the excel file used to build the figure. Historical data for Bitcoin can be downloaded from CoinMarketCap or Yahoo! Finance website.
#2 Ethereum (ETH)
Logo of Ethereum
Statistics
Market capitalization: $223.15 billion
Market price : $1856.8
Number of coins : 120.16M
Year founded: 2013
Overview of Ethereum
In 2013, Ethereum was conceptualized, and it became publicly known in 2015 through the efforts of Vitalik Buterin. Unlike its forerunner, Bitcoin, Ethereum stands as a revolutionary stride in blockchain technology. It goes beyond simple digital currency transfer, incorporating programmable smart contracts into its framework. This innovation has instigated a fresh era of decentralized applications (DApps) spanning various domains. These smart contracts, penned using the Solidity programming language, facilitate self-executing agreements based on predefined conditions, effectively reshaping industries such as finance, supply chain management, and gaming. Ether (ETH), Ethereum’s native cryptocurrency, plays a dual part, serving as a transactional medium within the network while also fueling the execution of these contracts.
At the foundation of Ethereum lies a transition from the energy-intensive Proof of Work (PoW) to a more ecologically conscious Proof of Stake (PoS) consensus protocol. This transformation, embodied in Ethereum 2.0, not only amplifies scalability and efficiency but also guarantees the platform’s endurance and its capacity to meet the growing demand for blockchain-centered solutions. The lasting legacy of Ethereum originates from its conversion of blockchain from a mere digital currency system to a versatile bedrock that stimulates innovation through decentralized applications and smart contracts.
Market capitalization
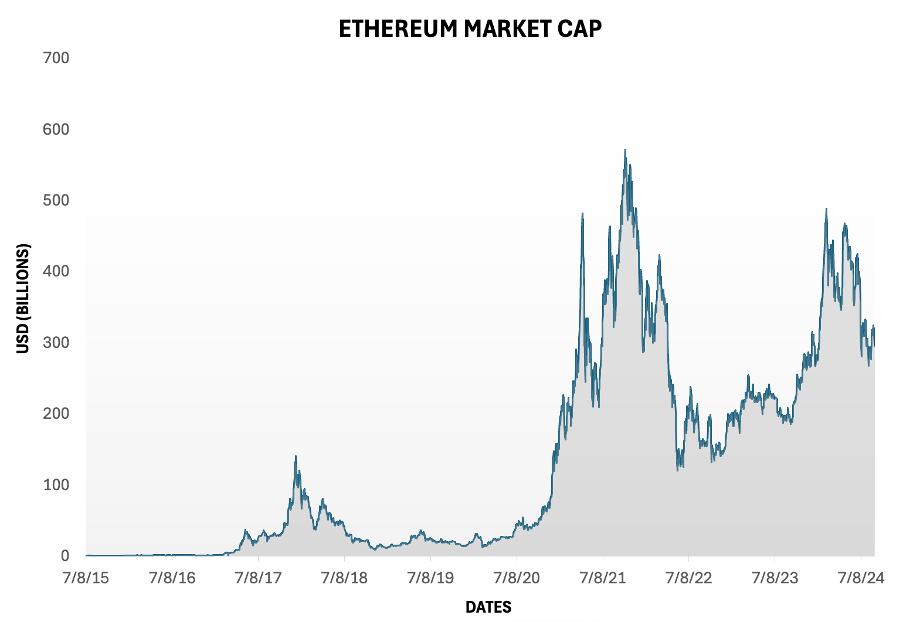
The figure below gives the market capitalization of ethereum from August 2015 to September 2024. At a given point of time, market capitalization is obtained by multiplying the number of Ethereum in circulation (coin supply) by the price of Ethereum.
Market Capitalisation Chart of Etheream
Source: Yahoo! Finance. (Computation by Author)
The historical data for Ethereum market prices can be downloaded from Yahoo! Finance website: Download the data for Ethereum
You can download blow the excel file used to build the figure. Historical data for Ethereum can be downloaded from CoinMarketCap or Yahoo! Finance website.
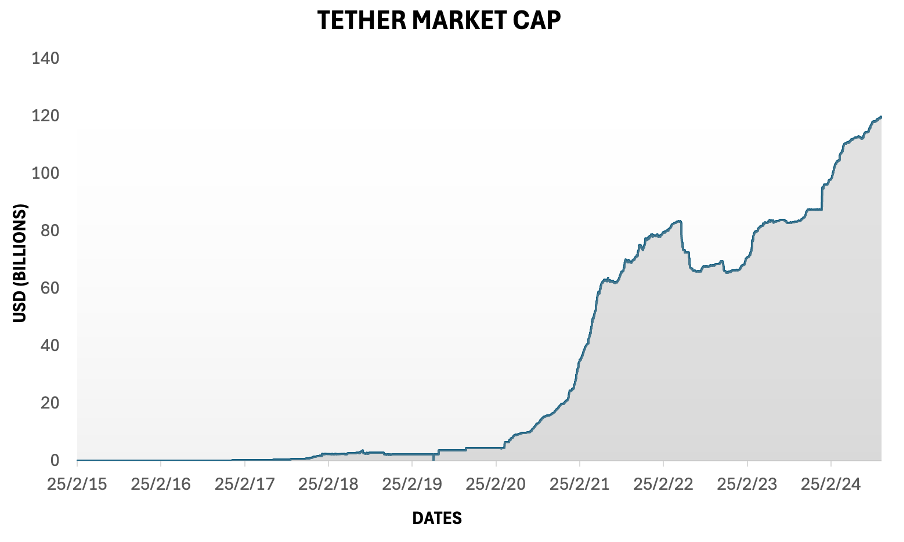
#3 Tether (USDT)
Logo of Tether
Statistics
Market capitalization: $83.81 Billion
Market price : $ 0.999
Circulating Supply : $83.53 Billion
Year founded: 2014
Overview of Tether
Released in 2014, Tether entered the cryptocurrency arena amidst the quest for stability within this dynamic market. Conceived as a stablecoin, Tether aimed to counteract the pronounced price volatility synonymous with cryptocurrencies like Bitcoin and Ethereum. Designed as a form of cryptocurrency, stablecoins, like Tether, are meticulously crafted to mirror the value of specific fiat currencies. Each individual Tether coin is intrinsically valued at precisely one unit of the chosen fiat currency, ensuring steadfast equivalence. This is exemplified by the fact that a solitary Tether USDT is perpetually equivalent to one U.S. dollar.
The distinctive hallmark of USDT lies in its pioneering fusion of fiat currency stability with blockchain technology. This characteristic renders it exceedingly practical for preserving or transferring value, as its unchanging price obviates concerns about depreciation. While renowned cryptocurrencies such as Bitcoin and Ethereum undergo price fluctuations based on market dynamics, USDT remains steadfastly pegged to the dollar. Upon entry into the cryptocurrency market, it behaves akin to any other currency, facilitated through blockchain technology. Thus, Tether can be procured or traded via various cryptocurrency exchanges supporting USDT.
Market capitalization
The figure below gives the market capitalization of Tether from February 2015 to September 2024. At a given point of time, market capitalization is obtained by multiplying the number of Tether in circulation (coin supply) by the price of Tether.
Market Capitalisation Chart of Tether
Source: Yahoo! Finance. (Computation by Author)
The historical data for Tether market prices can be downloaded from Yahoo! Finance website: Download the data for Tether
You can download blow the excel file used to build the figure. Historical data for Tether can be downloaded from CoinMarketCap or Yahoo! Finance website.
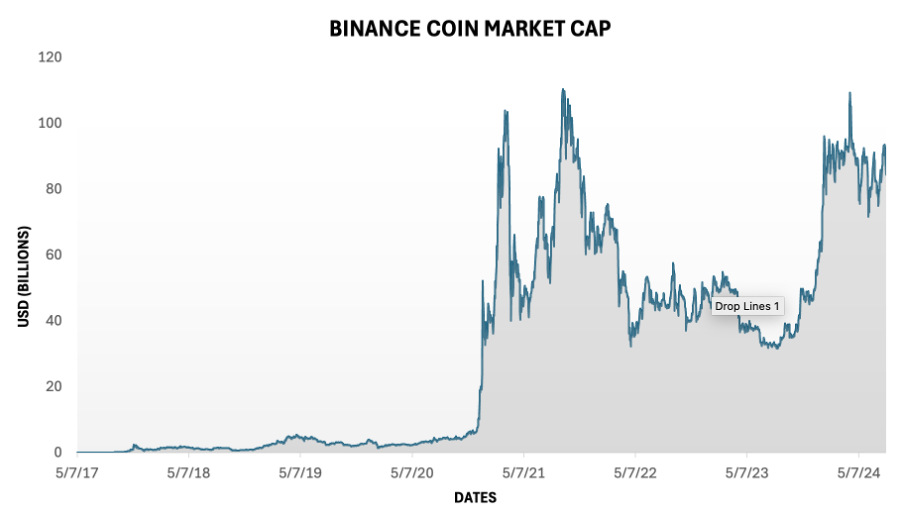
#4 Binance Coin (BNB)
Logo of BNB
Statistics
Market capitalization: $37.14 Billion
Market price : $241.4
Number of coins : 153.85 Million
Year founded: 2008
Overview of BNB
Binance Coin (BNB) emerged in July 2017 as a significant cryptocurrency, originating from Binance exchange’s forward-looking perspective. Initially designed to provide trading fee incentives to Binance users, the introduction of BNB coincided with the worldwide surge in cryptocurrency interest. It was conceived by tech entrepreneur Changpen Zhao, also known as CZ, and serves as the native utility token for Binance exchange, recognized as the world’s largest cryptocurrency trading platform. BNB operates on the innovative BNB Chain, which incorporates a distinctive amalgamation of Proof of Stake (PoS) and Proof of Authority (PoA) consensus mechanisms. By leveraging both these models, the network achieves comparably reduced fees and swifter transaction processing. The forthcoming BNB Chain roadmap for 2022/23 aims to enhance transaction speed, lower fees, and provide open-source capabilities, catering to developers aiming to construct within the expansive Binance ecosystem.
Market capitalization
The figure below gives the market capitalization of Binance from July 2017 to September 2024. At a given point of time, market capitalization is obtained by multiplying the number of Binance in circulation (coin supply) by the price of Binance.
Market Capitalisation Chart of BNB
Source: Yahoo! Finance. (Computation by Author)
The historical data for BNB market prices can be downloaded from Yahoo! Finance website: Download the data for BNB
You can download blow the excel file used to build the figure. Historical data for Binance can be downloaded from CoinMarketCap or Yahoo! Finance website.
#5 XRP / Ripple (XRP)
Logo of XRP
Statistics
Market capitalization: $36.82 Billion
Market price : $0.698
Number of coins : $ 54.74 Billion
Year founded: 2012
Overview of XRP
XRP is a digital currency that emerged onto the scene in 2012 as a key element of Ripple Labs’ visionary pursuit to transform cross-border financial settlements and payments. The founders of XRP, Chris Larsen and Jed McCaleb, sought to confront the inherent inefficiencies and delays that plagued conventional banking systems. Introducing XRP as a conduit between diverse fiat currencies, the aim was to enable swift and seamless international transactions. Setting it apart from its cryptocurrency peers, XRP wasn’t minted through the typical mining process ; instead, it was pre-mined, featuring a fixed quantity of 100 billion tokens. This strategic move was orchestrated to establish a stable foundation for the currency’s growth.
At the core of Ripple’s groundbreaking xRapid product, XRP plays the role of an intermediary currency, facilitating the exchange of value across various fiat currencies within financial institutions. The intrinsic currency of the XRP Ledger, a cryptographic ledger bolstered by a network of interconnected nodes, XRP empowers these institutions in their pursuit of seamless cross-currency transactions. Notably, Ripple is the architect behind this blockchain-based digital payment settlement system and the extensive crypto exchange network that encompasses it. An embodiment of innovation, Ripple harnesses its native token to facilitate the transition of traditional financial dealings from centralized databases under the jurisdiction of financial authorities to an openly accessible infrastructure.
Market capitalization
The figure below gives the market capitalization of XRP from April 2020 to September 2024. At a given point of time, market capitalization is obtained by multiplying the number of XRP in circulation (coin supply) by the price of XRP.
Market Capitalisation Chart of XRP
Source: Yahoo! Finance. (Computation by Author)
The historical data for XRP market prices can be downloaded from Yahoo! Finance website: Download the data for XRP
You can download blow the excel file used to build the figure. Historical data for XRP can be downloaded from CoinMarketCap or Yahoo! Finance website.
#6 USD Coin (USDC)
Logo of USD Coin
Statistics
Market capitalization: $26.49 billion
Market price : $1.00
Circulating Supply : 26.28 Billion
Year founded: 2018
Overview of USD Coin
The USD Coin (USDC) serves as a stable digital currency, maintaining a steadfast 1:1 value with the US dollar, regardless of the ever-changing tides of the cryptocurrency market. This stability is rooted in its robust foundation – US dollar reserves securely held within regulated US financial institutions. To ensure transparency and reliability, the acclaimed accounting firm Grant Thornton diligently monitors these reserves, releasing detailed monthly attestation reports.
USDC boasts remarkable versatility, seamlessly functioning on various blockchain platforms such as Ethereum, Algorand, Solana, Stellar, and TRON. Key features and use cases of USD Coin are rooted in its stability and ease of use. USDC facilitates seamless, near-instantaneous cross-border transactions and serves as a bridge between traditional finance and the blockchain world, enabling individuals and businesses to transfer value globally without exposure to the volatility inherent in many cryptocurrencies. With its one-to-one peg to the US Dollar, USDC serves as a valuable tool for traders and investors, allowing them to hedge against market fluctuations while remaining within the crypto ecosystem. Moreover, the stablecoin has found application in the decentralized finance (DeFi) sector, where it serves as collateral for loans, liquidity provision, and yield farming, contributing to the vibrant evolution of blockchain-based financial services.
Market capitalization
The figure below gives the market capitalization of USD Coin from October 2018 to September 2024. At a given point of time, market capitalization is obtained by multiplying the number of USD Coin in circulation (coin supply) by the price of USD Coin.
Market Capitalisation Chart of USDC
Source: Yahoo! Finance. (Computation by Author)
The historical data for USD Coin market prices can be downloaded from Yahoo! Finance website: Download the data for USD Coin
You can download blow the excel file used to build the figure. Historical data for USD Coin can be downloaded from CoinMarketCap or Yahoo! Finance website.
#7 Dogecoin (DOGE)
Logo of Doge Coin
Statistics
Market capitalization: $10.88 billion
Market price : $0.077
Circulating Supply: 140.52 Billion
Year founded: 2013
Overview of Doge Coin
Originally conceived as a playful jest aimed at the crypto community, Dogecoin emerged as a whimsical creation inspired by a popular meme. Crafted by the collaborative efforts of software engineers Billy Marcus and Jackson Palmer, the genesis of Dogecoin occurred in the latter part of 2013. Operating on an autonomous blockchain unique to itself, Dogecoin’s digital ledger undergoes ceaseless updates to encompass novel transactions, employing cryptographic techniques to ensure the security of these transactions.
The foundational framework of Dogecoin’s blockchain is rooted in the proof of work consensus mechanism, which necessitates miners to deploy computational prowess in solving intricate mathematical puzzles. This endeavor facilitates the processing and inscription of transactions onto the blockchain. In return for their contributions to upholding the integrity of the blockchain, miners are rewarded with additional Dogecoin holdings, affording them the choice to retain or trade these assets within the open market.
While Dogecoin can feasibly be employed for monetary transactions and acquisitions, its role as a dependable store of value remains compromised. This deficiency primarily arises from the absence of a predetermined upper limit on the quantity of Dogecoins that can be mined, thus inherently imbuing the cryptocurrency with a pronounced inflationary trait.
Market capitalization
The figure below gives the market capitalization of Doge Coinfrom July 2014 to September 2024. At a given point of time, market capitalization is obtained by multiplying the number of Doge Coin in circulation (coin supply) by the price of Doge Coin.
Market Capitalisation Chart of Doge Coin
Source: Yahoo! Finance. (Computation by Author)
The historical data for Doge Coin market prices can be downloaded from Yahoo! Finance website: Download the data for DogeCoin
You can download blow the excel file used to build the figure. Historical data for Doge Coin can be downloaded from CoinMarketCap or Yahoo! Finance website.
#8 Cardano (ADA)
Logo of Cardano
Statistics
Market capitalization: $10.77 Billion
Market price : $0.3076
Circulating Supply : 35.03 Billion
Year founded: 2015
Overview of Cardano
Launched in September 2017 by Charles Hoskinson, one of Ethereum’s co-founders, Cardano strives to manifest as a third-generation blockchain initiative, extending the groundwork laid by Bitcoin (first generation) and Ethereum (second generation). Positioned as an eco-friendly and scalable smart contract platform, Cardano (ADA) operates on a proof-of-stake consensus mechanism known as Ouroboros, effectively validating transactions while minimizing energy consumption. The development landscape of Cardano relies on the utilization of the Haskell programming language, an attribute attributed to facilitating an evidence-centric development approach, subsequently ensuring unmatched security and reliability.
The central ambition of Cardano orbits around the facilitation of smart contracts, empowering developers to craft a diverse array of decentralized financial applications, novel cryptocurrency tokens, interactive games, and more. The architecture of the Cardano blockchain is bifurcated into two distinct tiers: the Cardano Settlement Layer (CSL) and the Cardano Computing Layer (CCL). The former houses the record of accounts and their corresponding balances, additionally serving as the domain where Ouroboros-based consensus mechanisms validate transactions. On the other hand, the latter, namely the CCL, serves as the execution ground for all computations related to blockchain applications, primarily driven by the functionality of smart contracts. This partitioning of the blockchain into dual strata endeavors to empower the Cardano network to effortlessly process a substantial volume of up to a million transactions per second.
Market capitalization
The figure below gives the market capitalization of Cardano from September 2017 to September 2024. At a given point of time, market capitalization is obtained by multiplying the number of Cardano in circulation (coin supply) by the price of Cardano.
Market Capitalisation Chart of Cardano
Source: Yahoo! Finance. (Computation by Author)
The historical data for Cardano market prices can be downloaded from Yahoo! Finance website: Download the data for Cardano
You can download blow the excel file used to build the figure. Historical data for Cardano can be downloaded from CoinMarketCap or Yahoo! Finance website.
#9 Solana (SOL)
Logo of Solana
Statistics
Market capitalization: $9.62 Billion
Market price : $24.45
Circulating Supply : 405.76 Million
Year founded: 2020
Overview of Solana
Solana, an up-and-coming cryptocurrency, has drawn substantial attention in the world of blockchain. Launched in 2020 by Anatoly Yakovenko, a former Qualcomm engineer, Solana’s coin was meticulously crafted to tackle the scalability and performance limitations that earlier blockchain platforms such as Ethereum had encountered. Solana’s developmental journey gained rapid traction as it aspired to bring about a transformation in the realm of decentralized finance (DeFi). This transformation was to be realized through swifter transaction speeds and reduced fees in comparison to its counterparts. This innovative approach captivated both investors and developers, propelling Solana into the spotlight as a highly promising contender in the expansive landscape of blockchain technology.
At its core, Solana operates as a crypto-computing platform with a distinct objective: to achieve remarkable transaction speeds without compromising decentralization. This exceptional speed translates into a notable reduction in congestion and fees. By maintaining these high speeds and low fees, Solana’s ultimate aim is to scale its capabilities to a level where it can rival centralized payment processors like Visa. The primary cryptocurrency associated with Solana is known as SOL. This digital asset serves multiple purposes, including covering transaction fees and facilitating the staking process. Additionally, SOL holders possess the privilege of participating in voting for upcoming upgrades. Notably, SOL is accessible for trading on exchanges such as Coinbase, providing users with an avenue to engage with this evolving crypto phenomenon.
Market capitalization
The figure below gives the market capitalization of Solana from September 2017 to September 2024. At a given point of time, market capitalization is obtained by multiplying the number of Solana in circulation (coin supply) by the price of Solana.
Market Capitalisation Chart of Solana
Source: Yahoo! Finance. (Computation by Author)
The historical data for Solana market prices can be downloaded from Yahoo! Finance website: Download the data for Solana
You can download blow the excel file used to build the figure. Historical data for Solana can be downloaded from CoinMarketCap or Yahoo! Finance website.
#10 Tron (TRX)
Logo of Iron
Statistics
Market capitalization: $7 billion
Market price : $0.078
Circulating Supply : 89.52 Billion
Year founded: 2017
Overview of Tron
In 2017, Tron launched as a blockchain project with a unique approach, foregoing cryptographic advancements in favor of integrating existing elements like dApps, smart contracts, and tokens pioneered by other projects. Its standout strategy was its Asia-focused market penetration, leveraging its founder Justin Sun’s prominence. Fueled by an engaged community, Tron’s futuristic vision yielded success.
Initially an Ethereum-based ERC-20 token, Tron has transitioned into an independent cryptocurrency. At its core, the Tronix network champions decentralization, freeing blockchain data from central control. Content creators earn TRX tokens for their contributions and can even devise custom tokens for the Tron network, enhancing dApp experiences. With plans to introduce decentralized games and a proof-of-stake consensus mechanism manned by super representatives, Tron’s rapid block additions and support for thousands of transactions per second further underscore its distinctive position in the cryptocurrency realm, complemented by its empowering content creator rewards and ownership model.
Market capitalization
The figure below gives the market capitalization of Tron from August 2017 to September 2024. At a given point of time, market capitalization is obtained by multiplying the number of Tron in circulation (coin supply) by the price of Tron.
Market Capitalisation Chart of Tron
Source: Yahoo! Finance. (Computation by Author)
The historical data for Tron market prices can be downloaded from Yahoo! Finance website: Download the data for Tron
You can download blow the excel file used to build the figure. Historical data for Tron can be downloaded from CoinMarketCap or Yahoo! Finance website.
Why should I be interested in this post?
This blog post provides valuable insights into the current landscape of cryptocurrencies. As the digital financial world continues to evolve, learning about the top 10 cryptocurrencies by market capitalization helps us understanding the leading cryptocurrencies and their market standings can provide crucial information for both seasoned investors and newcomers. Whether you’re seeking potential investment opportunities or simply staying informed about the trends shaping the financial future, this article can offer a concise overview of the top-performing cryptocurrencies, making it a must-read for anyone looking to navigate the complex world of digital assets.
In this article, Snehasish CHINARA (ESSEC Business School, Grande Ecole Program – Master in Management, 2022-2025) delves into the illiquidity, solvency and insolvency, key concepts in that connect financial distress and bankruptcy procedures.
Illiquidity
Illiquidity refers to the inability of a company or individual to convert assets into cash quickly enough to meet short-term financial obligations as they come due. This condition arises from a mismatch in the timing of cash inflows and outflows rather than a fundamental deficiency in overall financial health. For instance, a firm might hold substantial non-liquid assets (e.g., accounts receivable or inventory) that are valuable but not immediately accessible for use in settling debts. Illiquidity is generally viewed as a short-term liquidity risk and is often addressed through measures such as enhanced cash flow management, securing bridge financing, or leveraging credit facilities.
Solvency and Insolvency
Solvency refers to the financial health of an entity, where its assets exceed its liabilities, and it can meet its financial obligations as they fall due (although not in the short term as explained below). A solvent entity demonstrates financial stability and sustainability, which are key factors for stakeholders, such as debt holders (for liquidity reasons at the time debt deadlines) and especially equity holders (for performance reason).
Conversely, insolvency is a financial condition in which an entity’s liabilities exceed its assets, or it is unable to meet its debt obligations as they become due. It represents a state of long-term financial distress, indicating that the entity lacks sufficient resources to satisfy its obligations, even with adequate time to manage cash flows.
Insolvency can manifest in two primary forms:
Balance Sheet Insolvency: Occurs when the total liabilities of a company exceed its total assets. This is typically assessed using the entity’s balance sheet, where negative equity (assets minus liabilities) signals insolvency.
Cash Flow Insolvency: Occurs when an entity cannot pay its debts as they fall due, despite potentially having assets that exceed liabilities. This happens when illiquid assets cannot be quickly converted to cash to meet immediate obligations.
Insolvency is distinct from illiquidity in that it reflects a fundamental imbalance in financial health rather than a short-term cash flow issue. Prolonged insolvency often leads to bankruptcy filings, where legal proceedings determine whether the business should be restructured or liquidated.
Valuation Perspective: Solvency and Insolvency via Net Present Value (NPV)
Formula for Net Present Value (NPV)
The Net Present Value (NPV) is calculated using the following formula:
Figure 1. Net Present Value (NPV) Formula
In this context, cash flows represent the value generated by the firm’s assets, while the discount rate reflects the required return on debt and equity financing. A positive NPV signifies that the firm or project creates value above its cost of capital, while a negative NPV indicates value destruction and financial risk.
From a valuation standpoint, Net Present Value (NPV) is a crucial metric that aligns with the
solvency status of an entity. NPV evaluates the difference between the present value of cash inflows and the present value of cash outflows over a given period. It serves as an indicator of the financial viability of a firm or project.
Solvent Firms: NPV > 0
A positive NPV indicates that the firm or project is generating value in excess of the required rate of return.
Such firms are financially sustainable, with the potential to attract investments, repay debts, and grow operations.
Example: A profitable company with strong operational cash flows and prudent capital investments will exhibit a positive NPV.
Insolvent Firms: NPV < 0
A negative NPV signals that the firm or project is destroying value, as cash outflows exceed the discounted cash inflows.
These firms struggle to generate sufficient returns, often resulting in financial distress and eventual insolvency.
Example: A company burdened by declining revenues, rising costs, and high-interest obligations may show a negative NPV.
Bankruptcy Basics
Bankruptcy is a legal framework that helps individuals and businesses unable to meet their financial obligations in the short term. When a company files for bankruptcy, it either seeks to reorganize its debts and operations or liquidate its assets to repay creditors, depending on the type of bankruptcy pursued (Chapter 7 for liquidation or Chapter 11 for reorganization procedures in US bankruptcy law). Reorganisation can offer a pathway to stability, enabling companies to mitigate debt burdens, restructure, and potentially preserve jobs. In this post I explain the link between the two academic concepts of illiquidity and insolvency and the two paths of bankruptcy of liquidation and reorganization.
Liquidation (Chapter 7 Bankruptcy)
Liquidation, often governed by specific bankruptcy codes such as Chapter 7 in the U.S., involves the complete dissolution of a financially distressed entity. Under this process, the firm’s assets are sold off to repay creditors in a legally prioritized manner. Liquidation is typically the final recourse for insolvent entities that lack the ability to restructure or continue operations. It marks the end of the entity’s existence, with any remaining proceeds distributed to stakeholders after settling liabilities.
Figure 2. Number of Chapter 7 Bankruptcy Filings (2013-2022)
Source: computation by the author (data: US Courts Statistics).
Reorganization (Chapter 11 Bankruptcy)
Reorganization, outlined under codes such as Chapter 11 in the U.S., is designed for insolvent entities seeking to restructure their debts and operations while continuing business activities. This process allows the firm to negotiate with creditors to modify repayment terms, reduce debt burdens, or inject fresh capital. Reorganization aims to restore financial stability, preserving the firm’s value and jobs while maximizing recoveries for creditors. It is a more sustainable alternative to liquidation for viable but financially distressed firms.
Figure 3. Number of Chapter 11 Bankruptcy Filings (2013-2022)
Source: computation by the author (data: US Courts Statistics).
Link between Illiquidity, Solvency, and Bankruptcy Outcomes
The determination of whether an illiquid firm should undergo liquidation or reorganization is heavily influenced by its solvency or insolvency status. These financial characteristics provide a structured framework to allocate resources and protect stakeholder interests, ensuring an efficient resolution process that minimizes economic disruption.
Illiquidity and Insolvent Companies: Liquidation
A firm that is both illiquid (unable to meet its short-term obligations) and insolvent (its liabilities exceed its assets) is in a critical financial position. These firms lack the operational capacity to generate sufficient cash flows and the balance sheet strength to cover their obligations. By selling off assets, the firm can repay creditors in an orderly and legally prioritized manner, thereby closing its operations permanently. Liquidation minimizes further losses and provides a clear exit for stakeholders, ensuring that remaining value is distributed equitably.
From a financial perspective:
Asset Realization: Liquidation involves selling the firm’s assets, converting illiquid assets (e.g., inventory, real estate) into cash to settle liabilities.
Creditor Recovery: Creditors are repaid in a hierarchical order—secured creditors (e.g., bondholders) take precedence, followed by unsecured creditors and equity holders.
Economic Efficiency: Liquidation prevents further erosion of value by discontinuing loss-making operations. The proceeds can be redeployed to more productive uses within the economy.
Example: In high-leverage industries such as retail, where asset values may plummet during financial distress, liquidation can be a pragmatic approach to salvaging any remaining value for stakeholders.
Illiquidity and Solvent Companies: Reorganization
Firms that are illiquid (unable to meet its short-term obligations) but remain solvent (its assets exceed its liabilities) present a different scenario. These companies face temporary liquidity constraints but possess the potential for recovery, given their fundamentally sound financial or economic position. By restructuring debts and operations under judicial supervision, reorganization allows the firm to stabilize its finances, regain liquidity, and continue its business activities. This approach helps preserve jobs, maintain operational continuity, and often results in better recovery for creditors compared to liquidation.
Key financial points include:
Debt Restructuring: The firm negotiates with creditors to extend repayment timelines, reduce interest rates, or convert debt into equity, improving short-term liquidity.
Operational Optimization: Reorganization often involves strategic cost-cutting, asset divestitures, or operational restructuring to enhance cash flow generation.
Stakeholder Value Preservation: By avoiding liquidation, reorganization preserves enterprise value, ensuring better recovery for creditors and protecting equity holders’ stakes.
Long-term Viability: Reorganized firms can often leverage their existing assets and market position to regain profitability, benefiting employees, suppliers, and customers.
Example: Airlines facing temporary cash flow issues during economic downturns often turn to reorganization. By negotiating with lessors, restructuring debt, and optimizing operations, they can avoid liquidation and return to profitability.
An Efficient Bankruptcy Procedure
An efficient bankruptcy procedure should distinguish between these two cases (solvent and insolvent firms), leading illiquid and insolvent firms into liquidation and illiquid but solvent firms into reorganization. This tailored approach ensures that:
Insolvent firms with no viable future are dissolved efficiently, maximizing recoveries for creditors.
Solvent but illiquid firms are given a second chance to reorganize and emerge stronger, preserving value for all stakeholders.
Figure 4. Efficient Bankruptcy Procedure
Such a system not only protects creditors and investors but also fosters economic stability by maintaining productive assets and employment where possible, while swiftly resolving entities that no longer contribute to the economy.
This approach not only maximizes financial efficiency but also aligns with broader economic objectives:
Maximizing Creditor Recovery: Insolvent firms should be liquidated to repay creditors as much as possible, avoiding the dilution of recovery through prolonged unviable operations.
Optimizing Economic Resources: Solvent but illiquid firms should undergo reorganization, preserving their workforce, intellectual property, and market position, which might otherwise be lost in liquidation.
Minimizing Systemic Risk: A clear distinction between liquidation and reorganization reduces uncertainty in financial markets, particularly for industries prone to cyclical liquidity crises.
Why Should I Be Interested in This Post?
This post serves as a comprehensive guide to understanding the critical financial concepts of illiquidity, solvency, and insolvency, while connecting them to practical applications in bankruptcy procedures. Whether you’re a finance student, a professional exploring corporate restructuring, or simply curious about the mechanisms behind bankruptcy codes, this article bridges theoretical knowledge with real-world implications.
By explaining the nuanced relationship between illiquidity and solvency/insolvency, and their impact on choosing between liquidation and reorganization, it offers insights into how firms navigate financial distress. Furthermore, it highlights how an ideal bankruptcy procedure aligns with maximizing economic value and minimizing systemic risks.
In this article, Snehasish CHINARA (ESSEC Business School, Grande Ecole Program – Master in Management, 2022-2025) explores the complexities of Chapter 11 bankruptcy laws in the United States, examining how this legal process impacts businesses facing financial distress. With insights into reorganisation (Chapter 11), this post provides a detailed overview of this chapter’s purpose, process, and strategic implications. By examining the purpose, procedures, and strategic implications of Chapter 11, this post sheds light on how firms navigate debt management and financial recovery.
Bankruptcy Basics
Bankruptcy is often perceived as a last resort for struggling businesses, a measure taken when all other avenues for debt resolution have been exhausted. However, for businesses of all sizes, understanding bankruptcy is crucial—not only as a potential safeguard but as a strategic consideration in financial planning and risk management. This knowledge becomes increasingly important in today’s volatile global economy, where the financial resilience of a business can determine its survival and growth.
Bankruptcy is a legal framework that helps individuals and businesses unable to meet their financial obligations. When a company files for bankruptcy, it either seeks to reorganize its debts and operations or liquidate its assets to repay creditors, depending on the type of bankruptcy pursued (Chapter 7 or Chapter 11 procedures in US bankruptcy law). Bankruptcy can offer a pathway to stability, enabling companies to mitigate debt burdens, restructure, and potentially preserve jobs.
Figure 1. Number of Chapter 11 Bankruptcy Filings (2013-2022)
Source: computation by the author (data: US Courts Statistics).
Legal Definition and Purpose of Chapter 11 Bankruptcy
Chapter 11 bankruptcy, commonly known as “reorganisation bankruptcy,” is a legal mechanism under Title 11 of the United States Code that allows financially distressed businesses to restructure their debts and operations while continuing to function. Unlike Chapter 7, which focuses on liquidation, Chapter 11 aims to preserve the business as a going concern, enabling it to regain profitability while protecting creditors’ interests.
Legal Definition: Chapter 11 provides a structured process through which a debtor proposes a reorganisation plan to address its financial obligations. This plan may involve renegotiating debt terms, selling non-core assets, downsizing operations, or finding new investment capital. The reorganisation plan must be approved by the bankruptcy court and often requires agreement from creditors, ensuring fairness and feasibility.
Purpose: The primary objective of Chapter 11 is to balance two critical goals:
Business Rehabilitation: By allowing the debtor to restructure debts rather than liquidate, Chapter 11 ensures that valuable business operations, jobs, and economic contributions are preserved. This is particularly vital for companies with potential long-term viability but temporary financial challenges.
Creditor Protection: The process safeguards creditor interests by ensuring orderly repayment according to a court-approved priority structure. Secured creditors typically recover from collateral-backed assets, while unsecured creditors negotiate for partial repayment through the reorganisation plan.
Chapter 11 is especially beneficial for medium-to-large corporations that need significant operational restructuring or whose debt structure requires complex renegotiation. The process is overseen by a debtor-in-possession (DIP), meaning the company’s existing management continues to operate the business under court supervision while implementing the reorganization plan. The court’s role ensures transparency, equity, and adherence to legal requirements, protecting all stakeholders throughout the process.
Chapter 11 enables businesses to restructure their debt obligations and operations without halting business activities. This process can offer significant advantages, especially for companies with strong core operations but temporary cash flow or liquidity issues. In 2023, approximately 25% of business bankruptcies filed in the U.S. were Chapter 11 cases, showing its popularity among companies aiming to reorganize rather than liquidate.
Key Objectives of Chapter 11
Debt Relief: Restructure and reduce debt obligations to improve cash flow.
Operational Reorganization: Adjust operations to align better with financial health, often through cost-cutting, downsizing, or strategic pivots.
Business Continuity: Unlike Chapter 7, Chapter 11 allows businesses to continue operations, retain jobs, and maintain relationships with customers and suppliers.
Eligibility and Who Can File:
Chapter 11 is primarily available to corporations, partnerships, and sole proprietorships. However, it is most commonly used by medium to large businesses that have a chance to recover.
For individuals, Chapter 11 is an option if they exceed the debt limits set for Chapter 13, though it is rare in personal bankruptcies due to its complexity and cost.
Common Causes of Business Bankruptcy
Chapter 11 bankruptcy is often a lifeline for businesses facing financial distress but with the potential for recovery through reorganizsation. Unlike Chapter 7, which involves liquidation, Chapter 11 allows companies to address their challenges by restructuring debts and operations. Several factors commonly drive businesses into Chapter 11 bankruptcy, reflecting a combination of internal inefficiencies and external pressures.
One major cause is an excessive debt burden, where businesses accumulate unsustainable liabilities relative to their income. This can become unmanageable during revenue declines or rising interest rates. Similarly, declining revenues caused by market shifts, competition, or external shocks often leave businesses unable to meet financial obligations. Economic downturns and external crises like recessions or global pandemics further exacerbate financial distress. In addition to economic pressures, overexpansion is another common issue. Businesses that grow too quickly without sufficient financial planning can overextend resources. Operational challenges such as inefficiencies or failure to innovate are also critical factors. Companies that fail to adapt to changing markets risk becoming obsolete. Additionally, supply chain disruptions, such as delays or rising costs, can disrupt operations, especially for businesses reliant on just-in-time systems. These issues can significantly strain cash flow and increase financial pressure.
Legal challenges often play a role in driving Chapter 11 filings as well. Large settlements, lawsuits, or regulatory fines can create sudden financial burdens that businesses struggle to manage. Cash flow management is another critical issue. Poor working capital planning can leave businesses unable to cover short-term obligations. Retailers with seasonal sales spikes often struggle during off-peak periods, leading to financial distress. Finally, industry disruption caused by technological advancements or shifting consumer preferences can force businesses into bankruptcy.
Businesses typically face bankruptcy due to a mix of internal and external factors. Key factors include:
Excessive Debt Burden
Cause: High levels of debt relative to income can leave businesses unable to service loans, especially during periods of declining revenue or rising interest rates.
Example: Hertz Corporation filed for Chapter 11 in 2020 with over $5 billion in debt. The pandemic-driven collapse in travel demand exacerbated its inability to meet financial obligations.
Declining Revenues
Cause: Sustained revenue declines due to market changes, competition, or external shocks can reduce a company’s ability to cover operating expenses and debt repayments.
Example: American Airlines filed for Chapter 11 in 2011 due to declining revenues from rising fuel costs and competition, using the process to restructure its debt and cut costs.
Economic Downturns and External Crises
Cause: Recessions, global crises, or industry-specific downturns can severely impact revenues and cash flow, driving businesses into insolvency.
Example: The COVID-19 pandemic led to a wave of Chapter 11 filings in 2020, including companies like JC Penney and Neiman Marcus, which faced plummeting consumer demand during lockdowns.
Overexpansion
Cause: Rapid growth without adequate financial controls or market analysis can stretch resources and leave businesses vulnerable to cash flow problems.
Example: Sbarro, a pizza chain, filed for Chapter 11 in 2011 and again in 2014 after overexpanding into underperforming locations, resulting in significant operational inefficiencies.
Operational Inefficiencies
Cause: Ineffective cost management, outdated business models, or failure to innovate can erode profitability, making it difficult to sustain operations.
Example: Kodak filed for Chapter 11 in 2012 due to its inability to adapt to the digital revolution, which rendered its traditional film business obsolete.
Supply Chain Disruptions
Cause: Delays, shortages, or rising costs in supply chains can disrupt production and increase operating expenses, especially for companies dependent on just-in-time systems.
Example: In 2022, many small-to-medium-sized manufacturers in industries like electronics and automotive struggled with supply chain issues, driving some to seek Chapter 11 protection.
Legal Liabilities
Cause: Large settlements, regulatory fines, or lawsuits can create significant financial burdens that businesses cannot manage without restructuring.
Example: Purdue Pharma filed for Chapter 11 in 2019 as part of a settlement to resolve thousands of lawsuits related to the opioid crisis.
Poor Cash Flow Management
Cause: Failure to manage working capital effectively can lead to cash shortages, making it difficult to pay creditors or fund day-to-day operations.
Example: A mid-sized retailer with strong seasonal sales but poor cash flow planning might file for Chapter 11 to restructure its payment obligations during off-peak periods.
High Fixed Costs
Cause: Businesses with significant fixed costs, such as long-term leases or equipment financing, face challenges when revenues fall, as these costs cannot easily be reduced.
Example: JC Penney faced mounting lease expenses and declining store traffic, ultimately filing for Chapter 11 in 2020 to renegotiate terms and restructure operations.
Industry Disruption
Cause: Technological innovation, shifting consumer preferences, or the entrance of disruptive competitors can weaken traditional business models.
Example: Blockbuster filed for Chapter 11 after streaming services like Netflix and Hulu fundamentally disrupted the home entertainment industry.
Key Steps in a Chapter 11 Filing
Filing the Petition and Automatic Stay
Filing: The Chapter 11 process begins when the debtor files a petition in bankruptcy court. This petition includes comprehensive details about the company’s financial status, such as assets, liabilities, income, expenses, and financial history.
Automatic Stay: The moment the petition is filed, an automatic stay takes effect, immediately halting all collection actions by creditors. This stay provides the company with breathing room to reorganize without the threat of foreclosure or asset seizure. The automatic stay is crucial for companies in Chapter 11, as it allows operations to continue while management restructures.
Development and Approval of the Reorganization Plan
Plan Development: The debtor, acting as a “debtor-in-possession” (DIP), typically retains control over business operations. The company is tasked with drafting a reorganization plan, which outlines how it will repay creditors, restructure operations, and achieve profitability.
Creditor Negotiations: The company works with creditors to gain their support for the reorganization plan. In most cases, the plan must be approved by at least one class of impaired creditors (those not expected to be fully repaid). This approval can involve debt rescheduling, asset sales, or reductions in debt.
Court Approval: Once creditors approve the plan, the bankruptcy court must confirm it. The court assesses whether the plan is feasible, fair, and in the best interests of creditors. This phase can be complex and costly, as it often requires multiple hearings and potential modifications to satisfy all parties.
Execution and Emergence from Bankruptcy
Implementation: After court approval, the company begins implementing the reorganization plan, following all terms outlined to repay creditors over time. Changes may include asset sales, layoffs, new debt issuance, or equity restructuring.
Emergence from Chapter 11: Once the company fulfils the terms of the reorganization plan, it officially exits Chapter 11. This process can take several months to years, depending on the company’s complexity and debt structure. For instance, American Airlines emerged from Chapter 11 after two years of restructuring, merging with US Airways to enhance market competitiveness.
Benefits of Restructuring vs. Liquidation
Preserving Business Value:
Reorganization allows the company to maintain operations, preserving its market presence, assets, and workforce. For example, Hertz used Chapter 11 in 2020 to restructure over $5 billion in debt, allowing it to continue operating and ultimately emerge stronger after the pandemic.
Maximizing Creditor Recoveries:
Creditors are often more willing to negotiate in Chapter 11, as reorganization usually yields better recoveries than liquidation. According to research, Chapter 11 cases result in creditor recoveries averaging 20-25% higher than Chapter 7 cases due to continued asset generation.
Opportunity for Operational Efficiency:
Companies can use Chapter 11 to optimize operations by renegotiating leases, reducing payroll, and streamlining production. These changes help improve financial health and long-term viability.
Risks and Challenges in the Reorganization Process
Cost and Complexity:
Chapter 11 can be extremely costly, especially for larger businesses. Legal fees, administrative expenses, and consulting costs can run into millions. A 2019 study revealed that legal and administrative expenses for large Chapter 11 cases average between $1 million and $10 million. For example, Lehman Brothers’ bankruptcy case, the largest in U.S. history, accrued $2.2 billion in fees over its restructuring period.
Extended Time Frame:
Chapter 11 cases can be lengthy, taking months or even years to complete. This time commitment may strain cash flow and delay recovery, particularly if the business is in a highly competitive industry. In Hertz’s case, the Chapter 11 process lasted 17 months, and the company only emerged after securing additional financing and renegotiating debt terms.
Uncertainty in Creditor Approval:
Creditors must approve the reorganization plan, which can be challenging if there are conflicting interests among different creditor classes. If major creditor groups reject the plan, the court can enforce a “cramdown,” but this is often a contentious and uncertain process.
Risk of Conversion to Chapter 7:
If a reorganization plan fails, or the business cannot achieve sustainable operations, the case may be converted to Chapter 7, leading to liquidation. This outcome results in further losses for stakeholders, as assets are sold off, and the business ceases operations.
Debtor-in-Possession (DIP) Financing: Definition, Purpose, and Relevance in Chapter 11 Filings
Debtor-in-Possession (DIP) financing is a specialized form of funding that allows businesses undergoing Chapter 11 bankruptcy to secure the liquidity needed to continue operations during the reorganization process. The term “debtor-in-possession” refers to the debtor retaining control of its assets and operations while the bankruptcy case is under court supervision. Unlike standard loans, DIP financing is uniquely designed for companies in financial distress and requires court approval to ensure fairness and transparency.
Definition and Features
DIP financing is a post-petition loan that takes precedence over most existing debts, including secured loans, under U.S. bankruptcy law. This super-priority status ensures that DIP lenders are repaid before pre-petition creditors, making the financing attractive even for lenders dealing with financially distressed companies. The terms of DIP financing often include strict covenants, requiring the debtor to adhere to the reorganization plan and meet operational milestones.
Purpose of DIP Financing.
The primary purpose of DIP financing is to provide businesses with the liquidity needed to continue essential operations during the reorganization process. This includes paying employees, suppliers, and other operating expenses. Without this funding, many companies would face operational paralysis, undermining the feasibility of reorganization.
Maintain Operations: Fund day-to-day activities such as payroll, supplier payments, and utility bills to prevent operational shutdown.
Stabilize the Business: Provide working capital to preserve the company’s going-concern value, ensuring it can generate revenue during the restructuring process.
Support Creditor Confidence: By maintaining operations, DIP financing reassures creditors that the debtor is working toward recovery and maximising the value of their claims.
Relevance in Chapter 11 Bankruptcies
DIP financing plays a pivotal role in Chapter 11 filings, bridging the gap between insolvency and reorganization. A business in financial distress often lacks the liquidity to continue operations, which is critical to preserving asset value and employee morale during bankruptcy. Without DIP financing, many companies would be forced to liquidate under Chapter 7, leading to the loss of jobs, assets, and creditor recoveries.
For creditors, DIP financing ensures that the company retains its going-concern value, which typically leads to higher recoveries than a piecemeal liquidation. The court-approved nature of DIP financing also provides a transparent framework for ensuring that new and existing creditors are treated fairly.
Case Study: Hertz Global Holdings – A Successful Chapter 11 Reorganization
Background
Hertz Global Holdings, one of the largest car rental companies in the world, filed for Chapter 11 bankruptcy on May 22, 2020, during the height of the COVID-19 pandemic. Founded in 1918, Hertz operated a fleet of over 700,000 vehicles across 12,000 locations worldwide. Despite its strong market presence, the company faced mounting financial pressures exacerbated by the collapse of global travel during the pandemic.
Causes of Financial Distress
Revenue Collapse: The COVID-19 pandemic caused a dramatic decline in travel demand, with global car rental revenues dropping by nearly 50% in 2020. Hertz’s core business was severely affected, leading to unsustainable losses.
Excessive Debt: Hertz entered the pandemic carrying over $19 billion in total debt, including vehicle leasing obligations. The revenue shortfall made it impossible for the company to service its debt.
Operational Challenges: Hertz struggled with a bloated fleet and high fixed costs. The sudden drop in demand left thousands of vehicles idle, further straining the company’s cash flow.
The Chapter 11 Filing
Hertz filed for Chapter 11 protection to restructure its debts and operations while continuing to operate. The reorganization aimed to address several key issues:
Debt Restructuring: Hertz sought to renegotiate terms with creditors to reduce its debt load and extend repayment periods.
Fleet Optimization: The company planned to sell off a portion of its vehicle inventory to generate cash and align fleet size with demand.
Securing Financing: Hertz needed additional liquidity to sustain operations during the reorganization process.
Key Steps in the Reorganization Process
Debtor-in-Possession (DIP) Financing:
Hertz secured $1.65 billion in DIP financing to fund its operations during bankruptcy. This financing provided the necessary cash flow to continue serving customers and paying employees while restructuring.
Asset Sales:
Hertz sold off approximately 200,000 vehicles from its fleet, generating liquidity and reducing carrying costs. This move also allowed the company to focus on optimizing its remaining assets.
Debt Negotiations:
Hertz renegotiated with creditors to eliminate nearly $5 billion in debt. Creditors received equity and cash payments in exchange, ensuring some recovery while allowing the company to stabilize.
Strategic Investment:
In May 2021, Hertz exited bankruptcy after receiving a $5.9 billion equity injection from a group of institutional investors, including Knighthead Capital and Certares Management. This recapitalization provided a strong financial foundation for the company’s post-bankruptcy growth.
Outcome
Hertz emerged from Chapter 11 on June 30, 2021, as a leaner and more competitive company. The reorganization allowed the company to:
Reduce Debt: Hertz significantly reduced its debt obligations, creating a more sustainable financial structure.
Optimize Operations: The sale of excess vehicles and strategic investments in fleet technology enhanced efficiency.
Leverage New Opportunities: Post-reorganization, Hertz announced plans to invest in electric vehicles (EVs), including a major purchase of 100,000 Teslas in 2021, positioning itself as a leader in the EV rental market.
Impact on Stakeholders
Creditors: Creditors recovered a portion of their investments through equity stakes and cash payments, avoiding the complete loss often associated with liquidation.
Employees: The reorganization preserved thousands of jobs, allowing Hertz to retain its workforce while stabilizing operations.
Customers: Hertz continued serving customers without major disruptions, ensuring the brand’s market presence remained intact.
Investors: The post-bankruptcy equity investment attracted new institutional investors, reflecting confidence in Hertz’s growth potential.
Lessons for Students
Importance of DIP Financing: Securing DIP financing is critical for maintaining operations during reorganization. Hertz’s ability to secure $1.65 billion ensured stability during a turbulent period.
Strategic Asset Management: Selling non-core assets, such as excess fleet vehicles, is a practical way to generate liquidity and reduce costs in Chapter 11 cases.
Investor Confidence: Attracting strategic investors during reorganization can provide not only financial resources but also market credibility.
Adaptability and Innovation: Post-bankruptcy, Hertz’s pivot toward electric vehicles demonstrates the importance of aligning business strategies with future market trends.
Why Should I Be Interested in This Post?
Understanding Chapter 11 bankruptcy is essential for anyone aspiring to excel in business, finance, law, or management. It is not merely a legal process but a strategic tool capable of reshaping businesses, preserving jobs, and driving economic recovery. This post provides an in-depth exploration of its mechanics, real-world applications, and strategic insights, offering immense value to students and professionals alike. By studying Chapter 11, you can gain a deep understanding of corporate reorganization frameworks, enhancing your ability to evaluate restructuring strategies and navigate complex financial scenarios. Expertise in this area is highly sought after in fields such as corporate finance, restructuring consulting, investment banking, and insolvency law, with knowledge of concepts like DIP financing, creditor negotiations, and reorganization plans opening doors to careers in distressed asset investing, turnaround consulting, and credit risk management. Moreover, learning about Chapter 11 develops critical skills in assessing financial health, managing liabilities, and evaluating risk—skills that are vital for credit analysis, equity research, and financial strategy roles. Additionally, with the globalization of business, understanding Chapter 11 principles provides transferable insights into international insolvency frameworks, laying a strong foundation for analyzing and adapting reorganization strategies across jurisdictions.
In this article, Majd MAHRSI (ESSEC Business School, Global BBA Program, 2021-2025) delves into the critical role of governance in fostering sustainable business practices, particularly in emerging economies. Drawing from professional experiences such as an internship at DiliTrust, this article explains how strong governance frameworks can transform businesses and create new career opportunities.
ESG and Its Components
ESG (Environmental, Social, and Governance) is a framework used to evaluate a company’s sustainability practices and ethical commitments. It assesses corporate behavior across three dimensions:
Environmental (E): Focuses on a company’s impact on the environment, including energy use, waste management, and carbon emissions.
Social (S): Examines how a company interacts with its stakeholders, such as employees, customers, and communities, covering diversity, labor rights, and community relations.
Governance (G): Relates to a company’s internal systems for ethical decision-making, leadership accountability, and shareholder rights.
ESG has gained significant traction in recent years, with investors prioritizing companies that integrate sustainability into their core operations. This trend has driven the rise of Socially Responsible Investing (SRI), a strategy where investments are made based on a company’s ESG performance alongside financial returns. According to the Global Sustainable Investment Alliance (GSIA), global SRI assets surpassed $35 trillion in 2022, accounting for nearly 36% of all professionally managed assets. This rapid growth reflects the increasing demand for ethical and sustainable investment options, demonstrating how ESG principles are reshaping financial markets.
Further emphasizing the importance of ESG performance, Friede, Busch, and Bassen (2015) conducted a comprehensive meta-analysis of over 2,000 empirical studies, concluding that approximately 90% of the research found a non-negative relationship between ESG performance and financial performance, with the majority indicating a positive correlation. This underscores the financial benefits of robust governance practices as part of an ESG strategy.
Chart: Below is a graphical representation of the growth of Sustainable and Responsible Investing (SRI) assets in the United States from 1995 to 2018.
Growth of Sustainable and Responsible Investing (SRI) assets
Source: Green America / US SIF Foundation.
Focus on Governance
Governance, the “G” in ESG, refers to the structures, principles, and processes that dictate how a company is controlled and directed. It encompasses:
Board Diversity and Independence: A diverse and independent board ensures balanced decision-making, reducing conflicts of interest.
Shareholder Rights: Empowering shareholders with voting rights and transparent reporting fosters accountability.
Executive Accountability: Ensuring executive compensation aligns with long-term company performance promotes ethical leadership.
Risk Management: Establishing frameworks for identifying and mitigating financial, operational, and ESG-related risks.
Transparency and Reporting: Clear and consistent disclosure of governance practices builds stakeholder trust.
According to Eccles, Ioannou, and Serafeim (2014), companies adopting sustainability policies, including strong governance practices, tend to outperform their peers in both stock market returns and accounting metrics, further emphasizing the financial value of ethical leadership.
Without robust governance, even the strongest environmental and social efforts can falter due to poor oversight and unethical practices.
Why Governance Matters in ESG
Good governance forms the foundation for a company’s long-term sustainability and financial stability. It ensures that leadership decisions align with stakeholder interests and corporate ethics.
Trust and Reputation
Strong governance builds stakeholder trust by promoting ethical decision-making and transparency. Companies with robust governance frameworks are better positioned to manage crises and maintain reputational integrity. In contrast, scandals like Enron and Wirecard have shown how governance failures can lead to significant financial and reputational damage.
Attraction of Investors
Investors increasingly view governance as a critical factor when evaluating a company’s sustainability and risk profile. Firms with strong governance, such as Unilever and Microsoft, consistently outperform peers in financial performance and stakeholder trust. According to a study published on Academia.edu, both companies have demonstrated strong financial performance due to their governance practices.
Key Elements of Strong Governance
The importance of effective governance is further highlighted by the OECD Principles of Corporate Governance, which provide a globally recognized framework for transparent and accountable corporate practices.
Board Diversity and Independence: Diverse and independent boards contribute to better strategic decision-making and accountability. SpringerLink confirms that diversity enhances decision-making quality.
Transparency and Reporting: Transparent reporting builds trust among investors and regulators. AB Academies highlights its importance for investor confidence.
Executive Accountability: Linking executive pay to long-term performance ensures leadership integrity. Research from AB Academies supports the link between performance and pay.
Risk Management: Effective risk management protects against both financial and reputational risks.
Ethical Practices: Implementing anti-corruption measures and maintaining compliance with laws.
Governance in Emerging Economies
In emerging economies, strong governance frameworks play a transformative role in fostering investor confidence and driving sustainable economic growth. Countries like Saudi Arabia, with Vision 2030, and South Africa, with its King IV Code of Governance, have implemented significant reforms emphasizing transparency, accountability, and ethical leadership to attract foreign investment and modernize corporate practices.
Family-owned businesses, prevalent in regions like the Middle East and Africa, often face unique governance challenges. Implementing independent boards and family charters can help professionalize these businesses, ensuring long-term stability.
Leveraging Technology for Governance
Technological tools, such as those provided by DiliTrust, are transforming governance practices. Platforms for secure document management, compliance tracking, and board meeting organization improve transparency and decision-making efficiency. During my internship at DiliTrust, I witnessed firsthand how these tools streamline governance processes, ensuring accountability across various operational levels.
Career Opportunities in Governance
Governance expertise can lead to several impactful career paths:
Independent Board Member: Certifications like those from the ITA in Tunisia equip professionals to serve on corporate boards, ensuring strategic oversight.
Governance Consulting: ESG consulting firms assist businesses in enhancing governance practices, ESG compliance, and sustainability reporting.
ESG Rating Specialist: Working in agencies that assess corporate governance and sustainability standards.
Risk and Compliance Management: Roles focusing on enforcing governance frameworks within financial institutions and multinational corporations.
In this article, Andrea ALOSCARI (ESSEC Business School, Global Bachelor in Business Administration (GBBA) – 2024-2025) explains about three fundamental valuation methods—Comparable Companies Analysis, Precedent Transactions Analysis, and Discounted Cash Flow (DCF) Analysis—and their role in achieving successful deal outcomes.
Which are the main valuation methods?
At the heart of M&A, or Mergers and Acquisitions, stands the concept of valuation, which helps businesses evaluate the idea of expanding or consolidating their position in the market. The estimation of the target company’s implied share price is vitally important both for buyers and sellers and can be conducted with three main valuation methods: Comparable Companies analysis, Precedent Transactions analysis, and Discounted Cash Flow analysis.
Comparable Companies Analysis
The Comparable Companies analysis, colloquially known as “trading comps,” is one of the most common methodologies in M&A valuation. This methodology depends upon the analysis of the target company in comparison to other similar publicly traded companies. The rationale driving this valuation method is simple: a company is valued at a multiple equivalent to that of comparable companies operating in the same industry, same geography and similar financial profiles.
It starts by selecting an industry peer group of companies. Industry, size, geographical location, growth prospects, and profitability usually influence the choice of these groups of companies.
When conducting the valuation of a company, it is necessary to calculate different multiples for the comparable firms and consecutively apply them to the company financials, in order to estimate the value of the target. The most frequently used multiples are Enterprise Value/EBITDA, Price per share/Earnings per share, and Enterprise Value/Revenues.
In specific cases, the analysis can be extended to include industry metrics. For instance, in the case of the telecommunications field, price-per-subscriber metrics may be considered more relevant, while revenue-per-user or annual recurring revenue multiples are more applicable in the case of software companies. Such metrics allow deeper insight, giving a closer approximation for valuation.
While Comparable Companies analysis is market-reflective and easy to apply, there are some limitations. In real life, it is very hard and sometimes impossible to find really comparable companies, especially for niche industries or highly diversified firms. Valuation metrics may also be distorted by recent market volatility and temporary anomalies; therefore analysts need to use judgment when interpreting the results.
Precedent Transactions Analysis
Precedent transaction analysis includes the analysis of past M&A transactions to derive an estimated value of the target company. This technique provides, therefore, an indication of the price that the market has paid in the past, for companies which are similar in some respects.
In carrying out this type of analysis, analysts gather data on transactions similar in nature, deal size, industry and time. Application of the relevant metrics-such as EV/EBITDA and EV/Sales- will subsequently yield a set of valuation multiples. Later on, these are adjusted for synergies, market conditions, and strategic importance, among other factors, to arrive at an estimation of the target company’s value.
The major advantage of Precedent transaction analysis is that this method is derived from actual transaction data, which includes premiums for control and synergies. Despite that, also this methodology has several disadvantages; the historic transactions may not indicate the existing market conditions, and exhaustive data of private deals could be pretty hard to find out. Notwithstanding these disadvantages, this method is one of the main ways to find out the valuation trends in the merger and acquisition market.
Discounted Cash Flow (DCF) Analysis
Discounted Cash Flow Analysis works on a completely different tangent, focusing on the intrinsic value of the company. Whereas both Comparable Company analysis and Precedent Transactions analysis estimate the value of a company based on market comparables, unlike them, DCF estimates a company’s value based on its future expected cash flows. This is useful in cases where the companies have a very different business model or operate in an industry with few comparables.
Essentially, DCF starts off with projecting free cash flows for the target company over some predefined period of projection. These are then discounted back to the present using the firm’s cost of capital, reflecting risks involved in the business. Further, will be necessary to calculate the terminal value of the company, discounting it to the present value and adding it back to the value of the projection period.
The strengths of DCF lie in its flexibility and that it is based on fundamental performance, rather than on market sentiment. However, it is highly sensitive to assumptions like growth rates, discount rates, and terminal value calculations. Even small changes in these inputs may strongly affect the final valuation outcome. It therefore requires analysts to be very strict in justifying their assumptions and testing the robustness of their models via sensitivity analysis.
For example, we can consider a technology start-up with very high growth potential. Analysts would project cash flows considering very rapid revenue increases and very significant reinvestments in technology. In contrast, one would focus on stable cash flows and incremental growth while valuing a mature industrial firm. The DCF model would be flexible enough to accommodate those contexts.
Combining Valuation Techniques
No valuation approach is ideal on its own. Each of the techniques gives a different insight and is hence suited for different situations. For instance, Comparable Company analysis would be perfect in judging the relative value of a company with its peers, whereas Precedent Transactions analysis provides a reality check based on actual market transactions. On the other hand, DCF provides an intrinsic in-depth analysis of the business, independent of the market noise.
In order to provide a more complete assessment, the triangulation approach is increasingly being used by incorporating findings from valuations of different techniques. As an example, in technology industries, Comparable Company analysis might provide a view on how markets valued comparable businesses, DCF might be applied with respect to long-term intellectual property value and growth potentials, Precedent Transactions analysis could help identify synergies from historical deals and therefore complement an otherwise forward-looking DCF approach.
Finally, the values are presented through a football field chart, a type of graph that is particularly helpful in visualizing the results and comparing various approaches to valuation. This chart usually assists stakeholders, but not only, in rapidly identifying overlap and outliers by portraying ranges of value generated from multiple approaches on one horizontal axis.
Example of a DCF valuation
In the following section, you can download an Excel file containing a valuation performed using the discounted cash flow (DCF) method. The file includes all the calculation details, such as projected cash flows, the discount rate applied, and the resulting net present value. Additionally, it contains sheets where various assumptions were made, along with the forecasting of financial statement items.
Example of DCF valuation Source: Personal analysis
In this discounted cash flow (DCF) analysis, the valuation is performed by projecting future free cash flows to the firm (FCFF) over a specified forecast period. Key assumptions, such as revenue growth, cost of goods sold (COGS) percentage, EBITDA margin, depreciation, capital expenditures (CapEx), and changes in net working capital (NWC), are made to forecast the financial statement items.
The projected FCFF values are then discounted using a weighted average cost of capital (WACC) to estimate their present value. A terminal value is calculated at the end of the forecast period, representing the business’s residual value. The total enterprise value is obtained by summing the discounted FCFFs and the discounted terminal value. Lastly, adjustments for net debt and outstanding shares are made to derive the implied equity value and share price.
Additionally, the file includes a sensitivity analysis to show how changes in growth rate and WACC impact the enterprise value.
You can download below the Excel file for valuation.
Why should I be interested in this post?
The following post outlines some of the key valuation techniques in M&A transactions and is hence very useful for finance professionals, students, and anyone interested in the corporate world. This article offers practical tools that help make an appropriate assessment of deal value utilizing methodologies like Comparable Companies Analysis, Precedent Transactions Analysis, and Discounted Cash Flow Analysis.
Whether it is for an investment banking career or an intrinsic desire to understand how things work in corporate finance, it is possible to find some real actionable insight in this article. The combination of a theoretical base with real applications allows the reader to take these concepts into dynamic market environments.