S&P Global Market Intelligence

S&P Global Market Intelligence

Nithisha CHALLA

In this article, Nithisha CHALLA (ESSEC Business School, Grande Ecole Program – Master in Management (MiM), 2021-2024) presents S&P Global Market Intelligence, which provides financial data, news and analytics for the financial community.
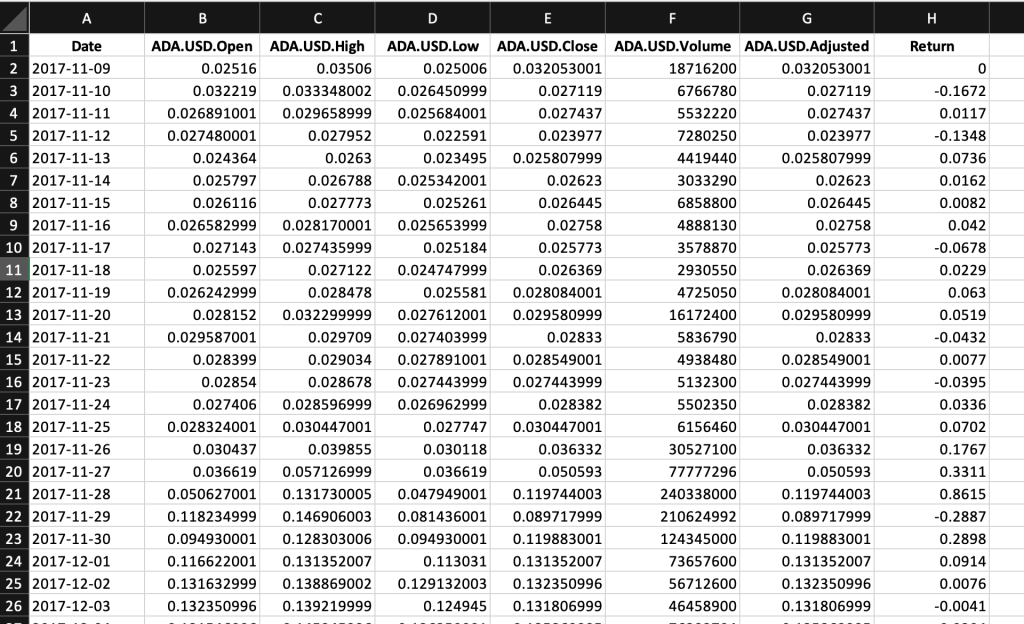
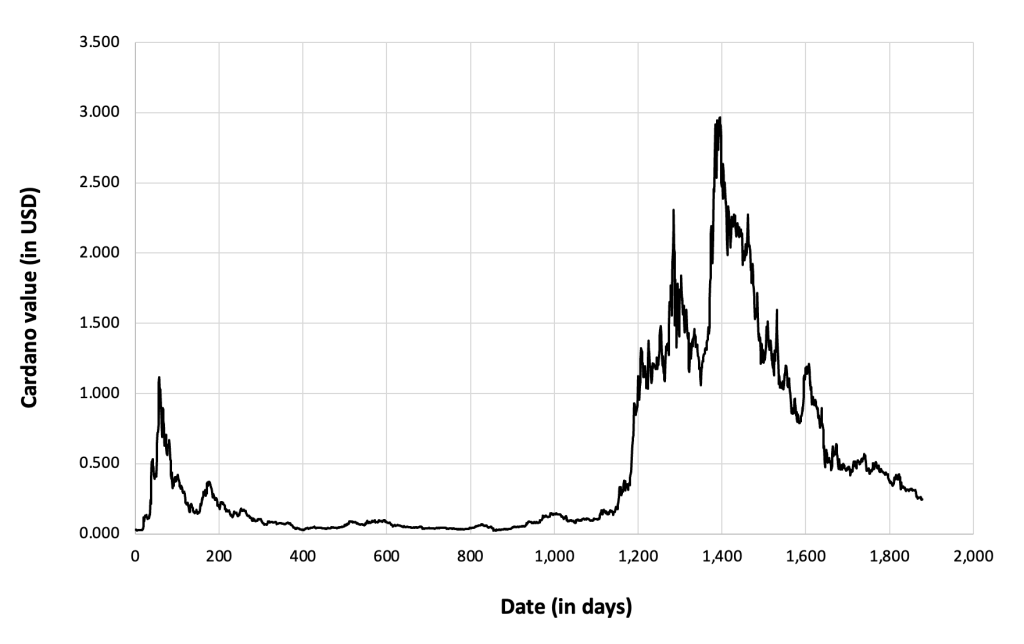
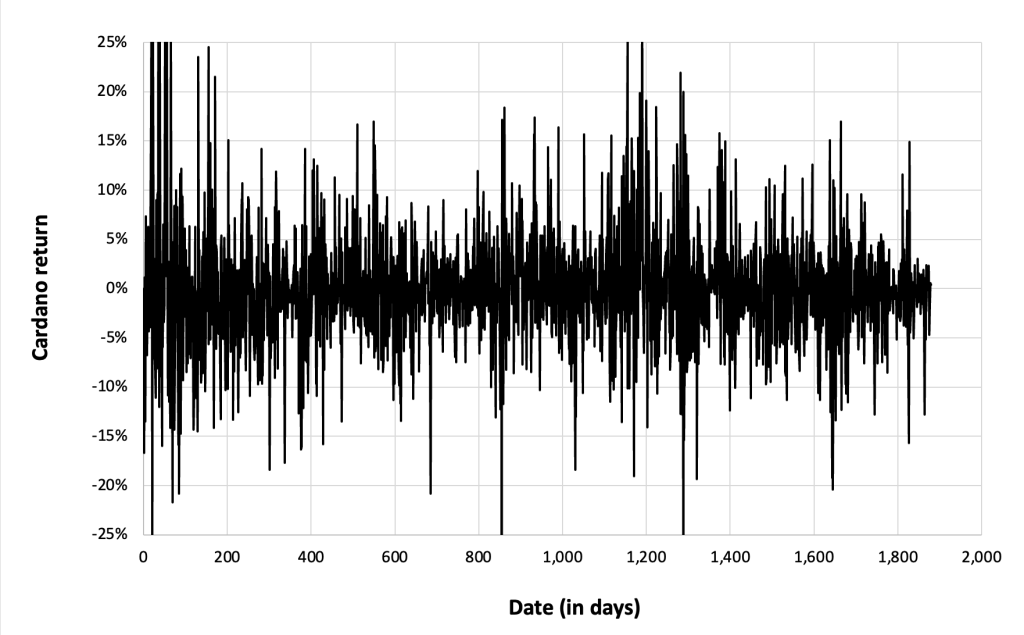
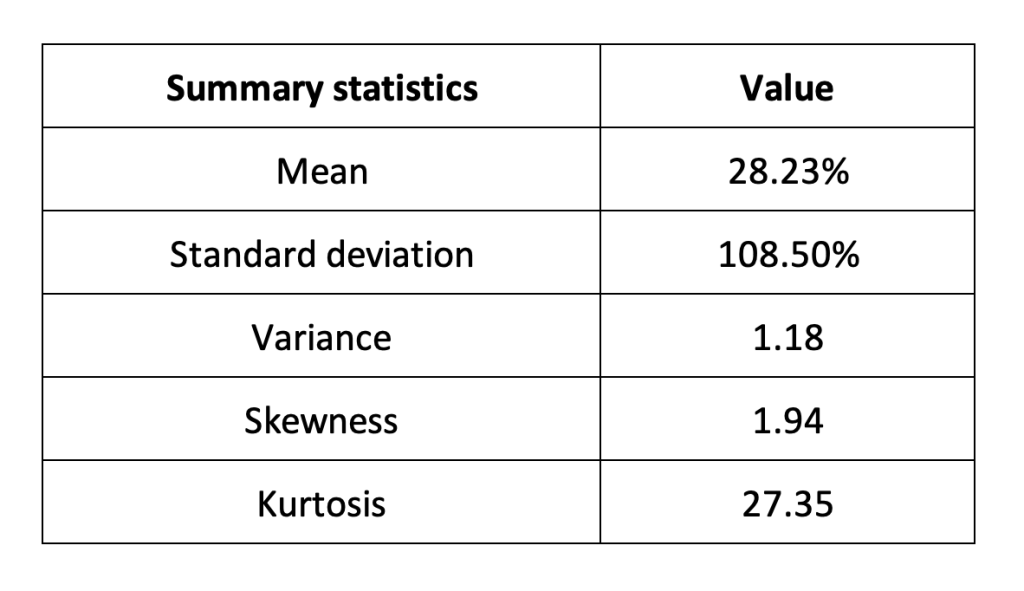
Introduction

S&P company believes that to keep pace with today’s constantly evolving markets, data must be smarter, deeper, and instantly accessible. Their new Market Intelligence platform puts a world of information at the fingertips of market participants, allowing them to make strategic business decisions with conviction, speed, and laser-focused insight.

Logo of S&P Market Intelligence
Logo of S&P Global
Source: S&P Global

History

Standard & Poor’s (S&P) was established in 1860 by Henry Varnum Poor, initially focusing on providing financial data and analysis to investors. The company gained prominence for its pioneering efforts in financial transparency and market insights.

In 1923, Standard & Poor’s introduced the S&P Composite Index, a benchmark index that would later evolve into the iconic S&P 500. This index became a cornerstone of the financial industry, representing the performance of leading U.S. companies.

Throughout the 20th century, Standard & Poor’s expanded its offerings beyond indices, incorporating market intelligence services to provide comprehensive financial data and analytics to institutional investors, analysts, and businesses. In the early 2000s, Standard & Poor’s enhanced its global reach and capabilities through strategic acquisitions and partnerships. This period marked the integration of diverse datasets, analytics, and research services into a unified platform.

In 2016, Standard & Poor’s Financial Services LLC merged with McGraw Hill Financial, forming S&P Global Inc. This merger brought together a diverse portfolio of financial information services under the S&P Global brand. In 2018 they acquired Kensho, whose leading AI and machine learning capabilities drive actionable insights from very complex data.

In 2022, S&P Global and IHS Markit merge, leveraging complementary products to increase customer value and power the markets of the future. Today, S&P Global Market Intelligence remains committed to simplifying financial insights, offering a wide range of products and services that enable users to navigate complex markets with confidence. From earnings estimates to comprehensive coverage of asset classes, S&P Global’s history of innovation and dedication to excellence continues to shape the future of financial technology.

Key Components of S&P Global Market Intelligence

Earnings Estimates

S&P Global Market Intelligence aggregates consensus estimates from financial analysts covering a wide range of industries. Users could easily navigate through the most recent consensus and detailed estimates, revisions, guidance, multiples, surprises, trends, growth rates, and charts for fast and effective estimate tracking.

As of their platform, users seamlessly receive comprehensive global estimates straight into their systems, portals, and business applications through the company’s flexible Data Feed, Cloud, and API Solutions. With S&P Capital IQ Estimates, users can take advantage of historical and real-time consensus estimates, company guidance, analyst coverage, estimate revisions, and more to power their analysis and models.

Direct access and query S&P Capital IQ Estimates via Snowflake eliminates the data ingestion process and improves your productivity and efficiency.

Revenue Projections

S&P Global Market Intelligence delivers revenue projections on both a quarterly and annual basis. This allows investors to track short-term performance and long-term growth trends, offering a complete picture of a company’s revenue trajectory. We can rely on the latest information when we need it. Estimated revisions are updated intraday. Forecasted numbers are presented with point-in-time data.

Revenue projections are available across various sectors and industries, enabling users to conduct sector-specific analyses and comparisons. This helps investors understand industry trends and identify high-growth areas within the market. S&P Global Market Intelligence incorporates macroeconomic indicators into its revenue projections, such as GDP growth, inflation rates, and consumer spending patterns. This holistic approach ensures that revenue forecasts are grounded in broader economic realities.

Forecasts for Key Financial Metrics

Currently S&P Global is working on expanding its industry specific, segment and product level estimates. But its metrics already include general metrics (44), industry specific metrics for oil and gas, banks, insurances and REITs (Real Estate Investment Trust) and Commodity price targets.

Coverage

The S&P Market intelligence platform has a data coverage of over 15,000 banks, 13,257+ global insurance companies, properties across 101 countries with property data going back to 1995, Trucost’s deep environmental performance data on 15,000+ companies around the globe.

S&P Capital IQ Estimates are collected from broker research reports or from estimates feeds provided by the brokers directly. Their estimates data set does not include automated or computer generated estimates. The brokers in their network tend to be institutions and the estimates displayed on S&P Capital IQ Pro are collected from sell-side analyst estimates.

S&P Capital IQ Estimates capture “per share” estimates on the ticker/trading item level. If a user is not seeing all the contributors he/she expect for a company with multiple listings, the company recommends to check under the other listing(s). For example, Sony trades on TSE under 6758 and NYSE under SONY. They reflect the different estimates from analysts for the two trading items respectively. There is more estimates coverage for TSE:6758 compared to NYSE:SONY. The user may be looking at NYSE:SONY but expecting TSE:6758 coverage.

Period

The S&P Market intelligence historical data dates back to 1997 internationally and 1999 specifically for North American companies. The length of history varies based on metric.

Frequency

Their Data Feed Solution, Xpressfeed, paired with their proprietary loader technology, automates the download and management of data packages and enables delivery at any frequency.

The typical turnaround time is 2 hours for estimates (earnings, revenues, etc.), 1 hour for headlines, and 3 hours for guidance. For other vendors, the typical turnaround time is 24 hours, 12 hours and 12 hours (resepectively). This is one of the main qualities that differentiate S&P from other vendors.

Firms and Financial analysts

In a complicated world where one event triggers challenges for seemingly unrelated industries, S&P Global experts can provide market participants in-depth insights into the intersection of topics such as economics, shipping, automotive, commodities trading, oil and gas, financials, sustainability and more. S&P Global Market Intelligence provides high-quality industry data, financial data, news, analysis, and research to its client investors based on the client’s portfolio. Its clients include universities, corporations, government agencies, and investment professionals.

Pricing

Pricing depends on the scope of the usage regarding the following input factors:

  • Departments to be licensed (accessing the data)
  • Regions/locations that will have access to the data
  • Number of users that will have access to the data
  • Also for API / Datafeed solutions there are separate pricing guidelines, which depend on the amount of data items to be retrieved. This would need to be discussed with the business unit itself.

    Use of S&P Global Market Intelligence by the Financial Community

    Benchmark for Analysis

    S&P Global Market Intelligence provides a vast array of financial metrics, including revenue, earnings, profit margins, and other key financial indicators. The platform offers tailored data for specific industries, enabling precise comparisons within sectors. This helps in understanding industry norms and identifying outliers. For instance, companies can benchmark their financial performance against the top players in their industry to identify strengths and weaknesses.

    Market Expectations

    S&P Global Market Intelligence plays a pivotal role in shaping and understanding market expectations. By aggregating analysts’ forecasts and market data, the platform helps users gauge investor sentiment and market trends. Key applications include Consensus Estimates, Market Sentiment Analysis and Trend Identification.

    Earnings Season Preparation

    During earnings season, S&P Global Market Intelligence is indispensable for preparation and analysis. Financial professionals use the platform to access earnings forecasts, historical performance data, and company reports, enabling them to anticipate results, post-earnings analysis and investor communications.

    S&P Global Market Intelligence and Tests of Market Efficiency

    Academic works

    S&P fosters experiential learning with sustainability data and research that offer comprehensive data coverage, robust data linking, and flexible data delivery in the finance lab, student investment fund, research competition, and more. The platform also aids in identifying and analyzing market anomalies, contributing to the academic discourse on market efficiency. Researchers perform event studies to analyze how markets react to new information, such as earnings announcements or economic data releases.

    Information Dissemination

    S&P Global Market Intelligence excels in the rapid dissemination of financial information, ensuring that market participants have access to timely and accurate data. Real-time data, Custom Alerts and Comprehensive Coverage provided by the platform make it much easier to disseminate the information.

    Pros and Cons

    S&P Global Market Intelligence platform analysis helps investors evaluate the effectiveness of investment strategies and identify sources of outperformance or underperformance. It provides powerful analytical tools, real-time updates and comprehensive data.

    On the other side, S&P Global Market Intelligence platform subscription costs can be high, potentially limiting access for smaller firms or individual investors. And the depth of information and tools available may require a learning curve for new users.

    Conclusion

    S&P Global Market Intelligence is a vital resource for the financial community, providing essential data, insights, and tools that support a wide range of financial activities. From benchmarking and market analysis to earnings season preparation and academic research, the platform empowers financial professionals to make informed decisions and stay ahead in a dynamic market environment.

    Why should I be interested in this post?

    Understanding how financial professionals use platforms like S&P Global Market Intelligence can contribute to your professional development, especially if you’re pursuing a career in finance, investment management, or financial advising. It demonstrates your interest in industry trends and best practices.

    Related posts on the SimTrade blog

       ▶ Aamey MEHTA Market efficiency: the case study of Yes bank in India

       ▶ Louis DETALLE The importance of data in finance

       ▶ Bijal GANDHI Earnings per share

    Useful resources

    S&P Global The Market Intelligence Platform

    Wikipedia S&P Global

    S&P Global Estimates

    S&P Global Data into insights

    S&P Global Coverage and analytics

    About the author

    The article was written in May 2024 by Nithisha CHALLA (ESSEC Business School, Grande Ecole Program – Master in Management (MiM), 2021-2024).

    Zacks Investment Research

    Zacks Investment Research

    Nithisha CHALLA

    In this article, Nithisha CHALLA (ESSEC Business School, Grande Ecole Program – Master in Management (MiM), 2021-2024) presents Zacks Investment Research, which provides financial data, news and analytics for the financial community.

    Introduction

    Zacks Investment Research (ZIR) is a prominent financial services company known for its stock research, analysis, and investment tools. Zacks is best known for its proprietary Zacks Rank stock-rating system, which uses earnings estimate revisions to identify stocks that are assured to outperform the market. This system, along with a wide array of financial tools and resources, has made Zacks a trusted name among individual investors, financial advisors, and institutional investors alike.

    Logo of Zacks Investment Research
    Logo of Zacks Investment Research
    Source: Zacks Investment Research

    History

    Zacks Investment Research has a rich history that began in 1978 when it was founded by Len Zacks, a Ph.D. in mathematics from MIT. Len Zacks was driven by a pioneering idea that earnings estimate revisions are the most powerful force impacting stock prices. His vision was to develop a research methodology and tools that leverage this insight to help investors make better investment decisions.

    In 1978, Len Zacks founded Zacks Investment Research with a focus on earnings revisions. His research suggested that changes in analysts’ earnings estimates had a significant impact on stock prices, and he aimed to harness this insight to create a predictive stock-rating system.

    In 1981, Zacks developed the Zacks Rank, a proprietary quantitative model that ranks stocks based on changes in analysts’ earnings estimates. It became the cornerstone of the company’s product offerings, known for its ability to identify stocks likely to outperform the market. In 1986, The Zacks Rank system was made available to institutional investors. It gained credibility and popularity due to its consistent performance in predicting stock price movements.

    In 1992, Zacks Investment Research expanded its offerings to individual investors. In 1996, The company launched its website, Zacks.com, making its research and stock ratings accessible to a broader audience.

    In 2002, Zacks introduced its mutual fund ranking system, applying its earnings revision methodology to mutual funds. This allowed investors to identify funds with strong earnings potential. In 2004, The company expanded its research offerings to include ETF (Exchange-Traded Fund) ratings and analysis, catering to the growing interest in ETF investing.

    In 2015, Zacks Investment Research expanded its institutional services, offering advanced analytics, data feeds, and customized research solutions for hedge funds, asset managers, and financial institutions.

    In 2023, Zacks Investment Research still remains a leading provider of financial research, known for its robust stock ranking system, comprehensive research reports, and a wide range of tools that help investors make informed decisions.

    Key Components of Zacks Investment Research

    Earnings Estimates

    Zacks’ early contribution to investment analysis was the discovery that Earnings Per Share (EPS) estimate revisions are the most powerful force affecting stock prices. This discovery gave birth to the Zacks Indicator which, along with being the first to calculate consensus EPS estimates of quarterly earnings and to create the concept of EPS surprises, as well as the first to analyze price response to EPS surprises placed Zacks among the top innovating pioneers in the investment industry.

    Zacks gathers earnings estimates from a wide range of sources like Wall Street Analysts, Company Reports, and Economic Indicators. Earnings estimates play a crucial role in the proprietary Zacks Rank system, which ranks stocks from top 5 strong buys to strong sells. The Zacks Rank system leverages these revisions to identify stocks that are likely to outperform or underperform the market.

    Earnings estimates are a foundational element of the Zacks Rank system. The Zacks Rank is a proprietary stock rating model that uses changes in earnings estimates to rank stocks.

    Model portfolio

    The Zacks Investment Committee has maintained a model portfolio since 1996. This portfolio called the Zacks Focus List, is designed for long-term investors and reflects the opinions of Zacks Director of Research Mr. Sheraz Mian. It is published weekly and will list any additions or deletions to the portfolio from the previous week.

    Zacks Chief Equity Strategist, John Blank PhD., publishes this monthly report that provides the Zacks forecasts for all major asset classes and the details of Zacks outlook. This report is derived from several resources to come up with individual asset class forecasts.

    Forecasts for Key Financial Metrics

    In the early 1990s, Zacks developed consensus estimates of other key investment metrics such as brokerage analyst stock ratings, forecasts of future sales, and target prices. More recently, Zacks have expanded again the set of items for which they calculate consensus estimates to include many of the line items and ratios that can be determined from income statements such as ROE, Margins, Net Income, etc.

    The Zacks Fundamental database includes 260 operational metric items covering over 900 companies in 32 different industries. The history of the metrics items goes back to 2003. For more details on the operational metrics, download the overview document below.

    Coverage

    In 1981, Zacks began processing, organizing, and evaluating research produced by US brokerage firms. Today Zacks receives daily electronic data feeds and printed research reports on over 8,500 North American publicly traded companies from over 185 brokerage firms, produced by more than 3,200 analysts amounting to over 500,000 pages of brokerage research. Zacks’s extensive data sets give you access to over 25 years of data history on over 16,000 active and inactive US and Canadian equities.

    In addition, ZIR records 25,000 earnings estimate revisions and changes in broker recommendations weekly. This information is made available through institutional and non-institutional product lines and websites such as MSN MoneyCentral, Quicken.com, Bloomberg.com, and FoxBusiness.com, as well as our websites.

    On the whole it covers 6,000 US companies, plus 550 non-US companies traded as ADRs on US exchanges from 35 foreign countries, plus 200 Canadian companies trading on US exchanges.

    Period

    Zacks began in 1978 collecting the individual EPS estimates for over 4,400 US and Canadian companies made by 3,000 analysts employed by 180 US brokerage firms.

    Frequency

    Zacks maintains a history of annual EPS estimates going back to 1979 and quarterly estimates going back to 1982. Zacks consensus ratings history goes back to 1985. Consensus Sales estimates and Price Targets are maintained back to 2000.

    Sales Estimates – 2000 to Present – Monthly, Weekly, Daily Frequency.

    Price Targets – 2000 to Present – Monthly, Weekly, Daily Frequency

    Zacks data is accessible through raw data feeds for both history files and updates, as hosted web pages that can be framed into finance-oriented websites, as APIs in XML or JSON format, and through partners providing on-demand data-as-a-service (DaaS) platforms.

    Firms and Financial analysts

    For the 3,800 largest companies Zacks provides over 500 fields of annual standardized data from 2001 forward, and 87 fields from 1979 to 2001. For the 2,800 smaller companies and ADRs, ZIR provide 87 fields of annual standardized data from 1979 to the present.

    Zacks employs a rigorous quality control process to make sure all data points are recorded accurately. For each company, a trained analyst enters the data from SEC filings, which is then double-checked by a senior analyst. Once the data is entered, a senior analyst signs off on final completion after reviewing all the data. In addition, the data is subjected to a battery of automated checks to verify balancing relationships and correct errors. All data items are reviewed by multiple sets of trained eyes as well as automated computer checks.

    Pricing

    There are several types of pricing offered by Zacks Investment Research namely Zacks premium, Zacks Investor Collection, Zacks Ultimate.

    Zacks Premium features daily updates of the Zacks Rank, full access to the Zacks #1 Rank List, Equity Research Reports, Focus List portfolio of 50 longer-term stocks, Premium screens and much more. The subscription fee for this per year is $249.

    Zacks Investor Collection is a bundle of top subscription services for long-term investors. Customers can access to all of the real-time buy and sell signals from all of Zacks long-term investor portfolios, including the exclusive stocks under the $10 strategy which isn’t available to the general public. Customers can also get full access to all the premium research tools and reports for finding winning stocks, ETFs, and mutual funds. For this program they give access to all the data for $1 in the first 30 days and later prices at $59 per month and $495 per year.

    Zacks Ultimate program gives customers access to Zacks’ market insights and the most private picks from Zacks portfolio recommendation services for only $1 in the first 30 days and later they price at $299 per month or $2,995 per year.

    Use of Zacks Investment Research by the Financial Community

    Benchmark for Analysis

    Financial professionals often use Zacks Investment Research as a benchmark for analyzing stocks and making investment decisions. The company’s data and analytical tools provide a reliable foundation for comparative analysis. Investors use the Zacks Rank system to screen for stocks that are expected to outperform the market based on earnings estimate revisions.

    According to the company website, it states that “The Zacks Mutual Fund Rank is a rating system that will help you find the best mutual funds to outperform the market. Use the Zacks Mutual Fund Rank to evaluate your current funds, find better funds, and track your funds. In addition, you can follow top-ranked funds featured in daily articles from Zacks’ team of analysts.” which shows how an investor can use their analyses as a benchmark.

    Market Expectations

    Zacks aggregates earnings estimates from multiple analysts to form a consensus estimate. By monitoring changes in earnings estimates, investors can understand shifts in market sentiment and expectations. Upward revisions typically indicate positive market sentiment, while downward revisions may signal potential concerns.

    Zacks tracks earnings surprises, which occur when actual earnings differ significantly from consensus estimates. These surprises can lead to significant market movements and are closely watched by investors.

    Earnings Season Preparation

    Before earnings announcements, Zacks offers previews that include analysts’ expectations, historical earnings performance, and key factors to watch. After earnings reports are released, Zacks provides detailed analyses comparing actual results to estimates, offering insights into the implications for the company’s stock price and future performance.

    Zacks Investment Research and Tests of Market Efficiency

    Academic works

    Zacks Investment Research is a valuable resource for academic researchers studying market efficiency and other financial theories. Researchers analyze how markets react to earnings announcements and other significant events, using Zacks’ data to test hypotheses about market efficiency.

    Information Dissemination

    Zacks Investment Research excels in providing up-to-date data and insights to its users. Zacks provides real-time updates on earnings estimates, stock ratings, and market news. Users can set up custom alerts for specific stocks or market events.

    Zacks research and data are accessible through various platforms, including its website, mobile apps, and third-party financial services, making it easy for users to stay informed.

    Pros and Cons

    The Zacks Rank system and earnings estimates are known for their accuracy in predicting stock performance. Zacks offers extensive and detailed financial data, covering a wide range of companies and metrics.

    On the other side, Zacks’ premium services can be expensive, potentially limiting access for smaller firms or individual investors. And the depth of information and tools available may require a learning curve for new users.

    Conclusion

    Zacks offers a wealth of data and analysis that helps in making informed investment decisions. By focusing on earnings estimates and revisions, Zacks helps investors predict stock performance more accurately. The user-friendly tools and real-time updates make it accessible for both beginners and experienced investors.

    Why should I be interested in this post?

    For management students, understanding and utilizing tools like Zacks Investment Research can provide a significant edge in the financial world. Learning to use such resources effectively can enhance our analytical skills and prepare us for a successful career in finance and investment management.

    Related posts on the SimTrade blog

       ▶ Aamey MEHTA Market efficiency: the case study of Yes bank in India

       ▶ Louis DETALLE The importance of data in finance

       ▶ Bijal GANDHI Earnings per share

    Useful resources

    Zacks Investment Research Zacks Fundamental Data – Company Profile and Financial Statement Data

    Zacks Investment Research Our Research. Your Success.

    Fidelity Research Firm: Zacks Investment Research

    Zacks Investment Research Find the Service That’s Right For You

    Zacks Investment Research Zacks Mutual Fund Rank

    About the author

    The article was written in May 2024 by Nithisha CHALLA (ESSEC Business School, Grande Ecole Program – Master in Management (MiM), 2021-2024).

    My experience as a Quantitative Investment Intern in Fortune Sg Fund Management

    My experience as a Quantitative Investment Intern in Fortune Sg Fund Management

    Ziqian ZONG

    In this article, Ziqian ZONG (ESSEC Business School, Global BBA exchange, 2024) shares her professional experience as a Quantitative Investment Intern in Fortune Sg Fund Management.

    About the company

    Fortune Sg Fund Management is a leading mutual fund management company with over 300 billion RMB in assets under management as of 2023. The company was founded in 2003 as a joint venture between Baosteel Group and Société Générale and has since grown to become a significant player in the Chinese market.

    Fortune Sg leverages the capital markets to provide comprehensive asset management solutions for a wide range of domestic and international investors through professional operations. The company upholds the principle of prioritizing client interests, striving to be a responsible and trustworthy firm worthy of long-term commitment from all parties involved.

    Logo of Fortune Sg
    Logo of Fortune Sg
    Source: Fortune Sg.

    My internship

    I joined the Quantitative Investment Department as an intern. This department primarily employs a multi-factor approach to select high-quality stocks in the Chinese stock market. The main products offered by this department are fundamental quantitative fund and quantitative hedging fund.

    My missions

    During my internship, I assisted the team with various programming and data analysis tasks. Furthermore, I undertook independent research project, including tracking the latest global trends in active quantitative funds and factor models, as well as developing a factor rotation-based index enhancement strategy.

    Required skills and knowledge

    The role requires advanced programming skills, primarily using Python and SQL. Proficiency in these languages is essential for improving work efficiency. Additionally, due to the rapid development of quantitative finance, it is necessary to read the literature to stay updated on the latest trends and investment methods. Sometimes, programming and searching for effective alpha (the excess return on an investment relative to the return of a benchmark index) can be tedious tasks that require persistent patience and confidence.

    What I learned

    During my internship, I gained extensive knowledge about factor investing and practical investment strategies. The integration of fundamental analysis with quantitative investment methods significantly enhanced the efficiency of traditional research. My research on factor timing allowed me to combine macroeconomic factors with market style shifts, using data to generate insights.

    Financial concepts related my internship

    Factor Investing

    Factor investing is an investment strategy that utilizes certain quantifiable characteristics or attributes, known as “factors,” to explain and predict the risk and return performance of assets. These factors help investors better understand the behavior of the market and individual assets, leading to the construction of more effective investment portfolios.

    The basic principle of factor investing is that certain factors have historically demonstrated a strong ability to explain and predict asset returns. By identifying and exploiting these factors, investors can achieve excess returns (known as “alpha”).

    Common factors include:

    • Value Factor: Selecting stocks with low valuations, such as low price-to-earnings (P/E) or price-to-book (P/B) ratios.
    • Momentum Factor: Selecting stocks that have recently exhibited strong performance, under the assumption that this performance will continue.
    • Size Factor : Selecting small-cap stocks, which historically have outperformed large-cap stocks.
    • Quality Factor: Selecting stocks with strong financial health and high profitability.
    • Minimum Volatility Factor: Selecting stocks with lower volatility, which tend to perform better during periods of market uncertainty.
    • Growth Factor: Selecting stocks with high growth potential, such as companies with rapidly growing revenues and earnings.

    Factor timing

    Factor timing is an investment strategy that involves adjusting the exposure to different factors in a portfolio based on changing market conditions and macroeconomic cycles. The idea is to dynamically allocate capital to factors that are expected to perform well in the current or upcoming economic environment while reducing exposure to factors that are likely to underperform.

    Here is how I do factor timing:

    • Economic and Market Analysis: Investors analyze macroeconomic indicators, market trends, and other relevant data to understand the current and projected state of the economy. This analysis helps in identifying which factors are likely to perform well in different economic conditions.
    • Factor Selection and Weighting: Based on the economic and market analysis, select which factors to emphasize in their portfolio. During Economic Expansion: Momentum and growth factors perform well because companies with strong recent performance and high growth potential are likely to continue thriving. During Economic Contraction: Quality and low volatility factors may be favored because companies with strong financial health and stable earnings are more resilient in downturns.
    • Dynamic Adjustment: Continually monitor economic indicators and market conditions to adjust the portfolio’s factor exposures.

    Why should I be interested in this post?

    With the advancement of computer technology and the increase in alternative data, quantitative finance is occupying an increasingly larger share in investments. Understanding related content can provide valuable advantages and aid in making informed decisions when purchasing quantitative-related products.

    Related posts on the SimTrade blog

       ▶ All posts about Professional experiences

       ▶ Youssef LOURAOUI Factor Investing

       ▶ Praduman AGRAWAL My Professional Experience as a Quantitative Analyst Intern at Findoc Financial Services

    Jayati WALIA Programming Languages for Quants

    Useful resources

    Fortune SG fund management

    The most classic factor model: Fama French factor model

    About the author

    The article was written in May 2024 by Ziqian ZONG (ESSEC Business School, Global BBA exchange, 2024).

    Tron: Unveiling the Future of Decentralized Applications

     Snehasish CHINARA

    In this article, Snehasish CHINARA (ESSEC Business School, Grande Ecole Program – Master in Management, 2022-2024) explains the innovative world of Tron cryptocurrency, shedding light on its role in the evolution of decentralized applications and the broader blockchain ecosystem.

    Historical context and background

    Tron (TRX) was founded by Justin Sun in 2017, aiming to revolutionize the entertainment industry and decentralize the internet. The project’s initial coin offering (ICO) raised approximately $70 million, showcasing significant investor interest. Tron was designed as a decentralized platform to support smart contracts and high-throughput applications, providing an infrastructure that could handle a large volume of transactions efficiently.

    Initially, Tron was launched as an ERC-20 token on the Ethereum blockchain. This allowed Tron to leverage Ethereum’s robust development community and infrastructure while developing its own blockchain. On June 25, 2018, Tron completed its mainnet launch, migrating from the Ethereum network to its proprietary blockchain, known as Odyssey. This transition marked Tron’s independence and its capability to support decentralized applications (dApps) natively.

    The Tron ecosystem has expanded rapidly, integrating various blockchain-based projects and applications. In July 2018, Tron acquired BitTorrent, a popular peer-to-peer file-sharing protocol, further expanding its reach and application base. This acquisition was significant as it integrated BitTorrent’s extensive user base with Tron’s blockchain technology, exemplifying Tron’s vision of a decentralized internet.

    Moreover, Tron’s commitment to fostering a decentralized web extends to its support for decentralized finance (DeFi). By providing a robust platform for creating and deploying decentralized applications, Tron has positioned itself as a key player in the DeFi space, enabling applications such as JustSwap, a decentralized exchange, and various other lending and borrowing platforms.

    Tron Logo

    This image has an empty alt attribute; its file name is img_Tron_Logo.jpg

    Source: Tron.

    Figure 1. Key Dates in Tron History

    Source: Yahoo! Finance.

    Key features

      Delegated Proof of Stake (DPoS) Consensus Mechanism

      Tron’s blockchain utilizes the DPoS consensus algorithm, which enhances scalability and transaction speed. In this system, TRX holders vote for super representatives (SRs) who are responsible for validating transactions and securing the network. This method is more energy-efficient and faster compared to traditional Proof of Work (PoW) systems.

      High Throughput and Scalability

      Tron’s network is capable of processing up to 2,000 transactions per second (TPS), significantly higher than Bitcoin and Ethereum. This high throughput makes Tron suitable for a wide range of decentralized applications (dApps) that require rapid and efficient transaction processing.

      Low Transaction Fees

      Transaction fees on the Tron network are minimal, making it an attractive platform for developers and users alike. This cost-efficiency is crucial for microtransactions and frequent trading activities, which are common in decentralized finance (DeFi) applications.

      Smart Contracts and dApps

      Tron supports the development and deployment of smart contracts and decentralized applications. The Tron Virtual Machine (TVM) is fully compatible with the Ethereum Virtual Machine (EVM), enabling developers to easily port their Ethereum-based dApps to Tron. This compatibility fosters a rich ecosystem of decentralized applications across various sectors.

      TRC-20 and TRC-721 Tokens

      Tron offers its own standards for tokens: TRC-20 for fungible tokens and TRC-721 for non-fungible tokens (NFTs). These standards are similar to Ethereum’s ERC-20 and ERC-721, respectively, allowing developers to create and manage a wide range of digital assets on the Tron network.

      Decentralized Storage

      Tron aims to decentralize the internet, and part of this vision includes decentralized storage solutions. By integrating BitTorrent technology, Tron provides a decentralized file sharing and storage system, enhancing data privacy and security.

      Rich Developer Resources

      Tron offers extensive resources for developers, including comprehensive documentation, development tools, and support programs. This robust support infrastructure encourages innovation and development within the Tron ecosystem.

    Use cases

      Decentralized Apps (dApps)

      Tron is designed to support dApps across multiple sectors. These applications benefit from Tron’s high throughput and low transaction fees, making them more efficient and cost-effective. Popular dApps on Tron include games, social media platforms, and financial services.

      Decentralized Finance (DeFi)

      Tron has become a significant player in the DeFi space, providing infrastructure for decentralized exchanges (DEXs), lending platforms, and stablecoins. JustSwap, Tron’s decentralized exchange, allows users to trade TRC-20 tokens without intermediaries. Additionally, platforms like JUST provide decentralized lending and borrowing services.

      Digital Content and Entertainment

      Tron’s primary mission is to decentralize the internet, particularly the digital content and entertainment industry. Platforms like TRON TV and BitTorrent integrate with Tron to offer decentralized content distribution, allowing content creators to share their work directly with consumers without intermediaries, ensuring fairer revenue distribution.

      Supply Chain Management

      Tron can be used to enhance transparency and traceability in supply chain management. By recording transactions and product movements on the blockchain, companies can ensure authenticity and reduce fraud. This use case is particularly relevant for industries like pharmaceuticals, food, and luxury goods.

      Gaming

      Tron’s blockchain supports various blockchain-based games that leverage the benefits of decentralized infrastructure. These games offer players true ownership of in-game assets, transparent reward systems, and the ability to trade items outside the game environment. Titles like WINk and others on the Tron platform showcase the potential for blockchain in gaming.

      Voting and Governance

      Tron’s DPoS consensus mechanism is an example of blockchain-based voting and governance in action. The Tron community votes for super representatives who validate transactions and make governance decisions. This model can be applied to other voting systems, including corporate governance, municipal voting, and organizational decision-making processes.

      Data Storage and Sharing

      Integrating BitTorrent with Tron provides a decentralized solution for data storage and sharing. This system allows users to store and share files securely without relying on centralized servers, enhancing privacy and reducing the risk of data breaches.

    Technology and underlying blockchain

    The Tron blockchain is a high-performance, decentralized platform designed to support a vast array of decentralized applications (dApps) and smart contracts. At its core, Tron utilizes a Delegated Proof of Stake (DPoS) consensus mechanism, which enhances transaction throughput and network scalability. DPoS involves TRX holders voting for super representatives (SRs) who are responsible for validating transactions and maintaining the blockchain, ensuring efficient and democratic governance. Tron’s architecture includes the Tron Virtual Machine (TVM), which is fully compatible with the Ethereum Virtual Machine (EVM). This compatibility enables seamless migration of dApps from Ethereum to Tron, fostering cross-chain interoperability. Tron’s blockchain can process up to 2,000 transactions per second (TPS), significantly outpacing many other blockchain networks, making it suitable for applications requiring high transaction volumes. Additionally, Tron supports the creation of custom tokens through its TRC-20 and TRC-721 standards, analogous to Ethereum’s ERC-20 and ERC-721, facilitating the development of fungible tokens and non-fungible tokens (NFTs). This robust infrastructure, combined with low transaction fees, makes Tron an attractive platform for developers and enterprises looking to build decentralized solutions.

    Supply of coins

    Tron (TRX) operates with a total maximum supply of 100 billion tokens. At its inception, Tron’s token allocation included 40% for initial token sale, 15% for the Tron Foundation, 35% for private placements, and 10% for the team. Over time, Tron’s supply distribution has undergone changes due to various factors such as token burns, airdrops, and network upgrades. Notably, Tron has implemented periodic token burns to reduce the circulating supply and increase scarcity, thereby potentially driving up the value of TRX. Additionally, the Tron Foundation periodically releases tokens from its allocated supply for ecosystem development, partnerships, and other strategic initiatives aimed at fostering the growth of the Tron network. Overall, Tron’s coin supply dynamics are managed with a focus on maintaining balance between liquidity, scarcity, and ecosystem development to support the long-term sustainability and adoption of the Tron blockchain.

    Historical data for TRX (Tron)

    How to get the data?

    Tron is a popular cryptocurrency on the market, and historical data for the Tron such as prices and volume traded can be easily downloaded from the internet sources such as Yahoo! Finance, Blockchain.com & CoinMarketCap. For example, you can download data for Tron on Yahoo! Finance (the Yahoo! code for Tron is TRX-USD).How to get the data?

    Figure 2. Tron data

    Source: Yahoo! Finance.

    Historical data for the TRX (Tron) market prices

    TRX (Tron) has experienced a dynamic evolution in its market prices since its inception in 2017. Initially introduced at a fraction of a cent, TRX quickly gained attention within the cryptocurrency community due to its ambitious vision and promising technology. The early months saw considerable volatility, with TRX experiencing rapid price fluctuations amid speculation and market sentiment. As Tron’s ecosystem matured and adoption grew, its market prices reflected both the broader trends in the cryptocurrency market and Tron-specific developments. Notable milestones, such as mainnet launches, strategic partnerships, and ecosystem expansions, often correlated with significant price movements. Despite periods of volatility, Tron’s market prices have shown resilience and a tendency to recover from downturns, reflecting investor confidence in its long-term potential. Over time, TRX has established itself as one of the prominent cryptocurrencies, with a growing user base and a diverse range of use cases. As the cryptocurrency market continues to evolve, Tron’s market prices are likely to reflect both internal and external factors, shaping its trajectory within the broader blockchain landscape.

    Figure 3 below represents the evolution of the price of Tron (TRX) in US dollar over the period November 2017 – May 2024 . The price corresponds to the “closing” price (observed at 10:00 PM CET at the end of the month).

    Figure 3. Evolution of Tron price

    Source: Yahoo! Finance.

    R program

    The R program below written by Shengyu ZHENG allows you to download the data from Yahoo! Finance website and to compute summary statistics and risk measures about the Tron (TRX).

    Download R file

    Data file

    The R program that you can download above allows you to download the data for Tron from the Yahoo! Finance website. The database starts on November 2017.

    Table 1 below represents the top of the data file for the Tron (TRX) downloaded from the Yahoo! Finance website with the R program.

    Table 1. Top of the data file for Tron (TRX)

    Source: computation by the author (data: Yahoo! Finance website).

    Python code

    You can download the Python code used to download the data from Yahoo! Finance.

    Download the Python code for USD Coin data

    Python script to download Tron (TRX) historical data and save it to an Excel sheet:

    import yfinance as yf

    import pandas as pd

    # Define the ticker symbol for Iron

    Tron_ticker = “TRX -USD”

    # Define the date range for historical data

    start_date = “2017-05-30”

    end_date = “2024-04-30”

    # Download historical data using yfinance

    Tron_data = yf.download(Tron_ticker, start=start_date, end=end_date)

    # Create a Pandas DataFrame from the downloaded data

    Tron_df = pd.DataFrame(Tron_data)

    # Define the Excel file path

    excel_file_path = “Tron_historical_data.xlsx”

    # Save the data to an Excel sheet

    Tron_df.to_excel(excel_file_path, sheet_name=”Tron Historical Data”)

    print(f”Data saved to {excel_file_path}”)

    # Make sure you have the required libraries installed and adjust the “start_date” and “end_date” variables to the desired date range for the historical data you want to download.

    Evolution of the TRX (Tron)

    Figure 4 below gives the evolution of the TRX (Tron) on a daily basis.

    Figure 4. Evolution of the TRX (Tron)

    Source: computation by the author (data: Yahoo! Finance website).

    Figure 5 below gives the evolution of the TRX (Tron) returns from May 2017 to May 2024 on a daily basis.

    Figure 5. Evolution of the TRX (Tron) returns.

    Source: computation by the author (data: Yahoo! Finance website).

    Summary statistics for the TRX (Tron)

    The R program that you can download above also allows you to compute summary statistics about the returns of the TRX (Tron).

    Table 2 below presents the following summary statistics estimated for TRX (Tron):

    • The mean
    • The standard deviation (the squared root of the variance)
    • The skewness
    • The kurtosis.

    The mean, the standard deviation / variance, the skewness, and the kurtosis refer to the first, second, third and fourth moments of statistical distribution of returns respectively.

    Table 2. Summary statistics for TRX (Tron)

    Source: computation by the author (data: Yahoo! Finance website).

    Statistical distribution of the TRX (Tron) returns

    Historical distribution

    Figure 6 represents the historical distribution of the TRX (Tron) daily returns for the period from May 2017 to May 2024.

    Figure 6. Historical distribution of TRX (Tron) returns.

    Source: computation by the author (data: Yahoo! Finance website).

    Gaussian distribution

    The Gaussian distribution (also called the normal distribution) is a parametric distribution with two parameters: the mean and the standard deviation of returns. We estimated these two parameters over the period from May 2017 to May 2024.

    Figure 7 below represents the Gaussian distribution of the TRX (Tron) daily returns with parameters estimated over the period from May 2017 to May 2024.

    Figure 7. Gaussian distribution of the TRX (Tron) returns.

    Source: computation by the author (data: Yahoo! Finance website).

    Risk measures of the TRX (Tron) returns

    The R program that you can download above also allows you to compute risk measures about the returns of the TRX (Tron).

    Table 3 below presents the following risk measures estimated for the TRX (Tron):

    • The long-term volatility (the unconditional standard deviation estimated over the entire period)
    • The short-term volatility (the standard deviation estimated over the last three months)
    • The Value at Risk (VaR) for the left tail (the 5% quantile of the historical distribution)
    • The Value at Risk (VaR) for the right tail (the 95% quantile of the historical distribution)
    • The Expected Shortfall (ES) for the left tail (the average loss over the 5% quantile of the historical distribution)
    • The Expected Shortfall (ES) for the right tail (the average loss over the 95% quantile of the historical distribution)
    • The Stress Value (SV) for the left tail (the 1% quantile of the tail distribution estimated with a Generalized Pareto distribution)
    • The Stress Value (SV) for the right tail (the 99% quantile of the tail distribution estimated with a Generalized Pareto distribution)

    Table 3. Risk measures for the TRX (Tron)

    Source: computation by the author (data: Yahoo! Finance website).

    The volatility is a global measure of risk as it considers all the returns. The Value at Risk (VaR), Expected Shortfall (ES) and Stress Value (SV) are local measures of risk as they focus on the tails of the distribution. The study of the left tail is relevant for an investor holding a long position in the TRX (Tron) while the study of the right tail is relevant for an investor holding a short position in the TRX (Tron).

    Why should I be interested in this post?

    This post provides an engaging exploration of Tron cryptocurrencies, tailored to both newcomers and seasoned crypto enthusiasts alike. It delves into Tron’s innovative blockchain technology and its transformative impact across diverse industries, from entertainment to decentralized finance. By delving into Tron’s underlying technology, consensus mechanism, and ecosystem development, readers can grasp the potential of Tron to revolutionize decentralized applications, scalability, and cross-chain interoperability. Furthermore, the post examines Tron’s historical price trends, market dynamics, and community governance structure, offering valuable insights for investors, traders, and ecosystem participants. Whether you’re curious about cutting-edge blockchain solutions or searching for investment opportunities in the crypto market, this post provides comprehensive insights into the significance and potential of Tron in shaping the future of decentralized technologies.

    Related posts on the SimTrade blog

    About cryptocurrencies

       ▶ Snehasish CHINARA Bitcoin: the mother of all cryptocurrencies

       ▶ Snehasish CHINARA How to get crypto data

       ▶ Alexandre VERLET Cryptocurrencies

       ▶ Youssef EL QAMCAOUIDecentralised Financing

       ▶ Hugo MEYERThe regulation of cryptocurrencies: what are we talking about?

    About statistics

       ▶ Shengyu ZHENG Moments de la distribution

       ▶ Shengyu ZHENG Mesures de risques

       ▶ Jayati WALIA Returns

    Useful resources

    Academic research about risk

    Longin F. (2000) From VaR to stress testing: the extreme value approach Journal of Banking and Finance, N°24, pp 1097-1130.

    Longin F. (2016) Extreme events in finance: a handbook of extreme value theory and its applications Wiley Editions.

    Data

    Yahoo! Finance

    Yahoo! Finance Historical data for Tron

    CoinMarketCap Historical data for Tron

    About the author

    The article was written in May 2024 by Snehasish CHINARA (ESSEC Business School, Grande Ecole Program – Master in Management, 2022-2024).

    My Professional Experience as a Quantitative Analyst Intern at Findoc Financial Services

    My Professional Experience as a Quantitative Analyst Intern at Findoc Financial Services

     Praduman AGRAWAL

    In this article, Praduman AGRAWAL (ESSEC Business School, Visiting Scholar, Summer 2024) shares his professional experience as a Quantitative Analyst Intern at Findoc Financial Services.

    About the Company

    Findoc Group offers both institutional and retail clients quality products and services that cover equity trading, derivative trading, commodity trading, currency trading, IPOs, and mutual fund investments. Findoc Group also offers depository services through NSDL to create a seamless transaction platform. Trades executed through the Findoc Group companies are settled through the Findoc Group Depository Participant. Findoc Group is also involved in business through Findoc Finvest Private Limited (NBFC) for activities such as loan against shares, loan against property, and loan against gold, among other loan services.

    Findoc team focuses on providing long-term value addition to its clients while maintaining the highest standards of excellence and professionalism. With a vision to earn a name that represents trust, growth, and passion, Findoc Group practices transparent business operations and prioritizes client satisfaction. Their professional approach emphasizes long-term relationships with clients, constantly generating value-added features without passing the cost burden to the clients.

    Logo of the company.
    Logo of Findoc Financial Services
    Source: Findoc Financial Services

    About the Department

    At Findoc Financial Services, I was part of the Quantitative Analysis department, specifically within the quantitative desk. Our team was dedicated to developing and implementing trading strategies focused on the Forex pair. My role involved designing a portfolio of trading strategies for USDINR aimed at reducing unsystematic risk through diversification. Using Easy Language on TradeStation, I coded these strategies incorporating a range of indicators such as Bollinger Bands, MACD, VWAP, and RSI, which I customized to fit our specific needs. In addition to the technical aspects, my work also delved into economic analysis and trading psychology, ensuring a comprehensive approach to strategy development. Utilizing 20 years of historical data, I meticulously conducted backtesting and forward testing, rigorously evaluating the effectiveness of our strategies and refining them for optimal performance.

    My Internship

    During my internship at Findoc Financial Services, I was entrusted with the development and implementation of trading strategies for the Forex market, specifically focusing on the USDINR currency pair. My primary responsibilities included coding trading strategies using Easy Language on TradeStation, backtesting these strategies using historical data, and performing forward testing to validate their effectiveness in real-time market conditions.

    My Missions

    My main mission was to develop a diversified portfolio of trading strategies aimed at reducing non-systematic risk. This involved extensive coding, data analysis, and testing to ensure the strategies were robust and effective. I also conducted economic analysis and considered trading psychology to enhance the strategies further.

    Required Skills and Knowledge

    During my internship, I honed a blend of soft and hard skills essential for success in quantitative analysis and trading strategy development. Effective communication was crucial for collaboration and presenting findings to stakeholders. Critical thinking and problem-solving skills were indispensable when encountering challenges in data analysis or strategy development. Adaptability was key as market conditions and requirements often changed, requiring flexibility in approach and strategy. Attention to detail was essential for ensuring accuracy in data analysis and coding of trading algorithms.

    On the hard skills front, proficiency in programming languages such as Easy Language for TradeStation was fundamental for coding and testing trading strategies. A strong understanding of statistical methods and financial mathematics was necessary for designing robust strategies and interpreting results accurately. Expertise in data analysis tools and techniques facilitated thorough backtesting and forward testing of strategies. Additionally, a deep understanding of financial markets, including factors influencing currency movements, was essential for developing effective trading strategies.

    What I Learned

    Throughout my internship, I gained a deeper understanding of trading strategies and the technical and economic factors influencing currency markets. I learned the importance of rigorous testing and validation of strategies to ensure their effectiveness in real-time trading. Additionally, I developed valuable skills in programming, data analysis, and financial market analysis, which are crucial for a career in quantitative finance.

    Financial Concepts Related to My Internship

    Diversification

    Diversification is the practice of spreading investments across different assets to reduce risk. In my role, I developed a portfolio of trading strategies for the USDINR currency pair. Each strategy had its unique approach and risk profile. By employing multiple strategies simultaneously, we aimed to diversify the risk associated with any single strategy. This concept directly links to my job as I focused on building a diversified portfolio of trading strategies to mitigate unsystematic risk.

    Technical Indicators

    Technical indicators are mathematical calculations based on historical price, volume, or open interest data. These indicators are used by traders to predict future price movements. In my role, I utilized various technical indicators such as Bollinger Bands, MACD, VWAP, and RSI to develop trading strategies for the USDINR pair. These indicators provided insights into market trends, momentum, volatility, and overbought/oversold conditions, which informed our trading decisions. Understanding and effectively using these indicators was crucial for building successful trading strategies.

    Backtesting and Forward Testing

    Backtesting involves testing a trading strategy using historical data to assess its performance. Forward testing, on the other hand, involves testing the strategy in real-time with live market data. In my role, I conducted both backtesting and forward testing of the trading strategies I developed. By analyzing past market data spanning 20 years, I assessed how well the strategies would have performed historically. Forward testing then allowed me to validate the strategies in real-time market conditions before implementation. The ability to conduct rigorous backtesting and forward testing was essential for evaluating the viability and effectiveness of our trading strategies.

    Why Should I Be Interested in This Post?

    If you love mathematics and finance, then a role as a Quantitative Analyst is a great fit for you. It broadens your horizon by offering different perspectives on financial markets. You will learn how small events can lead to significant changes in stock prices and how gap-up and gap-down movements can impact trading strategies. You will also gain skills in coding strategies (Algo-trading) that can be applied in various areas.

    Related Posts on the SimTrade Blog

       ▶ Trading strategies based on market profiles and volume profiles

       ▶ Quantitative Analyst – Job descriptions

    Useful Resources

    Findoc Group

    AlgoTrading with Kavin Davey

    About the Author

    The article was written in May 2024 by Praduman AGRAWAL (ESSEC Business School, Visiting Scholar, Summer 2024).

    Structured Debt in Private Equity: Rated Feeder Funds and Collateral Fund Obligations

    Structured Debt in Private Equity: Rated Feeder Funds and Collateral Fund Obligations

    Dante Marramiero

    In this article, Dante MARRAMIERO (ESSEC Business School, Master in Strategy and Management of International Business (SMIB), 2022-2023) explains structured debt in Private Equity: Rated Feeder Funds and Collateral Fund Obligations. Such debt products open the market for insurance companies.

    Structured Financing for Investment

    In the intricate world of finance, innovative structures continually emerge to meet investor demands under the current regulatory framework. Among these structures are Rated Feeder Funds (RNFs) and Collateralized Fund Obligations (CFOs), which facilitate investments for investors with specific investment criteria. This happens particularly with insurance companies and asset managers, to access private equity or alternative strategy funds such as growth funds or private credit funds through rated debt instruments. However, structures like RNFs and CFOs are not without their complexities and regulatory scrutiny, especially in light of historical parallels to Collateralized Debt Obligations (CDOs) and the financial crisis of 2008. CFOs and CDOs have exactly the same structure but have different underlying assets: CDOs are based on debt, specifically mortgages while CFOs are based on Private Equity funds.

    The two figures below represent the financial structure of RNFs and CFOs.

    Figure 1. Financial structure of an RNF.
    Financial structure of an RNF
    Source: the author.

    Figure 2. Financial structure of a CFO.
     Financial structure of a CFO
    Source: the author.

    Rated Feeder Funds (RNFs) and Collateral Fund Obligations (CFOs) thus represent innovative approaches to structured financing, aiming to bridge the gap between investors and private equity or alternative strategy funds.

    Why are CFOs and RNFs attracting insurance companies?

    CFOs and RNFs are both characterized by a blend of debt and equity components. These vehicles raise capital by issuing debt securities, which are then used to invest in a diversified portfolio of assets across multiple funds. The presence of both debt and equity elements not only provides investors with exposure to various underlying assets (in which the various funds have invested) but also introduces a diversification effect that can attract capital seeking lower risk profiles. The debt issued by CFOs typically undergoes scrutiny by rating agencies to determine their creditworthiness, thereby providing assurance to investors regarding the quality of the investment.

    On the other hand, RNFs operate through a structure where investors’ capital is channeled through a special purpose vehicle (SPV) or feeder fund. This feeder fund then invests in a master fund managed by the sponsor. This setup allows investors to gain exposure to the underlying assets of the master fund without directly participating in its operations. RNFs, similar to CFOs, offer rated debt instruments to investors, providing them with a regulated and transparent avenue to access private fund investments.

    Regulatory Considerations and Risk Mitigation

    One of the key attractions of RNFs and CFOs is the regulatory capital treatment they offer to institutional investors. By investing through rated debt instruments, regulated institutions such as insurance companies can benefit from reduced capital requirements compared to direct equity investments in underlying funds.

    However, regulatory scrutiny is a critical aspect of these structures, particularly in jurisdictions like the United States and Europe. In the US, concerns have been raised regarding the applicability of risk retention rules, especially in CFO transactions where repayment primarily depends on limited partnership interests. Similarly, European regulations such as the UK and EU Securitization Regulations impose stringent requirements.

    In the US, currently, the NAIC – National Association of Insurance Commissioners has blocked investments from insurance companies in CFOs but is working on possible ways to regulate the market and open the investment again in the future.

    Conclusion: Balancing Innovation with Regulatory Compliance

    Rated Feeder Funds (RNFs) and Collateral Fund Obligations (CFOs) represent innovative solutions for investors seeking exposure to private funds while optimizing regulatory capital requirements. However, their structural complexities and regulatory scrutiny, particularly in the aftermath of the 2008 financial crisis, underscore the importance of due diligence and compliance.

    As financial markets evolve, the challenge lies in striking a balance between innovation and regulatory compliance. While RNFs and CFOs offer opportunities for capital efficiency and investment diversification, they must navigate a complex regulatory landscape to ensure stability and mitigate systemic risks. Only through careful consideration of lessons from history and adherence to regulatory guidelines can these structured financing solutions fulfill their promise in the modern financial ecosystem.

    Example of precedent transaction: Tikehau raise a $300 million CFO

    Tikehau Capital has raised $300 million collateralized fund obligation backed by cashflows from commitments to its direct lending and private debt secondary strategies. The CFO’s assets consisted of interests in Tikehau’s own debt funds as well as third-party managed private debt funds originated by the firm’s private debt secondaries strategy, according to a statement from Jefferies, which advised on the transaction.

    Specifically, the CFO assets were largely Tikehau-managed funds: the direct lending and private debt secondaries which were held on the firm’s balance sheet. This transaction allowed Tikehau to raise capital from the big American insurance companies that otherwise would have considered investing in Tikehau’s funds as out of scope.

    Why should I be interested in this post?

    This post could be particularly intriguing for business students because it highlights diverse methods of fundraising within the private equity sector. This knowledge could benefit students aiming for careers in finance and those seeking to secure funding for their own ventures. Moreover, it provides valuable insights into the pivotal role that debt plays in financing strategies. Furthermore, it could be a good competitive advantage during Private Equity interviews to know about structured finance as it is an emerging topic in the Private Equity industry and not everyone is up to date with it!

    Related posts on the SimTrade blog

       ▶ Colombe BOITEUX Le métier de structureur

       ▶ Matisse FOY Key participants in the Private Equity ecosystem

       ▶ Lilian BALLOIS Discovering Private Equity: Behind the Scenes of Fund Strategies

       ▶ Alessandro MARRAS Top 5 Private Equity firms

    Useful resources

    Hanson R. (08/11/2023) Collateralised fund obligations and rated note feeders: options for structuring investment into private funds Morgan Lewis

    Cadwalader Brief Primer on CFOs and Rated Feeder Funds

    About the author

    The article was written in May 2024 by Dante MARRAMIERO (ESSEC Business School, Master in Strategy and Management of International Business (SMIB), 2022-2023).

    Private Equity and Italy, is it a nice combination?

    Private Equity and Italy, is it a nice combination?

    Dante Marramiero

    In this article, Dante MARRAMIERO (ESSEC Business School, Master in Strategy and Management of International Business (SMIB), 2022-2024) explains about the peculiar situation of the Italian Private Equity market.

    Italian conservative market is now opening up

    Italy’s family-owned enterprises, steeped in tradition yet poised for transformation, stand at a crossroads of opportunity. For decades, these businesses have been the backbone of the country’s economy, rooted in principles of heritage and resilience. Yet, as the global marketplace evolves, so too must they. Enter private equity – once a distant concept, now a beacon of possibility, offering two distinct paths for growth: co-investment and external capital infusion.

    As previously mentioned, family businesses dominate the Italian economy, with around 784,000 companies (nearly 85%) being family-owned according to AIDAF, the Italian Association of Family Businesses. These small and medium-sized enterprises are mainly active in sectors like fashion, mechanical engineering, and food, producing high-quality “Made in Italy” products.

    One driver for ownership changes in Italian family businesses is succession planning, as many seek external capital to finance growth, international expansion, technology investments or innovations due to being undercapitalized. Private equity funds have stepped in to provide this capital, with Italy being one of Europe’s most mature private equity markets. As a confirmation of this, annual private equity investments in Italy correspond to around 0.36% of GDP, on par with Germany but lower than the UK, Netherlands, and France.

    Key target sectors for Italian private equity include IT/communications and industrial goods. Around 14% of Italian family office assets are invested in private equity, with surveys suggesting most intend to increase these allocations. What could make the difference for the future is that younger generations of Italian wealth holders are expected to further drive family office investments into private equity and venture capital, being more interested in backing early-stage businesses, especially in technology. Their international outlook and experience abroad are also influencing asset allocation decisions.

    Co-Investment: Fostering Collaboration for Shared Success

    Traditionally, family businesses have been hesitant to engage with private equity, wary of relinquishing control and diluting their legacy. However, a paradigm shift is underway as a new wave of private equity firms sets its sights on these familial enterprises, offering tailored solutions to suit their diverse needs.

    Co-investment, as mentioned earlier, represents one avenue for growth. Through co-investment, family businesses can partner with private equity firms to pursue inorganic growth opportunities while retaining operational control. This collaborative approach allows for shared risk and rewards, leveraging the strengths of both parties to unlock new synergies and market opportunities.

    External Capital Infusion: Embracing Change for Accelerated Growth

    Yet, co-investment is not the only path forward. Another emerging trend in Italy’s business landscape is the willingness of family businesses to open their doors to external capital funding, including partial divestment to private equity firms. While this option may involve ceding a degree of ownership and autonomy, it also presents an opportunity to access significant capital infusion and strategic guidance.

    The decision between co-investment and external capital infusion is not a one-size-fits-all proposition. Each option carries its own set of benefits and considerations, depending on the unique circumstances and aspirations of the family business in question. Some may find co-investment to be a more palatable approach, allowing them to maintain a greater degree of control over their operations. Others may see external capital infusion as a means to accelerate growth and access new markets.

    The Role of Family Offices

    Integral to navigating these choices is the role of the family office – a trusted advisor tasked with safeguarding the financial interests of affluent families. Whether pursuing co-investment or external capital infusion, family offices play a crucial role in guiding decision-making and ensuring alignment with long-term goals.

    As Italy’s family businesses chart a course toward the future, the convergence of private equity and family offices offers a wealth of opportunities for growth and revitalization. By embracing both co-investment and external capital infusion, these enterprises can leverage the strengths of private equity partnerships while preserving their unique identities and legacies.

    Conclusion: Two Paths, One Destination

    In conclusion, the dual paths of co-investment and external capital infusion represent two sides of the same coin for Italy’s family businesses. By carefully weighing the options and leveraging the expertise of family offices, these enterprises can navigate the complexities of modern business and chart a course towards sustainable success in an ever-changing world.

    Why should I be interested in this post?

    This post presents a valuable opportunity to better understand the unique characteristics of the Italian market, predominantly driven by family businesses, and to explore its evolving landscape as it embraces a new business paradigm: Private Equity. Studying this transition offers insights not only for academic enrichment but also for future career prospects in Private Equity. Understanding how Italy’s traditional family business-dominated market is adapting to and integrating Private Equity opens doors for both educational exploration and potential professional paths in this sector.

    Related posts on the SimTrade blog

       ▶ Hélène VAGUET-AUBERT Private banking: evolving in a challenging environment

       ▶ Louis DETALLE A quick presentation of the Private Equity field…

       ▶ Lilian BALLOIS Discovering Private Equity.

       ▶ Matisse FOY Key participants in the Private Equity ecosystem

    Useful resources

    Bocconi Student Private Equity Club (2024) Overview: The Private Equity Market in Italy over the last 20 years

    Deutsche Bateiligungus AG (2023) Private equity in Italy – an undervalued market

    FamilyCapital (2020) The big private equity groups backed by families

    AltiGlobal (2023) Italy’s next generation of wealth holders step up to grow family wealth while they wait for senior leadership roles

    About the author

    The article was written in May 2024 by Dante MARRAMIERO (ESSEC Business School, Master in Strategy and Management of International Business (SMIB), 2022-2024)

    BNB’s Journey through the Digital Economy’s Cryptocurrency Landscape

     Snehasish CHINARA

    In this article, Snehasish CHINARA (ESSEC Business School, Grande Ecole Program – Master in Management, 2022-2024) explains the intricate workings and transformative potential of Binance Coin (BNB), exploring its origins, utility, market dynamics, and future prospects of this cornerstone of the digital economy.

    Historical context and background

    Binance Coin (BNB) is one of the most prominent cryptocurrencies in the market, known for its unique utility and its connection to the world’s largest cryptocurrency exchange, Binance. Binance, founded by Changpeng Zhao (CZ) in 2017, quickly rose to prominence as one of the leading cryptocurrency exchanges globally. Its rapid growth can be attributed to several factors, including its user-friendly interface, wide range of supported cryptocurrencies, and a robust security system. Binance gained significant traction during the bull run of 2017, becoming the go-to platform for traders and investors seeking to capitalize on the burgeoning cryptocurrency market.

    In July 2017, Binance conducted an Initial Coin Offering (ICO) to raise funds for the development of its platform and ecosystem. During the ICO, the exchange issued its native cryptocurrency, Binance Coin (BNB), which operates on the Ethereum blockchain as an ERC-20 token. The ICO was a massive success, raising $15 million within just a few weeks.

    BNB was initially designed as a utility token to facilitate transactions on the Binance platform, offering users various benefits such as discounted trading fees and participation in token sales hosted on the exchange. Binance committed to using a portion of its profits to buy back and burn BNB tokens periodically, reducing the overall supply over time and potentially increasing its value.

    As Binance continued to expand its services and offerings, the utility of BNB expanded beyond just a means of reducing trading fees. BNB became an integral part of the Binance ecosystem, serving as the native currency for various applications and services, including Binance Launchpad, Binance Smart Chain, Binance DEX (decentralized exchange), and Binance NFT marketplace, among others.

    The introduction of Binance Smart Chain (BSC) in 2020 further elevated the importance of BNB in the cryptocurrency space. BSC, a blockchain platform compatible with Ethereum Virtual Machine (EVM), was developed to provide an alternative to Ethereum for decentralized finance (DeFi) applications and decentralized applications (DApps). BNB serves as the native currency of BSC, powering transactions and fueling the ecosystem’s growth.

    BNB Logo

    Source: Binance.

    Figure 1. Key Dates in BNB History

    Source: Yahoo! Finance.

    Key features

      Utility Token

      BNB was initially designed as a utility token to facilitate transactions on the Binance platform. Users can utilize BNB to pay for trading fees, exchange fees, and various other services offered by Binance.

      Discounted Fees

      One of the primary benefits of holding BNB on the Binance exchange is the opportunity to receive discounts on trading fees. Binance offers users who pay their trading fees with BNB a significant discount, incentivizing its use within the platform.

      Token Burn

      Binance commits to using a portion of its profits to buy back and burn BNB tokens regularly. This token burning mechanism reduces the total supply of BNB over time, potentially increasing its scarcity and value.

      Multiple Use Cases

      BNB has expanded beyond its original utility and is now used for various purposes within the Binance ecosystem. It serves as the native currency for token sales on Binance Launchpad, transaction fees on Binance DEX, and participation in Binance NFT marketplace, among other applications.

      Binance Smart Chain (BSC)

      BNB is the native cryptocurrency of Binance Smart Chain, a blockchain platform compatible with Ethereum Virtual Machine (EVM). BSC offers low transaction fees and high throughput, making it an attractive option for decentralized applications (DApps) and decentralized finance (DeFi) projects.

      Governance

      BNB holders have the opportunity to participate in the governance of the Binance ecosystem. They can vote on proposals and decisions related to the development and direction of Binance, providing a degree of decentralization and community involvement.

      Staking and Yield Farming

      BNB holders can participate in staking and yield farming programs, allowing them to earn rewards or yield by locking up their BNB tokens and contributing to the security and operation of the network.

      Use cases

        Participation in Token Sales

        BNB holders often have exclusive access to token sales hosted on the Binance Launchpad platform. These sales allow users to invest in promising blockchain projects at an early stage, with BNB serving as the primary currency for participation.

        Payment Method

        BNB can be used as a payment method for various goods and services, both online and offline. Several merchants and businesses accept BNB as a form of payment, enabling users to utilize their cryptocurrency holdings for everyday transactions.

        Binance Ecosystem Services

        BNB is utilized within various services and applications offered by the Binance ecosystem. This includes decentralized finance (DeFi) protocols, decentralized exchanges (DEXs), non-fungible token (NFT) marketplaces, and more. BNB serves as the native currency for transactions, governance, and incentives within these platforms.

        Cross-Chain Compatibility

        With the introduction of Binance Smart Chain (BSC), BNB gained cross-chain compatibility, enabling it to be used in decentralized applications (DApps) and DeFi protocols across different blockchain networks. This expansion of utility enhances the interoperability and flexibility of BNB as a cryptocurrency.

        Technology and underlying blockchain

        Binance Coin (BNB) operates on two primary blockchain networks: the Ethereum blockchain and the Binance Smart Chain (BSC). Initially launched as an ERC-20 token on the Ethereum blockchain, BNB has since undergone a significant expansion with the introduction of the Binance Smart Chain. The Ethereum-based BNB tokens are utilized for various functions within the Binance ecosystem, including trading fee discounts, participation in token sales, and payments. However, to address scalability and transaction cost concerns, Binance developed the Binance Smart Chain, a parallel blockchain compatible with Ethereum Virtual Machine (EVM). BSC combines high performance with low transaction fees, offering a viable alternative for decentralized applications (DApps) and decentralized finance (DeFi) protocols. BNB serves as the native currency of BSC, facilitating transactions, powering smart contracts, and providing liquidity across the Binance Smart Chain ecosystem. BSC employs a proof-of-stake (PoS) consensus mechanism, where validators stake BNB to secure the network and validate transactions. This hybrid approach leverages the benefits of both decentralization and efficiency, making BNB and the Binance Smart Chain integral components of the rapidly evolving blockchain landscape.

        Supply of coins

        The total supply of Binance Coin (BNB) is capped at 200 million tokens. However, BNB’s initial distribution was structured to release a portion of this supply gradually over time. During its initial coin offering (ICO) in July 2017, Binance allocated 50% of the total token supply to the public sale, representing 100 million BNB tokens. The remaining 50% was split among the Binance team, early investors, and strategic partners, with a significant portion earmarked for ecosystem development and marketing efforts. Notably, Binance committed to periodic token burns, where a portion of BNB tokens used to pay for trading fees on the Binance exchange is systematically removed from circulation and permanently destroyed. These token burns serve to reduce the overall supply of BNB over time, potentially increasing its scarcity and value. As of [current date], multiple token burns have occurred, steadily decreasing the circulating supply of BNB and contributing to its deflationary nature. Additionally, BNB’s migration from the Ethereum blockchain to its own blockchain, Binance Chain, introduced a new mechanism for token issuance and governance, further shaping the supply dynamics of BNB within the Binance ecosystem.

        Historical data for Binance Coin (BNB)

        How to get the data?

        The Binance Coin (BNB) is popular cryptocurrency on the market, and historical data for the Binance Coin (BNB) such as prices and volume traded can be easily downloaded from the internet sources such as Yahoo! Finance, Blockchain.com & CoinMarketCap. For example, you can download data for Binance Coin (BNB) on Yahoo! Finance (the Yahoo! code for Binance Coin is BNB-USD).

        Figure 2. Binance Coin (BNB) data

        Source: Yahoo! Finance.

        Historical data for Binance Coin (BNB) market prices

        Binance Coin (BNB) has experienced significant volatility and price fluctuations since its inception in 2017. Initially launched at a price of around $0.10 during its ICO, BNB quickly gained traction and surged to an all-time high of over $40 in January 2018, fueled by the widespread adoption of the Binance exchange and the overall bullish sentiment in the cryptocurrency market at the time. However, like many other cryptocurrencies, BNB subsequently underwent a prolonged bear market, with its price plummeting to single-digit levels by the end of 2018. The following years saw periods of both growth and consolidation for BNB, with its price closely tied to developments within the Binance ecosystem, regulatory developments, and broader market trends. Notable milestones, such as the launch of Binance Smart Chain (BSC) and the subsequent rise of decentralized finance (DeFi) applications, have often coincided with bullish movements in BNB’s price. As of the latest data, BNB has demonstrated resilience and continued to maintain its position among the top cryptocurrencies by market capitalization, reflecting its enduring relevance and utility within the digital asset landscape.

        Figure 5 below represents the evolution of the price of Binance Coin (BNB) in US dollar over the period November 2017 – May 2024. The price corresponds to the “closing” price (observed at 10:00 PM CET at the end of the month).

        Figure 3. Evolution of Binance Coin (BNB) price.

        Source: Yahoo! Finance.

        R program

        The R program below written by Shengyu ZHENG allows you to download the data from Yahoo! Finance website and to compute summary statistics and risk measures about the Binance Coin (BNB).

        Download R file

        Data file

        The R program that you can download above allows you to download the data for the Binance Coin (BNB) from the Yahoo! Finance website. The database starts on November, 2017.

        Table 1 below represents the top of the data file for the Binance Coin (BNB) downloaded from the Yahoo! Finance website with the R program.

        Table 1. Top of the data file for the Binance Coin (BNB)

        Source: computation by the author (data: Yahoo! Finance website).

        Python code

        You can download the Python code used to download the data from Yahoo! Finance.

        Download the Python code for USD Coin data

        Python script to download Binance Coin (BNB) historical data and save it to an Excel sheet::

        import yfinance as yf

        import pandas as pd

        # Define the ticker symbol for Binance Coin (BNB)

        Binance_ticker = “BNB-USD”

        # Define the date range for historical data

        start_date = “2020-01-01”

        end_date = “2022-01-01”

        # Download historical data using yfinance

        Binance_data = yf.download(Binance_ticker, start=start_date, end=end_date)

        # Create a Pandas DataFrame from the downloaded data

        Binance_df = pd.DataFrame(Binance_data)

        # Define the Excel file path

        excel_file_path = “Cardano _historical_data.xlsx”

        # Save the data to an Excel sheet

        Binance_df.to_excel(excel_file_path, sheet_name=” Binance Historical Data”)

        print(f”Data saved to {excel_file_path}”)

        # Make sure you have the required libraries installed and adjust the “start_date” and “end_date” variables to the desired date range for the historical data you want to download.

        Evolution of the Binance Coin (BNB)

        Figure 4 below gives the evolution of the Binance Coin (BNB) on a daily basis.

        Figure 4. Evolution of the Binance Coin (BNB)

        Source: computation by the author (data: Yahoo! Finance website).

        Figure 5 below gives the evolution of the Binance Coin (BNB)returns from November, 2017 to May, 2024 on a daily basis.

        Figure 5. Evolution of the BNB returns.

        Source: computation by the author (data: Yahoo! Finance website).

        Summary statistics for the Binance Coin (BNB)

        The R program that you can download above also allows you to compute summary statistics about the returns of the Binance Coin (BNB).

        Table 2 below presents the following summary statistics estimated for Binance Coin (BNB):

        • The mean
        • The standard deviation (the squared root of the variance)
        • The skewness
        • The kurtosis.

        The mean, the standard deviation / variance, the skewness, and the kurtosis refer to the first, second, third and fourth moments of statistical distribution of returns respectively.

        The mean, the standard deviation / variance, the skewness, and the kurtosis refer to the first, second, third and fourth moments of statistical distribution of returns respectively.

        Table 2. Summary statistics for Binance Coin (BNB).

        Source: computation by the author (data: Yahoo! Finance website).

        Statistical distribution of the Binance Coin (BNB) returns

        Historical distribution

        Figure 6 represents the historical distribution of the Binance Coin (BNB) daily returns for the period from November, 2017 to May, 2024.

        Figure 6. Historical BNB distribution of the returns.

        Source: computation by the author (data: Yahoo! Finance website).

        Gaussian distribution

        The Gaussian distribution (also called the normal distribution) is a parametric distribution with two parameters: the mean and the standard deviation of returns. We estimated these two parameters over the period from November 2017 to May 2024.

        Figure 7 below represents the Gaussian distribution of the Binance Coin (BNB)daily returns with parameters estimated over the period from November 2017 to May 2024.

        Figure 7. Gaussian distribution of Binance Coin (BNB) returns.

        Source: computation by the author (data: Yahoo! Finance website).

        Risk measures of the Binance Coin (BNB)returns

        The R program that you can download above also allows you to compute risk measures about the returns of the Binance Coin (BNB).

        • The long-term volatility (the unconditional standard deviation estimated over the entire period)
        • The short-term volatility (the standard deviation estimated over the last three months)
        • The Value at Risk (VaR) for the left tail (the 5% quantile of the historical distribution)
        • The Value at Risk (VaR) for the right tail (the 95% quantile of the historical distribution)
        • The Expected Shortfall (ES) for the left tail (the average loss over the 5% quantile of the historical distribution)
        • The Expected Shortfall (ES) for the right tail (the average loss over the 95% quantile of the historical distribution)
        • The Stress Value (SV) for the left tail (the 1% quantile of the tail distribution estimated with a Generalized Pareto distribution)
        • The Stress Value (SV) for the right tail (the 99% quantile of the tail distribution estimated with a Generalized Pareto distribution)

        Table 3. Risk measures for Binance Coin (BNB).

        Source: computation by the author (data: Yahoo! Finance website).

        The volatility is a global measure of risk as it considers all the returns. The Value at Risk (VaR), Expected Shortfall (ES) and Stress Value (SV) are local measures of risk as they focus on the tails of the distribution. The study of the left tail is relevant for an investor holding a long position in the Binance Coin (BNB)while the study of the right tail is relevant for an investor holding a short position in the Binance Coin (BNB).

        Why should I be interested in this post?

        This post offers a captivating exploration of Binance Coin (BNB), tailored for both newcomers to the cryptocurrency realm and seasoned enthusiasts alike. It delves into the innovative utility and multifaceted ecosystem surrounding BNB, shedding light on its pivotal role within the Binance platform and beyond. By dissecting BNB’s diverse applications, including trading fee discounts, participation in token sales, and ecosystem services like decentralized finance (DeFi) and non-fungible tokens (NFTs), readers can grasp the breadth of opportunities presented by this digital asset. Additionally, the post delves into the historical price data and supply dynamics of BNB, providing valuable insights for investors, traders, and stakeholders navigating the volatile cryptocurrency market. Whether you’re intrigued by the potential of utility tokens or seeking to harness the power of the Binance ecosystem, this post offers an insightful journey into the significance and possibilities of Binance Coin in shaping the future of decentralized finance and digital economies.

        Related posts on the SimTrade blog

        About cryptocurrencies

           ▶ Snehasish CHINARA Bitcoin: the mother of all cryptocurrencies

           ▶ Snehasish CHINARA How to get crypto data

           ▶ Alexandre VERLET Cryptocurrencies

        About statistics

           ▶ Shengyu ZHENG Moments de la distribution

           ▶ Shengyu ZHENG Mesures de risques

           ▶ Jayati WALIA Returns

        Useful resources

        Academic research about risk

        Longin F. (2000) From VaR to stress testing: the extreme value approach Journal of Banking and Finance, N°24, pp 1097-1130.

        Longin F. (2016) Extreme events in finance: a handbook of extreme value theory and its applications Wiley Editions.

        Data

        Yahoo! Finance

        Yahoo! Finance Historical data for Binance Coin (BNB)

        CoinMarketCap Historical data for Binance Coin (BNB)

        About the author

        The article was written in May 2024 by Snehasish CHINARA (ESSEC Business School, Grande Ecole Program – Master in Management, 2022-2024).

    The selling process of funds

    The selling process of funds

     David-Alexandre Blum

    In this article, David-Alexandre BLUM (ESSEC Business School, Global Bachelor in Business Administration (GBBA), 2019-2023) explains about the selling process of funds.

    The process of selling a fund involves several key steps and stakeholders. The fund is built by management teams that develop the strategy, allocation, and follow the macroeconomic scenario of economists. Let’s take the example of Lazard Frères Gestion.

    Lazard Frères Gestion is characterized by active management based on fundamental analysis. Financial analysis and knowledge of companies are at the heart of the management process. All institutional management relies on the same macroeconomic scenario. Financial assets are the major source of financing for the real economy. The economy is cyclical. Financial assets are also cyclical. Volatility or bubble effects can cause the market price of an asset to diverge from its fair economic price in the short term, but not in the long term. Over time, it is the ability to capture the different phases of the cycle that creates outperformance.

    Lazard Frères Gestion’s investment philosophy is based on both reading the economic cycle and evaluating companies. When products are launched and marketable, the distribution team prospects new clients (through seminars, contacts, or research), responds to tenders, or meets specific client requests.

    The client meeting

    Once the initial contact has been made, the sales team must prepare a specialized presentation for clients, gathering necessary documents (such as reports, management points, comparative studies, etc.). The preparation of such a presentation is crucial and should not be overlooked. It is important to choose the right arguments to highlight, taking into account the current economic environment and supporting the scenario put forward by the management team.

    Selling a fund requires a thorough understanding of the management process, portfolio values, managers’ philosophy, as well as the benchmark performance and various risk and performance indicators of the presented fund.

    Once the speech is prepared and the materials finalized, it is up to the seller to showcase the fund’s qualities. If the meeting goes well and negotiations are successful, the transaction can follow quickly or the client may request an entirely different service, such as a dedicated fund (customized fund), if it meets the criteria for accessing the service.

    The team then needs to manage the contractual and administrative aspects to finalize the operation. The potential buyer conducts thorough due diligence on the fund, examining financial documents, contracts, internal procedures, and regulatory compliance to ensure there are no hidden issues or unforeseen risks.

    Once due diligence is completed and the terms of the transaction are finalized, the parties draft and sign the sales contracts. In addition, they obtain the necessary approvals from the relevant regulatory authorities to transfer the fund’s management to the buyer.

    After obtaining regulatory approvals, the client transfers the fund’s assets and liabilities to the buyer. This may include transferring securities, contracts with custodians and fund administrators, as well as communicating with the concerned investors.

    Once the transfer is completed, the buyer integrates the fund into their own management structure and takes over the daily management of the fund, ensuring that investment objectives and applicable regulations are met.

    Managing the relationship and the customer service

    The team’s work does not stop at mere sales. Its role is much more important. It must ensure the proper receipt of financial and legal documents sent to clients periodically. It must also respond to all information requests about the subscribed products and ensure that the services subscribed by the client are performed. It is their duty to do everything possible to justify any underperformance and to nourish the relationship with information and explanations. To do this, they attend various committees and internal meetings to keep abreast of different movements and tactical bets. The sales team can encourage its client to invest more in its product and propose new products that seem to meet the client’s demand. In the event that the client chooses to withdraw from the fund, the relationship does not end there, and it is up to the sales team to work to potentially bring their client back.

    From a technical standpoint, the sales team must master the knowledge of its products. The sales team must deeply understand the characteristics of the fund, including investment strategy, objectives, underlying assets, sectoral and geographical allocation, as well as fees and associated costs.

    It is essential to know the historical performance of the fund, risk-adjusted returns (such as the Sharpe ratio), and comparisons with benchmark indices or similar funds. The sales team must be able to explain the main risks associated with the fund, such as market, credit, liquidity, and currency risks, as well as the measures taken by the fund manager to mitigate these risks.

    Knowledge of regulations applicable to investment funds, such as UCITS or AIFMD directives in Europe, and disclosure and reporting requirements, is crucial to ensure compliance and client trust.

    The sales team must be able to identify target investors for the fund, taking into account their risk profile, investment objectives, and liquidity needs.

    Team members must master the procedures for subscribing and redeeming fund shares, including deadlines, fees, and specific conditions.

    Communication and presentation: Communication and presentation skills are essential for clearly and convincingly explaining the benefits of the fund and addressing potential clients’ questions.

    By mastering these technical aspects, the sales team will be able to effectively present the investment fund to potential clients, address their concerns, and assist them in making informed investment decisions.

    Why should I be interested in this post?

    The sales process of a fund helps to better understand the functioning of the investment fund market and the dynamics between asset management companies, investors, and financial intermediaries.

    Investors who understand the sales process of a fund are better equipped to evaluate fund offerings and make informed investment decisions based on their objectives and risk tolerance. Professionals working or considering working in the financial industry, particularly in the areas of asset management, sales, and investment advisory, will benefit from a deep understanding of the fund sales process to enhance their skills and professional performance.

    Furthermore, understanding the sales process of a fund can assist investors and financial advisors in comparing different investment products, such as mutual funds, exchange-traded funds (ETFs), and alternative investment funds, to determine the best solution for their specific needs and objectives.

    Related posts on the SimTrade blog

       ▶ Louis DETALLE A quick presentation of the Asset Management field…

       ▶ Tanguy TONEL My experience as an Investment Specialist at Amundi Asset Management

    Useful resources

    Lazard Frères Gestion

    Lazard Frères Gestion Les métiers de la gestion d’actifs (webinaire)

    Lazard Frères Gestion Qu’est-ce que la gestion d’actifs ?

    Lazard Frères Gestion Quelle allocation d’actifs pour un portefeuille diversifié ?

    Hull J., P. Roger (2017) Options futures et autres actifs dérivés Pearson Education.

    About the author

    The article was written in May 2024 by David-Alexandre BLUM (ESSEC Business School, Global Bachelor in Business Administration (GBBA), 2019-2023).

    My professional experience as an Institutional Sales Assistant with Lazard Frères Gestion

    My professional experience as an Institutional Sales Assistant with Lazard Frères Gestion

     David-Alexandre Blum

    In this article, David-Alexandre BLUM (ESSEC Business School, Global Bachelor in Business Administration (GBBA), 2019-2023) shares his professional experience as an Institutional Sales Assistant with Lazard Frères Gestion.

    About the company

    In 1848, Alexandre, Lazare and Simon Lazard, three French brothers from the Alsace region, founded Lazard Frères & Co in New Orleans as a dry goods merchant, having emigrated to the United States in the early 1840s.

    Today, Lazard serves investors worldwide with a broad range of global investment solutions and asset management services. Lazard Asset Management operates in 19 countries across North America, Europe and Asia, as well as in Australia. The group focuses on strategies based on rigorous and detailed analysis and dynamic asset management.

    Lazard Frères Gestion combines the power of a large global organization with the flexibility of a small entrepreneurial firm and focuses on asset management and advisory services for individual and institutional clients.

    With offices in Paris, Lyon, Bordeaux, Nantes, Brussels and Luxembourg, Lazard Frères Gestion manages €30 billion of assets on behalf of institutional and retail clients.

    Lazard Frères Gestion Logo
    Logo of  Lazard Frères Gestion
    Source: Lazard Frères Gestion

    The department I joined at Lazard Frères Gestion is the Distribution France sales department. The team handles customer relations and organizes meetings to sell and inform about the company’s funds. The department works closely with the management and marketing teams. Financial analysis and company knowledge are at the heart of Lazard Frères Gestion’s management processes. The model is characterized by an “analyst-manager” approach: the entire team is involved in investment decisions, and each analyst-manager can contribute his or her own valuation and market expertise. In addition, all institutional management is based on the same macroeconomic scenario. Lazard Frères Gestion’s investment philosophy is based on both business cycle analysis and company valuation.

    My internship

    As an institutional sales assistant, I worked as part of the Distribution France sales team and was in constant contact with customers. Therefore, I took part in all our management committees, videoconferences and events. I worked with management, client servicing, reporting, risk control, legal and middle office.

    My missions

    • Follow the sales activity of the Distribution team (multi-managers, private banks, insurance networks and independent asset managers)
    • Participate in specific responses to client requests
    • Help prepare client meetings
    • Prepare quarterly (or more frequent) management reports on flagship funds for clients
    • Summarize videoconferences organized on flagship funds and equity, fixed income, convertible and diversified fund management committees
    • Follow the performance of flagship funds and defined peer groups
    • Send specific documents from our tools (performance attribution, inventories, allocations, specific performance comments and fund positioning).

    Required skills and knowledge

    Firstly, the position I held required a broad knowledge of all asset classes. Lazard Frères Gestion offers a wide range of investment solutions: equities, bonds, mutual funds, structured products… It is therefore essential to know all the relevant vocabulary and the specific features of all the asset classes. I needed to know the different financial indicators and ratios in order to understand the different financial analyses carried out by the analyst teams.

    Thoroughness and efficiency were the qualities that my superiors expected most of me. There was no room for error, even in an emergency, and in a sales department the unexpected was commonplace. When writing memos on funds intended for clients, it was essential to transpose the managers’ analysis correctly. It was also my responsibility to respond to clients as quickly and accurately as possible.

    During this internship, I required to master some essential skills in order to be successful such as rigor, adaptability or efficiency. Adaptability was key as my role was cross-functional. I was in contact with most of the departments at Lazard Frères Gestion. I worked on projects with marketing in conjunction with the management teams, or I had to provide answers thanks to the reporting departments, which sent me the data I needed to make my calculations in response to clients.

    What I learned

    This experience was a real springboard for learning about the finance profession. I had the opportunity to apply the theoretical aspects to real projects and to work on various subjects under the guidance of experienced professionals. I also had the opportunity to perfect my knowledge of the financial market environment through daily contact with the Management, Reporting, Risk, Legal and Marketing teams. In particular, I improved my knowledge of asset management, understanding of macroeconomics and financial analysis.

    In particular, I was able to learn a lot about the different asset classes, thanks to the discussions I had with professionals and the various presentations I attended. Additionally, I was able to follow a number of fund sales and look after a variety of clients. I worked on various client presentations and financial documents such as reports and prospectuses.

    Financial concepts related to my internship

    Sale of financial products

    I learnt a lot about commercial sales techniques. It is important to know what elements to emphasize when prospecting or selling financial products, especially when dealing with professional and highly technical clients.

    I was able to familiarize myself with macro-economic and financial indicators that helped me understand certain economic scenarios and management decisions.

    I therefore carefully analyzed the financial markets and improved my understanding of the different types of financial markets, such as the stock, bond, foreign exchange (Forex) and derivatives markets.

    Through various client meetings, I was able to familiarize and educate myself on the different financial products. I dealt with a variety of financial products, such as equities, bonds, currencies, derivatives (options, futures, swaps) and mutual funds.

    Fixed income management

    Before this internship, I was much more comfortable with equities than bonds. However, the various committees, training sessions and discussions I’ve had have taught me a lot about bond management. In particular, I was able to follow how the management teams manipulated the funds’ modified duration to take advantage of unprecedented market conditions following the crises at the US regional banks and Crédit Suisse.

    I was also able to follow the launch of a bond fund and understand the entire portfolio construction process by following the strategy implemented by the management teams.

    Macro-economics

    During my internship I was able to acquire knowledge in macroeconomics by studying economic indicators, monetary and fiscal policies, international trade, business cycles, exchange rates, the relationship between financial markets and the economy, and sovereign debt. These skills enable me to better understand the global economic environment, assess investment opportunities and risks, and contribute to investment decision-making. At Lazard, a team of macro-economists gives analyses and predicts a scenario for the coming months, which are taken into account by all the managers in different proportions in order to respect the management process and the objective of their funds. It is therefore essential for the distribution team to know and master this scenario in order to explain the performance and strategies implemented.

    Why should I be interested in this post?

    If you are looking for a formative experience in finance with responsibilities and challenges combining financial expertise and sales, this internship is for you. You will be working on a wide range of assets and investment universes. Lazard Frères Gestion will require you to be rigorous and hard-working, but you’ll learn a lot about asset management.

    Related posts on the SimTrade blog

       ▶ All posts about Professional experiences

       ▶ Louis DETALLE A quick presentation of the Asset Management field…

       ▶ Tanguy TONEL My experience as an Investment Specialist at Amundi Asset Management

    Useful resources

    Lazard Frères Gestion

    Lazard Frères Gestion Les métiers de la gestion d’actifs (webinaire)

    Lazard Frères Gestion Qu’est-ce que la gestion d’actifs ?

    Lazard Frères Gestion Quelle allocation d’actifs pour un portefeuille diversifié ?

    Hull J. and P. Roger (2017) Options futures et autres actifs dérivés Pearson Education.

    About the author

    The article was written in May 2024 by David-Alexandre BLUM (ESSEC Business School, Global Bachelor in Business Administration, 2019-2023).

    Cardano: Exploring the Future of Blockchain Technology 

     Snehasish CHINARA

    In this article, Snehasish CHINARA (ESSEC Business School, Grande Ecole Program – Master in Management, 2022-2024) explains the cryptocurrency Cardano.

    Historical context and background

    Cardano is a blockchain platform that was founded in 2017 by Charles Hoskinson, one of the co-founders of Ethereum. The project was initiated by Input Output Hong Kong (IOHK), a technology company focused on blockchain and cryptocurrency. Cardano’s development was guided by a scientific philosophy and peer-reviewed research, aiming to create a more scalable, sustainable, and interoperable blockchain platform. Cardano is named after Gerolamo Cardano, the Italian mathematician, whereas the cryptocurrency associated with the platform is named after Ada Lovelace, the English mathematician.

    Cardano distinguishes itself through its layered architecture, which separates the platform’s settlement layer (Cardano Settlement Layer, CSL) from its computation layer (Cardano Computation Layer, CCL). This separation allows for greater flexibility and scalability, as well as easier implementation of updates and improvements.

    Another notable feature of Cardano is its consensus mechanism, called Ouroboros, which is based on a proof-of-stake algorithm. Ouroboros aims to achieve both security and scalability by allowing users to participate in the consensus process based on the amount of cryptocurrency they hold, rather than requiring expensive computational resources like Bitcoin’s proof-of-work mechanism.

    Cardano’s development has been divided into phases, each focusing on different aspects of the platform’s functionality and features. These phases include Byron (foundation), Shelley (decentralization), Goguen (smart contracts), Basho (scaling), and Voltaire (governance). As of the time of writing, Cardano has successfully completed the Byron and Shelley phases, with ongoing work on the Goguen phase, which will enable the implementation of smart contracts and decentralized applications (dApps) on the platform.

    Cardano Logo
     Cardano Logo
    Source: Cardano.

    Figure 1. Key Dates in Cardano History

    Source: Yahoo! Finance.

    Key features

      Layered Architecture

      Cardano’s architecture is divided into two layers – the Cardano Settlement Layer (CSL) and the Cardano Computation Layer (CCL). This separation allows for greater flexibility, scalability, and easier implementation of updates and improvements.

      Ouroboros Consensus Protocol:

      Cardano uses the Ouroboros proof-of-stake consensus algorithm, which is designed to be secure, scalable, and energy-efficient. It allows users to participate in the consensus process based on the amount of cryptocurrency they hold, rather than requiring expensive computational resources.

      Scalability

      Cardano is designed to be highly scalable, capable of handling a large number of transactions per second. Through its layered architecture and consensus mechanism, Cardano aims to achieve scalability without sacrificing security or decentralization.

      Interoperability

      Cardano aims to enable interoperability between different blockchain networks and protocols. This will allow for seamless transfer of assets and data between different platforms, facilitating greater connectivity and usability of decentralized applications (dApps).

      Smart Contracts

      Cardano is developing support for smart contracts, which are self-executing contracts with the terms of the agreement directly written into code. Smart contracts will enable the creation of decentralized applications (dApps) on the Cardano platform, opening up a wide range of possibilities for developers and users.

      Governance

      Cardano has a built-in governance mechanism that allows stakeholders to participate in the decision-making process for the future development of the platform. This includes voting on proposals for protocol upgrades, funding development projects, and other governance-related decisions.

      Formal Verification

      Cardano emphasizes formal methods and peer-reviewed research in its development process. This includes using formal verification techniques to ensure the correctness and security of its protocols and smart contracts, reducing the risk of bugs and vulnerabilities.

    Use cases

      Decentralized Finance (DeFi)

      Cardano’s smart contract capabilities can facilitate various DeFi applications, including decentralized exchanges (DEXs), lending platforms, stablecoins, and automated market makers (AMMs). Smart contracts on Cardano can enable programmable financial transactions without the need for intermediaries, providing users with greater control over their assets and reducing counterparty risk.

      Supply Chain Management

      Cardano’s blockchain can be utilized to track and authenticate products throughout the supply chain, ensuring transparency and accountability. By recording every step of a product’s journey on the blockchain, stakeholders can verify its origin, quality, and authenticity, thereby reducing fraud, counterfeiting, and logistical inefficiencies.

      Identity Management

      Cardano’s blockchain can serve as a secure and decentralized platform for identity management, enabling individuals to control and manage their digital identities without relying on centralized authorities. By leveraging cryptographic techniques, users can securely authenticate themselves and access various services, such as voting, healthcare, and financial transactions, while maintaining privacy and security.

      Voting and Governance

      Cardano’s blockchain can support transparent and tamper-resistant voting and governance systems, enabling communities to make collective decisions and govern decentralized organizations (DAOs). By using blockchain technology, voting processes can be made more secure, efficient, and auditable, ensuring fair and democratic outcomes.

      Tokenization of Assets

      Cardano’s blockchain can tokenize various real-world assets, such as real estate, stocks, and commodities, making them easily tradable and transferable on a global scale. By representing assets as digital tokens on the blockchain, ownership rights can be easily verified, fractional ownership can be enabled, and liquidity can be increased, unlocking new opportunities for investment and asset management.

    Technology and Underlying Blockchain

    Cardano is built on a multi-layered architecture designed to provide scalability, interoperability, and sustainability. At its core, Cardano utilizes a proof-of-stake (PoS) consensus mechanism called Ouroboros, which offers a more energy-efficient and secure alternative to traditional proof-of-work (PoW) systems. Ouroboros divides time into epochs and slots, with slot leaders responsible for creating new blocks and validating transactions within each slot. This approach ensures that the blockchain remains secure and decentralized while enabling high transaction throughput and low latency.

    Cardano’s blockchain consists of two main layers: the Cardano Settlement Layer (CSL) and the Cardano Computation Layer (CCL). The CSL serves as the foundation for the platform’s native cryptocurrency, ADA, and facilitates secure and efficient peer-to-peer transactions. It employs a UTXO (Unspent Transaction Output) model similar to Bitcoin, where transactions are represented as inputs and outputs, ensuring transparency and immutability.

    On top of the CSL, the CCL enables the execution of smart contracts and decentralized applications (dApps) using Plutus, Cardano’s purpose-built programming language. Plutus is based on Haskell, a functional programming language known for its safety and reliability, and allows developers to write smart contracts with formal verification capabilities, ensuring correctness and security. Additionally, Cardano supports interoperability with other blockchains through sidechains and cross-chain communication protocols, enabling seamless integration with existing infrastructure and networks.

    Cardano’s development is guided by a rigorous scientific approach, with ongoing research and peer-reviewed papers driving innovation and advancement. The platform’s roadmap is divided into distinct phases, including Byron (foundation), Shelley (decentralization), Goguen (smart contracts), Basho (scaling), and Voltaire (governance), each focusing on specific features and functionalities. This modular approach allows for continuous improvement and evolution, ensuring that Cardano remains at the forefront of blockchain technology.

    Supply of Coins

    The supply of coins for Cardano (ADA) is governed by a predetermined protocol established during its initial launch. The total maximum supply of ADA is capped at 45 billion coins. Unlike some cryptocurrencies that have fixed supplies, Cardano’s distribution occurs gradually through a process called “minting.” During the initial phase, ADA tokens were distributed through a public sale and allocated to early supporters, development, and the Cardano treasury. Ongoing minting of ADA occurs through the process of staking, where ADA holders can delegate their coins to stake pools to participate in the network’s consensus and earn rewards. This incentivizes stakeholders to actively participate in the security and governance of the network while also distributing newly minted coins in a decentralized manner. As a result, the circulating supply of ADA gradually increases over time, with new coins being minted and distributed to participants in the Cardano ecosystem.

    Historical data for Cardano

    How to get the data?

    The Cordano is popular cryptocurrency on the market, and historical data for the Cordano such as prices and volume traded can be easily downloaded from the internet sources such as Yahoo! Finance, Blockchain.com & CoinMarketCap. For example, you can download data for Cardano on Yahoo! Finance (the Yahoo! code for Cardano is ADA-USD).

    Figure 2. Cordano data

    Source: Yahoo! Finance.

    Historical data for the Cardano (ADA) market prices

    Cardano (ADA) has experienced notable fluctuations in its market price since its inception, reflecting both broader trends in the cryptocurrency market and developments specific to the Cardano project. Following its launch in 2017, ADA initially saw rapid growth, fueled by enthusiasm for its innovative technology and ambitious roadmap. However, like many cryptocurrencies, ADA’s price has been subject to volatility, with periods of sharp appreciation followed by corrections and consolidation. Historical data for Cardano’s market prices reveals a series of peaks and troughs, influenced by factors such as market sentiment, regulatory developments, technological milestones, and macroeconomic trends. Despite this volatility, Cardano has maintained its position as one of the top cryptocurrencies by market capitalization, attracting a dedicated community of supporters and investors. As the project continues to evolve and achieve key milestones, its market price remains closely watched by traders, investors, and stakeholders in the cryptocurrency ecosystem.

    Figure 3 below represents the evolution of the price of Cardano (ADA) in US dollar over the period November 2017 – May 2024. The price corresponds to the “closing” price (observed at 10:00 PM CET at the end of the month).

    Figure 3. Evolution of Cardano price

    Source: Yahoo! Finance.

    R program

    The R program below written by Shengyu ZHENG allows you to download the data from Yahoo! Finance website and to compute summary statistics and risk measures about the Cardano (ADA).

    Download R file

    Data file

    The R program that you can download above allows you to download the data for the Cardano (ADA) from the Yahoo! Finance website. The database starts on November, 2017.

    Table 1 below represents the top of the data file for the Cardano (ADA) downloaded from the Yahoo! Finance website with the R program.

    Table 1. Top of the data file for the Cardano

    Source: computation by the author (data: Yahoo! Finance website).

    Python code

    You can download the Python code used to download the data from Yahoo! Finance.

    Download the Python code for USD Coin data

    Python script to download Cardano (ADA) historical data and save it to an Excel sheet::

    import yfinance as yf

    import pandas as pd

    # Define the ticker symbol for Cardano “ADA-USD”

    Cardano_ticker = “ADA-USD”

    # Define the date range for historical data

    start_date = “2020-01-01”

    end_date = “2022-01-01”

    # Download historical data using yfinance

    Cardano_data = yf.download(Cardano_ticker, start=start_date, end=end_date)

    # Create a Pandas DataFrame from the downloaded data

    Cardano_df = pd.DataFrame(Cardano_data)

    # Define the Excel file path

    excel_file_path = “Cardano _historical_data.xlsx”

    # Save the data to an Excel sheet

    Cardano_df.to_excel(excel_file_path, sheet_name=”Cardano Historical Data”)

    print(f”Data saved to {excel_file_path}”)

    # Make sure you have the required libraries installed and adjust the “start_date” and “end_date” variables to the desired date range for the historical data you want to download.

    Evolution of the Cardano (ADA)

    Figure 4 below gives the evolution of the Cardano (ADA) on a daily basis.

    Figure 4. Evolution of the Cardano (ADA)

    Source: computation by the author (data: Yahoo! Finance website).

    Figure 5 below gives the evolution of the Cardano (ADA) returns from November, 2017 to May, 2024 on a daily basis.

    Figure 5. Evolution of the Cardano returns

    Source: computation by the author (data: Yahoo! Finance website).

    Summary statistics for the Cardano (ADA)

    The R program that you can download above also allows you to compute summary statistics about the returns of the Cardano (ADA).

    Table 2 below presents the following summary statistics estimated for the Cardano (ADA):

    • The mean
    • The standard deviation (the squared root of the variance)
    • The skewness
    • The kurtosis.

    The mean, the standard deviation / variance, the skewness, and the kurtosis refer to the first, second, third and fourth moments of statistical distribution of returns respectively.

    Table 2. Summary statistics for Cardano.

    Source: computation by the author (data: Yahoo! Finance website).

    Statistical distribution of the Cardano (ADA) returns

    Historical distribution

    Figure 6 represents the historical distribution of the Cardano (ADA) daily returns for the period from November, 2017 to May, 2024.

    Figure 6. Historical Cardano distribution of the returns.

    Source: computation by the author (data: Yahoo! Finance website).

    Gaussian distribution

    The Gaussian distribution (also called the normal distribution) is a parametric distribution with two parameters: the mean and the standard deviation of returns. We estimated these two parameters over the period from November, 2017 to May, 2024.

    Figure 7 below represents the Gaussian distribution of the Ethereum daily returns with parameters estimated over the period from November, 2017 to May, 2024.

    Figure 7. Gaussian distribution of the Cardano returns.

    Source: computation by the author (data: Yahoo! Finance website).

    Risk measures of the Cardano (ADA) returns

    The R program that you can download above also allows you to compute risk measures about the returns of the Cardano (ADA).

    Table 3 below presents the following risk measures estimated for the Cardano (ADA):

    • The long-term volatility (the unconditional standard deviation estimated over the entire period)
    • The short-term volatility (the standard deviation estimated over the last three months)
    • The Value at Risk (VaR) for the left tail (the 5% quantile of the historical distribution)
    • The Value at Risk (VaR) for the right tail (the 95% quantile of the historical distribution)
    • The Expected Shortfall (ES) for the left tail (the average loss over the 5% quantile of the historical distribution)
    • The Expected Shortfall (ES) for the right tail (the average loss over the 95% quantile of the historical distribution)
    • The Stress Value (SV) for the left tail (the 1% quantile of the tail distribution estimated with a Generalized Pareto distribution)
    • The Stress Value (SV) for the right tail (the 99% quantile of the tail distribution estimated with a Generalized Pareto distribution)

    Table 3. Risk measures for the Cardano.

    Source: computation by the author (data: Yahoo! Finance website).

    The volatility is a global measure of risk as it considers all the returns. The Value at Risk (VaR), Expected Shortfall (ES) and Stress Value (SV) are local measures of risk as they focus on the tails of the distribution. The study of the left tail is relevant for an investor holding a long position in the Cardano(ADA) while the study of the right tail is relevant for an investor holding a short position in the Cardano(ADA).

    Why should I be interested in this post?

    This post provides a compelling exploration of Cardano, catering to both novices and seasoned cryptocurrency enthusiasts alike. It delves into Cardano’s innovative blockchain technology and its role in revolutionizing various sectors, including finance, governance, and social impact initiatives. By understanding Cardano’s layered architecture, consensus mechanism, and ongoing development phases, readers can gain valuable insights into its potential to address scalability, interoperability, and sustainability challenges in the blockchain space. Moreover, the post examines Cardano’s historical performance, market dynamics, and community-driven governance model, offering invaluable perspectives for investors, traders, and stakeholders. Whether you’re intrigued by cutting-edge blockchain solutions or seeking investment opportunities in the cryptocurrency market, this post provides comprehensive insights into the significance and potential of Cardano in shaping the future of decentralized technologies.

    Related posts on the SimTrade blog

    About cryptocurrencies

       ▶ Snehasish CHINARA Bitcoin: the mother of all cryptocurrencies

       ▶ Snehasish CHINARA How to get crypto data

       ▶ Alexandre VERLET Cryptocurrencies

    About statistics

       ▶ Shengyu ZHENG Moments de la distribution

       ▶ Shengyu ZHENG Mesures de risques

       ▶ Jayati WALIA Returns

    Useful resources

    Academic research about risk

    Longin F. (2000) From VaR to stress testing: the extreme value approach Journal of Banking and Finance, N°24, pp 1097-1130.

    Longin F. (2016) Extreme events in finance: a handbook of extreme value theory and its applications Wiley Editions.

    Data

    Yahoo! Finance

    Yahoo! Finance Historical data for Cardano

    CoinMarketCap Historical data for Cardano

    About the author

    The article was written in March 2024 by Snehasish CHINARA (ESSEC Business School, Grande Ecole Program – Master in Management, 2022-2024).

    Morningstar

    Morningstar

    Nithisha CHALLA

    In this article, Nithisha CHALLA (ESSEC Business School, Grande Ecole Program – Master in Management (MiM), 2021-2024) presents Morningstar, which provides financial data, news and analytics for the financial community.

    Introduction

    Morningstar is a leading provider of independent investment research, data, and analysis, dedicated to helping investors make informed decisions and achieve financial success. Their mission is to provide investors with unbiased insights, trusted research, and actionable data to navigate the complexities of the financial markets. Whether it is for a novice investor seeking guidance or a seasoned professional managing portfolios, Morningstar’s platform offers valuable resources to support their investment journey.

    Logo of Morningstar
    Logo of Morningstar
    Source: Morningstar

    History

    Morningstar, Inc. is an American financial services firm headquartered in Chicago, Illinois, and was founded by Joe Mansueto in 1984. Its initial investment was of US$80,000. In July 1999, Morningstar accepted an investment of US$91 million from SoftBank in return for a 20 percent stake in the company. The two companies had formed a joint venture in Japan the previous year.

    Morningstar’s initial public offering occurred on May 3, 2005, with 7,612,500 shares at $18.50 each. The manner in which Morningstar went public is notable. They elected to follow Google’s footsteps and use the OpenIPO method rather than the traditional method. This allowed individual investors to bid on the price of the stock, and allowed all investors equal access.

    In 2006, Morningstar acquired Ibbotson Associates, Inc., an investment research firm. In 2007, Morningstar acquired the mutual fund data business of S&P Global. In 2010, Morningstar acquired credit rating agency Realpoint for $52 million and begins offering structured credit ratings and research to institutional investors.

    In the same year, Morningstar acquired Old Broad Street Research Ltd. (OBSR), a UK-based provider of fund research, ratings and investment advisory services, for $18.3 million. After the acquisition, renamed as Morningstar OBSR. In 2014, Morningstar acquired ByAllAccounts, Inc., a provider of innovative data aggregation technology for financial applications. In 2016, Morningstar acquires remaining ownership of PitchBook Data for approximately $225 million.

    In 2019, Morningstar acquired the world’s fourth largest credit rating agency DBRS for $669 million. After the acquisition, DBRS merged with Morningstar’s credit rating business. In 2020, Morningstar entered into an agreement to acquire Sustainalytics, a research and ratings firm specializing in environmental, social and governance (ESG) insights. In 2021, Morningstar announced it would acquire the UK and international operations of the Australian wealth management platform Praemium.

    In 2022, Morningstar announced that it will acquire the S&P Global-owned Leveraged Commentary & Data (LCD), a company specializing in leveraged loan market data, for $600 million up to $650 million. Today, from retirement planning to ESG (Environmental, Social, Governance) investing, Morningstar remains committed to helping individuals and institutions navigate the complexities of the financial markets and achieve their financial goals with confidence.

    Key Components of Morningstar

    Earnings Estimates

    Price/projected earnings for a stock is the ratio of the company’s most recent month-end share price to the company’s estimated earnings per share (EPS) for the current fiscal year. According to Morningstar’s website, if a third-party estimate for the current year EPS is not available, the company will calculate an internal estimate based on the most recently reported EPS and average historical earnings growth rates.

    Morningstar generates this figure in-house based on stock statistics from our internal equities databases. For stocks, this figure is calculated monthly. For funds and portfolios, Morningstar updates this figure upon receipt of the most-recent portfolio holdings from the asset manager.

    The P/E ratio relates the price of the stock to the per-share earnings of the company. A high P/E generally indicates that the market will pay more to obtain the company because it has confidence in the company’s ability to increase its earnings. Conversely, a low P/E indicates that the market has less confidence that the company’s earnings will increase, and therefore will not pay as much for its stock. In most cases high average P/E ratio indicates a manager has paid a premium for stocks that have a high potential for increased earnings. If the average P/E ratio is low, the manager may believe that the stocks have an overlooked or undervalued potential for appreciation.

    Revenue Projections

    Morningstar aggregates earnings estimates and consensus revenue forecasts from analysts, providing insights into market expectations for future revenue levels. This data helps investors gauge sentiment and anticipate potential revenue surprises. Morningstar presents revenue projections and growth rates based on proprietary models and industry analysis.

    For example, on Feb 22, 2024, Morningstar’s chief executive officer, Kunal Kapoor said that “We finished 2023 on a strong note, crossing $2 billion in revenue for the fiscal year and delivering meaningful increases in organic revenue, margins, and cash flow for the quarter”. This not only implements that the company has been successful but also shows how reliable the company data is for the investors.

    Forecasts for Key Financial Metrics

    Morningstar calculates and forecasts key profitability ratios such as return on equity (ROE), return on assets (ROA), and operating margins. These metrics indicate a company’s efficiency and financial health, aiding investors in evaluating investment opportunities. It provides cash flow projections, including operating cash flow, free cash flow, and cash flow from investing and financing activities. Investors can analyze cash flow trends and liquidity positions to assess a company’s ability to generate and manage cash.

    In the company website, investors can access historical data and perform comparisons of key financial metrics over time, across companies, or within industries. This helps identify trends, benchmark performance, and identify investment opportunities.

    Coverage

    Morningstar offers investment management services through its investment advisory subsidiaries, with approximately $286 billion in assets under advisement and management as of Dec. 31, 2023. The Company operates through wholly- or majority-owned subsidiaries in 32 countries.

    According to Morningstar, the company website maintains coverage oMorningstar.com offers coverage of 950 stocks, 1,150 mutual funds, and 300 ETFs, plus market news, economic analysis, portfolio-planning insights, and investment commentary.

    Period

    Morningstar offers several periods of windows to access and analyse the data, such as Single Period(certain definite time), Trailing Periods(end date is fixed), Rolling Window(typically used to measure consistency of data), Forward Extending Window (fixes the start date for each time period), Regular Periods from start and Regular Periods from end. These various options give the investors detailed and customised analysis of what they are looking for.

    Frequency

    The period and frequency of forecasts on Morningstar vary based on user needs and market dynamics. Morningstar Quantitative Rating has the unique advantage of maintaining a monthly update cycle.

    Firms and Financial analysts

    Morningstar, Inc. is a leading provider of independent investment insights in North America, Europe, Australia, and Asia. The Company offers an extensive line of products and services for individual investors, financial advisors, asset managers and owners, retirement plan providers and sponsors, and institutional investors in the debt and private capital markets. Morningstar has the one of the largest independent manager research teams in the world with more than 100 analysts covering more than 4000 unique funds.

    Pricing

    The business model of Morningstar is a three tier based pricing namely License-based, Asset-based and Transaction-based.

    License-based: The majority of the research, data, and proprietary platforms are accessed via subscriptions or contract-based licensing arrangements that grant access on either a per user or enterprise-basis for a specified period of time. Licensed-based revenue includes Morningstar Data, Morningstar Direct, Morningstar Advisor Workstation, Morningstar Office, PitchBook Data, Premium Memberships on Morningstar.com, and other similar products.

    Asset-based: They charge basis points and other fees for assets under management or advisement. Morningstar Investment Management, Workplace Solutions, and Morningstar Indexes products all fall under asset-based revenue.

    Transaction-based: Ad sales on Morningstar.com and their Credit Ratings products comprise the majority of the products that are transactional, or one-time, in nature, versus the recurring revenue streams represented by their licensed and asset-based products.

    Use of Morningstar by the Financial Community

    Benchmark for Analysis

    Company is known as a benchmark for analysis in the financial market. Over the years their strategy has delivered excellent diversification and risk-adjusted returns. Since the September 2000 start of its longest-tenured manager, Rolley, the fund’s 7.7% annualized gain through the end of March 2024 beat the average global allocation Morningstar Category fund by more than 3 percentage points with better Sharpe and Sortino ratios, measures of risk-adjusted results.

    Market Expectations

    Morningstar provides access to economic data and forecasts that shape market expectations. Users can track indicators such as GDP growth, inflation rates, unemployment figures, and interest rate projections to anticipate broader economic trends.

    Earnings Season Preparation

    During earnings season, Morningstar offers detailed analysis of company earnings reports relative to consensus estimates. Investors can assess whether companies meet, exceed, or fall short of market expectations, influencing stock prices and investor sentiment.

    For a deeper understanding, this is an example of how they would state seasons preparation – “I think third-quarter earnings in and of themselves will generally be very strong. Management guidance last quarter probably shouldn’t be all that difficult to beat. And also the U.S. has just remained defiant in the face of tight monetary policy. So, economic growth has been much stronger than we had originally expected. In fact, if you look at our numbers here, we just recently updated our GDP forecast for the third quarter to 3.9%.”

    Morningstar and Tests of Market Efficiency

    Academic works

    Morningstar conducts and publishes academic research on market efficiency, analyzing factors that contribute to market anomalies and deviations from efficient market hypotheses. This research informs investment strategies and challenges conventional market theories. The efficient-market hypothesis, or EMH, implies that the market quickly and accurately incorporates all information regarding a stock’s actual value into its price. They believe that Investors can’t gain an informational advantage and shouldn’t try to beat the market. Instead, they should simply track the market through a broad market index fund.

    Information Dissemination

    Morningstar facilitates information dissemination and transparency, providing investors with access to comprehensive data and research reports. By empowering investors with timely and accurate information, Morningstar contributes to market efficiency by reducing information asymmetry.

    Pros and Cons

    Morningstar compares fund performance against relevant benchmarks and market indices, offering insights into fund managers’ ability to generate alpha (excess returns). By evaluating relative performance, Morningstar assesses market efficiency and the value of active management.

    Morningstar’s performance attribution analysis helps investors evaluate the effectiveness of investment strategies and identify sources of outperformance or underperformance.

    On the other side, Morningstar is primarily a research and analysis platform, and it may not offer direct trading capabilities or execution of investment transactions. Like any investment service, Morningstar’s ratings and recommendations are based on historical data and assumptions, and they may not fully anticipate future market fluctuations or uncertainties.

    Conclusion

    Morningstar offers valuable resources for investors seeking to research, analyze, and manage their investments effectively. Understanding the pros and cons can help investors leverage Morningstar’s strengths while being mindful of potential limitations or considerations.

    Why should I be interested in this post?

    Understanding how financial professionals use platforms like Morningstar can contribute to your professional development, especially if you’re pursuing a career in finance, investment management, or financial advising. It demonstrates your interest in industry trends and best practices.

    Related posts on the SimTrade blog

       ▶ Aamey MEHTA Market efficiency: the case study of Yes bank in India

       ▶ Louis DETALLE The importance of data in finance

       ▶ Bijal GANDHI Earnings per share

    Useful resources

    Morningstar Morningstar, Inc. Reports Fourth-Quarter, Full-Year 2023 Financial Results

    Wikipedia Morningstar

    Morningstar Articles, products and services for professional investors

    Morningstar Performance Reporting – Time Periods

    Morningstar Earnings Season: What to Expect

    About the author

    The article was written in May 2024 by Nithisha CHALLA (ESSEC Business School, Grande Ecole Program – Master in Management (MiM), 2021-2024).

    Bloomberg

    Bloomberg

    Nithisha CHALLA

    In this article, Nithisha CHALLA (ESSEC Business School, Grande Ecole Program – Master in Management (MiM), 2021-2024) presents Bloomberg, which provides financial data, news and analytics for the financial community.

    Bloomberg

    Bloomberg is a company that provides financial data, news, and analytics to people in finance and other industries. The company was created to address the need for better financial data and analytics access in the business world. Bloomberg’s flagship product is the Bloomberg Terminal, a computer software system that provides real-time data on financial markets, economic indicators, and news.

    Logo of Bloomberg
    Logo of Bloomberg
    Source: Bloomberg

    History

    Bloomberg LP was founded in 1981 by Michael Bloomberg, a former investment banker who recognized the growing demand for reliable financial information and analytics. The company initially focused on developing and selling computer terminals that provided real-time data on stocks, bonds, and other financial instruments.

    Bloomberg’s key innovation, Bloomberg Terminal, was introduced in the early 1980s. This groundbreaking platform revolutionized the way financial professionals accessed market data and news, offering a comprehensive toolset for trading, analysis, and research.

    Over the years, Bloomberg expanded its offerings beyond terminals to include data analytics, financial software, and media services. Bloomberg News, launched in 1990, became a prominent source of business and financial journalism, providing timely news coverage and insightful analysis to subscribers worldwide.

    In the 21st century, Bloomberg continued to innovate and diversify its business, introducing new products and services tailored to the evolving needs of the financial industry. The company expanded its global presence with offices in major financial centers across North America, Europe, Asia, and beyond.

    Today, the company’s commitment to innovation, integrity, and excellence has solidified its position as a trusted partner for businesses, governments, and institutions seeking reliable financial information and insights.

    Bloomberg has evolved since its introduction in 1981 and has grown the company from a single location to 176 locations and with 20000 employees. Bloomberg with over 40 years of history, facilitates bottom-up and top-down analysis to better assess potential growth and risk as well as future value across industry, sector, index, country, and region.

    Bloomberg covers a wide range of firms across different industries, sectors, and regions. According to Chen (2023), Bloomberg grew to a leading financial company with over 325,000 subscriptions to its professional services, almost 1 million global circulations of Bloomberg Businessweek, and over 150 news bureaus internationally. To support this massive network of financial information, data encryption, messaging, and trading, Bloomberg employs over 4,000 computer engineers around the globe.

    Key Components of Bloomberg

    Earnings Estimates

    Bloomberg provides estimates and forecasts about how companies will perform financially. It collects data from many sources and use it to predict things like earnings and revenue for different businesses.

    According to Guttmann from Statista (2022), Bloomberg LP, which operates within the business of information services, news services, broadcasting, streaming, and print, generated an estimated 12.2 billion U.S. dollars. A year earlier, the company’s revenue results stood at 10 billion dollars.

    Revenue Projections

    Alongside earnings estimates, Bloomberg provides forecasts on how much revenue companies are expected to generate. This helps stakeholders analyze and project the growth and performance of businesses over specific periods.

    For example, on June 01, 2023, Bloomberg Intelligence released an expected revenue projection on the AI industry for the next ten years stating “Rising demand for generative AI products could add about $280 billion of new software revenue and the Emerging Industry Could Grow at a CAGR of 42% Over the Next 10 Years”. This helps stakeholders of the respective industry to analyze, project, and invest accordingly.

    Forecasts for Key Financial Metrics

    Bloomberg’s platform includes forecasts for various important financial metrics beyond earnings and revenue, such as cash flow, profit margins, and growth rates. These forecasts assist in assessing the overall financial health and prospects of companies.

    In April 2024, Bloomberg launched a point-in-time data solution that gives quants a competitive edge. By pre-ingesting, mapping, and linking many different data sources together, Bloomberg allows customers to significantly reduce the time needed to generate signals or insights. With this launch, Bloomberg is responding to customers’ need for differentiated, value-adding data with standardized company-level fundamentals, estimates, and deep industry-specific metrics, alongside macro information.

    Coverage

    Bloomberg covers a wide range of companies across different industries, from large corporations to smaller businesses. This extensive coverage ensures that users have access to comprehensive financial data and insights.

    Bloomberg Markets maintains coverage of stocks, bonds, commodities, emerging markets, and forex markets from more than 160 countries. Bloomberg Politics holds the largest news agency in the world in US politics and major global events with more than 1000 reporters and staff. Bloomberg News publishes around 5000 stories daily.

    Period

    Bloomberg usually provides data with the longest available time period. For example, for Bitcoin data starts in 2010.

    Frequency

    The period and frequency of forecasts on Bloomberg vary based on user needs and market dynamics. Users can access real-time updates and forecasts as frequently as necessary to stay informed about market changes and company performance.

    Bloomberg offers the only cloud-native real-time data delivery option suitable for capital markets use. It delivers B-PIPE through an intra-cloud connection to a managed virtual private cloud on Amazon Web Services (AWS) via AWS Private Link. This low-latency option provides speed, reliability, and security via connectivity that remains solely in AWS.

    Pricing

    The specific pricing for accessing Bloomberg data is mentioned on the Bloomberg website and it states to have categories like all-in access, limited access, and also has special student access for limited data. The cost likely varies based on the package and offerings selected, which can include different data sets, yearly or monthly subscriptions, and access methods. For detailed pricing information, it is recommended to directly go through the Bloomberg website as it includes very precise information that pretty much caters to all the needs based on the functionality.

    Bloomberg charges a fee for its services, usually on a subscription basis. The cost can be high, but many financial professionals find it worth it for the valuable information they receive.

    Use of Bloomberg by the Financial Community

    Benchmark for Analysis

    Professionals rely on Bloomberg’s extensive database of financial data, economic indicators, and market news to conduct in-depth analyses of companies, industries, and markets. The platform provides powerful tools and customizable features that enable users to create detailed financial models, perform comparative analysis, and track key performance metrics.

    Market Expectations

    Financial professionals use Bloomberg to stay informed about market expectations and sentiment. The platform aggregates market forecasts, including earnings estimates, revenue projections, and economic indicators, allowing users to assess consensus expectations and potential market trends. Bloomberg’s real-time updates and customizable alerts enable users to monitor shifts in market sentiment and adjust investment strategies accordingly.

    Earnings Season Preparation

    During earnings seasons, Bloomberg becomes an essential tool for financial professionals preparing for corporate earnings releases. The platform’s earnings analysis tools help users interpret financial results, identify underlying trends, and make informed decisions based on earnings reports.

    Bloomberg and Tests of Market Efficiency

    Academic works

    Researchers and scholars leverage Bloomberg’s vast dataset and analytics tools to conduct empirical studies on market behavior, information dissemination, and the efficiency of asset pricing models. By analyzing historical market data and real-time information flow, academics assess the degree to which markets reflect all available information and efficiently incorporate new information into asset prices.

    Information Dissemination

    One key aspect of market efficiency is the speed and accuracy of information dissemination. Bloomberg facilitates the rapid dissemination of market news, economic data, and corporate announcements to a global audience of financial professionals. Researchers use Bloomberg to study how quickly information is incorporated into asset prices and whether markets efficiently reflect public and private information.

    Pros and Cons

    Given its history and operations in widely known industries and markets, we certainly need to know the pros and cons of Bloomberg.

    Bloomberg provides users with access to extensive financial data and analytics, enabling rigorous empirical studies on market efficiency. Bloomberg’s customizable tools and advanced features facilitate complex analyses and modeling for testing various market efficiency hypotheses. The platform offers real-time updates and historical data, allowing researchers to analyze market behavior over different periods and market conditions.

    On the other side, Bloomberg’s subscription costs may limit access to users with limited budgets or academic institutions with constrained resources. The complexity of Bloomberg’s interface and data structure may also present a learning curve for users new to the platform.

    Conclusion

    Bloomberg’s impact extends across the financial community, serving as a trusted resource for investors, traders, analysts, and corporate professionals worldwide.

    Why should I be interested in this post?

    According to me, mastering Bloomberg can equip management students with valuable skills and knowledge that are directly applicable to careers in finance, business analysis, and strategic management. It offers a practical way to enhance analytical capabilities, stay updated with industry trends, and build a strong foundation for future professional success.

    Related posts on the SimTrade blog

       ▶ Aamey MEHTA Market efficiency: the case study of Yes bank in India

       ▶ Louis DETALLE The importance of data in finance

       ▶ Bijal GANDHI Earnings per share

    Useful resources

    Bloomberg

    Wikipedia Bloomberg L.P.

    Statista Estimated revenue generated by Bloomberg LP worldwide from 2015 to 2022

    Bloomberg Generative AI to Become a $1.3 Trillion Market by 2032, Research Finds

    Bloomberg Bloomberg Launches Point-in-Time Data Solution that Gives Quants a Competitive Edge

    About the author

    The article was written in May 2024 by Nithisha CHALLA (ESSEC Business School, Grande Ecole Program – Master in Management (MiM), 2021-2024).

    FactSet

    FactSet

    Nithisha CHALLA

    In this article, Nithisha CHALLA (ESSEC Business School, Grande Ecole Program – Master in Management (MiM), 2021-2024) presents FactSet, which provides financial data, news and analytics for the financial community.

    Introduction

    FactSet also known as FactSet Research Systems Inc. is a leading provider of financial data and analytics solutions, catering to professionals in the investment industry. Whether you are a financial analyst, portfolio manager, or student of finance, FactSet offers powerful tools and resources to analyze markets, evaluate companies, and make informed investment decisions.

    Logo of Factset
    Logo of Factset
    Source: Factset

    History

    Founded in 1978 by Howard Wille and Charles Snyder, FactSet began as a startup aiming to revolutionize financial data analysis. The company initially focused on providing financial analysis software for investment professionals, aiming to streamline data processing and analysis in the rapidly evolving financial industry.

    Throughout the 1980s and 1990s, FactSet expanded its product offerings and market presence, catering to a growing demand for sophisticated financial data and analytics solutions. In its journey of growth and expansion, FactSet has made several strategic acquisitions to enhance its product portfolio and expand its market reach.

    In 2007, FactSet acquired Market Metrics, a provider of market research and consulting services for asset managers. In 2015, FactSet acquired Portware LLC, a leading provider of multi-asset trade automation solutions for asset managers and institutional traders. In 2020, FactSet acquired Truvalue Labs, a pioneer in AI-driven environmental, social, and governance (ESG) data and analytics.

    From its humble beginnings in the late 1970s to its current status as a global leader in financial data and analytics, FactSet has continually evolved to meet the evolving needs of the investment community.

    Key Components of FactSet Research Systems

    Earnings Estimates

    Earnings estimates refer to predictions made by financial analysts and experts regarding how much profit a company is expected to generate in the future.FactSet gathers and provides these estimates, which are crucial for investors and analysts to assess a company’s potential performance.

    According to Factset, 2024, the company’s consensus estimates are aggregated from a wide base of contributors and cover 19,000+ active companies across 90+ countries.

    Revenue Projections

    Revenue projections indicate how much revenue a company is expected to generate over a specific period. FactSet’s revenue projections are based on industry trends, market conditions, and company-specific factors, providing users with valuable insights into sales performance and revenue drivers.

    For example, in June 2024, Factset released an expected revenue projection for S&P 500 companies stating “The blended (companies that reported and the estimation of the companies yet to report)earnings growth rate for the S&P 500 for Q4 2023 is 3.2%. It should be noted that analysts are currently projecting (year-over-year) revenue growth for all four quarters of 2024. For Q1 2024 through Q4 2024, the current estimates for revenue growth are 3.5%, 4.6%, 5.0%, and 5.7%, respectively.”. This helps stakeholders of the respective industry to analyze, project, and invest accordingly.

    Forecasts for Key Financial Metrics

    In addition to earnings estimates, FactSet offers forecasts for key financial metrics such as revenue growth rates, cash flow projections, and profit margins. These forecasts provide insights into overall financial health and performance metrics, helping users assess business strategies, identify growth opportunities, and make informed investment decisions. By analyzing financial forecasts, users can anticipate market trends and evaluate the potential impact on investment portfolios.

    Coverage

    FactSet covers a wide range of companies across different industries, from large corporations to smaller businesses. This extensive coverage ensures that users have access to comprehensive financial data and insights.

    FactSet provides access to 200+ data items, including 100+ metrics across 18 industries encompassing airlines, banking, insurance, oil/gas, and retail. It leverages estimates that are collected directly from the research reports and flat file feeds of 800+ contributors across 55 countries.

    Period

    Factset has evolved since its introduction in 1978 and in 2023, Factset has expanded its client base to over 7,900 and increased its user base by 6%, surpassing 189,000 users. Factset with over 45 years of history, facilitates top-down analysis to better assess potential growth and risk as well as future value across industry, sector, index, country, and region.

    Frequency

    The period and frequency of forecasts on Factset vary based on user needs and market dynamics. FactSet incorporates quarterly and annual financial reports from companies, including earnings releases, revenue figures, balance sheets, and cash flow statements. Users can access real-time updates and forecasts based on two categories that are data frequency and update frequency, where they provide quarterly data frequency and an intraday update frequency.

    FactSet also includes on a timely basis event-driven updates such as corporate actions (e.g., mergers, acquisitions, dividends) and regulatory filings (e.g., SEC filings), providing comprehensive coverage of market events impacting investment decisions.

    Firms and Financial analysts

    According to James Chen (2023à, FactSet is broken down into three business units: one in the United States, one in Europe, and one in Asia-Pacific. The business unit located in the United States provides financial solutions to financial professionals as well as domestic financial institutions. The European and Asia-Pacific business units only service financial professionals in the regions in which each unit operates.

    As of 2023, FactSet services over 200,000 users in more than 8,000 companies and organizations. FactSet has 37 offices in 20 countries. The company reports it has had a client retention rate of 95% with 43 years of revenue growth.

    Pricing

    FactSet’s pricing model varies based on subscription plans and user requirements. Students can explore different pricing tiers to access specific data sets, analytical tools, and premium features tailored to their academic or research needs. Understanding FactSet’s pricing structure is essential for management students evaluating the cost-benefit of utilizing its services for financial analysis and research purposes.

    FactSet provides its services for a lower price than some of its competitors because the company uses multiple sources to provide its data, which creates pricing competition between suppliers.

    Use of FactSet by the Financial Community

    Benchmark for Analysis

    FactSet serves as a benchmark for financial analysis, offering a comprehensive suite of tools for analyzing companies, industries, and markets. Management students can use FactSet to perform detailed financial modeling, comparative analysis, and valuation assessments, gaining practical experience in fundamental analysis techniques.

    Market Expectations

    FactSet provides access to economic data and forecasts that shape market expectations. Users can track indicators such as GDP growth, inflation rates, unemployment figures, and interest rate projections to anticipate broader economic trends.

    Earnings Season Preparation

    During earnings seasons, by leveraging FactSet’s capabilities, users can navigate earnings announcements with confidence, interpret financial results effectively, and make well-informed investment decisions based on fundamental analysis and market intelligence.

    FactSet and Tests of Market Efficiency

    Academic works

    Academic researchers use FactSet’s extensive database and analytical tools to conduct empirical studies on various topics in finance, economics, and investment management. FactSet’s rich dataset allows researchers to analyze market behavior, asset pricing models, and the impact of economic indicators on financial markets. Researchers use FactSet to assess whether asset prices reflect all available information, conducting event studies and anomaly detection to identify market inefficiencies.

    Information Dissemination

    Information dissemination refers to the process of distributing financial data, market insights, and analytical reports to users within the investment community using FactSet’s platform. FactSet provides real-time market data on stock prices, indices, commodities, currencies, and other financial instruments. Users can access live updates and monitor market movements as they occur, enabling timely decision-making and risk management.

    FactSet disseminates earnings releases, corporate news, and press releases from companies within its coverage universe. Users receive alerts and notifications about important announcements, enabling them to stay informed about company developments and assess potential market impacts.

    Pros and Cons

    Given its history and operations in so many industries and markets, we certainly need to know the pros and cons of the FactSet.

    FactSet provides researchers with access to extensive financial data and analytics, and comprehensive financial data coverage across global markets. FactSet provides a user-friendly interface and intuitive features. It has very well-known powerful tools for financial analysis and investment research.

    On the other side, FactSet subscription costs may limit access to users with limited budgets or in academic institutions with constrained resources. The complexity of mastering advanced functionalities may also present a learning curve for users new to the platform.

    Conclusion

    FactSet impact extends across the financial community, serving as a trusted resource for investors, traders, analysts, and corporate professionals worldwide.

    Why should I be interested in this post?

    As a management master’s student focusing on finance or strategic analysis, understanding and utilizing financial data platforms like FactSet can greatly enhance your skills and career prospects.

    Related posts on the SimTrade blog

       ▶ Aamey MEHTA Market efficiency: the case study of Yes bank in India

       ▶ Louis DETALLE The importance of data in finance

       ▶ Bijal GANDHI Earnings per share

       ▶ Nithisha CHALLA Bloomberg

    Useful resources

    FactSet

    Truvalue Labs

    Wikipedia FactSet

    FactSet FactSet Estimates – Consensus

    FactSet FactSet Annual Report 2023

    FactSet Earnings Insight

    About the author

    The article was written in May 2024 by Nithisha CHALLA (ESSEC Business School, Grande Ecole Program – Master in Management (MiM), 2021-2024).