In this article, Anant JAIN (ESSEC Business School, Grande Ecole Program – Master in Management, 2019-2022) talks about the top 12 FMCG companies around the world.
Introduction
The Fast-Moving Consumer Goods (FMCG) sector makes a vital contribution towards the economy as it comprises of low-cost goods that are sold within a short duration. The sector encompasses items that are purchased for consumption such as food and beverages as well as household and personal care.
Top FMCG companies brands.
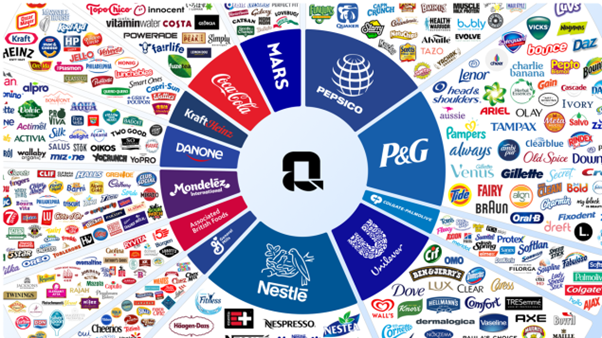
Source: quartr.
This article identifies the top 12 FMCG companies with the highest sales globally focusing on their performance, growth in market share, increases in sales volume and a look at opportunities for growth to potential investors.
#1 Nestlé
Logo of Nestlé.
Source: the company.
Key Figures
- Nationality | HQ: Swiss | Vevey, Switzerland
- Market Capitalization: $350 billion (2024)
- Revenue: $94.4 billion (2023)
- Market Share: Leading player in global food and beverage, with significant shares in categories such as coffee (Nespresso) and bottled water (Poland Spring)
- Sales Growth: 6% increase in sales volume in 2023
Overview
Nestlé is the largest food and beverage company in the world with wide range of products in its basket including dairy, coffee, bottled water, snacks, baby food etc. Its product range includes famous brands like KitKat, Nescafe, and Purina. Nestlé’s strategic emphasis on nutrition, health, and wellness has allowed it to capture significant market share in various segments.
Key Insight
The market capitalization of Nestlé has been increasing by approximately 10% YOY. Almost one-third of the company’s portfolio has been realigned to focus on high growth areas like plant-based foods or wellness products. In addition, the above factors combined with its expenditure on e-commerce and digital marketing have allowed the company to create a wider market enhancing further its growth capacity.
#2 PepsiCo
Logo of PepsiCo.
Source: the company.
Key Figures
- Nationality | HQ: American | Purchase, New York, USA
- Market Capitalization: $250 billion (2024)
- Revenue: $86 billion (2023)
- Market Share: Approximately 29% in the global snacks market
- Sales Growth: 6% increase in sales volume in 2023
Overview
PepsiCo is an American multinational food and beverage corporation holding worldwide famous brands of snacks (such as Lay’s, Doritos), drinks (Pepsi, Mountain Dew), and nutrition products (Quaker Oats). As the company has been quite successful in expanding its product line, more efforts should be invested into developing health-related snack and beverage products.
Key Insight
PepsiCo’s investment into healthy snacks products as of 2023 has contributed a further 10% rise in its snacks unit. The company has also embarked on a $400 million investment targeted towards sustainable solutions which will make it more attractive to consumers and investors who are more eco-friendly. In addition, PepsiCo has also focused on digital marketing strategies, and this has boosted its online sales by 25% compared to the previous year.
#3 Procter & Gamble (P&G)
Logo of Procter & Gamble (P&G).
Source: the company.
Key Figures
- Nationality | HQ: American | Cincinnati, Ohio, USA
- Market Capitalization: $380 billion (2024)
- Revenue: $76 billion (2023)
- Market Share: Approximately 18% in the U.S. household care market
- Sales Growth: 5% increase in sales volume in 2023
Overview
P&G is a leading global consumer goods company specializing in a variety of products across multiple categories, including personal care, cleaning agents, and health care. With a portfolio that includes well-known brands such as Tide, Gillette, and Pantene, P&G maintains a strong presence in both developed and emerging markets. The company has dominantly focused on innovation, sustainability alongside consumer engagement which has made it cope effectively with widening market scope.
Key Insight
Over the last five years, P&G has maintained an impressive Compound Annual Growth Rate (CAGR) of around 5%. The company allocates approximately $1.5 billion a year on R&D with high emphasis on consumer insights and the digital space. This commitment to innovation, coupled with targeted marketing strategies, positions P&G as a formidable player in the FMCG sector.
#4 Unilever
Logo of Unilever.
Source: the company.
Key Figures
- Nationality | HQ: British-Dutch | London, United Kingdom
- Market Capitalization: $250 billion (2024)
- Revenue: $63 billion (2023)
- Market Share: About 13% in the global personal care market
- Sales Growth: 7% increase in sales volume in 2023
Overview
Unilever manufactures a wide range of consumer products in multiple categories including food and beverages, personal care and home care among others. Due to brand names like Dove, Knorr, and Lipton, Unilever has carved a position for itself as one of the leaders in sustainability and social responsibility. The company has now committed to cut its carbon footprint and positively impact the lives of its consumers around the globe.
Key Insight
Unilever’s strategic emphasis on emerging economies has led to a 9% growth in developing regions such as Asia and Africa. The company’s approach of investing in local production facilities and sourcing materials locally has improved its market access in these regions. Besides, Unilever has plans to raise its expenditure on digital and e-commerce platforms to $1 billion in the next few years which will give it an extra advantage in the marketplace.
#5 Coca-Cola
Logo of Coca-Cola.
Source: the company.
Key Figures
- Nationality | HQ: American | Cincinnati, Ohio, USA
- Market Capitalization: $380 billion (2024)
- Revenue: $43 billion (2023)
- Market Share: Approximately 43% in the U.S. carbonated soft drink market
- Sales Growth: 9% increase in sales volume in 2023
Overview
Coca-Cola is one of the pioneers of non-alcoholic carbonated drinks and is a global beverage leader, consisting primarily of Coca-Cola soda beverages. The company’s range extends beyond fizzy drinks and includes many juice, tea, and bottled water brands, with Fanta, Sprite and Dasani the primary products. Aware of changing consumer trends, Coca-Cola has proactively sought to diversify its product assortment to include healthier beverages.
Key Insight
After looking at Coca Cola’s 6% CAGR in the past 3 years, one thing is for sure; the company’s global sales volume has skyrocketed ever since the world was lost to the COVID pandemic. It’s worth noting that Coca-Cola managed to capture sizable portions of the functional market segment by emphasizing introducing healthier options: namely low or no sugar beverages. Also, among the prospects of the company is the significant goal of the company to utilize eco-friendly sustainable materials, allowing the marketer to have at least 50% recycled material in all packaging by the year 2030.
#6 L’Oréal
Logo of L’Oréal.
Source: the company.
Key Figures
- Nationality | HQ: French | Clichy, France
- Market Capitalization: $240 billion (2024)
- Revenue: $39 billion (2023)
- Market Share: Approximately 30% in the global cosmetics market
- Sales Growth: 8% increase in sales volume in 2023
Overview
L’Oreal is a renowned manufacturer and seller of various beauty and cosmetic products such as skincare lines, makeup and hair care products. Brands under its portfolio include Lancôme, Garnier and Maybelline. L’Oreal has an impressive and outstanding record in investment as well as commitment towards the research and development of beauty and skincare lines.
Key Insight
L’Oréal’s direct-to-consumer (DTC) sales have expanded by 35% which indicates that there are emerging changes in the purchasing behavior of the consumers. In addition, the company has set a target of investing $1 billion on sustainability initiatives towards 2025 and this is likely to increase its appeal for socially responsible investors. Moreover, L’Oréal’s focus on inclusivity and diversity in its marketing strategies has further broadened its consumer base.
#7 Danone
Logo of Danone.
Source: the company.
Key Figures
- Nationality | HQ: French | Paris, France
- Market Capitalization: $40 billion (2024)
- Revenue: $28 billion (2023)
- Market Share: Approximately 14% in the global dairy market
- Sales Growth: 6% increase in sales volume in 2023
Overview
Danone specializes in dairy and plant-based products, nutrition for infants and children, and bottled waters. The principal brands include Activia, Evian and Nutrilon. It is worth noting that the company’s special focus on health and nutrition is tantamount to increased health consciousness among consumers.
Key Insight
Danone’s focus on sustainability has led to a 12% increase in its plant-based product sales. The company’s commitment to reducing its carbon footprint has positioned it favorably among environmentally conscious consumers. Danone’s strategic partnerships with health-focused organizations further enhance its market credibility and appeal.
#8 Mondelez International
Logo of Mondelez International.
Source: the company.
Key Figures
- Nationality | HQ: American | New York, USA
- Market Capitalization: $100 billion (2024)
- Revenue: $28 billion (2023)
- Market Share: Leading player in the global snacks and chocolate market, with around 15% market share
- Sales Growth: 5% increase in sales volume in 2023
Overview
Mondelez specializes in snacks, including biscuits, chocolate, and candy. Its portfolio features iconic brands such as Oreo, Cadbury, and Trident. The company has focused on expanding its offerings in premium and organic snack categories, capitalizing on changing consumer preferences.
Key Insight
Mondelez sustains an online sales increase of 25% in 2023 YOY, growing as majority of shopping moves to the online space. Mondelez focus on premium organic and gluten-free snacks has been well received by the market. Mondelez marketing has also paid off as the company has devoted significant resources to promoting its green strategy.
#9 Kimberly-Clark
Logo of Kimberly-Clark.
Source: the company.
Key Figures
- Nationality | HQ: American | Irving, Texas, USA
- Market Capitalization: $50 billion (2024)
- Revenue: $20 billion (2023)
- Market Share: Leading player in personal care, with around 27% in the U.S. diaper market
- Sales Growth: 4% increase in sales volume in 2023
Overview
Kimberly-Clark focuses on the manufacturing and selling of personal care and hygiene products which include Huggies, Kotex, Scott etc. in their range. The company is innovation driven & focus its attention on the preferences of consumers with significant emphasis on sustaining target market in the product.
Key Insight
Kimberly-Clark has seen a consistent growth rate of 4-5% in its personal care division, fueled by increased birth rates in certain regions. The company’s emphasis on innovation and sustainable product lines positions it well for future expansion, with an estimated $250 million investment planned for R&D over the next three years.
#10 General Mills
Logo of General Mills.
Source: the company.
Key Figures
- Nationality | HQ: American | Minneapolis, Minnesota, USA
- Market Capitalization: $50 billion (2024)
- Revenue: $19 billion (2023)
- Market Share: Approximately 15% in the U.S. cereal market
- Sales Growth: 5% increase in sales volume in 2023
Overview
General Mills produces a variety of food products, including cereals, snacks, and meals. Its well-known brands include Cheerios, Betty Crocker, and Häagen-Dazs. The company has focused on innovation and product diversification, adapting to consumer trends toward health and wellness.
Key Insight
General Mills has focused on expanding its portfolio with health-oriented products, leading to a 7% increase in organic sales. The company’s strategic acquisitions and partnerships have strengthened its market position, making it a solid choice for investors looking for steady growth. Furthermore, General Mills has increased its investment in digital marketing, which has proven effective in driving brand loyalty.
#11 Colgate-Palmolive
Logo of Colgate-Palmolive.
Source: the company.
Key Figures
- Nationality | HQ: American | New York City, New York, USA
- Market Capitalization: $65 billion (2024)
- Revenue: $18 billion (2023)
- Market Share: Approximately 40% in the global oral care market
- Sales Growth: 4% increase in sales volume in 2023
Overview
Colgate-Palmolive markets and sells oral care, personal care and household products with great focus on Colgate toothpaste and Palmolive soap. The company highlights innovation and eco- friendly appeal in its products to satisfy the current market needs.
Key Insight
There has been a consistent rise in the growth rate for Colgate to about 4% in emerging markets. These are regions which are beginning to embrace oral care practices. The firm has also made a substantial commitment towards advertising as approximately $700 million was spent in 2023 for increasing the presence and interaction of the brand with the customers. Also, recent actions such as the reduction of plastic use firmly positioned Colgate’s brand to the satisfaction of sustainability priorities.
#12 Reckitt Benckiser
Logo of Reckitt Benckiser.
Source: the company.
Key Figures
- Nationality | HQ: British | Slough, United Kingdom
- Market Capitalization: $55 billion (2024)
- Revenue: $15 billion (2023)
- Market Share: Leading player in health and hygiene, with a 15% share in the disinfectants category
- Sales Growth: 5% increase in sales volume in 2023
Overview
Reckitt Benckiser manufactures health, hygiene and home products and their trademark brands include Dettol, Lysol and Nurofen. The company has focused on expanding its portfolio to include products that address health and hygiene concerns, particularly during and after the COVID-19 pandemic.
Key Insight
Reckitt’s sales of disinfectants surged by 25% during the pandemic, and the company has focused on maintaining this growth by investing in marketing and innovation. The company allocated approximately $500 million in 2023 to design new and innovative products targeting consumer health needs. The position of Reckitt in the forthcoming market after the pandemic period is promising, thanks to the company’s commitment to health and hygiene.
Conclusion
The FMCG sector is still relevant and contributes significantly to the world economy. The companies outlined above are not only involved in high revenue but also increasing their market share and volume of sales on a year-on-year basis. They attract investment opportunities because they present sustainable goods which is the trend among consumers. Such a trend allows investors who want an all-encompassing degree of risk to target these leading FMCG firms as they position themselves for growth in supplying the market through changing demands and maintaining their competitive position worldwide.
Related Posts On The SimTrade Blog
▶ Anant JAIN FMCG Sector: M&A Trends And Its Implications
Useful Resources
NielsenIQ’s FMCG Pulse Report
Market Xcel – Top FMCG Brands of 2024
Technavio FMCG Market Forecast 2024-2028
About The Author
The article was written in November 2024 by Anant JAIN (ESSEC Business School, Grande Ecole Program – Master in Management, 2019-2022).
▶ Read all articles by Anant JAIN.