The investment ecosystem

The investment ecosystem

Nithisha CHALLA

In this article, Nithisha CHALLA (ESSEC Business School, Grande Ecole Program – Master in Management, 2021-2023) explains the investment ecosystem in financial markets.

Introduction

In the investment ecosystem, there are several blocks to understand: market participants, market products, and market organization.

Market participants

Market participants are individuals, companies, financial institutions, and governments. Some of these participants may issue assets like companies (stocks, commercial paper, and bonds) and governments (bonds). Some of these participants may invest in these assets like individuals or pension funds.

Based on the amount they invest, market participants are segregated as big players and small players. Big players are mostly institutional investors which collect the funds and then invest them. Few examples of institutional investors are mutual funds, pension funds, hedge funds, trusts, charities etc. Big players may also be wealthy individuals (high net worth individuals or HNWI) or family offices. Small players are other individual investors.

Corporates run businesses, including manufacturing, service, and technology firms, and they need capital to expand and maintain their operations. On the other side, we have institutions that consist of fund managers that could be institutional investors but also retail investors as well. These are the people that have capital so the capital flows from the institutions or investment managers who have the money to the corporations that need that money to grow and run their business. The cycle between the two parties is completed when the firms issue back to the investor’s bonds, which are classified as debt, or shares, which are classified as equity.

In the middle of these two groups sit the investment banks they are often referred to as the sell side and they have contacts on both sides of these players. They have corporate clients, and they have institutional investor clients, their job is to match up the institutional investors with the corporates based on risk and return assessments and expectations and investment style to get the deal done. In addition, we have public accounting firms which are the fourth player in the market.

Market Products

Assets

What are assets? In financial language, an asset is that which has some economic value. And assuming that its value increases in the future market participants buy them and that is how it is a part of the investment ecosystem. Few examples for assets are fixed deposit, land, gold, stock, etc.

Asset classes are made up of those investments or securities whose characteristics are the same. Few major asset classes are equity, bonds (fixed income), commodities, and real estate.

Instruments

What are Instruments? Instruments are the ways through which we can invest in different asset classes.

Some of the major instruments we see in markets are direct investing, mutual funds, and exchange-traded funds (ETFs).

  • Direct investing is nothing but investing cash physically in different asset classes or we can digitally buy assets through our accounts
  • Mutual funds are the funds collected by multiple investors and then those are invested in different asset classes. To manage these mutual funds, we have fund managers who will invest on behalf of investors.
  • ETFs are nothing but a basket of securities just like mutual funds, but the only difference is they are traded on stock exchanges.

Market organization

Primary and secondary markets

The primary markets: the initial issuance of assets

The primary market is where new securities, including stocks, bonds, and other financial assets, are first issued by governments or corporations. The primary market is also referred to as the market for new issues.

Companies and governments raise money in the primary market by offering their securities to retail or institutional investors. The securities may be sold through a private placement or an initial public offering (IPO).

There are four main players in the primary market mainly for issuance of securities.
1) Corporates
2) Investors: institutional investors and individual investors
3) Corporate banks
4) Public accounting firms

The secondary markets: the exchange of assets

In the secondary market, fund managers and banks collaborate to trade securities between investors after they have already been issued. On one side, a fund manager may want to purchase securities of a public company, while on the other, a different fund manager may wish to sell those same securities. Investment bankers come between these clients to help facilitate these trades, and this trade is facilitated over the stock exchange. They provide equity research coverage to help fund managers make decisions about buying and selling those securities. And this secondary market trading makes markets liquid. This is what allows you to get in and out of security very easily.

Market infrastructure

Infrastructure providers are the companies which enable the transactions and functioning of different instruments. It means all the digital and physical infrastructure required for the investor is provided by the infrastructure provider. The few common examples of an infrastructure provider are the stock exchange, depositories, and registrar and transfer of agents.

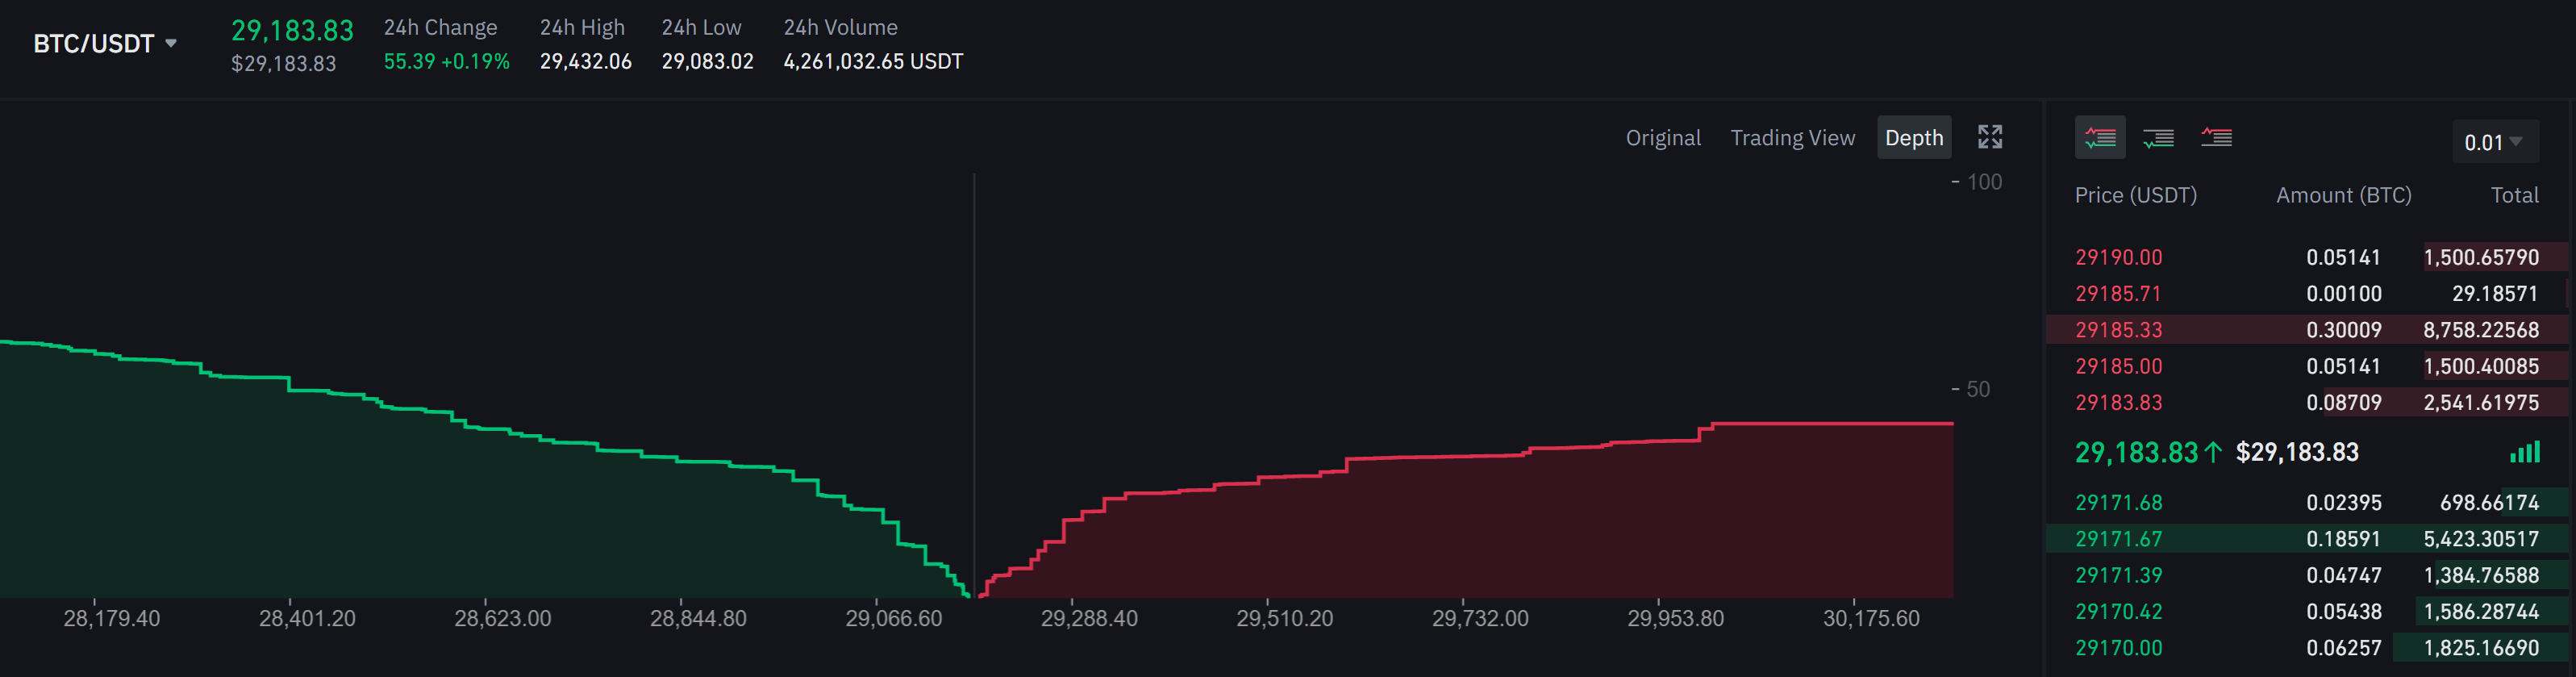
  • Stock exchange: It is the platform where you can sell and buy securities. Here, with the help of a broker and the stock exchange two investors can buy and sell stocks without knowing each other. For example, The TSE is the largest stock exchange in Asia by market capitalization. It is located in Tokyo, Japan and has over 3,500 listed companies.
  • Depositories: These are the companies that store the stocks we buy in electronic form. We can store these stocks through our demat accounts. Depositories help you transfer stock and various other functions like checking the statements, portfolio holdings and transaction information etc. Generally investors directly do not interact with depositories but they approach through a broker who would invest on their behalf. For example: The DTC is one of the largest depositories in the world. It is located in New York City and holds over 3.5 million securities worth trillions of dollars.
  • Registrar and Transfer of Agents (RTA): just like depositories in case of stocks, RTA’s in case of mutual funds. All trades of mutual funds like subscription, redemption, and transfer, are recorded by an RTA. An RTA also helps mutual fund investors in providing their portfolio and statements to them.

Why should I be interested in this post?

As a student and prospective business management graduate, I think it is important to know the investment ecosystem. Firstly, investments play a vital role in the growth and success of companies. Companies need investments to fund their operations, expand their businesses, and create value for their shareholders. Therefore, understanding the investment ecosystem will enable management students to make informed decisions regarding investments that can help drive the growth of the companies they work for or manage in the future.

Related posts on the SimTrade blog

All posts about financial techniques

   ▶ Marie POFF Film analysis: The Wolf of Wall Street

Useful resources

McKinsey (2017) Capital Markets Infrastructure: An Industry Reinventing Itself

Black rock The Investment Stewardship Ecosystem

About the author

The article was written in March 2023 by Nithisha CHALLA (ESSEC Business School, Grande Ecole Program – Master in Management, 2021-2023).

High-frequency trading and limit orders

High-frequency trading and limit orders

Clara PINTO

In this article, Clara PINTO (ESSEC Business School, Master in Strategy & Management of International Business (SMIB), 2020-2023) explains about high frequency trading in a dynamic limit order market.

What is High-frequency trading (HFT)?

While the adage “time is money” applies to almost all economic operations, the rapid spread of computerized trading has carried this quote to its final extreme. High-frequency trading (HFT) is a type of algorithmic trading that relies on advanced computer programs to make trading decisions and execute trades in a matter of milliseconds. HFT has become increasingly popular in recent years, particularly in dynamic limit order markets (“A dynamic limit order market with fast and slow traders”, European Central Bank), where the bid and ask prices of securities are constantly changing. This allows them to take advantage of small price discrepancies in the market and generate profits on a large scale, this method known as statistical arbitrage, involves traders looking for temporary pricing inconsistencies across different exchanges and capitalize on it, using ultra-fast transactions.

What Exactly Is a Limit Order?

A limit order is an instruction to buy or sell a security at a specified price or better. For example, a trader may place a buy limit order for a stock at $50, meaning he or she is willing to buy the stock only if it is available at that price or lower. Similarly, a sell limit order may be placed at $60, meaning the trader will sell the stock only if the price is at that level or higher.

HTF and Limit Order

High-frequency trading (HFT) and limit orders are closely linked, as HFT traders often rely on limit orders to execute their trades. In fact, limit orders are a key component of many HFT trading strategies. HFT traders often use limit orders in conjunction with advanced algorithms to identify market trends and execute trades at lightning-fast speeds. They may place many limit orders at various prices to take advantage of small price movements in the market and use sophisticated algorithms to determine the best time to execute their trades.

However, the use of limit orders in HFT trading can also have downsides. For example, the large number of limit orders placed by HFT traders can lead to increased volatility in the market, as these orders can cause sudden price movements, for example flash crash when the prices of stocks or commodities suddenly plunges but then quickly recovers. Hence, the use of limit orders in HFT trading can also have downsides, and it is important for regulators to monitor HFT activity and ensure that it does not cause market instability or unfair trading practices.

Why should I be interested in this post?

For many business school students, finance and trading are part of the most preferred jobs. Understanding the trends in high-frequency trading is now a requirement for future institutional investors. Being quick allows traders to adjust outstanding limit orders in response to news arrivals when working with “slow” market players who experience a relative loss in bargaining power, leading them to strategically submit limit orders with a lower execution probability, limiting trade.

Related posts on the SimTrade blog

   ▶ Akshit GUPTA High-frequency trading

   ▶ Shruti CHAND High-frequency trading: pros and cons

   ▶ Akshit GUPTA Analysis of The Hummingbird Project movie

   ▶ Federico DE ROSSI Understanding the Order Book: How It Impacts Trading

Useful resources

SimTrade course Exchange orders

Hoffmann P. (2013) A dynamic limit order market with fast and slow traders European Central Bank Working Paper Series.

Lewis M. (2015) Flash boys Norton & Company.

About the author

The article was written in March 2023 by Clara PINTO (ESSEC Business School, Master in Strategy & Management of International Business (SMIB), 2020-2023).

Strategy and Tactics: From military to trading

Strategy and Tactics: From military to trading

Clara PINTO

In this article, Clara PINTO (ESSEC Business School, Master in Strategy & Management of International Business (SMIB), 2020-2023) shares her insights as a former military analyst on strategy and tactics applied to trading.

IRSEM: The Institute for Strategic Research at the Military School

Created in 2009, IRSEM is the strategic research institute of the French Ministry of Armed Forces and operates under the supervision of the Directorate General for International Relations and Strategy (DGRIS) operating under the umbrella of the Ministry for the Armed Forces. IRSEM is home to a staff of about forty civilian and military permanent researchers. The Institute seeks to foster the emergence of a new generation of researchers specialized in security and defense issues.

Logo of IRSEM.
Logo of IRSEM
Source: IRSEM.

From military to Finance: Strategy and tactics applied to trading

My experience as an analyst in a military Think tank required me to learn the basics of military strategy and tactics. The distinction between strategy and tactics is frequently stated as “strategy is long-term, whereas tactics are short-term.” While the two terms may exhibit similar qualities at times, it is an erroneous and partial explanation of their definitions.

Chinese General Sun Tzu wrote the difference this way: “All the men can see the tactics I use to conquer, but what none can see is the strategy out of which great victory is evolved.”

However, even if strategy and tactics are also used in business, their principles still apply in the trading context. Indeed, successful trading requires a solid understanding of both strategy and tactics. In this article, we will explore the differences between these two concepts and how they can be applied to trading.

Strategy refers to a long-term plan that outlines how you will achieve your trading goals. It involves identifying your objectives, assessing the risks and opportunities in the market, and deciding on a plan of action. A good trading strategy should be flexible enough to adapt to changing market conditions, but also structured enough to provide a clear path forward. One key aspect of a trading strategy is risk management. This involves identifying the potential risks associated with a particular trade and taking steps to mitigate them. This might involve setting stop-loss orders to limit potential losses or diversifying your portfolio to reduce the overall risk. A good trading strategy should also take into account the amount of capital you have available to trade with, as well as your risk tolerance and investment goals.

Tactic, on the other hand, refers to the specific actions you take to implement your trading strategy. These might include analyzing technical indicators to identify trends and patterns to assess the value of a particular asset. A successful trading tactic will depend on a number of factors, including the specific asset you are trading, and the current market conditions.

Ultimately, the success of your trading will depend on how well you are able to combine strategy and tactics. A strong strategy will provide a clear framework for making decisions and managing risk, while effective tactics will allow you to execute that strategy in a way that maximizes your returns. In order to develop a successful trading strategy, it is important to conduct thorough research and analysis of the markets you are interested in. This might involve studying historical market trends, analyzing economic and political factors that could impact the markets, or keeping up to date with news and events that could affect the value of specific assets. It is also important to remember that trading involves a degree of risk, and no strategy or tactic can guarantee success. However, by developing a strong strategy and using effective tactics to execute that strategy, you can improve your chances of making profitable trades over the long term.

In conclusion, strategy and tactics are both essential components of successful trading. A strong trading strategy provides a clear framework for decision-making and risk management, while effective tactics allow you to execute that strategy in a way that maximizes your returns. By combining careful research and analysis with disciplined execution, you can increase your chances of success in the complex and ever-changing world of trading.

Why should I be interested in this post?

Unfortunately, the concepts of strategy and tactics are often mixed up and not entirely understood. However, they provide a good framework to trade in the long term and structure your choices in the decision-making process.

Related posts on the SimTrade blog

   ▶ Momentum Trading Strategy

Useful resources

IRSEM – The Institute for Strategic Research

About the author

The article was written in March 2023 by Clara PINTO (ESSEC Business School, Master in Strategy & Management of International Business (SMIB), 2022-2023).

Investment is a flighty bird which needs to be controlled

“Investment is a flighty bird which needs to be controlled”

Clara PINTO

In this article, Clara PINTO (ESSEC Business School, Master in Strategy & Management of International Business (SMIB), 2020-2023) comments on a quote by Sir John Richard Hicks about investing.

Investment is a flighty bird which needs to be controlled

“Investment is a flighty bird which needs to be controlled” is a famous quote from Sir John Richard Hicks.

This quote means that investment is unpredictable and can easily change direction or fly away, so it needs to be managed or controlled carefully. Just like a bird, investment can be difficult to catch and keep in one place, so investors need to constantly monitor and adjust their strategies to ensure that their investments are secure and profitable. Without proper control over the portfolio and monitoring of the news, an investor can make decisions which could be risky and lead to financial losses.

About the author

The author is a British neo-Keynesian theorist and considered as one of the most influential economists of the XXth century.

Financial concepts related to the quote

It is important to understand the risks associated with investing before making any investment decisions. It is also important to diversify your portfolio by investing in a variety of different assets, to minimize the risk of losses due to the failure of any single investment. Additionally, investors should consider their investment goals, time horizon, and risk tolerance when making investment decisions. Some common risks associated with investing include:

  • Market Risk: The possibility of losing money due to the fluctuations in the stock market, commodity prices, or interest rates.
  • Credit Risk: The risk of losing money when a borrower fails to repay a loan or debt.
  • Inflation Risk: The risk that the purchasing power of your investments will decrease due to inflation.
  • Liquidity Risk: The risk that an investment cannot be sold quickly enough to avoid a loss.
  • Operational Risk: The risk of losing money due to errors, fraud, or other operational problems.

My opinion about this quote

I like this quote because today, many successes such as the Pinduoduo investment story about investment are shared (see the article “five investing success stories from five international women”), but without the proper knowledge and understanding of the risks, the loss that can occur is often underestimated.

Why should I be interested in this post?

As many business students are advised to invest early in their careers, and many are offered the chance to do it with money that they did not earn by themselves, this quote shall remind them of the consequences of bad decision making and the risks.

Related posts on the SimTrade blog

   ▶ All posts about Quotes

Useful resources

4 Real Risks Of Investing (And What To Do About Them)

Five Investing Success Stories from Five International Women

Pin Duo Duo

About the author

The article was written in March 2023 by Clara PINTO (ESSEC Business School, Master in Strategy & Management of International Business (SMIB), 2022-2023).

My experience as a leisure tourism management assistant in the French Tourism Development Agency

My experience as a leisure tourism management assistant in the French Tourism Development Agency

William LONGIN

In this article, William LONGIN (EDHEC Business School, Global BBA, 2020-2024) shares his experience as a leisure tourism management assistant at Atout France USA, which is the French Tourism Development Agency in the United States of America.

Atout France

Atout France is the official French National Tourism Development Agency. It is a government agency responsible for promoting France as a tourism destination to visitors and tourism professionals (tour operators and travel agents) from around the world.

Logo of the Atout France.
Logo of Atout France
Source: Atout France.

Atout France was created in 2009 through the merger of three existing organizations that focused on tourism promotion: Maison de la France, ODIT France, and France Tourism Development Agency. The name Atout France comes from “Atout” meaning asset and “France” the nation that it services. The agency’s main mission is to develop and implement strategies for promoting France as a tourism destination by working with French companies and tourism professionals from around the world. We will explore the strategies used by Atout France in more depth in this article.

Atout France objectives are set by the French government and reflect the needs of French businesses in the tourism sector. To attain the objectives set by the government, Atout France organizes and attends multiple business-to-business (B2B) events to create visibility and encourages French networking. Another key objective set by the French government is promoting the new offers for sustainable tourism called eco-tourism, still overlooked by many international travelers. For example, Atout France in the United States launched an e-learning platform covering eco-tourism in France.

I interned in the branch of Atout France located in New York, as a “leisure tourism manager assistant”. As a foreign worker in the United States, I was granted a diplomatic A2 Visa for my internship. Kind of cool! My experience in New York was really valuable in addition to the experience I had in the company as I was able to make many friends and discover the city through a new lens (a worker and not a tourist). Indeed New York is home to many international institutions such as the United Nations, many consulates, and schools such as New York University (NYU) and Columbia University. New York, also called the Melting Pot, has a developed French community and culture particularly in the areas of art, cuisine, and fashion. The numerous French restaurant venues in the city allows Atout France to showcase French cuisine when organizing events. We could almost call French restaurants the culinary consulates of France in New York!

My personal experience at Atout France

My experience at Atout France USA was very valuable as I learned about company culture, the tourism industry and about the various software used by the company.

My experience of the company culture and workplace at Atout France USA is very positive. As an intern I have been well received and helped in the beginning of my internship. However, I realized very early on that in order to be useful it was important to be proactive. I cannot emphasize enough on the word ‘proactive’ because it is central to understanding how to be a useful coworker in the trade and events department of the company. I learned that it is important to ask questions about tasks, especially that you could be unfamiliar with as an intern. For example, when building the slide show for an internal proposition I made, I went in a freestyle but learned afterwards that there was a corporate template that was essential to respect in order to keep things more organized.

The tourism industry was a completely new industry for me as I have never interned or leaned towards a career in this sector before. What attracted me the most for this internship was to learn more about the industry, have the opportunity to work in New York and serve the nation of France. Throughout my internship I learned about jobs and vocabulary that I was unfamiliar with before such as what travel writers do, what is MICE (which is an acronym for business tourism), or what is eco-tourism. My time in the industry allowed me also to learn about the importance of networking events for professionals and their ways of communicating. Overall, my experience at Atout France encouraged me to learn more about the different forms of tourism and how professionals operate.

The large number of valuable contacts (from the United States and from France) that Atout France possesses is a key asset that adds value for the local and French companies interested in developing businesses. In order to organize its contacts, Atout France uses a Customer Relation Management tool (CRM) called HubSpot. HubSpot is a cloud-based software platform that provides marketing, sales, and customer service tools for businesses. In the case of Atout France, the main purpose is to store data about its contacts. Data about area, domain of expertise and level of engagement with the company are useful for selectively picking the most adequate contacts when organizing events. For example, amongst the tour operator companies of the network, only a segment of them is already selling French packaged trips. This segment of tour operators is interesting for French companies because they already have an interest in the country and are more likely to create more deals or tailor new offers. Throughout my internship I was taught to get accustomed with the use of the software for searching information, creating spreadsheets for business analytics and creating invite lists for events.

Core missions and duties

Event planning

Part of my responsibilities as an intern at Atout France USA were to contribute to organizing events by finding venues, inviting business representatives and communicating with our clients to best build the event according to their needs. Atout France USA organizes events for its local partners and French institutions to increase their visibility on the American market and meet travel professionals that could be interested in doing business with them. Generally, the size of events ranges from dinners with 10 guests to larger events going over 100 guests. As an intern it was my duty to look for appropriate venues matching the style, theme, and logistical capability of the venue according to the needs of the client.

Market research

As part of my duties as an intern I was asked to perform market research for various missions notably to contribute to the updating of the market presentation of the United States created and regularly updated by Atout France. Atout France puts an emphasis on design and credibility of sources when gathering data. Performing such research is very enriching as it allows you to have a better understanding of the industry and analyze the industry better.

Must do tasks – Mindset

When preparing an event, there were many manual tasks that needed to be done. For example, it was imperative to set up the event space with a well-thought decor, and other necessary equipment. When preparing for the event it also involved managing vendors by making sure they delivered food, beverages, audio-visual equipment, or other services. During events interns were often asked to handle registration and troubleshooting during the event by handling any issues that arise, such as technical difficulties or unexpected changes to the schedule.

Required skills and knowledge

To perform well as an intern at Atout France in New York, there are several prerequisites that you should consider such as strong communication skills. Interns are asked to communicate with different stakeholders, including industry professionals, tourists, and colleagues. Therefore, having the ability to clearly communicate and proactively ask questions is a must. Knowledge of the French language is an excellent plus for talking to partners. It can ease communication and make it easier for both French and American partners. Familiarity with the events and tourism industry is largely valued by Atout France as it is a good indicator for adaptability. Atout France has a dynamic workplace, and as an intern, you may have to manage multiple tasks simultaneously so having good time management and a sense of organization can come in very handy.

Learned skills and knowledge

During my internship I have improved and worked on my hard skills and soft skills. Hard skills such as my knowledge of the industry, learned how to use HubSpot, perform market research in the tourism industry. Soft skills such as flexibility during events, bilingual communication and team empathy skills.

Key concepts

Cultural awareness

Cultural awareness is the ability to recognize and appreciate different cultures, values, and beliefs. It involves understanding and respecting differences between cultures and being able to navigate and communicate effectively with people from different backgrounds. Cultural awareness also involves recognizing one’s own biases and assumptions and being open to learning from and about different cultures. Cultural awareness involves developing attitudes of respect, openness, and curiosity toward other cultures, which can help to build stronger relationships and promote mutual understanding. When performing missions it is important to take into account the image that Americans have of France.

Customer Relationship Management (CRM)

Customer Relationship Management (CRM) tool is a tool that organizations use to manage and analyze their interactions with customers and improve customer relationships. CRM involves collecting and analyzing customer data from various sources, including sales, marketing, and customer service, to gain insights into customer behavior, preferences, and needs. The CRM was a very useful tool for analyzing email opening rates, network contracting and marketing data.

Ecotourism

Ecotourism is a type of tourism that focuses on responsible travel to natural areas that conserve the environment and improve the welfare of local communities. Ecotourism examples are visiting and experiencing natural areas, such as national parks, wildlife reserves, and cultural sites, while minimizing the negative impact on the environment and supporting local communities. Ecotourism is also characterized by responsible travel practices, such as reducing waste, etc.

Ecotourism is of growing interest to France in its pioneering mission of the eco touristic industry and carbon neutral objectives for 2030. At the same time ecotourism can provide economic benefits to the local community by promoting conservation efforts by providing financial incentives for protecting natural resources and wildlife.

MICE

MICE is an acronym that stands for Meetings, Incentives, Conferences, and Exhibitions. It refers to a type of tourism that involves the organization and hosting of business events, such as conferences, seminars, trade shows, exhibitions, and meetings. MICE tourism is a growing industry that often involves large groups of people traveling to a specific destination for a specific purpose, such as attending a conference or meeting.

MICE tourism is of interest to Atout France as it provides significant economic benefits such as revenue for French hotels, restaurants, transportation providers, and other businesses.

Travel Agent VS Tour Operator

A travel agent is an intermediary that personally helps clients plan and book their travel arrangements. On the other hand, a tour operator specializes in organizing and selling complete travel packages, which may include transportation, accommodations, meals, and activities. Both professions are both of interest to Atout France as a majority of Americans use their services to plan their travel to Europe.

B2B and B2C

B2B and B2C are abbreviations for “Business to Business” and “Business to Consumer” respectively. Indeed, different companies rely on different business models. Relations and commerce with different customers change the way companies do business. At Atout France, the company’s services are for companies, so it operates on a B2B model when organizing events. However, Atout France also interacts with the public through marketing campaigns. Whether that interaction is a B2C is arguable because the “product” sold by Atout France is the whole nation of France and the operation is made in the nation’s interest rather than in the businesses’ interest as the income gained from such an operation is not directly earned from the consumer.

Why should you be interested in this post?

My article about my experience as an intern for Atout France in New York should be of great interest to people who are interested in the travel and tourism industry, as well as those who are considering pursuing an internship or career in this field. The article provides valuable insights into what it’s like to work for a destination marketing organization and gives a behind-the-scenes look at the operations of Atout France in New York. Readers can learn about the different departments and functions within a tourism development agency, as well as the challenges and opportunities that come with working in this field. Readers can also learn about the vocabulary, skills and qualities that are important to excel in this industry.

Word of conclusion

In conclusion, my experience as an intern at Atout France in New York was an incredibly valuable opportunity for me. I had the chance to work with a talented and dedicated team, passionate about promoting France as a premier travel destination.

During my internship, I gained valuable insights into the operations of the government in the tourism area abroad and learned about the different strategies and tactics used to promote tourism. I had the chance to work on a variety of projects, from developing marketing materials to conducting research and analysis on industry trends.
Throughout my internship, I was impressed by the level of professionalism and expertise demonstrated by the Atout France team. I also had the chance to network with industry professionals and attend industry events, which provided me with valuable connections and insights into the travel industry.

Overall, my internship at Atout France in New York was an incredible learning experience and a valuable steppingstone in my career. It has provided me with a strong foundation in destination marketing and tourism. I would highly recommend an internship with Atout France to anyone who is passionate about travel and tourism and looking to gain valuable insights and experiences in this industry.

Related posts on the SimTrade blog

   ▶ All posts about Professional experiences

   ▶ Nithisha CHALLA My experience as a Risk Advisory Analyst in Deloitte

   ▶ Alexandre VERLET My experience as an investment banking analyst intern at G2 Capital Advisors

Useful resources

Atout France Organization website

Atout France USA LinkedIn group

HubSpot Firm website

About the author

Article written in March 2023 by William LONGIN (EDHEC Business School, Global BBA, 2020-2024).

Difference between a merger and an acquisition

One of my colleagues at ESSEC Business School, Rick MARCHESE, is teaching the Mergers and Acquisitions (M&A) course in the Master in Finance on Singapore campus.

He was asked at the beginning of the course what the difference was between a merger and an acquisition.

His answer was: “If you are the buyer, it’s an acquisition. If you are the target, it’s a merger.”

With the recent events in the financial sector, he recently had a great illustration for his definition from two very credible sources…

Press release by UBS
UBS Press release
Source: UBS.

and

Press release by Credit Suisse
UBS Press release
Source: Credit Suisse.

The business of financial indexes

The business of financial indexes

Nithisha CHALLA

In this article, Nithisha CHALLA (ESSEC Business School, Grande Ecole Program – Master in Management, 2021-2023) explains the business of financial indexes.

Introduction

Indexes are frequently used in the financial sector to measure the evolution of market prices for a set of financial assets over time. These sets of assets can be defined to represent an asset class, country or geographical zone, or sector of the economy, and provide a comprehensive and accurate overview of the market.

Financial indexes serve as a benchmark for assessing the performance of an investor’s asset portfolio and give investors a way to monitor the performance of a given set of assets. By using financial indexes, investors can gain knowledge of market trends and conditions and make informed investment decisions. Index providers are responsible for creating and maintaining financial indexes.

Financial indexes can be developed to track particular geographical areas or market segments and can be created for a variety of asset classes, including equities, bonds, commodities, and currencies. Financial indexes are primarily provided by specialized companies with experience in data compilation and index value calculation, such as S&P Dow Jones Indices, MSCI, and FTSE Russell. Overall, the business of financial indexes is a critical component of the financial industry, providing valuable data and insights to investors.

Key Players

Index providers

An index provider is a specialized business that specializes in developing and computing market indices as well as licensing its intellectual property to be used as the foundation of passive products. The index providers are essential to the investment professionals in charge of looking after these assets because they provide reliable data distribution, sound index construction, and strict index maintenance. The primary activities of an index provider are product development, licensing, distribution, and related service and support.

Index Industry Association (IIA)

The production of indexes has become an industry! And every industry has a professional association. The index industry is no exception. The Index Industry Association (IIA) was founded in 2012. Some of the founding members are MSCI and S&P Dow Jones Indexes.

As stated on the IIA website, the association mandate is “to educate investors on the attributes and role of indexes within the investment process, to advocate for the interests of index users and providers worldwide, and to push for industry standards of best practice, independence and transparency”.

Business models

Index providers typically employ one of the following business models to make money from their indexes: licensing, creating index-linked products, getting charged for index inclusion, and selling data for index-related research and analysis.

Licensing

Index providers make money by licensing financial institutions like asset managers, banks, and insurance companies to use their indexes. These financial institutions pay a fee to the index provider for the right to use the indexes as a benchmark for their investment products, such as exchange-traded funds (ETFs) and index funds.

Creation of index-linked products

Index providers make money by developing their own index-linked products, such as index funds and ETFs. The investors that are invested in the product pay a management fee to the index provider.

Selling data

By selling the data that has been produced from the history, research, and analysis, the index providers make money.

Regulation of indexes

Index providers build and maintain indexes. In order to ensure that the index accurately reflects the performance of the market or sector it is meant to represent, they are in charge of defining the methodology used to construct the index, choosing the stocks or bonds included in the index, and performing routine index rebalancing.

Beyond the activity of index providers, financial authorities play a role to authorize indexes. The main objective of authorization is to safeguard investors who use the index as a benchmark for their investment decisions and to make sure that the index accurately reflects the performance of the market or sector it is meant to represent. In the United States, the US Securities and Exchange Commission (SEC) has the power to approve specific indexes that serve as the foundation for exchange-traded funds (ETFs) and other investment products. This is done to make sure that these products operate in the best interests of investors and are compliant with SEC regulations.

Why should I be interested in this post?

A wide range of professionals, including portfolio managers, investment advisors, and financial analysts, use financial indexes, which are a crucial part of the financial sector. Financial indexes change over time to take into account adjustments to the economy and market conditions.

You can stay on top of the curve and adjust to changes in the industry by staying informed of the most recent financial index developments. So, in my opinion, studying the business of financial indexes can give business students useful skills and knowledge that they can use in a variety of fields and jobs.

Related posts on the SimTrade blog

About financial indexes

   ▶ Nithisha CHALLA Financial indexes

   ▶ Nithisha CHALLA Calculation of financial indexes

Examples of financial indexes

   ▶ Nithisha CHALLA The S&P 500 index

   ▶ Nithisha CHALLA The Euro Stoxx 50 index

   ▶ Nithisha CHALLA The FTSE 100 index

   ▶ Nithisha CHALLA The CSI 300 index

   ▶ Nithisha CHALLA The Nikkei 225 index

Useful resources

Index Industry Association (IIA)

S&P Global Who’s Behind the Index?

Committee for Economic Development of The Conference Board (CED) The Financial Index Industry

K&L Gates SEC solicits comments on whether index providers, model portfolio providers, and pricing services are investment advisers: seeking a problem for a “solution”

About the author

The article was written in March 2023 by Nithisha CHALLA (ESSEC Business School, Grande Ecole Program – Master in Management, 2021-2023).

The S&P 500 index

The S&P 500 index

Nithisha CHALLA

In this article, Nithisha CHALLA (ESSEC Business School, Grande Ecole Program – Master in Management, 2021-2023) presents the S&P 500 index and details its characteristics.

The S&P 500 index

The performance of 500 major capital companies listed on the US stock exchange is summarized by a financial index called the S&P 500 index. The stocks of the S&P 500 index are traded on the New York Stock Exchange and NASDAQ, which are the two major stock exchanges in the United States of America. This index serves as a benchmark for the American stock market and investors use it to monitor the performance of the market. The selection of 500 stocks only is deemed enough to represent the stock market (in terms of market capitalization).

The S&P 500 index was first established by Standard & Poor’s, a provider of financial services, on March 4, 1957. In order to provide a comprehensive assessment of the U.S. stock market, the index consists of a range of large-capital businesses from various industries and sectors. The S&P 500 index is currently managed by the index provider S&P Dow Jones Indices (a division of S&P Global).

Who makes the shortlist of the index and how the field is narrowed down? The S&P Dow Jones Indices oversees the selection procedure for index inclusion. The public float, financial viability, market capitalization, and a diverse representation of the US stock market—including technology, healthcare, financials, consumer goods, etc.—are some of the key criteria used to define the composition of the index.

How is the S&P 500 index represented in trading platforms and financial websites? The ticker symbol used in the financial industry for the S&P 500 index is “SPX”.

Table 1 gives the Top 10 stocks in the S&P 500 index in terms of market capitalization as of January 31, 2023.

Table 1. Top 10 stocks in the S&P 500 index.
Top 10 stocks in the S&P 500 index
Source: computation by the author (data: YahooFinance! financial website).

Table 2 gives the sector representation of the S&P 500 index in terms of number of stocks and market capitalization as of January 31, 2023.

Table 2. Sector representation in the S&P 500 index.
Sector representation in the S&P 500 index
Source: computation by the author (data: YahooFinance! financial website).

Calculation of the S&P 500 index value

The S&P 500 index is a value-weighted index (also called a market-capitalization- weighted index). This means the larger companies have a greater impact on the index than the smaller companies.

At the end of each trading day the value of the S&P 500 index is determined in real-time and can be used as a benchmark for the performance of the index’s constituent companies’ current market prices.

The formula to compute the S&P 500 index is given by

SP500 Index value

where I is the index value, k a given asset, K the number of assets in the index, Pk the market price of asset k, Nk the number of issued shares for asset k, and t the time of calculation of the index.

In a S&P 500 index, the weight of asset k is given by formula can be rewritten as

SP500 Index Weight

which clearly shows that the weight of each asset in the index is its market capitalization of the asset divided by the sum of the market capitalizations of all assets.

The divisor, whose calculation is based on the number of shares, is typically adjusted for events such as stock splits and dividends. The divisor is used to ensure that the value of the index remains consistent over time despite changes in the number of outstanding shares.

Note that there are two versions of the S&P 500 index: one which includes the performance of the company as well as the dividends the companies pay (so it is a dividend included index), and another one which only considers the performance of the company but does not consider the dividends.

Use of the S&P 500 index in asset management

Given that the index is used for performance measuring it is widely used for constructing and analyzing investment portfolios. This index’s primary use is to create investment strategies, mitigate risk, and assess portfolio performance. Investors and asset managers utilize this index as an useful index to measure the overall performance of the market.

Benchmark for equity funds

There are a number of indices used as a benchmark for equity funds but the S&P 500 index particularly focuses on the large capped companies in the US market. It is mainly differentiated by the asset class the index is focusing on and the investment strategies followed by the companies. For Example: DJIA uses price weighted stock strategy for the top 30 blue chip companies, whereas the NASDAQ Composite Index uses market capitalization-weighted index of more than 3,000 stocks in the NASDAQ Composite.

Financial products around the S&P 500 index

There are a number of financial products that either provide exposure to the index or use information from the index. Not just the index funds but there are numerous ETFs and specific sector related indices which provide exposure to the S&P 500 index. Other financial products would be mutual funds, futures and options etc.

Historical data for the S&P 500 index

How to get the data?

The S&P 500 index is the most common index used in finance, and historical data for the S&P 500 index can be easily downloaded from the internet.

For example, you can download historical data for the S&P 500 index from December 30, 1927 on Yahoo! Finance (the Yahoo! code for S&P 500 index is ^GSPC).

Yahoo! Finance
Source: Yahoo! Finance.

You can also download the same data from a Bloomberg terminal.

R program

The R program below written by Shengyu ZHENG allows you to download the data from Yahoo! Finance website and to compute summary statistics and risk measures about the S&P 500 index.

Download R file

Data file

The R program that you can download above allows you to download the data for the S&P 500 index from the Yahoo! Finance website. The database starts on December 30, 1927. It also computes the returns (logarithmic returns) from closing prices.

Table 3 below represents the top of the data file for the S&P 500 index downloaded from the Yahoo! Finance website with the R program.

Table 3. Top of the data file for the S&P 500 index.
Top of the file for the S&P 500 index data
Source: computation by the author (data: Yahoo! Finance website).

Summary statistics for the S&P 500 index

The R program that you can download above also allows you to compute summary statistics about the returns of the S&P 500 index.

Table 4 below presents the following summary statistics estimated for the S&P 500 index:

  • The mean
  • The standard deviation (the squared root of the variance)
  • The skewness
  • The kurtosis.

The mean, the standard deviation / variance, the skewness, and the kurtosis refer to the first, second, third and fourth moments of statistical distribution of returns respectively.

Table 4. Summary statistics for the S&P 500 index.
 Summary statistics for the S&P 500 index
Source: computation by the author (data: Yahoo! Finance website).

Evolution of the S&P 500 index

Figure 1 below gives the evolution of the S&P 500 index from December 30, 1927 to December 30, 2022 on a daily basis.

Figure 1. Evolution of the S&P 500 index.
Evolution of the S&P 500 index
Source: computation by the author (data: Yahoo! Finance website).

Figure 2 below gives the evolution of the S&P 500 index returns from December 30, 1927 to December 30, 2022 on a daily basis.

Figure 2. Evolution of the S&P 500 index returns.
Evolution of the S&P 500 index return
Source: computation by the author (data: Yahoo! Finance website).

Statistical distribution of the S&P 500 index returns

Historical distribution

Figure 3 represents the historical distribution of the S&P 500 index daily returns for the period from December 30, 1927 to December 30, 2022.

Figure 3. Historical distribution of the S&P 500 index returns.
Historical distribution of the daily S&P 500 index returns
Source: computation by the author (data: Yahoo! Finance website).

Gaussian distribution

The Gaussian distribution (also called the normal distribution) is a parametric distribution with two parameters: the mean and the standard deviation of returns. We estimated these two parameters over the period from December 30, 1927 to December 30, 2022. The mean of daily returns is equal to 0.02% and the standard deviation of daily returns is equal to 1.20% (or equivalently 5.88% for the annual mean and 19.38% for the annual standard deviation as shown in Table 3 above).

Figure 4 below represents the Gaussian distribution of the S&P 500 index daily returns with parameters estimated over the period from December 30, 1927 to December 30, 2022.

Figure 4. Gaussian distribution of the S&P 500 index returns.
Gaussian distribution of the daily S&P 500 index returns
Source: computation by the author (data: Yahoo! Finance website).

Risk measures of the S&P 500 index returns

The R program that you can download above also allows you to compute risk measures about the returns of the S&P 500 index.

Table 5 below presents the following risk measures estimated for the S&P 500 index:

  • The long-term volatility (the unconditional standard deviation estimated over the entire period)
  • The short-term volatility (the standard deviation estimated over the last three months)
  • The Value at Risk (VaR) for the left tail (the 5% quantile of the historical distribution)
  • The Value at Risk (VaR) for the right tail (the 95% quantile of the historical distribution)
  • The Expected Shortfall (ES) for the left tail (the average loss over the 5% quantile of the historical distribution)
  • The Expected Shortfall (ES) for the right tail (the average loss over the 95% quantile of the historical distribution)
  • The Stress Value (SV) for the left tail (the 1% quantile of the tail distribution estimated with a Generalized Pareto distribution)
  • The Stress Value (SV) for the right tail (the 99% quantile of the tail distribution estimated with a Generalized Pareto distribution)

Table 5. Risk measures for the S&P 500 index.
Risk measures for the S&P 500 index
Source: computation by the author (data: Yahoo! Finance website).

The volatility is a global measure of risk as it considers all the returns. The Value at Risk (VaR), Expected Shortfall (ES) and Stress Value (SV) are local measures of risk as they focus on the tails of the distribution. The study of the left tail is relevant for an investor holding a long position in the S&P 500 index while the study of the right tail is relevant for an investor holding a short position in the S&P 500 index.

Why should I be interested in this post?

For a number of reasons, ESSEC students should learn about the S&P 500 index. The performance of 500 large-cap American companies is tracked by this stock market index, which is first and foremost well-known and respected. Gaining a deeper understanding of the US stock market and the businesses that fuel its expansion requires knowledge of the S&P 500 index. Management students can assess the performance of their own investments and those of their organization by comprehending the S&P 500 index and its components. Last but not least, a lot of businesses base their mutual funds and exchange-traded funds (ETFs) on the S&P 500 index.

Related posts on the SimTrade blog

About financial indexes

   ▶ Nithisha CHALLA Financial indexes

   ▶ Nithisha CHALLA Calculation of financial indexes

   ▶ Nithisha CHALLA The business of financial indexes

   ▶ Nithisha CHALLA Float

About other US financial indexes

   ▶ Nithisha CHALLA The DJIA index

   ▶ Nithisha CHALLA The NASDAQ index

   ▶ Nithisha CHALLA The Russell 2000 index

   ▶ Nithisha CHALLA The Wilshire 5000 index

About portfolio management

   ▶ Jayati WALIA Returns

   ▶ Youssef LOURAOUI Portfolio

About statistics

   ▶ Shengyu ZHENG Moments de la distribution

   ▶ Shengyu ZHENG Mesures de risques

Useful resources

Academic research about risk

Longin F. (2000) From VaR to stress testing: the extreme value approach Journal of Banking and Finance, N°24, pp 1097-1130.

Longin F. (2016) Extreme events in finance: a handbook of extreme value theory and its applications Wiley Editions.

Data: Yahoo! Finance

Yahoo! Finance

Yahoo! Finance Historical data for the S&P 500 index

Data: Bloomberg

Bloomberg

Bloomberg Data for the S&P 500 index

About the author

The article was written in March 2023 by Nithisha CHALLA (ESSEC Business School, Grande Ecole Program – Master in Management, 2021-2023).

Calculation of financial indexes

Calculation of financial indexes

Nithisha CHALLA

In this article, Nithisha CHALLA (ESSEC Business School, Grande Ecole Program – Master in Management, 2021-2023) explains the calculation of financial indexes.

Introduction

A stock market index keeps tabs on the gains and losses made by a specific selection of stocks or other assets. In other words, the index determines how share prices for various companies have changed. The performance of a market index can be quickly evaluated to ascertain the state of the stock market. It also serves as a template for financial institutions to use when creating index funds and exchange-traded funds (ETFs).

Definition

What is an index? In financial markets, there are many sectors, segments and business lines, and if you have to statistically measure the performance of these sectors we need a reference which is called an index. Simply, it is a group of securities or financial instruments which represents the performance of a specific segment of the market.

Calculation

Then the index value has to be calculated with a specific formula. There are different calculation methods for financial indexes: price-weighted index, market-capitalization-weighted index, equal-weighted index and fundamentals-weighted index.

The general formula for a financial index is given by

Index value

where I is the index value, P the asset market price, k a given asset, K the number of assets in the index, wk the weight of asset k in the index, and t is the time of calculation of the index.

Note: the index It at time t is divided by the value of the index at the beginning I0 and multiplied by 100.

Price-Weighted Index

A price-weighted index is calculated by summing the prices of all the assets in the index and dividing by a divisor equal to the number of assets.

The formula for a price-weighted index is given by

Price Weighted Index value

where I is the index value, k a given asset, K the number of assets in the index, Pk the market price of asset k, and t the time of calculation of the index.

In a price-weighted index, the weight of asset k is given by formula can be rewritten as

Price Weighted Index Weight

which clearly shows that the weight of each asset in the index is its market price divided by the sum of the market prices of all assets.

Note that the divisor, which is equal to the number of shares, is typically adjusted for events such as stock splits and dividends. The divisor is used to ensure that the value of the index remains consistent over time despite changes in the number of outstanding shares. A more general formula may then be:

Index value

where D is the divisor which is adjusted over time to account for events such as stock splits and dividends.

In a price-weighted index, the higher-priced stocks move the index more than the lower-priced stocks.

The most popular price-weighted index in the world is likely the Dow Jones Industrial Average (DJIA). It consists of 30 different stocks in the US market.

Market-Capitalization-Weighted Index

A market capitalization-weighted index is calculated by multiplying the price of each asset in the index by its number of outstanding shares and summing the resulting values. The weighting of each asset in the index is determined by its market capitalization, so that the largest and most influential companies have the greatest impact on the overall performance of the index.

The formula for a market-capitalization-weighted index is given by

Market Capitalization Index value

where I is the index value, k a given asset, K the number of assets in the index, Pk the market price of asset k, Nk the number of issued shares for asset k, and t the time of calculation of the index.

In a market capitalization-weighted index, the weight of asset k is given by formula can be rewritten as

Market Capitalization Weighted Index Weight

which clearly shows that the weight of each asset in the index is its market capitalization of the asset divided by the sum of the market capitalizations of all assets.

Note that the divisor, whose calculation is based on the number of shares, is typically adjusted for events such as stock splits and dividends. The divisor is used to ensure that the value of the index remains consistent over time despite changes in the number of outstanding shares.

Float-adjusted market-capitalization-weighted index

In a float-adjusted market-capitalization-weighted index, the market-capitalization weight of each asset is adjusted for its market float. It is also called a free float. Instead of taking into account shares held by insiders, governments, or other entities that might not be available for trading, the weight is adjusted based on the percentage of shares that are actually traded on the open market.

This differs from the market capitalization weighted index as it accounts for the shares outstanding of a company. A float-adjusted market capitalization-weighted index only takes into account shares that are freely available for trading, whereas a market capitalization-weighted index takes into account all outstanding shares, providing a more accurate picture of the performance of the market.

The formula for a float-adjusted market-capitalization-weighted index is given by

Float Adjusted Market Capitalization Index value

where I is the index value, k a given asset, K the number of assets in the index, Pk the market price of asset k, Nk the number of issued shares for asset k, Fk the float factor of asset k, and t the time of calculation of the index.

In a float-adjusted market-capitalization-weighted index, the weight of asset k is given by formula can be rewritten as

Float Adjusted Market Capitalization Weighted Index Weight

Fundamental-weighted Index

A fundamental-weighted index is calculated based on specific financial metrics, such as revenue or earnings, rather than market capitalization or price. The weightings of each asset in the index are determined by its financial metrics, so that the companies with the strongest financial performance have the greatest impact on the overall performance of the index.

The formula for a fundamental-weighted index is given by

Fundamental Weighted Index value

where I is the index value, k a given asset, K the number of assets in the index, Pk the market price of asset k, Fk the financial metric of asset k, and t the time of calculation of the index.

In a fundamental-weighted index, the weight of asset k is given by formula can be rewritten as

Fundamental Weighted Index Weight

which clearly shows that the weight of each asset in the index is the value of the fundamental variable of the asset divided by the sum of the values of the fundamental variable of all assets.

Equal-weighted Index

An equal-weighted index is calculated by dividing the total value of the index by the number of securities in the index, and then allocating the same weighting to each security. This method gives each security an equal influence on the overall performance of the index, regardless of its market capitalization.

The formula for an equal-weighted index is given by

Equal Weighted Index value

In an equal-weighted index, the weight of asset k is given by formula can be rewritten as

Equal Weighted Index Weight

Which clearly shows that the weight of each asset in the index, one divided by the number of assets, is constant over time.

Examples of financial indexes

The Dow Jones Industrial Average: an equal-weighted index

The Dow Jones Industrial Average, or DJIA (Dow), was the first index, appearing in 1896. The 30 largest and most prosperous American companies make up the Dow. The experts have carefully chosen these businesses to represent a wide range of industries. Companies with higher prices are given more weight in the Dow. Even though it is the most established and performs similarly to the S&P 500, it is occasionally thought to be less indicative of the entire market.

The S&P 500 index: a market-capitalization-weighted index

S&P 500 – The performance of 500 of the biggest American publicly traded companies is measured. Some people think the S&P 500, which is weighted by market capitalization and has a wider scope, is the best indicator of the American stock market. Because of this, the S&P 500’s average is most significantly impacted by the companies with the highest total market value.

Why should I be interested in this post?

Learning about the calculation of financial indices is important to understand the behavior of an index. It can assist you in managing risk in your portfolio, understanding the overall performance of various markets, and making wise investment decisions. Financial indices can offer insightful data on how various markets, sectors, and economies are performing. Investors can determine whether their investments are outperforming or underperforming the overall market by comparing the returns to the returns of a relevant financial index.

Related posts on the SimTrade blog

   ▶ All posts about Financial techniques

   ▶ Nithisha CHALLA Financial indexes

   ▶ Youssef LOURAOUI Smart Beta strategies: between active and passive allocation

Useful resources

Weight priced index Indice

Equity Indexes Indice

Security market index Indice

Value weighted index Indice

Evolution of indexes Indice

About the author

The article was written in March 2023 by Nithisha CHALLA (ESSEC Business School, Grande Ecole Program – Master in Management, 2021-2023).

Financial indexes

Financial indexes

Nithisha CHALLA

In this article, Nithisha CHALLA (ESSEC Business School, Grande Ecole Program – Master in Management, 2021-2023) explains financial indexes, their construction and their use in the finance.

Definition

What is an index? An index can be defined as a measure of a quantity.

An index is a measure of quantity that can be defined as the ratio between the value of the quantity during a current period and its value during a base period. The use of a ration makes it easy to calculate and compare changes in one or more quantities between two given periods. This ratio is often multiplied by 100 or 1,000. Indexes are frequently used in the financial sector to measure the evolution of market prices for a set of financial assets over time. These sets of assets can be defined to represent an asset class, country or geographical zone, or sector of the economy, and provide a comprehensive and accurate overview of the market.

Financial indexes serve as a benchmark for assessing the performance of an investor’s asset portfolio and give investors a way to monitor the performance of a given set of assets. By using financial indexes, investors can gain knowledge of market trends and conditions and make informed investment decisions. Index providers are responsible for creating and maintaining financial indexes.

History

The Dow Jones Industrial Average was first created in 1896 by Charles Dow, a co-founder of the Dow Jones Company, and is widely regarded as the first index. Who is creating the index? The Dow Jones Industrial Average, which included 12 companies at the time that were emblematic of the US Market. Currently, there are 30 companies that make it up even though none of the original 12 companies are still included. As interest in indices increased, financial publications like the Financial Times or exchange owners like the Deutsche Borse in Germany developed their own equity indices, while investment banks took the lead in developing indices for bonds. Since then, numerous other financial indexes have been developed, including the NASDAQ Composite, FTSE 100, Nikkei 225, S&P 500, and others.

Evolution over time

Stock market indexes were initially just simple arithmetic averages of the prices of a small number of chosen stocks; they did not take the entire market into account. The daily averages were first published in the newspapers in the 1800s. Later, they began to use market capitalization weighting, which was well-liked because it assigned weights based on the size of the company. Following that, various indexes based on sectors, nationalities, etc. were assigned. A significant trend recently has been the use of passive index funds and the addition of ESG criteria to the indexes.

Providers of financial indexes

Financial indexes are typically provided by financial data and research firms. As mentioned earlier, though there are several providers in the financial services industry, there are few most prominent index providers – S&P Global, MSCI, FTSE Russell, Dow Jones Indices and Nasdaq. With a combined market share of about 90% for equity indexes, these firms are thought to dominate the world index market.

Index Industry Association (IIA)

The production of indexes has become an industry! And every industry has a professional association. The index industry is no exception. The Index Industry Association was founded in 2012. Some of the founding members are MSCI and S&P Dow Jones Indexes.

As stated on the IIA website, the association mandate is “to educate investors on the attributes and role of indexes within the investment process, to advocate for the interests of index users and providers worldwide, and to push for industry standards of best practice, independence and transparency”.

Composition of an index

The composition of an index is a crucial factor in determining its representation, and it is important for investors to understand the criteria used by the index provider to select the assets included in the index, as well as the weightings assigned to each asset. The composition of an index is designed to represent a specific market or sector, and the index provider selects the assets to be included based on specific criteria, such as market capitalization, liquidity (float), and sector representation.

There are several steps in the process of creating an index. As we all know, index providers use a variety of companies to create the index, but how are they selected? Specific eligibility requirements must be met, such as the size of the business and the industry it belongs to, etc. After the eligible companies have been narrowed down, they are properly evaluated before being included in the index. This evaluation includes looking at the company’s earnings, market capitalization, and other factors. Additionally, they conduct index balancing with regard to various industries, segments, etc. Last but not least the index’s potential market impact is cross-checked as the index stands as a benchmark for the investors to make decisions. Different index providers may have different selection criteria and processes.

The index provider regularly reviews and updates the composition of the index to ensure that it remains representative of the market or sector it is tracking.

For example, the S&P 500 index is designed to represent the performance of the U.S. stock market, and the securities included in the index are chosen based on market capitalization, liquidity, and sector representation. Since each security’s weight in the index is based on its market capitalization, the largest and most powerful corporations have the biggest effects on the index’s overall performance.

Calculation of financial indexes

Once the index provider has chosen the assets to be included in the index based on predetermined criteria, such as market capitalization, liquidity, and sector representation. Then the index value has to be calculated with a specific formula. There are different calculation methods for financial indexes: price-weighted index, market-capitalization-weighted index, equal-weighted index and fundamentals-weighted index.

Classifications of financial indexes

By having a solid understanding of the various classifications of financial indexes, investors can select the most suitable indexes for their investment goals and strategies. Market coverage, calculation method, geographic region, asset class, investment approach, and security type are used to categorize financial indexes.

The criteria for classifying financial indexes include:

  • Asset class: equity, bond, crypto, etc.
  • Geography: US, Asia-Pacific, Europe
  • Sector: Information Technology, Health Care, Financials, Consumer Discretionary, Communication Services, Industrials, Consumer Staples, Energy, Utilities, Real Estate, and Materials.
  • Weighting methodology: price-weighted, market-capitalization-weighted, float-adjusted market-capitalization-weighted, fundamental-weighted
  • Objectives: market representation, risk factor representation

Most popular financial indexes

The Dow Jones Industrial Average

The Dow Jones Industrial Average (DJIA) was established in 1896, is the country’s first stock market index. Thirty large-cap companies that are leaders in their fields are included in this price-weighted index. The index is frequently used as a gauge for the American stock market and the overall economy.    ▶ More about the DJIA index

S&P 500

The S&P 500 index is a market capitalization-weighted index that monitors the progress of 500 large-cap U.S. businesses operating in various industries. It was established in 1957, and many people consider it to be one of the most significant benchmarks for the American stock market. The index is widely used as a benchmark by fund managers and investors and is frequently used as a stand-in for the overall health of the American economy.    ▶ More about the S&P 500 index

Nasdaq Composite

Composed of all the companies listed on the Nasdaq stock market, the Nasdaq Composite is a market capitalization-weighted index. It was founded in 1971 and is renowned for the prominence of technology firms, even though it also includes businesses from the consumer goods, healthcare, and finance sectors. The index is frequently used as a yardstick for growth and technology stock performance.    ▶ More about the Nasdaq Composite index

FTSE 100

The performance of the top 100 companies listed on the London Stock Exchange is tracked by the FTSE 100, a market capitalization-weighted index. Since its creation in 1984, it has gained widespread recognition as the top benchmark for the UK stock market. Companies from the financial, energy, and mining sectors make up the majority of the index, and each company is weighted according to its market capitalization.    ▶ More about the FTSE 100 index

MSCI World

The MSCI World Index tracks the performance of businesses in 23 developed markets around the world, including the United States, Canada, Japan, and Europe. It is a market capitalization-weighted index. It was developed in 1969 and is frequently used as a yardstick for performance in the global equity market. The weighting of each company in the index, which consists of more than 1,600 large- and mid-cap stocks, is determined by its market capitalization.

Health Care Select Sector Index

The Health Care Select Sector Index is based on the companies of the S&P 500’s health care sector. It was established in 1998 with the purpose of monitoring the performance of businesses involved in the health care sector, such as those producing pharmaceuticals, biotechnology, medical devices, and healthcare providers.

Use of indexes in finance

Financial indexes play an important role for market participants like investors, traders, and asset managers. Some of the ways indexes are used in finance include:

Gauges of the market evolution

Indexes can offer insightful information about the state of the financial markets. An index helps to measure the market returns of a given set of securities.

The best part of the stock index is that just by tracking the simple indicator we get a general idea of how the stock market is performing. A stock index clearly shows how the market is performing, or at least the market that it represents, despite the fact that individual stocks may perform differently, making it challenging to determine whether the market is strong or weak.

Benchmarks

Indexes are frequently used as a benchmark to assess the performance of investment portfolios, especially actively managed portfolios.

Proxies for modeling

In academic studies, indexes are used as proxies for the market portfolio to capture systematic risk and to compute risk-adjusted performance.

Portfolio Asset allocation

Because they offer a way to gain exposure to particular asset classes, industries, or geographic areas, indices serve as the foundation for asset allocation strategies.

Risk management

Indexes can assist investors in comprehending the risks related to particular asset classes or geographical areas.

Building of investment vehicles

Exchange-traded funds (ETFs), mutual funds, options and structured products, among others, use indexes as their underlying assets. These investment vehicles make it easy and affordable for investors to become exposed to the index’s performance.

Rebalancing

Some indexes imply frequent and even continuous rebalancing (buying and selling assets). For example, for a fund tracking an equally-weighted index, the fund manager will have to sell assets whose price increased and buy assets whose price decreased.

Change in index composition and impact on asset prices

When an asset is included in an index, its price usually increases as fund managers need to buy it to include it in their portfolio. Conversely, when an asset is excluded from an index, its price usually decreases as fund managers need to sell it to exclude it from their portfolio.

Empirical results confirming these propositions can be found in a study by McKinsey (2004). The prices of the assets included in a financial index may change as a result of changes in the composition of the index over time.

It is crucial to remember that depending on the specifics of the change, the effect of a change in index composition on asset prices may be either short-lived or long-lasting. The effect of a change in index composition on asset prices can also be challenging to forecast because it depends on a variety of variables, such as investor sentiment, fund flows, and market sentiment.

Link with academic research

The performance of a particular sector of the stock market, such as large-cap stocks, small-cap stocks, or a specific sector or industry, is measured by an equity index, a type of financial index.

On the other hand, market factors are factors that account for a significant amount of the variation in stock prices. Market variables include both macroeconomic ones like interest rates and GDP and market-specific ones like market volatility and liquidity.

The relationship between equity indexes and market factors is that changes in market factors can have an impact on equity index performance, and equity index performance can be influenced by market factor changes. For instance, adjustments in interest rates may have an effect on the performance of the stock market as a whole and, consequently, on the performance of an equity index that monitors the stock market. Factor-based indexes that seek to capture the performance of particular market factors, such as value, growth, and momentum, have been developed as a result of research into the effects of market factors on equity indexes. These factor-based indexes can be employed to examine the effects of market factors on the performance of equity indexes and to base investment choices on the exposure to market factors.

Why should I be interested in this post?

I frequently come across news-related stocks, bonds, and indices in publications like newspapers, financial journals, and business magazines. We require a fundamental understanding of indices in order to even understand what is happening in the business world. It’s also crucial to have a thorough understanding of markets and financial indices because we need to comprehend these financial indices in order to assess a company’s performance and compare it to previous years.

Related posts on the SimTrade blog

   ▶ All posts about Financial techniques

About financial indexes

   ▶ Nithisha CHALLA Calculation of financial indexes

   ▶ Nithisha CHALLA The business of financial indexes

   ▶ Nithisha CHALLA Float

Examples of financial indexes

   ▶ Nithisha CHALLA The DJIA index

   ▶ Nithisha CHALLA The S&P 500 index

   ▶ Nithisha CHALLA The Nasdaq index

Useful resources

Insee Indice

Russel How are indexes weighted?

Financial Index Industry Presentation of the association

Index Industry Association Presentation of the association

Marc H. Goedhart and Regis Huc (2004) What is stock index membership worth? McKinsey & Company.

About the author

The article was written in March 2023 by Nithisha CHALLA (ESSEC Business School, Grande Ecole Program – Master in Management, 2021-2023).

Capital Guaranteed Products

Capital Guaranteed Products

Shengyu ZHENG

In this article, Shengyu ZHENG (ESSEC Business School, Grande Ecole Program – Master in Management, 2020-2023) explains how capital guaranteed products are built.

Motivation for investing in capital-guaranteed products

In order to invest the surplus of the firm liquid assets, corporate treasurers take into account the following characteristics of the financial instruments: performance, risk and liquidity. It is a common practice that some corporate investment strategies require that the investment capital should at least be guaranteed. The sacrifice of this no-loss guarantee is limited return in case of appreciation of the underlying asset price.

Capital-guaranteed (or capital-protected) products are one of the most secure forms of investment, usually in the form of certificates. They provide a guarantee that a specified minimum amount (usually 100 per cent of the issuance price) will be repaid at maturity. They are suitable particularly for risk-averse investors who wish to hold the products through to maturity and are not prepared to bear any loss that might exceed the level of the guaranteed repayment.

Performance

Let us consider a capital-guaranteed product with the following characteristics:

Table 1. Characteristics of the capital-guaranteed products

Notional amount EUR 1,000,000.00
Underlying asset CAC40 index
Participation rate 40%
Minimum amount guarantee 100% of the initial level
Effective date February 01, 2022
Maturity date July 30, 2022

We also have the following information about the market:

Table 2. Market information

Risk-free rate (annual rate) 8%
Implied volatility (annualized) 10%

In case of depreciation of the underlying index, the return of the product remains zero, which means the original capital invested is guaranteed (or protected). In case of appreciation of the underlying index, the product only yields 40% of the return of the underlying index. The following chart is a straightforward illustration of the performance structure of this product.

Performance of the capital guaranteed product

Construction of a capital guaranteed product

We can decompose a capital-guaranteed product into three parts:

  • Investment in the risk-free asset that would yield the guaranteed capital at maturity
  • Investment in a call option that guarantees participation in the appreciation of the underlying asset
  • Margin of the bank

Decomposition of the capital guaranteed product

Investment in the risk-free asset

The essence of the capital guarantee is realized by investing a part of the initial capital in the risk-free asset and obtaining the amount of the guaranteed capital at maturity. Given the amount of the capital to be guaranteed and the risk-free rate, we can calculate the amount to be invested in risk-free asset: 1,000,000/(1+0.08)^0.5 =962,250.45 €

Investment in the call option

To realize the upside exposure, call options are a perfect vehicle. With a notional amount of 1,000,000 € and a maturity of 6 months, an at-the-money call option would cost 41,922.70 € (calculated with the Black-Scholes-Merton formula). Since the participation rate is 40%, the amount to be invested in the call option would be 16,769.08 € (= 40% * 41,922.70 €).

Margin of the bank

The margin of the bank is equal to the difference between the original capital and the two parts of the investment. In this case, the margin is 20,980.47 € (= 1,000,000.00 € – 962,250.45 € – 16,769.08 €)
If we compress the margin, there would be more capital available to invest in the call option, thus increasing the participation rate. In the case of zero margin, we obtain the maximum participation rate. In this scenario, the maximum participation rate would be 90.05% (= (1,000,000.00 € – 962,250.45 €) / 41,922.70 €).

Sensitivity to variations of the marketplace

Considering the two parts of the investment constituting the capital-guaranteed product, we can see that the risk-free rate and the volatility of the underlying asset are the two major factors influencing the pricing of this product. Here let us focus on the maximum participation rate as a proxy of the value of the product to the buyer of the product.

The effect of the risk-free rate could be ambiguous at the first glance. On one hand, if the risk-free rate rises, there needs to be less capital invested in the risk-free asset and there would be therefore more capital to be placed in purchasing the call options. On the other hand, if the risk-free rate rises, the call option value rises as well. With the same amount of capital, fewer call options could be purchased. However, the largest portion of the original capital is invested in the risk-free asset and the impact on this regard is more important. Overall, a rising risk-free rate has a positive impact on the participation rate.

The effect of the volatility of the underlying asset, however, is clear. Rising volatility has no impact on the risk-free investment in the framework of our hypotheses. It, however, raises the value of the call options, which means that fewer options could be purchased with the same amount of capital. Overall, rising volatility has a negative impact on the participation rate.

Statistical distribution of the return

The statistical distribution of the return of the instrument is mixed by two parts: the discrete part equal to 0 corresponding to the case of depreciation of the underlying asset; and the continuous part of positive return. Based on a Gaussian assumption for the statistical distribution, we can calculate the probability mass of the depreciation of the underlying asset is 33.70%. In the continuous part, the return follows a Gaussian statistical distribution, with a mean equal to the periodic return over the participation rate and a standard deviation equal to periodic implied volatility over the participation rate, if the Gaussian assumption prevails.

Statistical distribution of the return of the capital guaranteed product

Risks and constraints

Liquidity risk

Being exotic financial instruments, capital-guaranteed products are not traded in standard exchanges. By construction, these products can normally only be redeemed at maturity and therefore are less liquid. There could be, however, early redemption clauses involved to mitigate the long-term liquidity risks. Investors should be aware of their liquidity needs before entering into a position in this product.

Counterparty risk

Similar to all other over-the-counter (OTC) transactions, there is no mechanism such as a central clearing counterparty (CCP) to ensure the timeliness and integrity of due payments. In case of financial difficulty including the bankruptcy of the issuer, the capital guarantee would be rendered worthless. It is therefore highly recommended to enter into such transactions with issuers of higher ratings.

Limited return

It is worth noting that capital-guaranteed products have weak exposure to the appreciation of the underlying asset. In this case, for a probability of 33.70%, there would be a return of zero, which is lower than investing directly in the risk-free security.

In order to mitigate this limit, the issuer could modify the level of guarantee to a lower level than 100%. This allows the product to have more exposure to the upside movement of the underlying asset with a relatively low risk of capital loss. To realize this involves entering positions of out-of-the-money call options.

Taxation and fees

In many countries, the return of capital-guaranteed products is considered as ordinary income, instead of capital gains or tax-advantaged dividends. For example, in Switzerland, it is not recommended to buy such a product with a long maturity, since the tax burden, in this case, could be higher than the “impaired” return of the product.

Moreover, fees for such products could be higher than exchange-traded funds (ETFs) or mutual funds. This part of investment cost should also be taken into account in making investment decisions.

Download the Excel file to analyze capital-guaranteed products

You can find below an Excel file to analyze capital-guaranteed products.

Download Excel file to analyze capital guaranteed products

Why should I be interested in this post?

As a family of investments that is often used in corporate treasury management, it is important to understand the mechanism and structure of capital-guaranteed products. It would be conducive for future asset managers, treasurer managers, or structurers to make the appropriate and optimal investment decisions.

Related posts on the SimTrade blog

   ▶ All posts about Options

   ▶ Shengyu ZHENG Barrier options

   ▶ Shengyu ZHENG Reverse convertibles

Resources

Books

Cox J. C. & M. Rubinstein (1985) “Options Markets” Prentice Hall.

Hull J. C. (2005) “Options, Futures and Other Derivatives” Prentice Hall, 6th edition.

Articles

Black F. and M. Scholes (1973) The Pricing of Options and Corporate Liabilities Journal of Political Economy, 81(3): 637-654.

Lacoste V. and Longin F. (2003) Term guaranteed fund management: the option method and the cushion method Proceeding of the French Finance Association, Lyon, France.

Merton R. (1974) On the Pricing of Corporate Debt Journal of Finance, 29(2): 449-470.

Websites

longin.fr Pricer for standard equity options – Call and put

Euronext www.euronext.com: website of the Euronext exchange where the historical data of the CAC 40 index can be downloaded

Euronext CAC 40 Index Option: website of the Euronext exchange where the option prices of the CAC 40 index are available

Six General information about capital protection without a cap: website of the Swiss stock exchange where information of various financial products are available.

About the author

The article was written in February 2023 by Shengyu ZHENG (ESSEC Business School, Grande Ecole Program – Master in Management, 2020-2023).

My Internship Experience at AlixPartners in London

My Internship Experience at AlixPartners in London

Federico De ROSSI

In this article, Federico De Rossi (ESSEC Business School, Master in Strategy and Management of International Business, 2020-2023) shares his professional experience as Business Analyst Intern at AlixPartners.

About the company

AlixPartners is a global consulting firm that offers companies facing complex challenges strategic, operational, and financial advice. They collaborate with companies in a variety of industries, including automotive, consumer goods, healthcare, retail, and technology. The company was founded in 1981 in Detroit, Michigan, and has since expanded to become a global firm with offices in more than 25 countries.

Logo of the AlixPartner.
Logo of AlixPartner
Source: AlixPartner.

My internship

During my internship at AlixPartners, I worked as a Business Analyst Intern.

My missions

My role was twofolded: on one side I was involved in providing support to consultants all over the globe on various projects and different industries. On the other side, I also worked hand to hand with the firm’s managing director to spot business development opportunities by, for instance, analysing four of the biggest private equity firms in the world and their portfolio companies.

Finally, I was responsible for conducting research and analysis to support project work, preparing presentations and reports for clients, and attending team meetings.

Required skills and knowledge

As an Intern in a global consulting firm, I already had to master some skills that would have been necessary for a successful completion of the internship itself. Obviously, learning agility and curiosity are given qualities that candidates are asked to have: without them, working 10+ hours a day would not be sustainable and would not make the job interesting. On top of those, problem-solving and communication skills are the bread and butter of the industry. Finally, for what concerned hard skills, a good knowledge of the Microsoft Office suite was fundamental.

What I learned

My internship at AlixPartners provided me with a valuable learning experience. It helped me develop a range of skills, including problem-solving, analytical, and communication skills. I also learned the importance of teamwork, collaboration, and time management.

One of the key things that I learned during my internship was the importance of developing a deep understanding of the client’s business. This involved analyzing the client’s financial statements, conducting market research, and understanding their competitive landscape. This understanding helped consulting firms develop customized solutions that are tailored to the client’s specific needs.

Another valuable lesson that I learned was the importance of effective communication. As consultants, we had to present our findings and recommendations to clients in a clear and concise manner. This involved preparing presentations and reports that were easy to understand and conveyed the key messages effectively.

Finally, working in such a high paced environment, with long hours and very demanding challenges, I definitely learnt how to better manage my time and conciliate my personl life with my professional one.

Financial concepts related my internship

When it comes to financial concepts related to the industry, I haven’t been exposed to much if not for when I had to analyze private equity firms such as KKR, Bain Capital, EQT, and others. It was the first time I was working on PEs and the topic revealed itself to be extremely enjoyable. It’s quite interesting to see the deep connection between private equity and consulting.

Why should I be interested in this post?

Overall, my internship at AlixPartners was a fantastic learning opportunity that enabled me to develop a variety of skills that will be useful in my future career. I would strongly recommend AlixPartners to anyone interested in a career in consulting.

Related posts on the SimTrade blog

   ▶ All posts about professional experience

   ▶ Nithisha CHALLA My experience as a Risk Advisory Analyst in Deloitte

   ▶ Alexandre VERLET My experience as an investment banking analyst intern at G2 Capital Advisors

Useful resources

AlixPartner

About the author

The article was written in March 2022 by Federico De Rossi (ESSEC Business School, Master in Strategy and Management of International Business, 2020-2023).

Understanding the Order Book: How It Impacts Trading

Understanding the Order Book: How It Impacts Trading

Federico De ROSSI

In this article, Federico DE ROSSI (ESSEC Business School, Master in Strategy & Management of International Business (SMIB), 2020-2023) talks about the order book and explains its role in financial markets.

Introduction

Understanding the order book is critical when it comes to trading in financial markets. In this article, we’ll go over what an order book is and how it affects trading.

What is an order book?

An order book for a stock, currency, or cryptocurrency is a list of buy and sell limit orders for that asset. It shows the pricing at which buyers and sellers are willing to negotiate, as well as the total number of orders available at each price. The order book is a necessary component of every trading platform since it gives a snapshot of the current market situation, of the price of the assets, and of the liquidity of the market. Thus, it is a crucial tool for traders who want to make informed decisions when entering or exiting deals.

How does an order book work?

The order book is a constantly updated record of buy and sell orders. When a trader puts a limit order, it is placed in the order book at the stated price. As a result, there is a two-sided market with distinct prices for buyers and sellers.

The order book is divided into two sections: bid (buy) and ask (sell). All open buy orders are displayed on the bid side, while all open sell orders are displayed on the ask side. The order book also shows the total volume of buy and sell orders at each price level.

In Tables 1 and 2 below, we give below two examples of order book from online brokers. We can see the two parts of the order book side by side: the “Buy” part and the “Sell” part. Every line of the order book corresponds to a buy or sell proposition for a give price (“Buy” or “Sell” columns) and a given quantity (“Volume” columns). For a given line there may be one or more orders for the same price. When there are several orders, the quantity in the “Volume” column is equal to the sum of the quantities of the different orders. Associated to the order book, there is often a chart which indicates the cumulative quantity of the orders in the order book at a given price. This chart gives an indication of the liquidity of the market in terms of market spread, market breadth, and market depth (see below for more explanations about theses concepts).

The “Buy” and “Sell” parts of the order book can be presented side by side (Table 1) or above each other (Tables 2 and 3) with the “Sell” part (in red) above the “Buy” part (in green) as the price limits of the sell limit orders are always higher than the price limits of the buy limit orders.

Table 1. Example of an order book (buy and sell parts presented side by side).
Order book
Source: online broker (Fortuneo).

Table 2. Example of an order book (buy and sell parts presented above each other).
Order book
Source: online broker (Cryptowatch).

Table 3. Example of an order book (buy and sell parts presented above each other).
Order book
Source: online broker (Binance).

In a typical order book, the buy side is organized in descending order, meaning that the highest buy orders (i.e., the orders with the highest bid prices) are listed first, followed by the lower buy orders in descending order of price. The highest buy order in the book represents the best bid price, which is the highest price that any buyer is currently willing to pay for the asset.

On the other side of the order book, the sell side is organized in ascending order, with the lowest sell orders (i.e., the orders with the lowest ask prices) listed first, followed by the higher sell orders in ascending order of price. The lowest sell order in the book represents the best ask price, which is the lowest price that any seller is currently willing to accept for the asset.

This organization of the order book makes it easy for traders to see the current market depth and the best available bid and ask prices for an asset. When a buy order is executed at the best ask price or a sell order is executed at the best bid price, the order book is updated in real-time to reflect the new market depth and the new best bid and ask prices.

Table 4 below represents how the order book (limit order book) in trading simulations the SimTrade application.

Table 4. Order book in the SimTrade application.
Order book in the SimTrade application

You can understand how the order book works by launching a trading simulation on the SimTrade application.

The role of the order book in trading

As mentioned before, the order book is incredibly significant in trading. It acts as a market barometer, delivering real-time information about the supply and demand for an asset. Traders can also use the order book to determine market sentiment. If the bid side of the order book is strongly occupied, for example, it could imply that traders are optimistic on the asset. Thanks to the data in the order book, traders can get different information out of it.

Three characteristics of the order book

Market spread

The market spread, also known as the bid-ask spread, is the difference between the highest price a buyer is willing to pay for an asset (the bid price) and the lowest price a seller is willing to accept (the ask price) at a particular point in time.

The market spread is a reflection of the supply and demand for the asset in the market, and it represents the transaction cost of buying or selling the asset. In general, a narrow or tight spread indicates a liquid market with a high level of trading activity and a small transaction cost, while a wider spread suggests a less liquid market with lower trading activity and a higher transaction cost.

Market breadth

Market breadth is a measure of the overall health or direction of a market, sector, or index. It refers to the number of individual stocks that are participating in a market’s movement or trend, and can provide insight into the underlying strength or weakness of the market.

Market breadth is typically measured by comparing the number of advancing stocks (stocks that have increased in price) to the number of declining stocks (stocks that have decreased in price) over a given time period. This ratio is often expressed as a percentage or a ratio, with a higher percentage or ratio indicating a stronger market breadth and a lower percentage or ratio indicating weaker breadth.

For example, if there are 1,000 stocks in an index and 800 of them are increasing in price while 200 are decreasing, the market breadth ratio would be 4:1 or 80%. This would suggest that the market is broadly advancing, with a high number of stocks participating in the upward trend.

Market depth

Finally, market depth is a measure of the supply and demand of a security or financial instrument at different prices. It refers to the quantity of buy and sell orders that exist at different price levels in the market. Market depth is typically displayed in a market depth chart or order book.

It can provide valuable information to traders and investors about the current state of the market. A deep market with large quantities of buy and sell orders at various price levels can indicate a liquid market where trades can be executed quickly and with minimal impact on the market price. On the other hand, a shallow market with few orders at different price levels can indicate a less liquid market where trades may be more difficult to execute without significantly affecting the market price.

Analyzing order book data

Data from order books can be used to gain insight into market sentiment and trading opportunities. For example, traders can use the bid-ask spread to determine an asset’s liquidity. They can also examine the depth of the order book to determine the level of buying and selling interest in the asset. Traders can also use order book data to identify potential trading signals. For example, if the bid side of the order book is heavily populated at a certain price level, this could indicate that the asset’s price is likely to rise. On the other hand, if the ask side is heavily populated at a certain price level, it could indicate that the asset’s price is likely to fall.

Benefits of using order book data for trading

Using order book data can provide traders with a number of advantages.

For starters, it can be used to gauge market sentiment and identify potential trading opportunities.

Second, it can assist traders in more effectively managing risk. Traders can identify areas of support and resistance in order book data, which can then be used to set stop losses and take profits.

Finally, it can aid traders in the identification of potential trading signals. Traders can identify areas of potential buying and selling pressure in order book data, which can then be used to enter and exit trades.

How to use order book data for trading

Traders can use order book data to gain a competitive advantage in the markets. To accomplish this, they must first identify areas of support and resistance that can be used to set stop losses and profit targets.

Traders should also look for indications of buying and selling pressure in the order book. If the bid side of the order book is heavily populated at a certain price level, it could indicate that the asset’s price is likely to rise. On the other hand, if the ask side is heavily populated at a certain price level, it could indicate that the asset’s price is likely to fall.

Finally, traders should use trading software to automate their strategies. Trading bots can be set up to monitor order book data and execute trades based on it. This allows traders to capitalize on trading opportunities more quickly and efficiently.

Conclusion

To summarize, the order book is a vital instrument for financial market traders. It gives real-time information about an asset’s supply and demand, which can be used to gauge market mood and find potential trading opportunities. Traders can also utilize order book data to create stop losses and take profits and to automate their trading techniques. Traders might obtain an advantage in the markets by utilizing the power of the order book.

Related posts on the SimTrade blog

▶ Jayna MELWANI The impact of market orders on market liquidity

▶ Lokendra RATHORE Good-til-Cancelled (GTC) order and Immediate-or-Cancel (IOC) order

▶ Clara PINTO High-frequency trading and limit orders

▶ Akshit GUPTA Analysis of The Hummingbird Project movie

Useful resources

SimTrade course Exchange orders

SimTrade course Market making

SimTrade simulations Market orders   Limit orders

About the author

The article was written in March 2023 by Federico DE ROSSI (ESSEC Business School, Master in Strategy & Management of International Business (SMIB), 2020-2023).

The Power of Patience: Warren Buffett's Advice on Investing in the Stock Market

The Power of Patience: Warren Buffett’s Advice on Investing in the Stock Market

Federico De ROSSI

In this article, Federico De ROSSI (ESSEC Business School, Master in Strategy and Management of International Business, 2020-2023) comments on a quote by Warren Buffet about patience.

Quote

The stock market is a device for transferring money from the impatient to the patient.

Analysis of the quote

The quote “The stock market is a device for transferring money from the impatient to the patient” was written by none other than Warren Buffett, widely regarded as one of the greatest investors of all time. Buffett is the chairman and CEO of Berkshire Hathaway, a multinational conglomerate holding company with a diverse portfolio of businesses in insurance, energy, railroads, manufacturing, and retail. As of the 2nd of March 2023, the oracle of Omaha has amassed a net worth of more than $100 billion over the course of his career, owing largely to his astute stock market investments. Buffett’s investment philosophy revolves around identifying high-quality companies with strong competitive advantages and investing in them for the long term, often with a holding period of 10 years or even more. A strategy also known as value investing.

Financial concepts related to the quote

Related to this quote, I spotted three main financial concepts: compounding returns, long-term investment strategy, and risk and reward.

Compounding returns

One of the financial concepts associated with Buffett’s quote is the idea of compounding returns. Essentially, the longer you hold onto a stock, the more money you stand to make. By reinvesting your earnings and letting them compound over time, you can potentially turn a small initial investment into a large sum of money over the course of several years or even decades. This is where patience comes in – if you’re constantly buying and selling stocks, you’re unlikely to see the full benefits of compounding returns.

Long-term investment strategy

Another concept that ties into Buffett’s quote is the importance of having a long-term investment strategy. The stock market can be incredibly volatile in the short-term, with prices fluctuating wildly based on a variety of factors such as news events, economic data, and investor sentiment. However, over the long-term, the stock market tends to follow a generally upward trend, as companies grow and earnings increase. By having a long-term investment strategy and holding onto your stocks through market fluctuations, you can avoid making rash decisions based on short-term movements and instead focus on the bigger picture.

Risk and reward

A third financial concept related to Buffett’s quote is the idea of risk and reward. The higher the potential reward, the higher the level of risk involved. Stocks with high growth potential may offer greater returns, but they also come with greater risk of volatility and price fluctuations. On the other hand, more stable, established companies may offer lower returns but come with lower risk. By being patient and willing to wait for your investments to pay off over the long-term, you can potentially reap the rewards of higher returns while minimizing your risk.

My opinion about this quote

In my opinion, Buffett’s quote is a testament to the power of patience and long-term thinking when it comes to investing. Too often, people are tempted to make quick, impulsive decisions based on short-term market movements or the latest hot stock tip. However, this approach rarely leads to long-term success. Instead, by taking a patient, disciplined approach to investing and focusing on high-quality companies with strong fundamentals, you can potentially build wealth over the course of years or even decades. While investing in the stock market always involves some level of risk, by being patient and letting your investments compound over time, you can potentially reap the rewards of higher returns and build a more secure financial future.

Why should I be interested in this post?

This quote is a great reminder to always invest money with your brain and not based on your emotions. Be patient – fools rush in where angels fear to tread.

Related posts on the SimTrade blog

   ▶ All posts about Quotes

   ▶ Akshit GUPTA Warren Buffett – The Oracle of Omaha

   ▶ Youssef LOURAOUI Long-short equity strategy

   ▶ Rayan AKKAWI Warren Buffet and his basket of eggs

   ▶ Youssef EL QAMCAOUI The Warren Buffett Indicator

Useful resources

Berkshire Hathaway

About the author

The article was written in March 2023 by Federico De ROSSI (ESSEC Business School, Master in Strategy and Management of International Business, 2020-2023).

The Islamic financial system as a solution to tackle social issues

The Islamic financial system as a solution to tackle social issues

Evan CHAISSON

In this article, Evan CHAISSON (ESSEC Business School, Master in Strategy & Management of International Business (SMIB), 2022-2023) comments on a quote by Wolfgang Schafuble about Islamic finance.

Quote

Islamic finance is growing in importance for the global economy. It is therefore important consider questions related to integrating Islamic finance into global finance.

Analysis of the quote

This quote, by Wolfgang Schauble, highlights the growing importance of Islamic finance in the global economy. Islamic finance is a rapidly growing sector, with an estimated value of over $2 trillion in assets worldwide. Figure 1 below gives the Global Islamic Finance Assets Growth (in US$ Trillions). As you can see from the figure, the sector is projected to more than double in value in 2024 based on its 2012 value.

Figure 1. Global Islamic Finance Assets Growth.
Global Islamic Finance Assets Growth
Source: ICD – Refinitiv Islamic Finance Development Report (December 2020).

As such, it is becoming increasingly important for the global financial system to consider questions related to integrating Islamic finance into global finance.

Additionally, this quote presents Islamic finance as a financial system that is different from the classical “Western” system that is commonplace today. As such, it may be able to offer solutions to global issues that the current system is unable to solve.

About the author

Wolfgang Schauble is a German politician who has played a prominent role in German and European politics for several decades. He served as Germany’s Minister of Finance from 2009 to 2017, during which time he played a key role in managing the global financial crisis and the European debt crisis.

Prior to serving as Minister of Finance, Schauble served as Minister of the Interior, where he was responsible for domestic security and law enforcement. He is widely regarded as a conservative politician and has been a member of the Christian Democratic Union (CDU) since 1974.

Financial concepts related to the quote

Although much separates Islamic law from the Western system, there are three main aspects that stand out: prohibition of interest, asset-based financing, and ethical and social considerations.

Prohibition of interest

The prohibition of interest, or riba, is one of the foundational principles of Islamic finance. This principle is based on the Islamic belief that money should not be used as a commodity to generate profit. The concept of riba is not limited to charging interest on loans, but also includes any type of fixed, predetermined, or guaranteed return on investment. Instead of interest-based lending, Islamic finance relies on profit-and-loss sharing (PLS) arrangements, where both the lender and the borrower share the risks and rewards of a particular investment.

PLS contracts take several forms, including mudarabah, musharakah, and ijara. In mudarabah, one party provides the capital, and the other party provides the expertise to invest the capital. Profits are shared according to a pre-agreed ratio, but losses are borne solely by the provider of capital. In musharakah, both parties provide capital and expertise, and profits and losses are shared according to a pre-agreed ratio. In ijara, the financier purchases an asset and leases it to the borrower for a fixed period of time, with the option to purchase the asset at the end of the lease term.

Asset-based financing

In Islamic finance, financial investments are tied to physical assets, such as property or commodities, rather than financial instruments such as stocks, bonds, or, say mutual funds. This is known as asset-based financing, and it is designed to promote stability in the financial system. By tying financial investments to tangible, physical assets, Islamic finance encourages investment in the real economy and discourages speculation.

The use of asset-based financing also has implications for risk management. Since investments are tied to real assets, the risks associated with those investments are more tangible and can be more easily managed. This also encourages all parties involved to share the risk of the venture. In turn, this will help build trust between partners, and, as more time goes by, investment risk will steadily decrease.

Ethical and social considerations

Islamic finance places a strong emphasis on ethical and social considerations in investment decisions. This includes avoiding investments in industries such as alcohol, tobacco, and gambling, which are considered harmful to society. Additionally, Islamic finance institutions often have social welfare programs that aim to promote social justice and alleviate poverty.

One example of a social welfare program in Islamic finance is zakat, which is a form of mandatory charitable giving. Muslims are required to give a portion of their wealth to those in need, and Islamic finance institutions often collect and distribute zakat on behalf of their clients. Islamic finance institutions may also engage in other forms of social welfare, such as providing interest-free loans to small businesses or supporting community development projects.

My opinion about this quote

Having stumbled on this quote by chance, I chose it because it made me curious about a financial system which I previously was not familiar with. This then led me to learn about a financial system which operates in a way that is decidedly different from what Westerners are used to. As a young adult growing up in an increasingly uncertain world with more than its fair share of issues, I am always searching for a solution. Thanks to this quote, I have discovered a financial system that, perhaps, can shape a path towards a better future.

Why should I be interested in this post?

Any student of business and finance, regardless of its origins, has much to gain from simply learning about the Islamic financial system.

This system should be studied, first and foremost, simply because Islamic finance is an increasingly important and influential component of the global financial system. According to the Islamic Financial Services Board, the global Islamic finance industry had assets worth $2.88 trillion in 2019. As the industry continues to grow, there will be a growing demand for professionals who understand the principles and practices of Islamic finance.

Another more ethical reason is because, as mentioned earlier, Islamic finance places a strong emphasis on ethical and social considerations in investment decisions. This includes avoiding investments in industries such as alcohol, tobacco, and gambling, which are considered harmful to society. For students who are interested in pursuing careers in finance with a social and ethical focus, Islamic finance may be of particular interest.

Related posts on the SimTrade blog

   ▶ All post about Quotes

   ▶ Paul Antoine BOHOUN Bourse Régionale des Valeurs Mobilières

Useful resources

Islamic Finance: Principles, Performance and Prospects

About the author

The article was written in March 2023 by Evan CHAISSON (ESSEC Business School, Grande Ecole – Master in Strategy & Management of International Business, 2022-2023).