

In this article, Jayati WALIA (ESSEC Business School, Grande Ecole Program – Master in Management, 2019-2022) explains the concept of moving averages and its implementation in financial markets as an indicator in technical analysis of stock price movements.
What is a moving average?
A moving average is a technique to analyze a time-series of data points by taking subsets of data and computing their averages. The subsets of data can explicitly be of a fixed size like simple moving averages or implicitly take into account all past points like exponential moving averages. These averages computed on rolling windows constitute a new time series. The aim of this exercise is essentially to filter noise and smoothen out the data in order to identify an overall trend in the data.
In financial markets, moving averages are one of the most popular indicators used in technical analysis. A moving average is used to interpret the current trend of a stock price (or any asset). It basically shows the price fluctuations in a stock as a single curve and is calculated using previous prices. Hence, a moving average is a lagging indicator.
Moving averages can be computed for different time periods such as 10 days, 20 days or 200 days. The greater the length of the time period (the lag in the trend), the greater the degree of smoothness in the moving average, however, the lower the price sensitivity of the moving average.
To measure the direction and strength of a trend, moving averages involve price averaging to establish a baseline. For instance, if the price moves above the average, the indicated trend is bullish and if it moves below the average, the trend is bearish. Moving average crossovers are also used commonly in trading strategies to identify trends. It then involves two moving averages: one computed on a short-term period and another one computed over a long-term period. When a shorter period moving average crosses above a longer period moving average, the trend is identified as bullish and indicates a buy signal. When a shorter period moving average crosses below a longer period moving average, the trend is identified as bearish and indicates a sell signal.
Moving averages are also used in development of other indicators such as Bollinger’s bands and Moving Average Convergence Divergence (MACD).
Types of moving averages
The moving average indicator can be of many types. Two basic types of moving averages and their interpretation are explained below: simple moving average and exponential-weighted moving average.
Simple moving average
Simple moving average (SMA) is the easiest type of moving average to compute. An n-period SMA is simply calculated by taking the sum of the closing prices of an asset for the past ‘n’ time-periods divided by ‘n’.
The formula to compute the SMA at time t is given by:
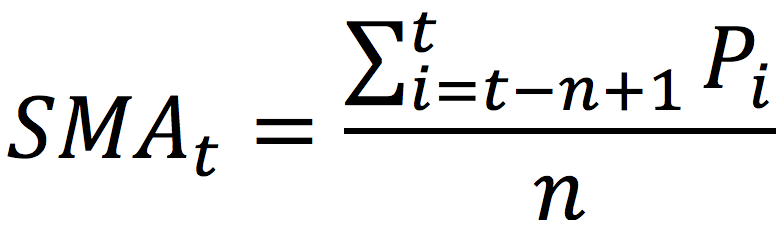
Where Pi represents the asset price at time i (i indicating any time between the interval [t-n, t]).
If the current asset price is greater than the SMA value, the viewpoint for trend is established as bullish and similarly, if the current asset price is less than the SMA value, the viewpoint for trend is established as bearish.
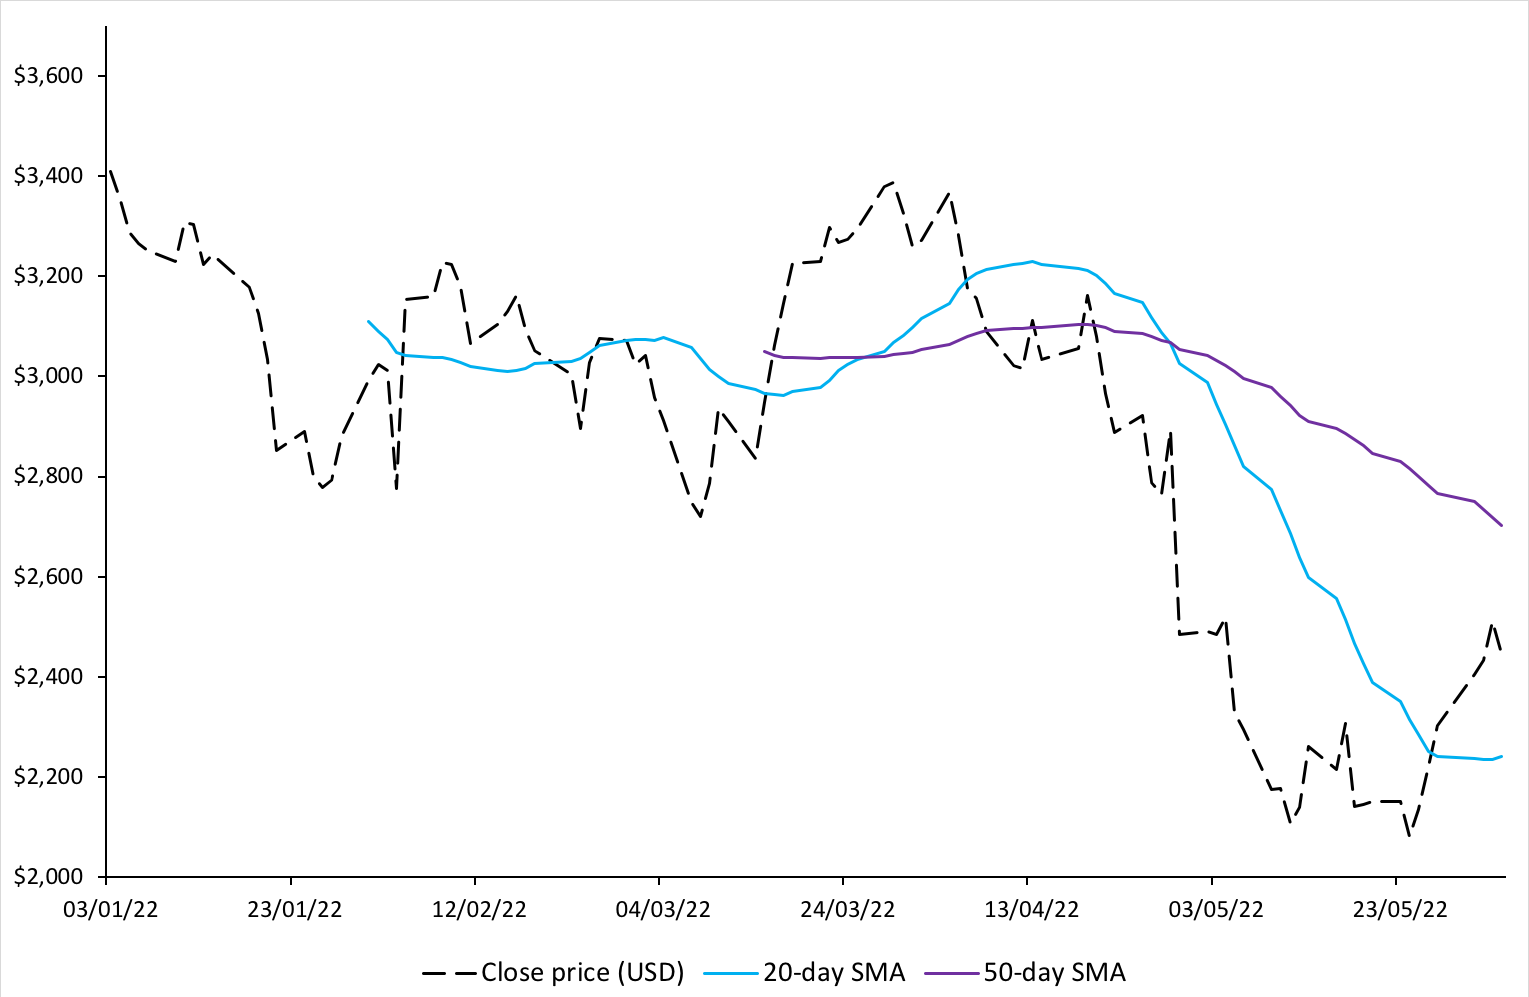
Figure 1 below illustrates the 20-day and 50-day SMA for Amazon stock price.
Figure 1. 20-day and 50-day simple moving averages for Amazon stock price.
 Source: Computation by author.
We can observe from the above figure that when the price is going down, the SMA also is going downwards (as expected from the formula). It can also be seen that the movement of the SMA curve lags the change in price movements. The greater is the chosen time-period for SMA, the greater is the lag observed. Thus, while a 50-day SMA maybe smoother compared to a 20-day SMA, the lag observed will also be greater.
Exponential-weighted moving average
Exponential-weighted moving average (EWMA), also known as exponential moving average (EMA) is an improvisation of moving average over the SMA. It assigns weights to moving averages such that the recent data points are assigned greater weight factors than older data points. Thus, EWMA is more sensitive to recent price changes and the line is smoother than that of SMA.
The formula to compute the value of the EWMA at time t is given by:

Where Pt represents the stock price at time t, and α is a smoothing (or weighting) factor.
The series is initialized as: EWMA0 = P0.
The smoothing factor, α, is a constant value which lies between 0 and 1. The higher the value of α, the greater the weight assigned to the recent data, and the less smooth the EWMA curve.
How to set alpha for an exponential-weighted moving average?
α can be varied by a trader using EWMA based on how heavily he or she wants the recent data to be weighted. If a single EWMA is being considered, an optimal value for alpha can be chosen by minimizing the mean-squared errors (MSE).
A rule of thumb sometimes by traders is specified as:
For instance, for a short-term EWMA with the lookback period, n = 20, and alpha is equal to 2/21 = 0.095. For a long-term EWMA with n = 50, and alpha is equal to 0.039. Note that n is not related to a meaningful number of days like for the SMA.
When α=2/(n+1), the weights of an SMA and EWMA have the same center of mass.
A more sophisticated method is to relate alpha to the ‘half-life’ concept, meaning how long it takes for the weight to become half of the weight of the most recent data.
If the formula of EWMA is expanded for k days, we get the following:

For α=2/(n+1), the idea is that for a sufficiently large value of n, the sum of weights assigned to last n days is around 86%.
Figure 2 below illustrates the weights of each day for a EWMA with α equal to 3.92% (corresponding to n equal to 50 with the rule of thumb used by traders). It can be observed that the weights are decreasing in an exponential fashion and lower values are assigned as weights to the least recent days. The sum of the weights assigned to the first 10 days is 35.60 %, the first 50 days 86.47%, and the first 100 days 98.24%.
Figure 2. Weights of each day for an EWMA
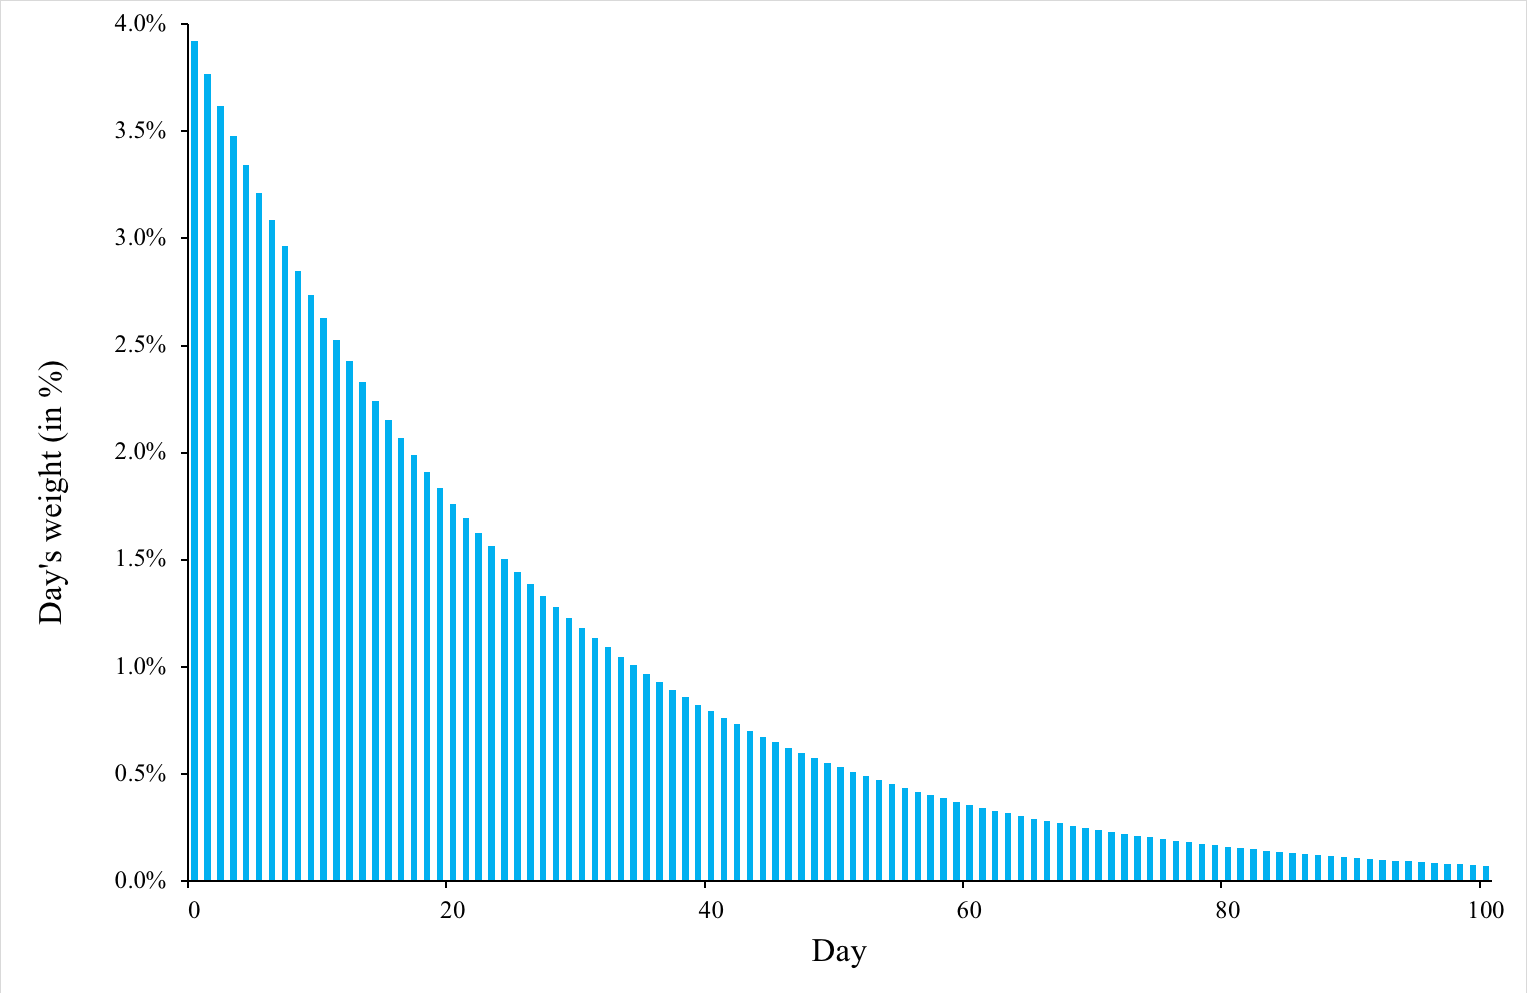
Source: Computation by author.
Crossovers
EWMA is typically used in crossovers, which is a common strategy used by traders wherein two or more moving averages can help determine a more long-term trend. Basically, if a short-term EWMA crosses above a long-term EWMA, the crossover indicates an uptrend and similarly, if a short-term EWMA crosses below a long-term EWMA, the crossover indicates a downtrend. Traders can utilize it to establish their position in the stock.
Figure 3. below illustrates short-term and long-term EWMA curves for Amazon stock prices.
Figure 3. Short-term and long-term EWMA for Amazon stock price.
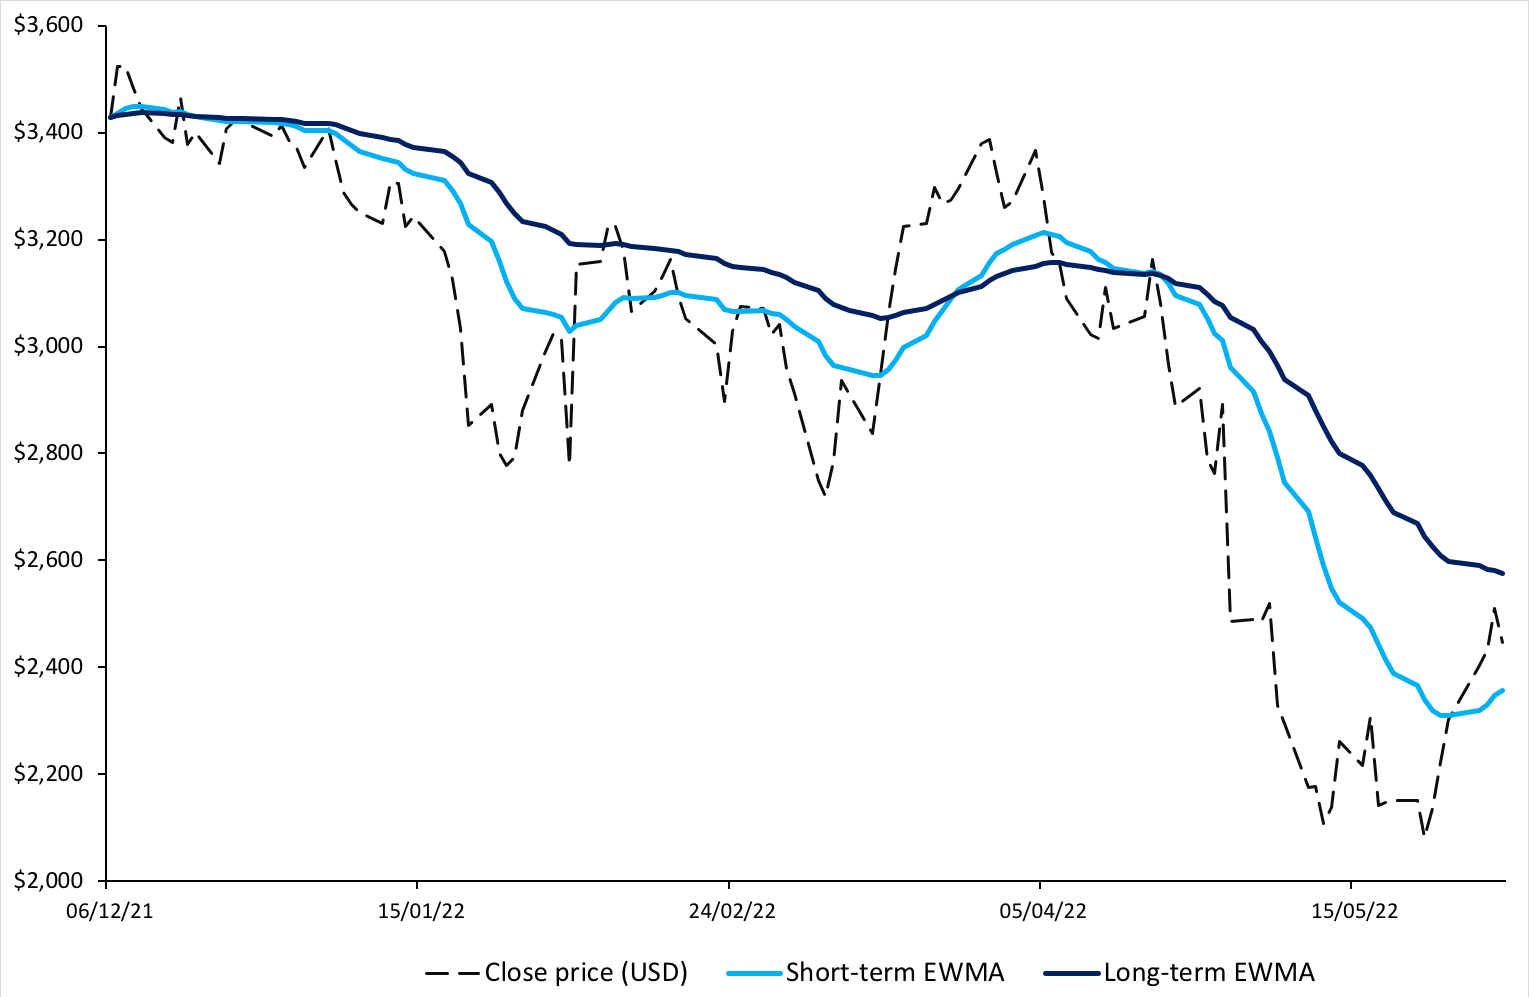
Source: Computation by author.
We can observe in the figure above that the short-term EWMA follows the price movements in Amazon stock more closely than the long-term EWMA does. We can also see that a crossover of the two EWMA curves is followed by a change in trend. For instance, in April 2022, the short-term EWMA crosses below the long-term EWMA and there is an evident downtrend observed post the crossover.
You can also download below the Excel file for computation of SMA and EWMA for Amazon stock price and visualize the above graphs.

Related posts on the SimTrade blog
▶ Jayati WALIA Trend analysis and trading signals
▶ Jayati WALIA Bollinger bands
▶ Akshit GUPTA Momentum trading strategy
Useful resources
Hunter, J. S. (1986). The exponentially weighted moving average. Journal of Quality Technology, 18:203–210.
Wikipedia Moving averages
National Institute of Standards and Technology (NIST) US Department of Commerce Single Exponential Smoothing
About the author
The article was written in August 2022 by Jayati WALIA (ESSEC Business School, Grande Ecole Program – Master in Management, 2019-2022).