
CumEx files

In this article, Matthieu MENAGER (ESSEC Business School, Global Bachelor in Business Administration (GBBA), 2017-2021) we take a look at the CumEx files scandal. The total amount of the fraud, according to the 19 media that revealed the affair (including Le Monde, Die Zeit and La Repubblica) amounts €140 billion.
CumCum & CumEx : What is the difference
CumEx and CumCum are two tax avoidance schemes that came to public attention in 2018. CumCum is considered a legal form of tax optimization, while CumEx is illegal. CumCum involves artificially transferring ownership of dividend-paying shares or securities, when dividends are paid out, to avoid tax. Foreign investors sell their shares back to domestic banks for what is often a very short time before receiving their dividends. These investors thus escape any levy and then recover their dividends, in return for a commission paid to the bank that temporarily housed their financial securities. The operation is so quick that the tax authorities are unable to identify the true owner of the securities. CumEx, on the other hand, consists of obtaining a tax refund on dividends that have never been paid. This practice is illegal and has cost European countries billions of euros.
The damage done by CumEx Files
Dividend fraud, known as “CumEx”, is a form of tax plunder estimated at €140 billion, last amount dating from 2022 (€33.3 billion for France; €28.5 billion for Germany; €27 billion for the Netherlands; €18.8 billion for Spain), as reported by FranceInfo (2021). Revealed in Germany, this fraud affected 11 countries (Germany, France, Spain, Italy, the Netherlands, Denmark, Belgium, Austria, Finland, Norway and Switzerland). Hanno Berger, a renowned lawyer, has devised a manipulation that involves buying and selling shares around the time of the dividend payment, so quickly that the tax authorities can no longer identify the true owner. The manipulation, which requires the agreement of several investors, enables the same dividend tax refund to be claimed several times over, thereby prejudicing the tax authorities.
The scam can be illustrated as follows:
CumCum
Tim from Frankfurt transfers his shares in a French company to Hugo, who lives in Dubai, where dividends are taxed at 0% under an agreement between Paris and Dubai, a few days before the dividend payment (Figure 1). The dividends are then paid by the French company to Hugo (Figure 2) and therefore has no dividend taxes to pay to the French state (Figure 3). The shares are then returned to Tim, who didn’t have to pay any taxes (a tax saving of 15 to 30%). The tax system in France for dividends is a flat tax of 30% and consists of a single flat tax of 12.8% and 17.2% social tax. Tim and Hugo may agree to share the tax saving between them (Figure 4).
Figure1. CumCum mechanism – First step:
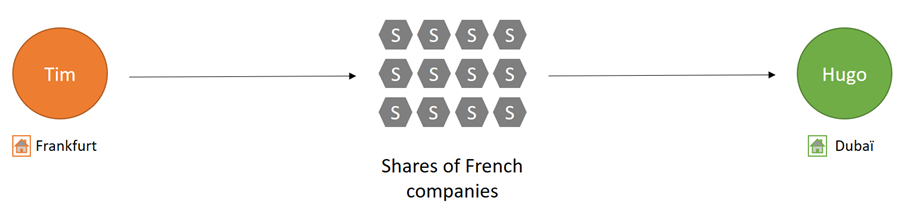
Source: The author.
Figure 2. CumCum mechanism – Second step:
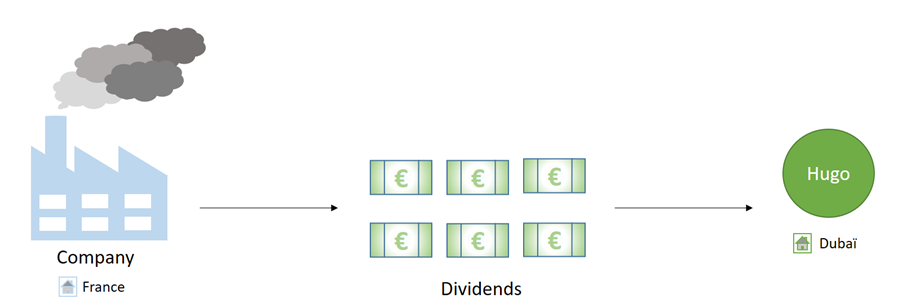
Source: The author.
Figure 3. CumCum mechanism – Third step:
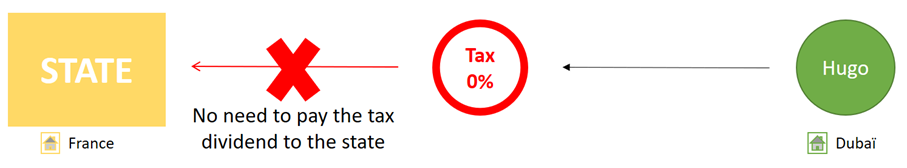
Source: The author.
Figure 4. CumCum mechanism – Fourth step:
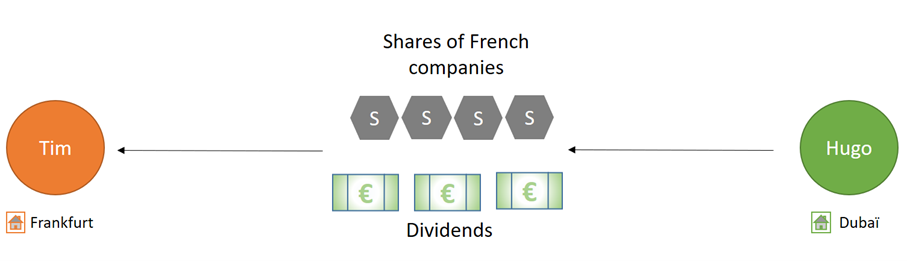
Source: The author.
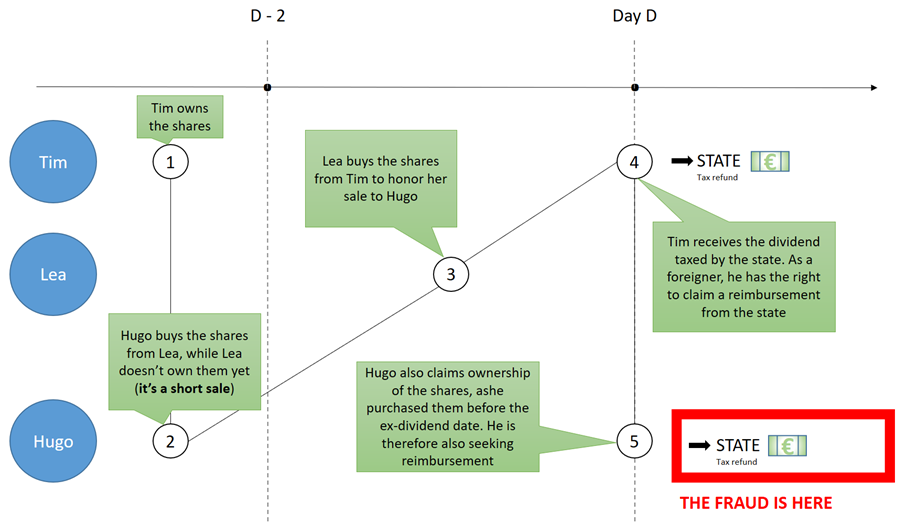
CumEx
Tim, Lea and Hugo will trade hundreds of thousands of shares over a very short period around the dividend payment date. The tax authorities will have no way of knowing who the real owner of the shares is and they’ll pay back taxes they haven’t even collected.
Figure 5. CumEx mechanism
Source: The author.
Who is implicated?
BNP Paribas, Société Générale, Natixis and Crédit Agricole (Cacib) are suspected of helping their customers to avoid paying tax on dividends. The resale and repurchase of shares, even for a short period, is in fact legal. On the other hand, the industrialisation of this practice to evade tax can be punished. In 2018, BNP Paribas, Crédit Agricole and Société Générale were among the French banks singled out by the “CumEx Files” investigation group for this type of practice.
In Germany, dozens of people have been charged (traders, bankers, lawyers, advisers). The Warburg bank in Hamburg is one of the banks accused and should have reimbursed 47 million euros to the German port city. The municipality waived this obligation in 2016. The investigators are therefore looking into whether political leaders – including Olaf Scholz, the city’s mayor at the time – put pressure on the municipal tax authorities to waive recovery of these taxes. The decision to waive repayment of the sums owed by the Warburg bank was apparently taken shortly after a conversation between Olaf Scholz and Christian Olearius, then head of the bank. Investigators discovered more than €200,000 in cash in a safe at the home of another SPD member of parliament, who may have played a role in the bank’s repayment, fuelling suspicions of possible secret financial arrangements.
At the end of March 2023, the French Parquet national financier (PNF – a national prosecutor’s office specializing in major economic and financial crime) launched a wave of searches. On May 2, before the French Senate, Gabriel Attal, Minister Delegate for Public Accounts, made public the total amount of reassessments notified to date by the tax authorities: €2.5 billion, according to L’Express. This bill, which includes penalties in addition to the amounts reassessed, concerns in particular the five banks targeted by the PNF searches (Société Générale, BNP Paribas and its subsidiary Exane, Natixis and HSBC), but also Crédit Agricole (which managed to avoid the search).
Financial concepts
Shares
Shares are part of a company’s equity when it is incorporated as a public limited company. It is therefore a source of financing for the company, in the same way as debt securities, from which, however, it differs clearly. It has an unlimited lifespan (it can only be disposed of by selling the share, and there is no contractual repayment), and its holder bears the full risk of the company (he or she receives no income if the company goes badly, and in the event of liquidation the shareholder takes second place to the creditor in the distribution of the proceeds from the sale of assets – in other words, most of the time he or she can recover nothing). In return, the share gives the holder the right to share in the company’s profits and management via voting rights.
Dividends
By definition, the dividend is defined as the shareholder’s income. This is the amount that a shareholder (owner of shares in a company) receives as a result of the profits generated by the company over a given period. The choice of dividend payment is made at the general meeting. At that time, distributable profits and available reserves are recorded.
Shareholders receive a dividend in two cases:
- When there is a distributable net profit
- But also when the company does not make a profit but wishes to draw on its reserves of cash to remunerate its shareholders.
Why should I be interested in this post?
CumEx Files is also a very recent scandal. What I find most shocking is that some very well-known banking institutions are also implicated in the scandal. Politicians (including the German Chancellor) are even suspected of involvement. So it’s worth taking a closer look at these affairs to understand how they worked.
Related posts on the SimTrade blog
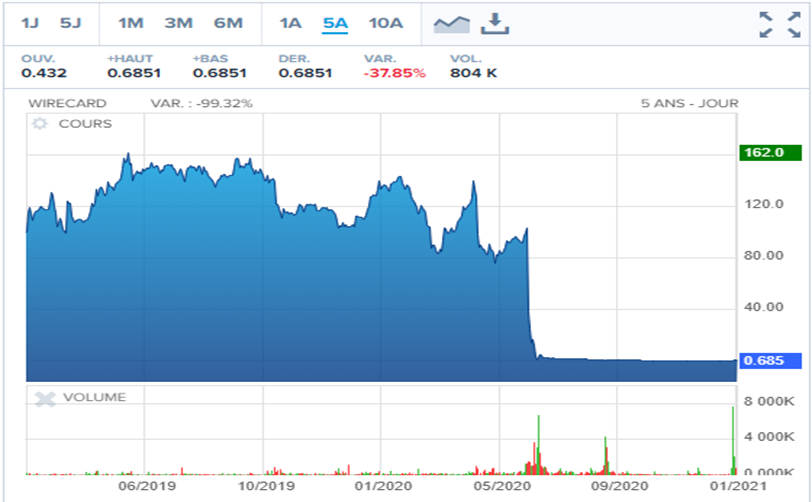
▶ Louis DETALLE Wirecard: At the heart of the biggest German financial scandal of the 21st century
▶ Louis DETALLE The incredible story of Nick Leeson & the Barings Bank
▶ Louis DETALLE The 3 biggest corporate frauds of the 21st century
Useful resources
Press articles
Le Parisien (21/10/2021) CumEx Files : la France a perdu 33 milliards d’euros de recettes fiscales en vingt ans
Le Monde (18/10/2018) « CumCum », « CumEx » : le scandale des dividendes expliqué simplement
Le Monde (15/05/2023) Scandale « CumCum » : le fisc réclame plus de 2,5 milliards d’arriérés fiscaux aux banques
L’Express (19/08/2022) Allemagne : tout comprendre au scandale “Cum-ex Files” qui éclabousse Olaf Scholz
France Info (21/10/2021) “CumEx Files” : ce que l’on sait du “pillage fiscal à 140 milliards d’euros” révélé par plusieurs médias
France 24 (21/10/2021) “CumEx Files” : Hanno Berger, le cerveau présumé du scandale aux 140 milliards d’euros
Le Monde (21/10/2021) « CumEx Files » : un pillage fiscal à 140 milliards d’euros, quatre banques françaises dans le viseur du fisc
Videos
Le Monde (18/10/2018) CumEx Files : comment arnaquer le fisc avec la Bourse
Zonebourse (31/03/2023) Comment les banques fraudent le fisc grâce aux dividendes (CumCum, CumEx)
The Dark Side of Money (15/02/2022) CumEx Files: Biggest TAX FRAUD in Europe
Explainitychannel (04/03/2020) Cum-ex deals explained
About the author
The article was written in February 2024 by Matthieu MENAGER (ESSEC Business School, Bachelor in Business Administration (BBA), 2017-2021).


 Source: Madoff
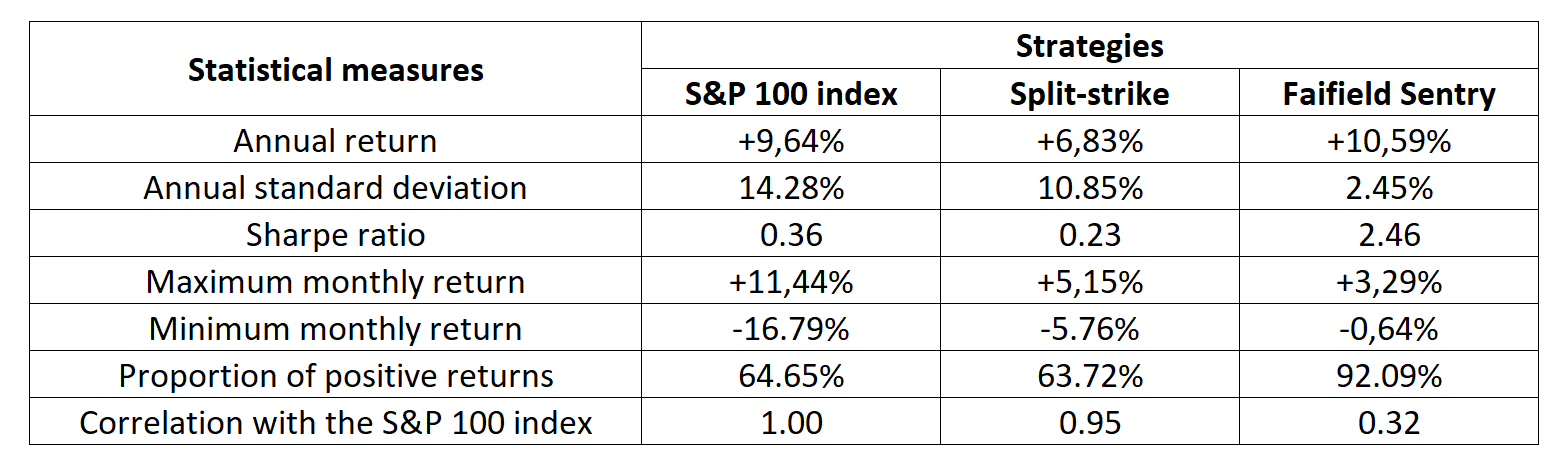 Source: Bernard and Boyle (2009)