

In this article, Youssef LOURAOUI (Bayes Business School, MSc. Energy, Trade & Finance, 2021-2022) presents the equity market neutral strategy. The objective of the equity market neutral strategy is to benefit from both long and short positions while minimizing the exposure to the equity market fluctuations.
This article is structured as follow: we introduce the equity market neutral strategy. Then, we present a practical case study to grasp the overall methodology of this strategy. We conclude with a performance analysis of this strategy in comparison with a global benchmark (MSCI All World Index and the Credit Suisse Hedge Fund index).
Introduction
According to Credit Suisse (a financial institution publishing hedge fund indexes), an equity market neutral strategy can be defined as follows: “Equity Market Neutral funds take both long and short positions in stocks while minimizing exposure to the systematic risk of the market (i.e., a beta of zero is desired). Funds seek to exploit investment opportunities unique to a specific group of stocks, while maintaining a neutral exposure to broad groups of stocks defined for example by sector, industry, market capitalization, country, or region. There are a number of sub- sectors including statistical arbitrage, quantitative long/short, fundamental long/short and index arbitrage”. This strategy makes money by holding assets that are decorrelated from a specific benchmark. The strategy can potentially generate returns in falling markets.
Mathematical foundation for the beta
This strategy relies heavily on the beta, derived from the capital asset pricing model (CAPM). Under this framework, we can relate the expected return of a given asset and its risk:
![]()
Where :
- E(r) represents the expected return of the asset
- rf the risk-free rate
- β a measure of the risk of the asset
- E(rm) the expected return of the market
- E(rm) – rf represents the market risk premium.
In this model, the beta (β) parameter is a key parameter and is defined as:
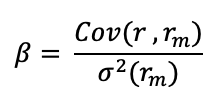
Where:
- Cov(r, rm) represents the covariance of the asset return with the market return
- σ2(rm) is the variance of market return.
The beta is a measure of how sensitive an asset is to market swings. This risk indicator aids investors in predicting the fluctuations of their asset in relation to the wider market. It compares the volatility of an asset to the systematic risk that exists in the market. The beta is a statistical term that denotes the slope of a line formed by a regression of data points comparing stock returns to market returns. It aids investors in understanding how the asset moves in relation to the market. According to Fama and French (2004), there are two ways to interpret the beta employed in the CAPM:
- According to the CAPM formula, beta may be thought in mathematical terms as the slope of the regression of the asset return on the market return observed on different periods. Thus, beta quantifies the asset sensitivity to changes in the market return;
- According to the beta formula, it may be understood as the risk that each dollar invested in an asset adds to the market portfolio. This is an economic explanation based on the observation that the market portfolio’s risk (measured by 〖σ(r_m)〗^2) is a weighted average of the covariance risks associated with the assets in the market portfolio, making beta a measure of the covariance risk associated with an asset in comparison to the variance of the market return.
Additionally, the CAPM makes a distinction between two forms of risk: systematic and specific risk. Systematic risk refers to the risk posed by all non-diversifiable elements such as monetary policy, political events, and natural disasters. By contrast, specific risk refers to the risk inherent in a particular asset and so is diversifiable. As a result, the CAPM solely captures systematic risk via the beta measure, with the market’s beta equal to one, lower-risk assets having a beta less than one, and higher-risk assets having a beta larger than one.
Application of an equity market neutral strategy
For the purposes of this example, let us assume that a portfolio manager wants to invest $100 million across a diverse equity portfolio while maintaining market-neutral exposure to market index changes. To create an equity market-neutral portfolio, we use five stocks from the US equity market: Apple, Amazon, Microsoft, Goldman Sachs, and Pfizer. Using monthly data from Bloomberg for the period from 1999 to 2022, we compute the returns of these stocks and their beta with the US equity index (S&P500). Using the solver function on Excel, we find the weights of the portfolio with the maximum expected return with a beta equal to zero.
Table 1 displays the target weights needed to build a portfolio with a neutral view on the equity market. As shown by the target allocation in Table 1, we can immediately see a substantial position of 186.7 million dollars on Pfizer while keeping a short position on the remaining equity positions of the portfolio totaling 86.7 million dollars in short positions. Given that the stocks on the short list have high beta values (more than one), this allocation makes sense. Pfizer is the only defensive stock and has a beta of 0.66 in relation to the S&P 500 index.
If the investment manager allocated capital in the following way, he would create an equity market neutral portfolio with a beta of zero:
Apple: -$4.6 million (-4.6% of the portfolio; a weighted-beta of -0.066)
Amazon: -$39.9 million (-39.9% of the portfolio; a weighted-beta of -0.592)
Microsoft: -$16.2 million (-16.2% of the portfolio; a weighted-beta of -0.192)
Goldman Sachs: -$26 million (-26% of the portfolio; a weighted-beta of -0.398)
Pfizer: $186.7 million (186.7% of the portfolio; a weighted-beta of 1.247)
Table 1. Target weights to achieve an equity market neutral portfolio.
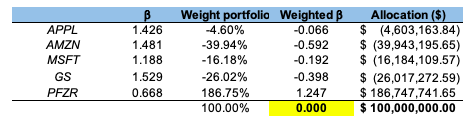 Source: computation by the author (Data: Bloomberg)
You can find below the Excel spreadsheet that complements the explanations about the equity market neutral portfolio.

An extension of the equity market neutral strategy to other asset classes
A portfolio with a beta of zero, or zero systematic risk, is referred to as a zero-beta portfolio. A portfolio with a beta of zero would have an expected return equal to the risk-free rate. Given that its expected return is equal to the risk-free rate or is relatively low compared to portfolios with a higher beta. Such portfolio would have no correlation with market movements.
Since a zero-beta portfolio has no market exposure and would consequently underperform a diversified market portfolio, it is highly unlikely that investors will be interested in it during bull markets. During a bear market, it may garner some interest, but investors are likely to ask if investing in risk-free, short-term Treasuries is a better and less expensive alternative to a zero-beta portfolio.
For this example, we imagine the case of a portfolio manager wishing to invest 100M$ across a diversified portfolio, while holding a zero-beta portfolio with respect to a broad equity index benchmark. To recreate a diversified portfolio, we compiled a shortlist of trackers that would represent our investment universe. To maintain a balanced approach, we selected trackers that would represent the main asset classes: global stocks (VTI – Vanguard Total Stock Market ETF), bonds (IEF – iShares 7-10 Year Treasury Bond ETF and TLT – iShares 20+ Year Treasury Bond ETF), and commodities (DBC – Invesco DB Commodity Index Tracking Fund and GLD – SPDR Gold Shares).
To construct the zero-beta portfolio, we pulled a ten-year time series from Refinitiv Eikon and calculated the beta of each asset relative to the broad stock index benchmark (VTI tracker). The target weights to create a zero-beta portfolio are shown in Table 2. As captured by the target allocation in Table 2, we can clearly see an important weight for bonds of different maturities (56.7%), along with a 33.7% towards commodities and a small allocation towards global equity equivalent to 9.6% (because of the high beta value).
If the investment manager allocated capital in the following way, he would create a zero-beta portfolio with a beta of zero:
VTI: $9.69 million (9.69% of the portfolio; a weighted-beta of 0.097)
IEF: $18.99 million (18.99% of the portfolio; a weighted-beta of -0.029)
GLD: $18.12 million (18.12% of the portfolio; a weighted-beta of 0.005)
DBC: $15.5 million (15.50% of the portfolio; a weighted-beta of 0.070)
TLT: $37.7 million (37.7% of the portfolio; a weighted-beta of -0.143)
Table 2. Target weights to achieve a zero-beta portfolio.
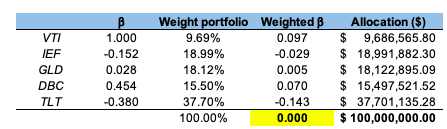 Source: computation by the author. (Data: Reuters Eikon)
You can find below the Excel spreadsheet that complements the explanations about the zero beta portfolio.
Performance of the equity market neutral strategy
To capture the performance of the equity market neutral strategy, we use the Credit Suisse hedge fund strategy index. To establish a comparison between the performance of the global equity market and the equity market neutral strategy, we examine the rebased performance of the Credit Suisse managed futures index with respect to the MSCI All-World Index.
The equity market neutral strategy generated an annualized return of -0.18% with an annualized volatility of 7.5%, resulting in a Sharpe ratio of -0.053. During the same time period, the Credit Suisse Hedge Fund index had an annualized return of 4.34 percent with an annualized volatility of 5.64 percent, resulting in a Sharpe ratio of 0.174. With a neutral market beta exposure of 0.04, the results are consistent with the theory that this approach does not carry the equity risk premium. This aspect justifies the underperformance.
Figure 1 gives the performance of the equity market neutral funds (Credit Suisse Equity Market Neutral Index) compared to the hedge funds (Credit Suisse Hedge Fund index) and the world equity funds (MSCI All-World Index) for the period from July 2002 to April 2021.
Figure 1. Performance of the equity market neutral strategy.
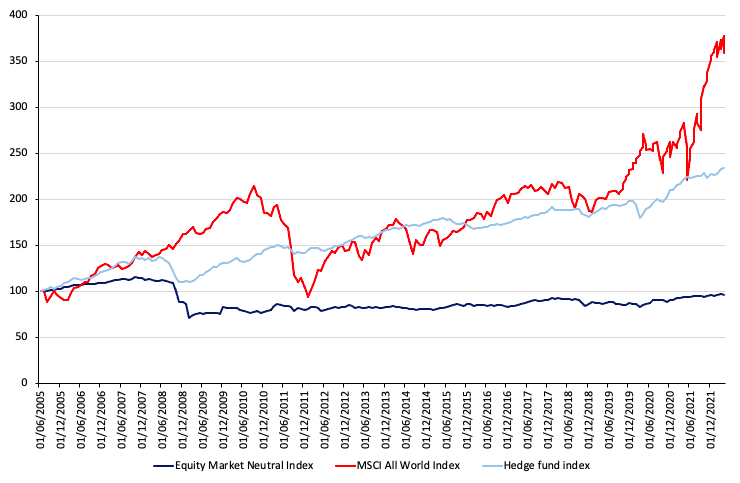
Source: computation by the author (Data: Bloomberg)
You can find below the Excel spreadsheet that complements the explanations about the Credit Suisse equity market neutral strategy.
Why should I be interested in this post?
Understanding the performance and risk of the equity market neutral strategy might assist investors in incorporating this hedge fund strategy into their portfolio allocation.
Related posts on the SimTrade blog
Hedge funds
▶ Youssef LOURAOUI Introduction to Hedge Funds
▶ Youssef LOURAOUI Global macro strategy
▶ Youssef LOURAOUI Long/short equity strategy
Financial techniques
▶ Youssef LOURAOUI Yield curve structure and interet rate calibration
▶ Akshit GUPTA Interest rate swaps
▶ Youssef LOURAOUI Portfolio
Useful resources
Academic research
Pedersen, L. H., 2015. Efficiently Inefficient: How Smart Money Invests and Market Prices Are Determined. Princeton University Press.
Business Analysis
Credit Suisse Hedge fund strategy
Credit Suisse Hedge fund performance
Credit Suisse Equity market neutral strategy
Credit Suisse Equity market neutral performance benchmark
About the author
The article was written in January 2023 by Youssef LOURAOUI (Bayes Business School, MSc. Energy, Trade & Finance, 2021-2022).