

In this article, Youssef LOURAOUI (ESSEC Business School, Global Bachelor of Business Administration, 2017-2021) presents the Minimum Volatility Factor, which is based on a risk factor that aims to get exposure to securities with a low volatility profile as measured by beta compared to the market, as well as a low correlation with other assets.
This article is structured as follows: we begin by defining the minimum volatility factor and reviewing academic studies. The MSCI Minimum Volatility Factor Index, which is well used as a benchmark in the asset management industry, is next presented in terms of performance, risk-return trade-off, and behavior during the Covid-19 crisis. We showcase the ETF market for investors looking to profit from the minimum volatility factor.
Definition
In the world of investing, a factor is any aspect that helps explain an asset’s long-term risk and return performance. In the late 1970s, the portfolio management industry’s objective was to capture the market return on a portfolio. As a result of Markowitz and Tobin’s earlier research, William Sharpe, John Lintner, and Jan Mossin independently developed the Capital Asset Pricing Model (CAPM). Because it enabled investors to properly value assets in terms of systematic risk, the CAPM was a significant evolutionary step forward in the theory of capital market equilibrium (Mangram, 2013).
Eugene Fama and Kenneth French, following the CAPM’s original work, developed the Fama-French Three-Factor model in 1993 to solve the CAPM’s inadequacies. It claims that, in addition to the market risk component of the CAPM, two other factors have an effect on the returns on securities and portfolios: market capitalization (called the “size” factor) and the book-to-market ratio (referred to as the “value” factor). Other factor characteristics were developed to capture some additional performance as financial research advanced and significant contributions were made.
Minimum volatility is based on a risk factor that aims to get exposure to securities with a low volatility profile as measured by beta compared to the market, as well as a low correlation with other assets (MSCI Factor research, 2021).
Academic research
In the late 1970s, the portfolio management industry aimed to capture the market portfolio return, but as financial research advanced and certain significant contributions were made, this gave rise to other factor characteristics to capture some additional performance. The financial literature has long advocated for taking on more risk to get a better rate of return. This, however, is a widespread misunderstanding among investors. While extremely volatile equities can deliver spectacular gains, scholarly research has consistently demonstrated that low-volatility companies deliver superior risk-adjusted returns over time. This phenomenon is referred to as the “low volatility anomaly”, and that is why many long-term investors include low volatility factor strategies in their portfolios. This strategy is consistent with Henry Markowitz’s famous 1952 article, in which he preaches the virtues of asset diversification to construct a portfolio that provides the greatest balanced return in a risk-reward framework.
Empirical studies
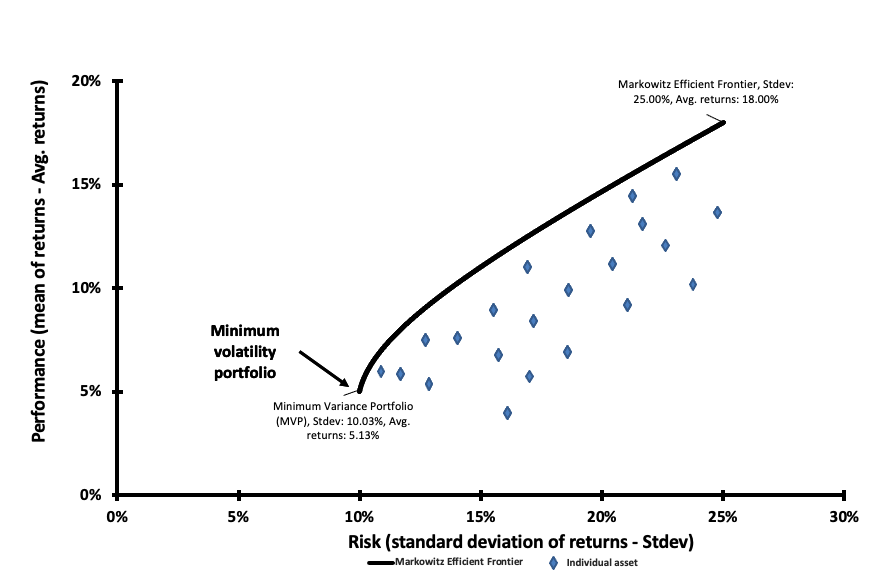
Figure 1 represents the Markowitz Efficient Frontier, where all the efficient portfolios lie on the upper line. The efficient frontier is a collection of optimum portfolios that provide the highest expected return for a specified level of risk or the lowest risk for a specified level of return. Portfolios that fall below the efficient frontier are suboptimal because they do not provide a sufficient rate of return relative to the degree of risk (Figure 1).
Figure 1. Markowitz Efficient Frontier
Source: calculations done by the author
Economic interpretation
The term ‘Risk-Reward trade-off’ alludes to Markowitz’s core principle that the riskier an investment, the greater the required potential return. Investors will typically keep a risky investment only if the anticipated return is sufficiently high to compensate them for incurring the risk. Risk is the risk that the actual return on an investment will be less than expected, which is technically defined by standard deviation. A higher standard deviation indicates a greater risk and, thus, a greater potential return. Investors that are willing to take on risk expect to receive a risk premium. The term “risk premium” refers to “the expected return on an investment that is more than the risk-free rate of return”. The greater the risk, the greater the risk premium required by investors.
MSCI Minimum Volatility Factor Index
MSCI Factor Indexes are rules-based, transparent indexes that target equities with favorable factor qualities, as determined by academic discoveries and empirical outcomes, and are designed for easy implementation, replicability, and usage in both standard indexed and active portfolios. The MSCI Minimum Volatility Indexes are created by optimizing a set of sector, country, and factor restrictions to generate an index with the least overall volatility while also maintaining index replicability and investability. The major ways to executing a minimal volatility strategy fall into two categories in terms of methodology: (1) straightforward rank and selection and (2) optimization-based solutions (MSCI Factor research, 2021).
A straightforward technique rates the universe of stocks by anticipated volatility, then picks a subset of the members from the universe and applies a weighting mechanism. The connection between stock returns, which can have a major influence on the overall volatility strategy, is typically ignored in these techniques. While a basic rank and selection technique represents individual stock volatility, optimization-based approaches take into consideration both volatility and correlation effects, or the size and degree to which stocks move in lockstep (MSCI Factor research, 2021).
A naïve unconstrained minimal volatility strategy, on the other hand, has its own set of difficulties, including biases toward certain sectors and nations, undesirable factor exposures, and possibly excessive rebalancing turnover. However, well-designed optimizations with properly defined restrictions may be able to compensate for these flaws. Minimum volatility is classified as a conservative factor, which means that it has tended to benefit from periods of economic contraction. This type of strategy is more concerned with managing volatility than maximizing gains. In this sense, this strategy has produced a premium over the market for long periods, contradicting the principle that investors should not be rewarded with higher risk-adjusted returns for taking less risk than the market (MSCI Factor research, 2021).
The key objective of a minimum volatility strategy is to capture regional and global exposure to potentially less risky stocks. Historically, the MSCI Minimum Volatility Factor Index, for instance, have achieved lower volatility and lower drawdowns (peak-to-trough declines) relative to their factor counterparts during major market downturns (MSCI Factor research, 2021).
Tactical investors have employed MSCI Minimal Volatility Factor Index to decrease risk during market downturns while maintaining equity exposure. The minimum volatility premium was found in the early 1970s by economist Fischer Black coupled with the pioneer work of Portfolio construction of Henry Markowitz in 1952. and built on by others subsequently. After that, according to one idea, investors underpay for low volatility equities because they perceive them to be less lucrative, while overpaying for high volatility equities because they are seen as long-shot prospects for bigger profits. An alternative scholarly argument contends that investors might be overconfident in their abilities to predict the future, and that their views diverge more for high volatility equities, which have fewer predictable outcomes, resulting in increased volatility and poorer returns (MSCI Factor research, 2021).
Performance of the MSCI Minimum Volatility Factor Index
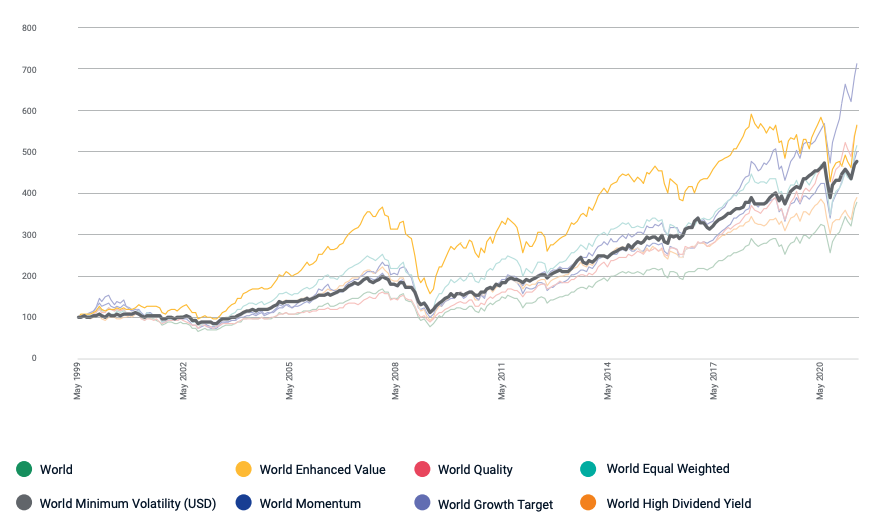
Figure 2 compares the MSCI Minimum Volatility Factor Index’s performance to those of other factors from May 1999 to May 2020. All indices are rebalanced on a 100-point scale to ensure consistency in performance and to facilitate factor comparisons.
Figure 2. Performance of the MSCI Minimum Volatility Factor Index from 1999-2020.
Source: MSCI Factor research, 2021.
With a 1.16% percent yearly return over the MSCI World Index since 1999, the MSCI World Minimum Volatility (USD) Index has consistently provided excess profits over the long run while maintaining a profile of risk among the most conservative of the peer group analysed (MSCI Factor research, 2021).
Risk-return profile of MSCI Minimum Volatility Factor Index
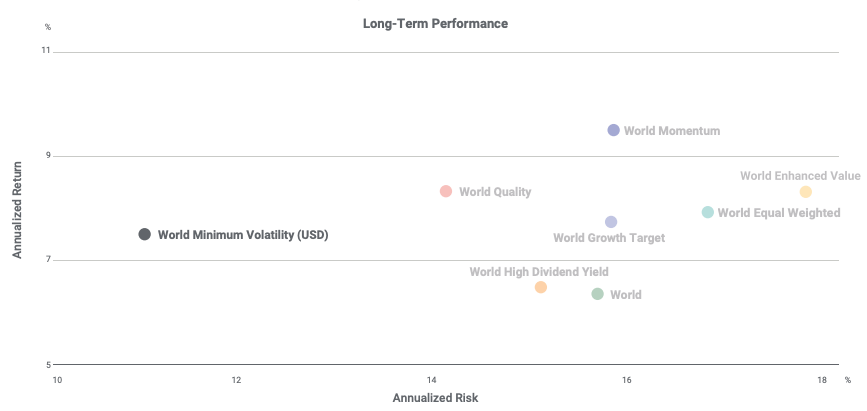
Figure 3 shows the MSCI Minimum Volatility Factor Index compared to other factors over the period May 1999 – May 2020 in terms of risk/reward. The risk-return tradeoff states that the potential return rises with an increase in risk. Individuals connect low levels of uncertainty about future returns with low potential returns, while high levels of uncertainty or risk are associated with large potential returns. According to the risk-tradeoff trade-off, an investor’s money can generate higher returns only if the investor is willing to endure a higher risk of loss (Figure 3).
Figure 3. Risk-return profile of MSCI Minimum Volatility Factor Index compared to a peer group.
Source: MSCI Factor research, 2021.
Behavior of the MSCI Minimum Volatility Factor Index during the Covid-19 crisis
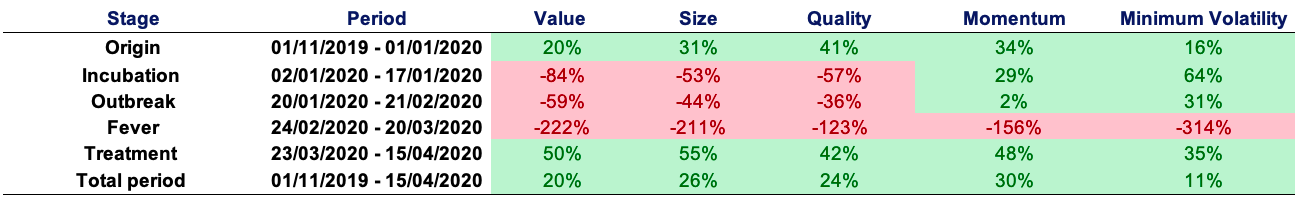
The Covid-19 crisis has not only caused significant social and economic suffering, but it had also an impact on financial markets. To study the behavior of the factors during the Covid-19 crisis, we compute the return of the MSCI Factor indexes during the different stages of the crisis. The MSCI Factor indexes are: value, size, quality, momentum and minimum volatility. Following Pagano et al. (2020) and Hasaj and Sherer (2021), we decompose the Covid-19 crisis into five stages: origin, incubation, outbreak, fever, and treatment. Each stage is described below.
- Origin (01/11/2019 – 01/01/2020): the first instances are reported in Wuhan, China.
- Incubation (02/01/2020 – 17/01/2020): during this phase, the number of patients began to rise at a faster rate, raising concerns about the disease’s severity.
- Outbreak (20/01/2020 – 21/02/2020): the number of cases rose to the point that the World Health Organization (WHO) decided that this illness may pose a major threat to the world’s population, and the pandemic was proclaimed.
- Fever (24/02/2020 – 20/03/2020): markets are extremely volatile, owing to government restrictions aimed at flattening the infection curve, with the decision to impose a lockdown in numerous nations as the most notable measures, among others.
- Treatment (23/03/2020 – 15/04/2020): most of this turnaround occurs between March and June 2020, which corresponds with the start of good news about the discovery and widespread use of the vaccine.
Table 1 gives the performance of the MSCI factor indexes during the different stages of the Covid-19 crisis. Performance is measured by the return computed on the time-period of each stage, and then annualized for comparison across the different stages. We use data are from Thomson Reuters.
Table 1. Performance of the MSCI factor indexes during the Covid-19 crisis.
Source: computation by the author (Data source: Thomson Reuters).
One conclusion that can be drawn from our research supports the reason for the minimal volatility strategy, namely, to minimize portfolio volatility by keeping limited exposure to highly volatile stocks. In this respect, the Covid-19 pandemic period served as a significant stress test for this strategy, which outperformed the other return factors in the period preceding and following worldwide containment, with a risk-reward trade-off much higher than the average of the chosen factors.
ETFs to capture the Minimum Volatility factor
Let us recall that an Exchange-Traded Fund (ETF) is an investment vehicle that seeks to mirror the performance of a benchmark like an equity index and is traded on a continuous basis during the day like stocks. By investing in ETFs, an investor gains access to a plethora of diversification options through several asset classes (equity, bonds, currency, commodity, real estate, etc.).
Figure 4 gives the overall ETF distribution of the major providers of minimal volatility factor ETFs in terms of asset under management. By examining the market overview for minimal volatility factor investments, we can observe Blackrock ETFs (iShares) dominance, with 78.43% of the overall minimum volatility factor ETF market. This represents roughly 47B$ of the overall minimum volatility market retained for this benchmark.
Figure 4. Minimum Volatility factor ETF market.
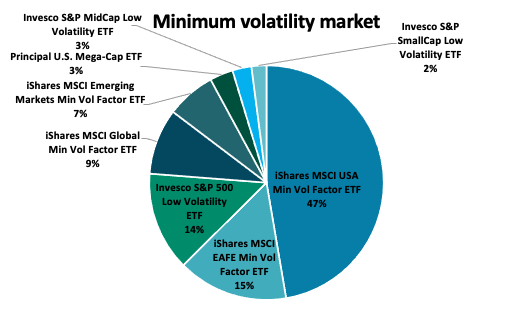
Source: etf.com, 2021.
Table 2 gives more detailed information about the biggest minimum volatility factor ETF providers: the asset under management (AUM), expense ratio (ER) and 3-month total return (3-Mo TR) and the segment for the investments.
Table 2. Ranking of the biggest Minimum Volatility ETF providers.
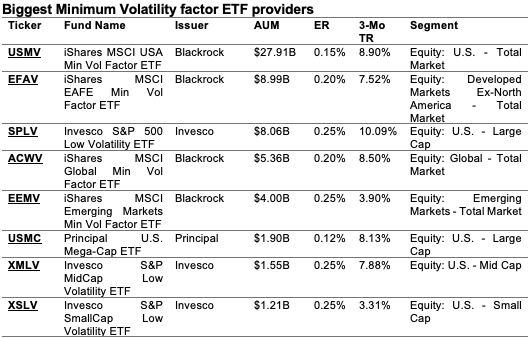
Source: etf.com, 2021.
Why should I be interested in this post?
You may have seen the CAPM linked to the market factor in your 101 finance course if you are an undergraduate or graduate student at a business school or university. This article raises awareness of the presence of other additional risk factors.
If you’re an investor, you might want to explore increasing your exposure to the minimum volatility factor to boost your portfolio’s total return.
Related posts on the SimTrade blog
▶ Youssef LOURAOUI Size Factor
▶ Youssef LOURAOUI Value Factor
▶ Youssef LOURAOUI Yield Factor
▶ Youssef LOURAOUI Momentum Factor
▶ Youssef LOURAOUI Quality Factor
▶ Youssef LOURAOUI Growth Factor
Useful resources
Academic research
Markowitz, H., 1952. Portfolio Selection. The Journal of Finance, 7(1): 77-91.
Mangram, M.E., 2013. A simplified perspective of the Markowitz Portfolio Theory. Global Journal of Business Research, 7(1): 59-70
Hasaj, M., Sherer, B., 2021. Covid-19 and Smart-Beta: A Case Study on the Role of Sectors. EDHEC-Risk Institute Working Paper.
Pagano, M., Wagner, C., Zechner, J. 2020. Disaster Resilience and Asset Prices, Working paper.
Business analysis
etf.com, 2021. Biggest Minimum Volatility ETF providers.
MSCI Investment Research, 2021. Factor Focus: Volatility.
About the author
The article was written in September 2021 by Youssef LOURAOUI (ESSEC Business School, Global Bachelor of Business Administration, 2017-2021).
10 thoughts on “Minimum Volatility Factor”
Comments are closed.