Trading as Principal in Illiquid Markets: What No Finance Course Can Fully Prepare You For

Isaac Fainstein

In this article, Isaac FAINSTEIN, Director at Petrini Valores and Visiting Lecturer at IESEG School of Management (Lille), shares his professional experience as a trader in illiquid fixed income and emerging markets — and what practitioners know that most finance courses never cover.

About Petrini Valores

Petrini Valores is an Argentine broker-dealer specializing in fixed income, equities, derivatives, and financing. The firm operates as a market maker in illiquid corporate and provincial bonds, across multiple asset classes: peso-denominated, USD-denominated, inflation-linked, and dollar-linked instruments. It also participates as a member of underwriting syndicates in primary bond issuances.

As Director of the trading desk, I am responsible for pricing, execution, and risk management across these asset classes on a daily basis.

Logo of Petrini Valores.

Logo of Petrini Valores
Source: Petrini Valores.

Trading in practice: what the desk actually looks like

I have been trading fixed income and foreign exchange in Argentine markets for over fifteen years. Over that same period, I have taught applied finance courses at IESEG School of Management in Lille — courses built around the situations I encounter at the desk every week. What follows is an attempt to bridge those two worlds.

Agency, intermediation, and principal trading: three different jobs

Most finance programs teach students how to price securities. Fewer teach them what it actually feels like to put the firm’s capital at risk to make a market. The distinction between agency trading, intermediation, and principal trading is more consequential than most courses suggest.

In agency trading, you act on behalf of a client — executing their order in the market, taking no position yourself, earning a fee for the service. The client bears the market risk. You are their agent.

Intermediation — what practitioners often call riskless principal — is already a form of proprietary trading, technically speaking. You act as principal on both legs: you buy from one counterparty and simultaneously sell to another, earning the bid-ask spread. Because both legs close at the same time, your market exposure is minimal. You are not an agent of either side. You are a counterparty to both, just briefly, and without meaningful inventory risk.

Principal trading with inventory risk is something else entirely. The firm puts its own capital on the line with no guaranteed exit. You buy a bond from a client with no buyer lined up on the other side. You sell from your own inventory because a client needs to buy. You absorb the spread — and the full market risk that comes with holding the position until you can unwind it. The longer you hold, the more exposure you carry. This is the mode that no simulation fully replicates, and the one this article is about.

Pricing illiquid bonds: when there is no obvious answer

A large portion of my daily activity involves corporate and provincial bonds that do not trade on a liquid exchange. There is no visible order book. There is no Bloomberg mid-price that everyone agrees on. There is a fragmented OTC market where each dealer forms their own view of value.

When a client calls and asks for a bid or offer on one of these bonds, I have to produce a price — quickly, without full information. I know what I think the bond is worth. What I do not know is whether the client is a buyer or a seller.

This asymmetry is at the heart of market-making in illiquid securities. If I quote too tight a spread, I may find myself on the wrong side of a pre-arranged trade. A client may call five dealers simultaneously, collect our offers, and hit the best one — while already having a buyer on the other side paying more than my offer. In that case, I have sold bonds below what the market was willing to pay, and the client has effectively traded through me.

I use this scenario in class regularly. Students are always surprised. They assume that being a good trader means knowing what something is worth. It does — but it also means understanding the information game you are playing with the person on the other side of the phone.

Then there is the moment that every trader knows: you have priced the trade, the client has everything they need to decide, and then — nothing. They go to lunch. They are in a meeting. They are closing another trade. You are sitting there holding a price in a moving market, watching the bid shift while you wait for a response that may or may not come. No simulation I have seen fully replicates the specific discomfort of that moment.

Primary market underwriting: when commitment meets reality

Beyond secondary market activity, I participate as an underwriter in primary bond issuances for Argentine corporates, as part of the underwriting syndicate organized around each deal. This is a different kind of principal risk — one that is taken on before the bond even exists.

When a company decides to issue a bond, I commit to underwriting a portion of the deal. This is a real financial commitment: if investor demand is insufficient to cover the full issuance, I absorb the remainder onto my own book. In Argentina, primary markets typically use a Dutch auction format — investors submit bids specifying the coupon rate they are willing to accept and the quantity they want. The issuer then sets a clearing rate that satisfies the target issuance amount.

On auction day, I am simultaneously placing bonds with my own client base, managing my underwriting exposure, and monitoring where the clearing rate is likely to land. If I have covered my commitment with investor demand, I am in good shape. If not, the unsold portion of my underwriting commitment ends up on my balance sheet at the clearing rate — and I work that position off over the following days or weeks, offering it into a market that may or may not be ready to absorb it.

This is textbook principal risk. It is also something that very few students have any mental model for before entering the industry.

FX mismatches and capital controls: the Argentine laboratory

Argentina has operated with capital controls for years. At their peak, the gap between the official exchange rate and the blue-chip swap rate — a market-implied rate derived from the implicit FX embedded in cross-market bond transactions — reached several hundred percent. Today the gap has narrowed significantly, but the structure remains.

This creates situations that no standard finance course addresses. A bond denominated in dollars can be bought and sold in different currencies. If I buy a USD bond paying dollars and sell it against pesos, I receive pesos for an asset I paid for in dollars. I now have a currency mismatch on my book: I am effectively long pesos, short dollars. I can hedge that exposure immediately by buying back the dollars in the FX market, or — if I have a view that the implied exchange rate will move in my favor — I can hold the position and let it run.

The decision is not mechanical. It depends on my reading of the regulatory environment, the direction of the blue-chip swap rate, and how much currency risk I am willing to carry on the book at that moment. This is daily life on the desk. And it is very difficult to teach without the context that produces it.

When models break: the lesson of negative oil prices

In April 2020, front-month WTI crude oil futures briefly traded at negative prices. Physical storage constraints had overwhelmed the market’s mechanics, and sellers were willing to pay counterparties to take delivery of crude oil they had nowhere to store.

I watched it happen from the desk in real time. What struck me was not the price itself — it was the reaction across the industry. Many traders assumed it was a glitch. Some platforms were simply not built to display or process negative prices, and brokers whose systems could not show the quotes found themselves liable to clients who could not see — let alone act on — what was happening in the market. Several firms had to absorb losses because their technology had never contemplated the possibility.

I use this episode as an opening in class — not to explain futures mechanics, which students can read in any textbook — but to ask a different question: what do you do when the model produces an answer that the real world seems to reject? What is your decision framework when your screen shows something that looks impossible? The answer is that you need to understand the why behind the price before you can act on it. That understanding is not something you can look up in real time. Either you have built it, or you have not.

The most important rule on a trading desk

Every trader makes mistakes. A wrong-way position, a misread signal, a fat-finger entry. What separates good trading culture from bad is not the absence of errors — it is what happens in the first thirty seconds after one occurs.

The worst thing a trader can do is wait. Hiding a mistake, even briefly, turns a manageable problem into a serious one. A position that could have been closed at a small loss will compound. The bid-ask spread you avoided paying once will have widened by the time you are forced to act.

The most important rule on any trading desk is this: when you make a mistake, communicate it immediately. No fear of consequences should outweigh the cost of silence. A well-run desk creates an environment where immediate transparency is rewarded — because the alternative is invariably more expensive. This is not a financial concept. It is a cultural one. And it may be the most practically useful thing I can tell any student before they sit down at a real trading desk for the first time.

Argentina: the best trading school you never attended

With a World Cup recently concluded — and Argentina’s performance still fresh in everyone’s memory — there is a useful analogy worth making. Argentina’s best players did not all come through polished academies with perfect pitches and controlled conditions. Many learned on uneven surfaces, in chaotic environments, where improvisation and resilience were not optional. Those conditions, more often than not, produced technically complete and mentally durable players.

The same logic applies to trading in an environment like Argentina. Multiple asset classes, multiple yield curves, structural illiquidity, capital controls, and macroeconomic volatility — all simultaneously, all the time. Traders who come through this market and move to larger ones — Brazil, Mexico, or developed markets — typically find the transition smoother than expected. They have already navigated conditions that most traders in more liquid markets never face. When you learn to trade in the mud, the rest feels like solid ground.

Financial concepts related to this article

I present below four financial concepts central to my daily work as a trader in illiquid and emerging markets.

Principal trading and inventory risk

In principal trading, the broker-dealer buys or sells securities using its own capital, taking market risk onto its own balance sheet. This contrasts with agency trading, where the firm executes on behalf of a client and earns a fee, or with intermediation (riskless principal), where the firm matches both sides simultaneously and earns the bid-ask spread without holding inventory risk. The critical difference is time: in principal trading, the firm holds a position that may not be unwound immediately, and the longer it is held, the greater the market exposure.

Underwriting syndicate and book runner

In a primary bond issuance, several broker-dealers form an underwriting syndicate, each committing to place a portion of the deal with investors. The book runner is the lead of this syndicate — it manages the investor order book, coordinates pricing with the issuer, and oversees the allocation process. Other syndicate members, such as Petrini Valores in many Argentine corporate issuances, commit to their own underwriting tranche and are responsible for placing it with their client base. If a syndicate member cannot fully place its portion, the unsold bonds remain on its balance sheet at the clearing rate.

Dutch auction in primary bond markets

A Dutch auction is a price-discovery mechanism in which investors submit bids specifying both quantity and the coupon rate they are willing to accept. The issuer sets a single clearing rate that satisfies the target issuance amount. All successful bidders receive bonds at the clearing rate, regardless of their individual bids. This format is widely used in Argentine primary markets for corporate bond issuances.

Blue-chip swap rate and capital controls

In markets with capital controls, such as Argentina, the blue-chip swap rate (also known as the contado con liquidación or CCL rate) is an implied exchange rate embedded in cross-market bond transactions. It reflects the market’s assessment of currency value in the absence of free convertibility and can diverge significantly from the official rate. Managing positions across currencies in this environment requires an understanding of the regulatory framework and a constant read on the gap between official and market-implied rates.

Why should I be interested in this post?

If you are a finance student planning to work in sales and trading, fixed income, or any market-facing role, the situations described here are among the ones you will encounter earliest — and none of them are fully captured in a simulation or a pricing model.

The gap between finance education and market reality is not about knowledge. Most graduates know their bond math. The gap is about judgment: knowing how to act when information is incomplete, the counterparty is not responding, and the market is moving. Understanding how principal risk, illiquidity, and currency mismatches interact in real time is the difference between arriving prepared and arriving surprised.

Related posts on the SimTrade blog

   ▶ All posts about Professional experiences

   ▶ Abel ARAYA Inside the Markets COO Office at HSBC: Understanding How Trading Floors Are Managed

   ▶ David GONZALEZ Discovering the Secrets of a Bank Trading Room

   ▶ Mickael RUFFIN My Internship Experience as a Structured Finance Analyst at Société Générale

   ▶ All posts about Financial techniques

Useful resources

Academic research

Gkillas K. and Longin, F. (2018) Financial market activity under capital controls: lessons from extreme events, Economics Letters, 171, 10-13.

Martellini, L., Priaulet, P., Priaulet, S. (2003) Fixed-Income Securities: Valuation, Risk Management and Portfolio Strategies, John Wiley & Sons.

Hull, J. C. (2021) Options, Futures, and Other Derivatives, 11th edition, Pearson.

Business resources

Petrini Valores — Argentine broker-dealer specializing in fixed income, equities, derivatives, and financing.

FINRA Tools and Calculators — public source for US bond transaction data and pricing context.

About the author

This article was written in July 2026 by Isaac FAINSTEIN, Director at Petrini Valores and Visiting Lecturer at IESEG School of Management (Lille), where he has taught applied finance and trading courses for over 10 years.

   ▶ Discover all articles by Isaac FAINSTEIN.

Inside the Markets COO Office at HSBC: Understanding How Trading Floors Are Managed

Abel ARAYA

In this article, Abel ARAYA (ESSEC Business School, Master in Finance, 2025) offers an inside look at the Markets COO Office at HSBC Continental Europe. Through his one-year apprenticeship, he shares how this central function coordinates trading activities, manages budgets and risks, and ensures that the Markets division operates with efficiency and strategic discipline.

About the company

HSBC was founded in 1865 as the Hongkong and Shanghai Banking Corporation to finance trade between Europe and Asia, and has since grown into one of the world’s leading financial institutions. Headquartered in London and listed in London, Hong Kong, New York, Paris and Bermuda, it held around 3.2 trillion US dollars in assets at the end of 2025, employed roughly 211,000 people across some 56 countries and territories, and served more than 40 million customers.

On the wholesale side, its corporate and institutional clients are covered by the Corporate and Institutional Banking (CIB) division, which generated around 27.6 billion US dollars in revenue in 2025. Within CIB, the Markets and Securities Services teams provide liquidity, financing and risk-management solutions across fixed income, credit, FX, equities and securities services to large corporates, financial institutions, asset managers, hedge funds and governments. In this business HSBC competes with the other major global markets houses, such as JPMorgan, Citi, Bank of America and Goldman Sachs in the United States, and Deutsche Bank, Barclays, BNP Paribas and Société Générale in Europe, differentiating itself through its international network and its historical strength in Asia.

I worked at HSBC Continental Europe, the group’s Paris-headquartered subsidiary covering continental Europe. Since the sale of its French retail banking business on 1 January 2024, it has refocused on corporate and institutional clients, with a consolidated balance sheet of 251 billion euros in total assets at the end of 2025.

Logo of HSBC.
Logo of HSBC
Source: the company.

During my apprenticeship, the Markets division was in the process of being integrated into the broader Corporate and Institutional Banking (CIB) structure. This reorganization involved significant changes to how the division was managed, reported, and resourced, which made my experience at the COO Office particularly rich in terms of exposure to strategic and operational transformation.

My internship

My missions

As a Business Manager Assistant within the Markets COO team, my work covered a wide range of financial and operational responsibilities. I contributed to the production of internal reports and presentations for senior management, summarizing the performance, expenses, and headcount of the Markets division. These documents were used in management meetings, financial steering committees, and due diligence reviews conducted during the restructuring process.

I was closely involved in cost forecasting and budget follow-up, helping the team anticipate upcoming expenses and identify deviations from plan. One of my key projects was the annual broker review, which required consolidating trading flow data across all asset classes to assess the efficiency, transparency, and compliance of relationships with external counterparties. This involved close coordination with traders, operations, and compliance teams across Paris, Germany, and India.

I also supported the preparation of headcount reports and organizational charts used by senior management to steer the restructuring of the division. These deliverables required precision and a thorough understanding of how each desk contributed to the overall structure of the Markets business.

Required skills and knowledge

This role required a combination of analytical and interpersonal skills. On the technical side, strong proficiency in Excel was essential for building budget models, consolidating large datasets, and producing financial summaries. Familiarity with the structure of a markets division, including the roles of front office, operations, compliance, and finance, was also important to contextualize the data I was working with.

Soft skills mattered just as much. Coordinating with stakeholders across multiple countries and hierarchies required clear written and oral communication, the ability to manage competing priorities, and a high level of attention to detail. The pace of the environment also demanded adaptability: priorities shifted quickly, and producing reliable output under time pressure was a daily reality.

What I learned

This experience gave me a deep understanding of how financial institutions manage their operations behind the scenes. I learned how budgets are built, how costs are tracked and challenged, and how strategic decisions made at senior level translate into concrete actions on the trading floor. I also developed a much clearer picture of how risk is monitored and how compliance frameworks shape the day-to-day behaviour of a markets division.

Working across teams in Paris, Frankfurt, and India gave me direct exposure to how global coordination works in practice. I learned the importance of data quality and rigour: a single inconsistency in a report could lead to misunderstandings or delayed decisions at the highest level. This reinforced my attention to detail and my commitment to producing work that is both accurate and clearly communicated.

Financial concepts related to my internship

I present below three financial concepts related to my internship: cost and budget management, change management, and due diligence.

Cost and Budget Management

Cost and budget management refers to the process by which an organization plans, monitors, and controls its financial resources to ensure that spending remains aligned with strategic objectives. In a markets division, this involves tracking a wide range of costs: staff compensation, technology infrastructure, external service providers, and regulatory compliance expenses. The budget is typically set at the beginning of the year based on business forecasts and strategic priorities, and then monitored on a monthly basis against actual expenditure.

In my role at the Markets COO team, cost and budget management was one of my primary responsibilities. I contributed to the monthly budget follow-up by consolidating cost data from different desks and entities, identifying variances between forecasts and actual figures, and preparing summary reports for senior management. When a desk was running significantly above or below budget, the COO team would investigate the drivers and, if necessary, escalate to management for a decision. I learned that in a large institution like HSBC, even small deviations in cost forecasts can have a significant impact on the division’s overall financial performance, particularly during a period of restructuring where cost targets were closely scrutinized.

Change Management

Change management is the structured approach through which an organization transitions from its current state to a desired future state while minimizing disruption to operations and people. In the context of financial institutions, it often involves reorganizations, mergers of business lines, technology migrations, or regulatory-driven transformations. Effective change management requires clear communication, stakeholder alignment, and careful sequencing of decisions to ensure continuity of service during the transition.

During my apprenticeship, HSBC’s Markets division was undergoing a major strategic restructuring: the Markets and Securities Services unit was being integrated into the broader Corporate and Institutional Banking (CIB) structure. This was not a minor adjustment, but a fundamental reorganization of how the division was governed, resourced, and reported. I observed the effects of this transformation directly through my work: headcount reports were being revised regularly, cost allocation frameworks were changing, and the responsibilities of the COO team were evolving to reflect the new organizational model. I worked closely with the COO based in Germany, who was managing part of this transition, and I saw first-hand how much coordination and precision are required to keep a large division functioning smoothly while simultaneously reshaping it. Change management, in that context, was not an abstract concept: it was a daily operational reality.

Due Diligence

Due diligence refers to the comprehensive process of investigating and verifying information before making a significant business decision. In investment banking and financial services, it is most associated with mergers and acquisitions, where a buyer conducts a thorough review of the target company’s finances, legal situation, and operations. However, the concept applies equally to other contexts, including the assessment of external service providers, the validation of financial data before it is presented to management, and the review of counterparty relationships.

In my role, due diligence took the form of the annual broker review process. This involved systematically reviewing the trading flows directed to each external broker, verifying the accuracy of the data, and assessing whether the allocation of business to each counterparty was justified by objective performance criteria. The process required gathering data from multiple sources, reconciling inconsistencies, and presenting findings to senior management with clear supporting evidence. I also contributed to due diligence exercises conducted during the restructuring process, where the COO team was asked to validate headcount and cost data before it was presented to the executive committee. These experiences taught me that rigorous due diligence is not just about finding problems: it is about building the trust and confidence that allow organizations to make well-informed decisions.

Why should I be interested in this post?

If you are a student in business and finance considering a career in financial markets, this post offers a perspective that is rarely covered in mainstream discussions about finance careers: the operational and strategic backbone of a trading floor. Most students aspire to front-office roles in trading or sales, and rightly so. But understanding how a markets division is actually run, how its costs are managed, how its risks are monitored, and how major transformations are navigated, is an invaluable foundation for any finance career.

A role in a Markets COO or Business Management team is particularly well-suited for students who want to develop a transversal understanding of markets while building strong analytical and organizational skills. It is also increasingly recognized as a credible path toward front-office positions: many senior traders and sales managers have spent time in COO or control functions early in their careers, and this experience gives them a level of business awareness that pure front-office profiles often lack. Whether you are targeting trading, sales, risk, or corporate finance, the skills and perspective gained in this type of role will give you a genuine advantage.

Related posts on the SimTrade blog

   ▶ Tanguy TONEL My experience as a trading floor intern at CIC Market Solutions

   ▶ David GONZALEZ Discovering the Secrets of a Bank Trading Room

   ▶ Louis DETALLE A quick review of an Analyst in Transaction Services’ job

   ▶ Mickael RUFFIN My Internship Experience as a Structured Finance Analyst at Société Générale

Useful resources

HSBC — Corporate and Institutional Banking

ESMA — MiFID II and MiFIR

Basel Committee on Banking Supervision — Sound Practices for Operational Risk Management

About the author

The article was written in July 2026 by Abel ARAYA (ESSEC Business School, Master in Finance, 2025).

   ▶ Discover all articles by Abel ARAYA

What I Learned on a Trading Floor at HSBC: Understanding Markets from the Inside

Abel ARAYA

In this article, Abel ARAYA (ESSEC Business School, Master in Finance, 2025) shares his experience on HSBC’s trading floor in Paris. He explains how this opportunity helped him understand how a global markets division operates, how teams interact, and what makes the environment of a trading floor so unique.

From private banking to markets

Before joining HSBC, I was working in private banking at Milleis Banque Privée. It was a good introduction to finance, but I wanted to understand how the markets worked behind the scenes. Joining HSBC Continental Europe as a Business Manager Assistant within the Markets COO (Chief Operating Officer) team gave me the chance to discover that world for the first time. The COO function within a markets division is responsible for the operational and financial oversight of the trading floor: it sits at the intersection of strategy, finance, and day-to-day management, supporting the front office without being directly involved in trading itself.

About the company

HSBC was founded in 1865 as the Hongkong and Shanghai Banking Corporation, created to finance trade between Europe and Asia. More than a century and a half later, it has become one of the largest banking and financial services groups in the world. Headquartered in London and listed in London, Hong Kong, New York, Paris and Bermuda, the group held around 3.2 trillion US dollars in assets at the end of 2025, employed roughly 211,000 people across some 56 countries and territories, and served more than 40 million customers.

On the wholesale side, where I worked, HSBC brings together its corporate and institutional clients under the Corporate and Institutional Banking (CIB) division, which generated around 27.6 billion US dollars in revenue in 2025. CIB was created on 1 January 2025 by combining the former Global Banking and Markets business with commercial banking activities outside the UK and Hong Kong, with the ambition of ranking among the top three global wholesale banks. Within CIB, the Markets and Securities Services teams provide liquidity, financing and risk-management solutions across fixed income, credit, foreign exchange, equities and securities services.

Its clients are large corporates, financial institutions, asset managers, hedge funds and governments that rely on the bank to trade, hedge and finance their activities across the world. In this space HSBC competes with the other large global markets houses, such as JPMorgan, Citi, Bank of America and Goldman Sachs in the United States, and Deutsche Bank, Barclays, BNP Paribas and Société Générale in Europe. Its main differentiator remains its international network and its historical strength across Asia and emerging markets.

My apprenticeship took place at HSBC Continental Europe, the group’s Paris-headquartered subsidiary covering continental Europe. Since the sale of its French retail banking business on 1 January 2024, HSBC Continental Europe has refocused on corporate and institutional clients, with a consolidated balance sheet of 251 billion euros in total assets at the end of 2025.

During my apprenticeship, this reorganization was still under way, which made it a particularly interesting time to observe how such a large organization adapts its structure while continuing to run its business day to day.

Logo of HSBC.
Logo of HSBC
Source: the company.

My apprenticeship

Within the Markets COO team, my work focused on the financial and organizational aspects of the trading floor. I contributed to budget monitoring, forecasts of upcoming expenses, and internal reports related to costs and resources. I was involved in the broker review process and in the preparation of financial summaries presented to management.

This position gave me a transversal view of the Markets division and helped me understand how each team contributes to the overall structure. I interacted with many different stakeholders: the COO in Germany, who was managing a restructuring process, teams in India working on operational data, and senior managers in Paris overseeing the desks. These collaborations taught me how coordination and communication are essential to keep such a large platform running efficiently.

Life on the trading floor

Working so close to the trading floor was one of the most rewarding parts of my experience. Even though my role was on the management side, I was constantly in contact with the desks. I often visited traders, salespeople, and structurers to better understand their activities and the financial implications of their operations. One moment that stayed with me was a conversation with a rates trader during a period of elevated volatility in the European bond market. He explained how the sudden widening of spreads between Italian BTPs and German Bunds was forcing him to adjust his hedging positions in real time, something I had only ever read about in textbooks. These interactions helped me connect the numbers I was analysing to the real market dynamics they represented.

The atmosphere on the floor was intense and collaborative at the same time. Information flowed constantly between desks, from rates to credit to repo, and decisions were made quickly. Observing this rhythm every day helped me understand how interconnected market teams are, and how much relies on clear communication and mutual trust.

What I learned

This experience gave me a real understanding of how a trading floor operates, both economically and humanly. I learned how a large institution like HSBC manages its costs, allocates resources, and balances strategic priorities with budget realities. I also saw how economic pressures, regulatory changes, and internal dynamics influence decisions at every level of the organization.

Spending time close to the Fixed Income desks gave me a concrete sense of how sales, traders, and support teams work together. I realized that beyond products and numbers, markets are built on relationships, coordination, and constant adaptation.

Most importantly, this experience taught me the value of curiosity and initiative. By going to speak directly with teams, asking questions, and trying to understand their world, I gained insights that no spreadsheet could have given me. It made me appreciate both the complexity and the humanity of financial markets.

This one-year apprenticeship was a very strong first step into the world of markets. It helped me confirm that the natural next step for me would be a front-office internship as a Sales in Fixed Income, where I could build on what I learned and continue to grow within a trading environment.

Financial concepts related to my professional experience at HSBC

I present below three financial concepts related to my internship: market liquidity, collusion risk, and profit and loss (P&L).

Market Liquidity

Market liquidity refers to the ease with which a financial instrument can be bought or sold in the market without significantly moving its price. A liquid market has many buyers and sellers, tight bid-ask spreads, and the ability to execute large transactions quickly. An illiquid market, by contrast, forces participants to accept worse prices or wait, which can turn a theoretically profitable position into a loss once execution costs are taken into account.

In fixed income markets, liquidity is not uniform: it varies by product, by maturity, and by the time of day. Sovereign bonds such as French OATs or German Bunds are among the most liquid instruments in the world, with spreads of just a few basis points. Corporate bonds, by contrast, trade far less frequently and can see spreads widen dramatically in periods of stress. Structured products and exotic rates instruments can be even harder to unwind quickly.

One of the things I discovered at HSBC is the central role brokers play in providing liquidity. Not all brokers are equal: some are specialists on particular products or market segments. For example, inter-dealer brokers such as TP ICAP or Tradition are well known for their activity in rates and repo markets, where they connect banks anonymously to facilitate large transactions. During the annual broker review process that I participated in, traders would assess which brokers had provided the best liquidity, the most reliable pricing, and the fastest execution across different products. This review directly influenced how trading flows were allocated across brokers the following year. It made me understand that liquidity is not just a market property: it is also a relationship, built and maintained between institutions over time.

Collusion Risk

In financial markets, collusion risk between traders and brokers refers to a specific form of conflict of interest: a trader systematically routing a disproportionate volume of transactions to a particular broker, not because that broker offers the best execution, but because of a personal relationship, reciprocal favours, or informal arrangements. This behaviour is harmful to clients, who are entitled under regulation to receive the best available price and execution, a principle known as best execution, enshrined in the MiFID II directive in Europe.

The risk is subtle and not always easy to detect. A trader may genuinely believe that their preferred broker is the best, when in reality they are simply more comfortable with them. Over time, this can result in a concentration of flows toward one or two brokers that is not justified by objective performance criteria such as pricing quality, speed of execution, or market access. In the worst cases, the relationship can involve gifts, entertainment, or the sharing of confidential information, all of which are strictly regulated.

This is exactly what the annual broker review process at HSBC was designed to monitor and prevent. As part of my role in the Markets COO team, I contributed to this review, which involved analysing the distribution of trading flows across brokers and comparing it against objective performance metrics. If a trader was sending a significantly higher share of their volume to one broker without a clear justification, that anomaly would be flagged and discussed. The process ensured that broker relationships remained grounded in performance rather than personal preference, protecting both the bank and its clients. Working on this review gave me a direct understanding of how compliance and governance function in practice on a trading floor, and why they matter.

Profit and Loss (P&L)

Profit and Loss (P&L) is the daily measure of how much money a trading desk has made or lost. It captures the combined effect of market movements, trading activity, and fees. In my role within the Markets COO team, the P&L was one of the most important indicators I worked with. Each morning, the desks produced a flash P&L report, and my team consolidated these figures to produce management summaries that were reviewed by senior leadership. I also contributed to the analysis of P&L trends over time, identifying which desks were performing above or below forecast and understanding the drivers behind deviations. I learned that P&L is not just a financial result: it is a real-time signal of how well a desk is managing its positions, its risks, and its client relationships. Monitoring P&L every day gave me a concrete and dynamic view of how financial markets translate into business performance.

Why should I be interested in this post?

If you are a student in business or finance thinking about a career in financial markets, this post can help you understand what to expect from a first experience on a trading floor. Many students have a strong theoretical background in finance but are uncertain about how these concepts translate into day-to-day work. Through my experience at HSBC, I discovered that even a non-front-office role offers an exceptional vantage point: by working within the Markets COO team, I was exposed to P&L reporting, liquidity management, broker reviews, and budget processes that are central to how a bank manages its markets activities.

This post is also relevant if you are considering roles in Markets COO, Business Management, or Finance Control within a bank. These positions are often overlooked by students who focus exclusively on trading or sales, yet they offer direct exposure to the full scope of a markets division and are increasingly valued as a stepping stone toward front-office responsibilities. Whatever your target role, understanding how a trading floor operates, its rhythms, its pressures, and its culture, will give you a real advantage in interviews and on the job.

Related posts on the SimTrade blog

   ▶ Max ODEN Leveraged Finance: My Experience as an Analyst Intern at Haitong Bank

   ▶ Praduman AGRAWAL My Professional Experience as a Quantitative Analyst Intern at Findoc Financial Services

   ▶ Michel Henry VERHASSELT Trading strategies based on market profiles and volume profiles

   ▶ Mickael RUFFIN My Internship Experience as a Structured Finance Analyst at Société Générale

Useful resources

HSBC — Corporate and Institutional Banking (including Markets and Securities Services)

ESMA — European Securities and Markets Authority

BIS — OTC Derivatives Statistics

About the author

The article was written in July 2026 by Abel ARAYA (ESSEC Business School, Master in Finance, 2025).

   ▶ Discover all articles by Abel ARAYA

“The market is never wrong, only opinions are.“ – Jesse Livermore

Hadrien Puche

In this article, Hadrien Puche (ESSEC, Grande École, Master in Management, 2023–2027) comments on Jesse Livermore’s timeless quote and explores its relevance for modern investors and students seeking to understand market psychology.

About Jesse Livermore

Jesse Livermore (1877–1940) was one of Wall Street’s first great speculators, a man who understood the rhythm of markets long before data screens and algorithms existed. He made and lost several fortunes, most famously by shorting stocks ahead of the Panic of 1907 and the Great Depression of 1929.

Livermore’s life was both brilliant and tragic, but his insights into crowd behavior and emotional discipline remain essential reading for anyone who wishes to understand how markets truly work.

Jesse Livermore
Jesse Livermore

Analysis of the quote

“The market is never wrong, only opinions are.” – Jesse Livermore

When Livermore says, “The market is never wrong, only opinions are,” he reminds us that prices are not moral judgments or forecasts of truth — they are the product of human behavior under uncertainty.

Markets do not care about fairness or logic. They reflect the collective sum of all opinions, weighted by money. To claim that “the market is wrong” is to claim that your personal view outweighs the collective intelligence and capital of millions of other participants.

That rarely ends well. The market may sometimes overreact, but it is almost always the individual who misunderstands its message.

This quote, in the end, is a lesson in humility. Investors lose not because they lack intelligence, but because they refuse to admit when the market has proven them wrong.

Economic and financial concepts related to the quote

1 – Market efficiency

Livermore’s idea anticipates the theory of market efficiency introduced many decades later by Eugene Fama in 1970. This theory suggests that prices incorporate all available information, which means it is almost impossible to consistently beat the market.

Even if markets are not perfectly efficient, they are highly competitive ecosystems. Information spreads very quickly, and any mispricing is soon corrected by professionals equipped with technology and capital.

So when you decide that the market is wrong, you are effectively betting that your insight is sharper than everyone else’s, from hedge funds to central banks. Occasionally, some investors do have that edge, but they are the exception, not the rule.

2 – The Wisdom and the Madness of Crowds

In The Wisdom of Crowds (2004), James Surowiecki argues that large groups can make remarkably accurate collective judgments, even when individual members are biased or imperfectly informed. Financial markets often exemplify this phenomenon: while single investors are prone to emotion and error, the aggregation of their independent views can produce a consensus that efficiently reflects available information.

Yet, Surowiecki also cautions that collective intelligence breaks down when independence disappears. In markets, this occurs when participants are driven by shared emotions: panic during crashes or euphoria during bubbles. At such moments, the “wisdom” of the crowd can turn to madness.

3 – Risk management and flexibility

Livermore’s warning remains as relevant as ever: never fight the market. Every investor is wrong sometimes, but what matters is how quickly you realize it and act. The real danger isn’t being wrong, it’s refusing to admit it. Livermore’s rule captures this perfectly: “Cut your losses short and let your winners run.”

Good risk management starts there. It means knowing how much you can afford to lose, setting a stop-loss before entering a trade, and sticking to it. A stop-loss isn’t a sign of weakness, it’s a protection. It prevents small mistakes from turning into big ones and keeps you in the game for the long run.

As Keynes famously said, “Markets can stay irrational longer than you can stay solvent.” Managing risk isn’t about predicting the market, it’s about surviving it.

My opinion about this quote

Livermore’s insight feels even more relevant in today’s world of instant information and algorithmic trading. Social media multiplies opinions at unprecedented speed, creating noise that can easily obscure reality.

Recent market episodes illustrate this perfectly. In 2021, for example, the GameStop saga showed how collective emotion on Reddit briefly overwhelmed fundamental analysis, sending the stock to irrational highs before gravity reasserted itself.

Similarly, during the cryptocurrency boom of 2021 and 2022, investors often claimed that “this time is different,” only to face sharp corrections when enthusiasm faded.

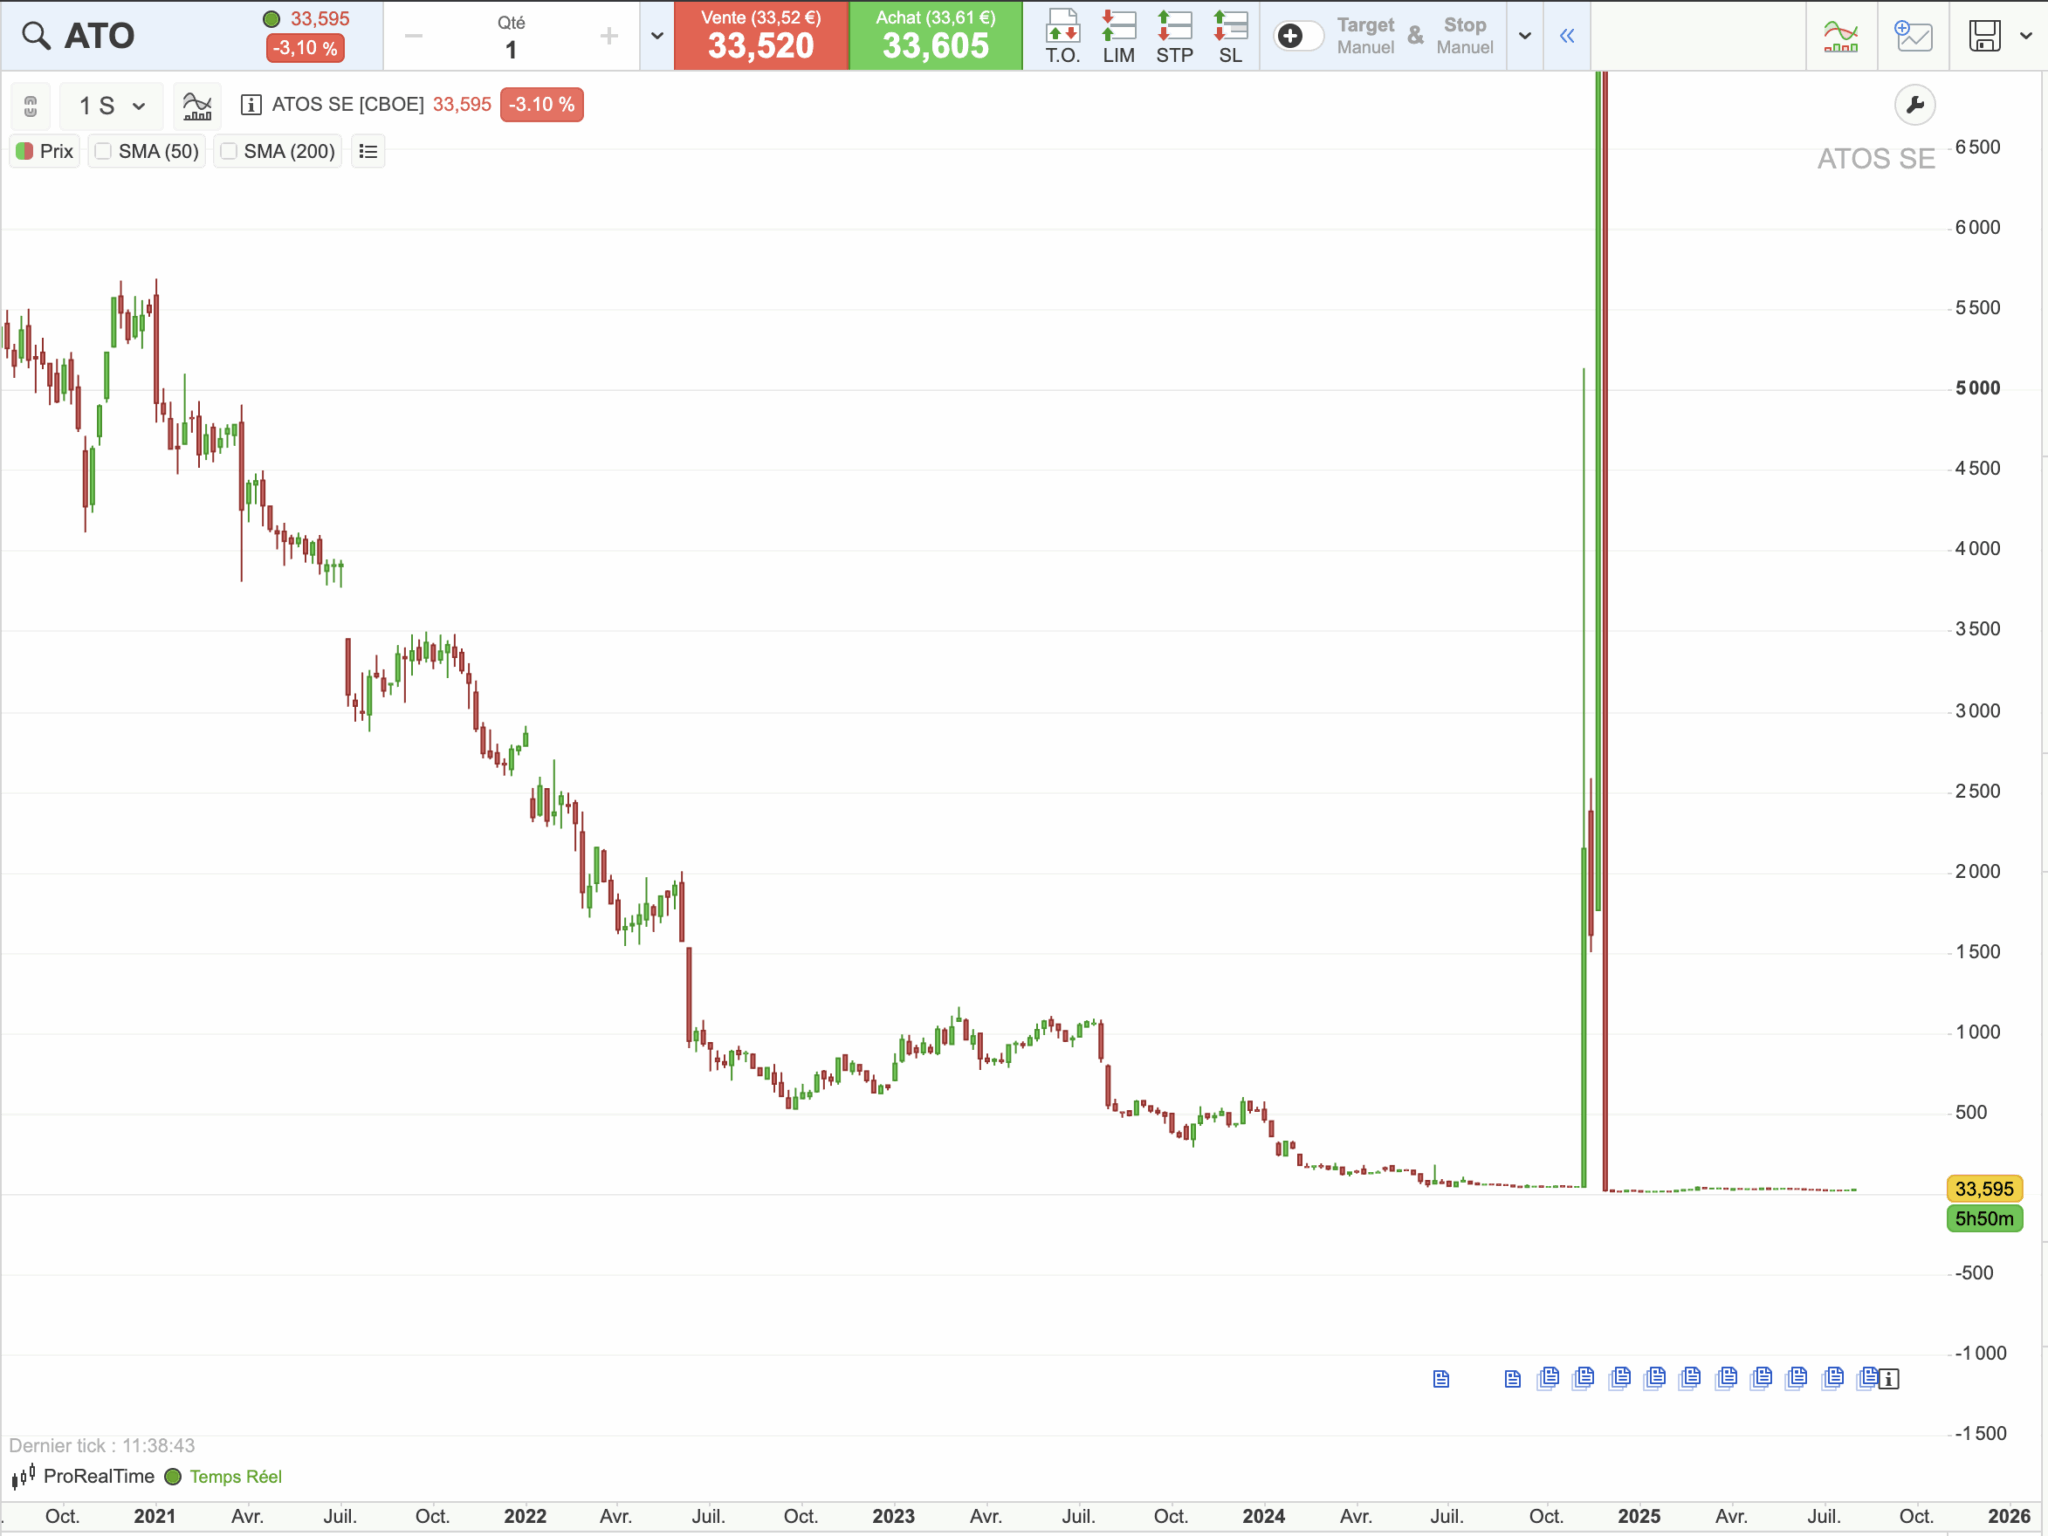
Closer to home, the Atos case in 2024 reflected the same dynamic. Despite the company’s severe financial distress and an announced dilution that effectively made the stock almost worthless, waves of speculative buying pushed its valuation to absurd levels for a few days. When reality returned, the correction was brutal.

Atos stock price chart

These examples confirm Livermore’s message: opinions can be wrong for a long time, but the market always has the final word.

Why should you be interested in this post?

For students and young professionals, Livermore’s lesson is a call for intellectual humility. Markets are complex and adaptive systems, impossible to predict with precision but possible to understand with patience.

Learning to separate your opinions from what the market is telling you will make you a better analyst, investor, and decision-maker. It will also help you develop emotional intelligence, a skill far rarer than technical knowledge.

In finance, as in life, the goal is not to be right, it is to adapt faster when you are wrong.

Related posts on the SimTrade blog

   ▶ All posts about Quotes

Useful resources

Reminiscences of a Stock Operator – Edwin Lefèvre (1923)

The Efficient Market Hypothesis and Its Critics – Burton Malkiel (2003)

Thinking, Fast and Slow – Daniel Kahneman (2011)

SimTrade course Market information

Academic research

Fama E. (1970) Efficient Capital Markets: A Review of Theory and Empirical Work, Journal of Finance, 25, 383–417.

Fama E. (1991) Efficient Capital Markets: II, Journal of Finance, 46, 1575–617.

Grossman S.J. and J.E. Stiglitz (1980) On the Impossibility of Informationally Efficient Markets, The American Economic Review, 70, 393–408.

Chicago Booth Review (30/06/2016) Are markets efficient? Debate between Eugene Fama and Richard Thaler (YouTube video)

About the Author

This article was written in November 2025 by Hadrien PUCHE (ESSEC Business School, Grande École Program, Master in Management, 2023-2027).

   ▶ Discover all articles by Hadrien PUCHE

Enhancing Financial Market Learning: The ‘Pair & Share’ Pedagogical Approach

 François LONGIN

In this article, Professor François LONGIN (ESSEC Business School, Finance Department) explains how enhance financial market learning with the ‘Pair & Share’ pedagogical approach.

The SimTrade course

The SimTrade course, offered at ESSEC Business School, is an innovative program designed to provide students with a hands-on understanding of financial markets. At its core, SimTrade combines theoretical knowledge with practical applications, allowing participants to engage in realistic market simulations. Students can experiment with trading strategies, analyze market reactions, and make decisions in a controlled environment, fostering a deeper comprehension of market dynamics and investor behavior.

The course is grounded in the belief that experiential learning is essential for mastering the complexities of finance. By bridging theory and practice, SimTrade empowers students to navigate the fast-paced world of financial markets with confidence and competence.

The ‘Pair & Share’ pedagogical approach

I describe below the “Pair & Share” pedagogical approach that I discovered during the Glocoll program at Harvard Business School. The “Pair & Share” sequence is organized in three steps:

Step 1: Think Individually

I ask participants to consider the question: “What are three key points about financial markets?” for one minute.

Step 2: Pair & Share

I ask participants to exchange their ideas in groups of two. Participant A explains to Participant B what he/she thinks is important about financial markets, and vice versa. I also informed them that in the next step, I will ask the question : What have you learned from your partner?

Step 3: Group Feedback

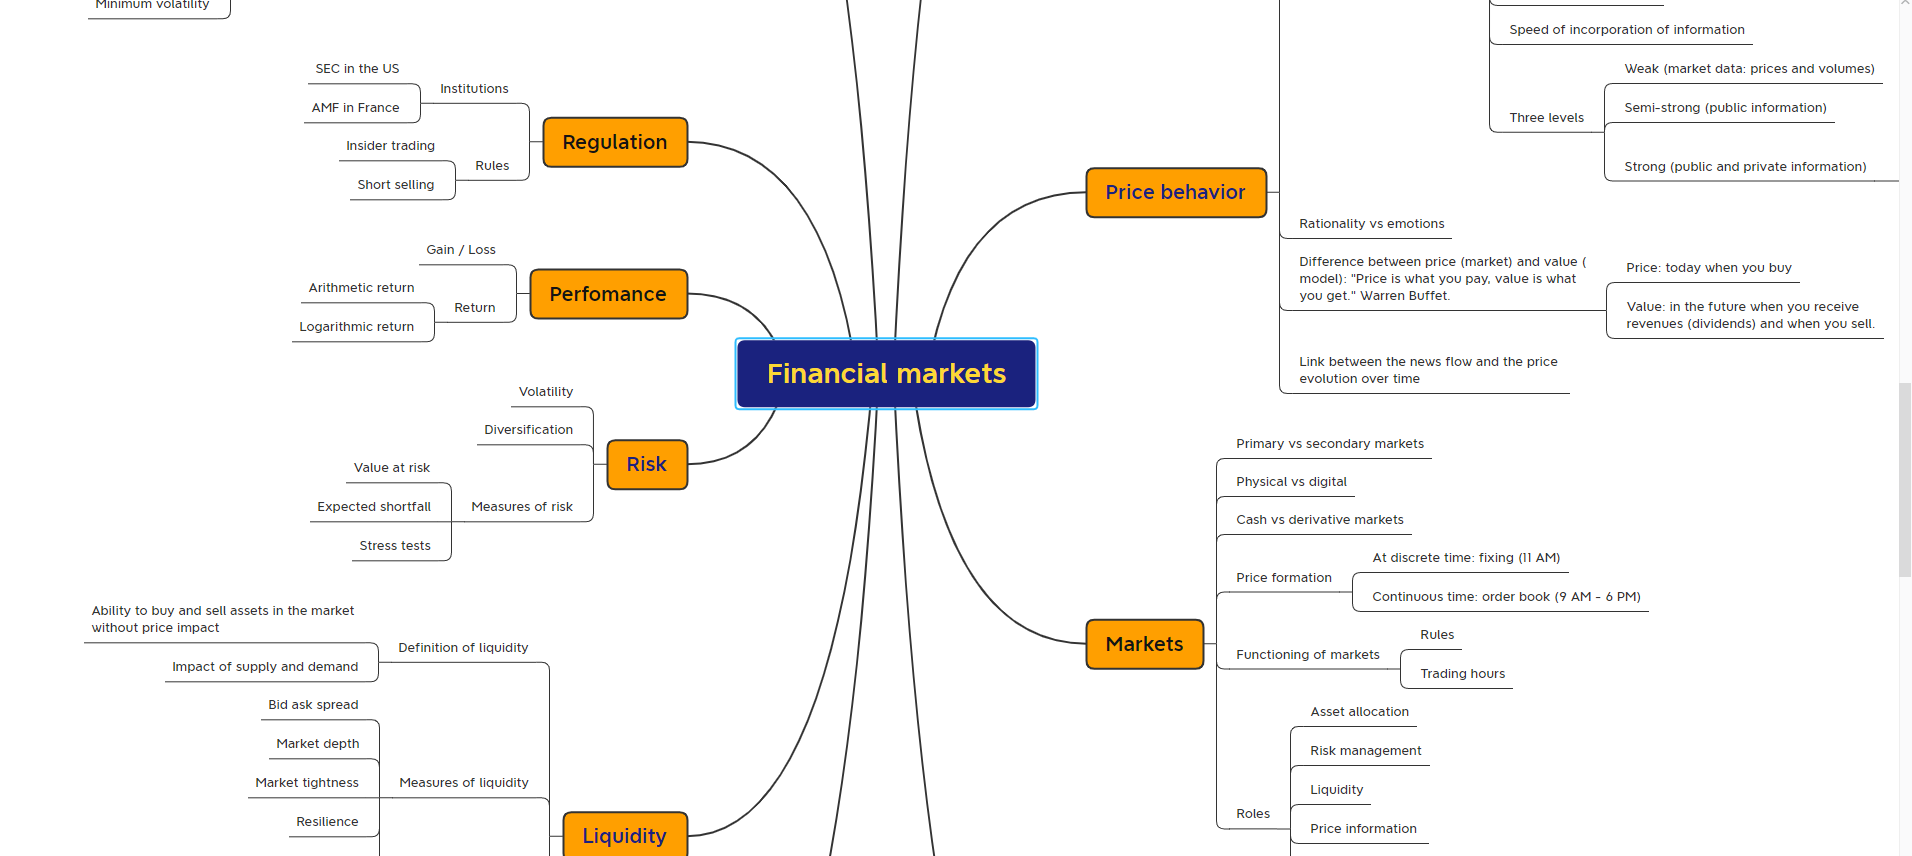
Insights are shared with the class, summarized into a mind map.

You will find below the mind about financial markets from the students in the course that I teach at ESSEC Business school (Bachelor of Business Administration (BBA), Master in Finance (MiF), and Master in Strategy and Management of International Business (SMIB)).

Please click on the image below to download the mind map of the Pair & Share exercise on financial markets.

Download the mind map of the Pair & Share session
 

To open the file of the mind map download Xmind that I used during the webinar (there is a free version of the software).

Feel free to improve the mind map with your own ideas.

Methodology of the "Pair & Share" exercise

Please find below a few slides about the "Pair & Share" exercise (methodology and advantages).

Download the presentation of the Pair Share exercise

Related posts on the SimTrade blog

   ▶ Prof. François LONGIN Sur les traces de Wilhelm von Humboldt

Useful resources

SimTrade Demo certificate

SimTrade Courses

SimTrade Simulations

Harvard Business School Global Colloquium on Participant-Centered Learning

About the author

The article was written in December 2024 by Professor François LONGIN (ESSEC Business School, Finance Department).

Understanding the Order Book: How It Impacts Trading

Federico De ROSSI

In this article, Federico DE ROSSI (ESSEC Business School, Master in Strategy & Management of International Business (SMIB), 2020-2023) talks about the order book and explains its role in financial markets.

Introduction

Understanding the order book is critical when it comes to trading in financial markets. In this article, we’ll go over what an order book is and how it affects trading.

What is an order book?

An order book for a stock, currency, or cryptocurrency is a list of buy and sell limit orders for that asset. It shows the pricing at which buyers and sellers are willing to negotiate, as well as the total number of orders available at each price. The order book is a necessary component of every trading platform since it gives a snapshot of the current market situation, of the price of the assets, and of the liquidity of the market. Thus, it is a crucial tool for traders who want to make informed decisions when entering or exiting deals.

How does an order book work?

The order book is a constantly updated record of buy and sell orders. When a trader puts a limit order, it is placed in the order book at the stated price. As a result, there is a two-sided market with distinct prices for buyers and sellers.

The order book is divided into two sections: bid (buy) and ask (sell). All open buy orders are displayed on the bid side, while all open sell orders are displayed on the ask side. The order book also shows the total volume of buy and sell orders at each price level.

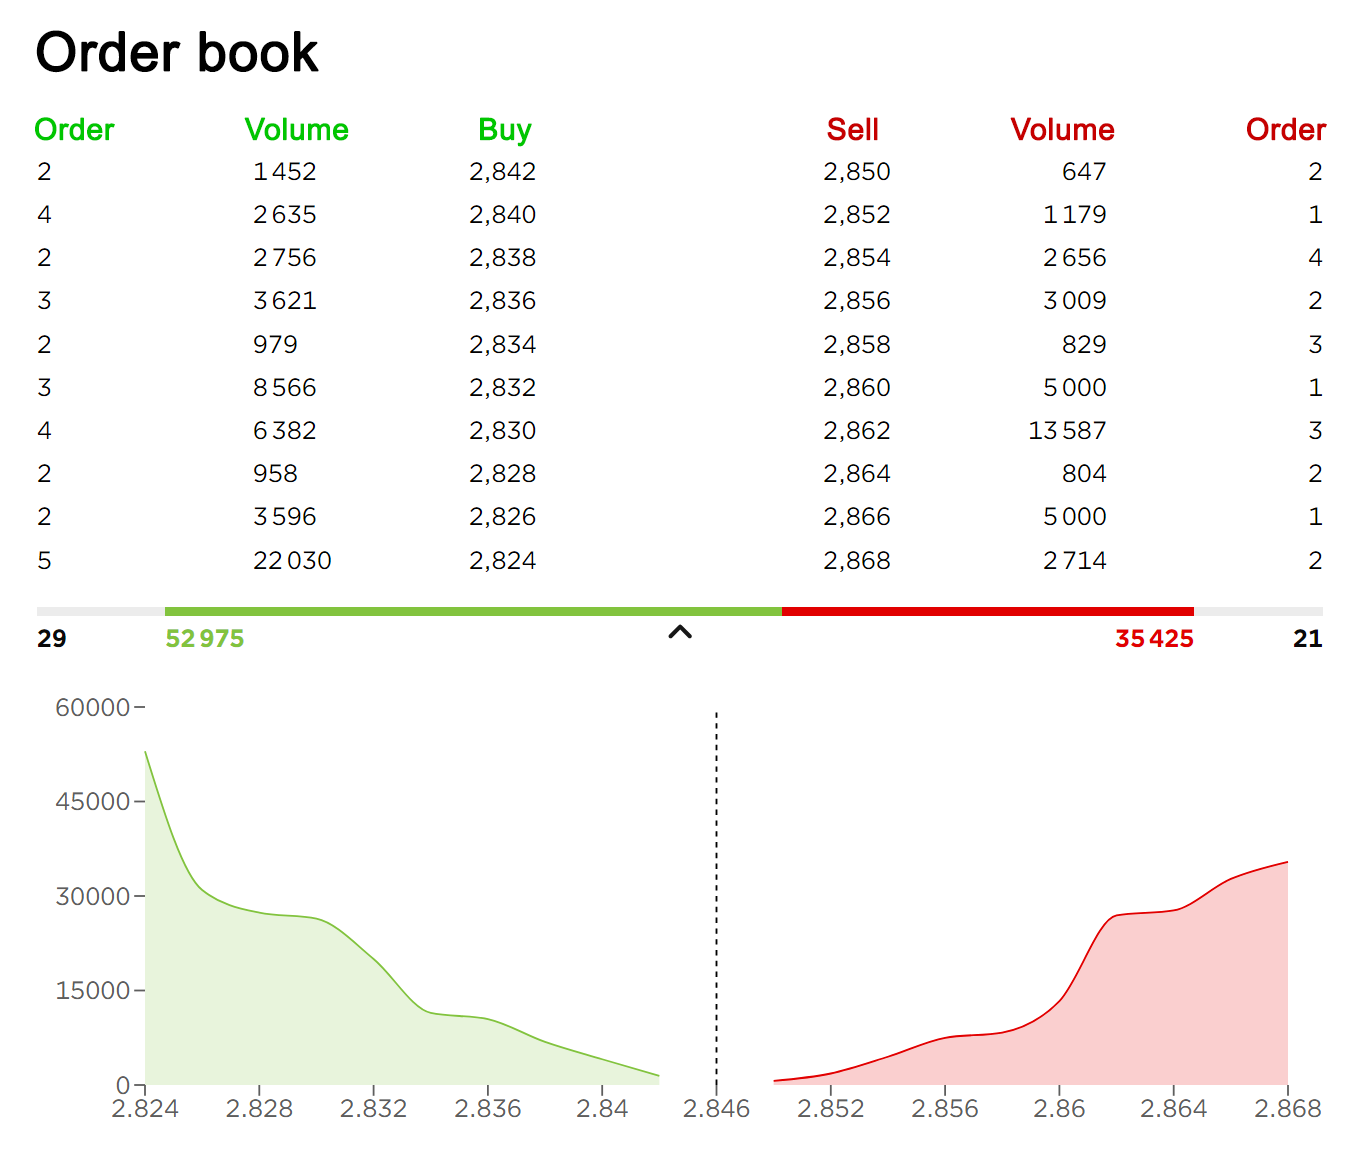
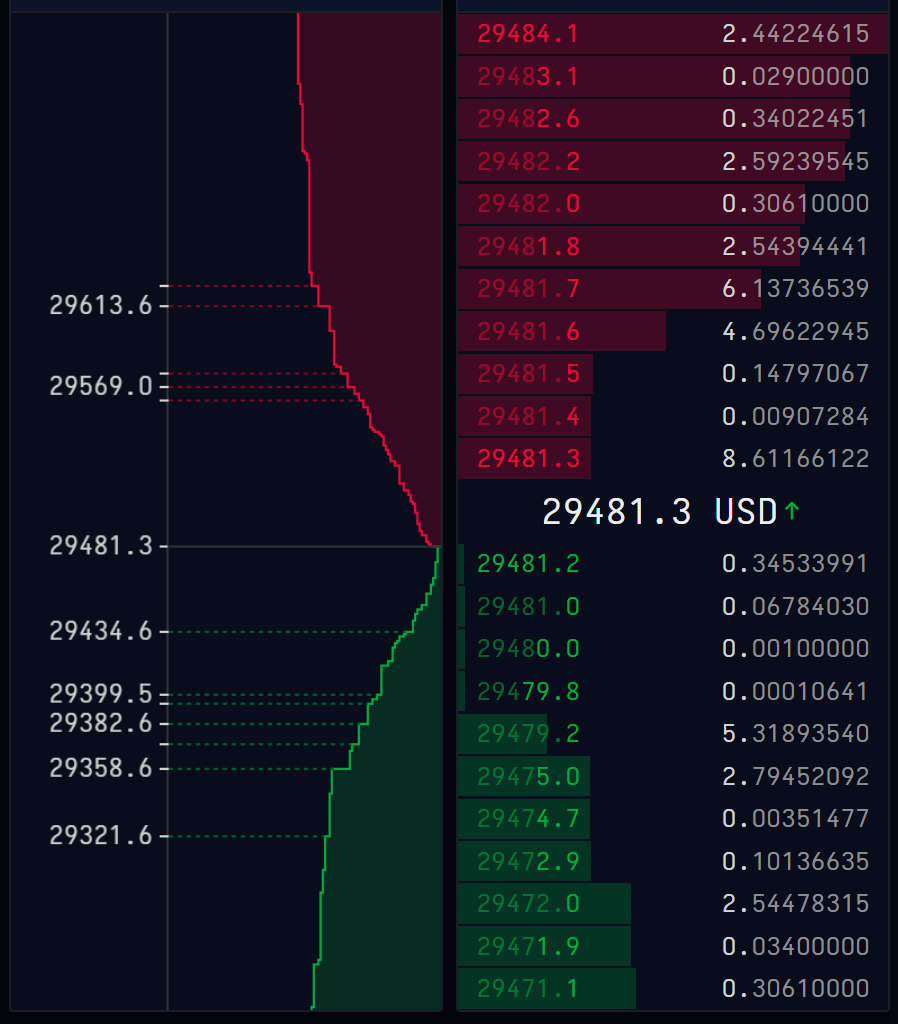
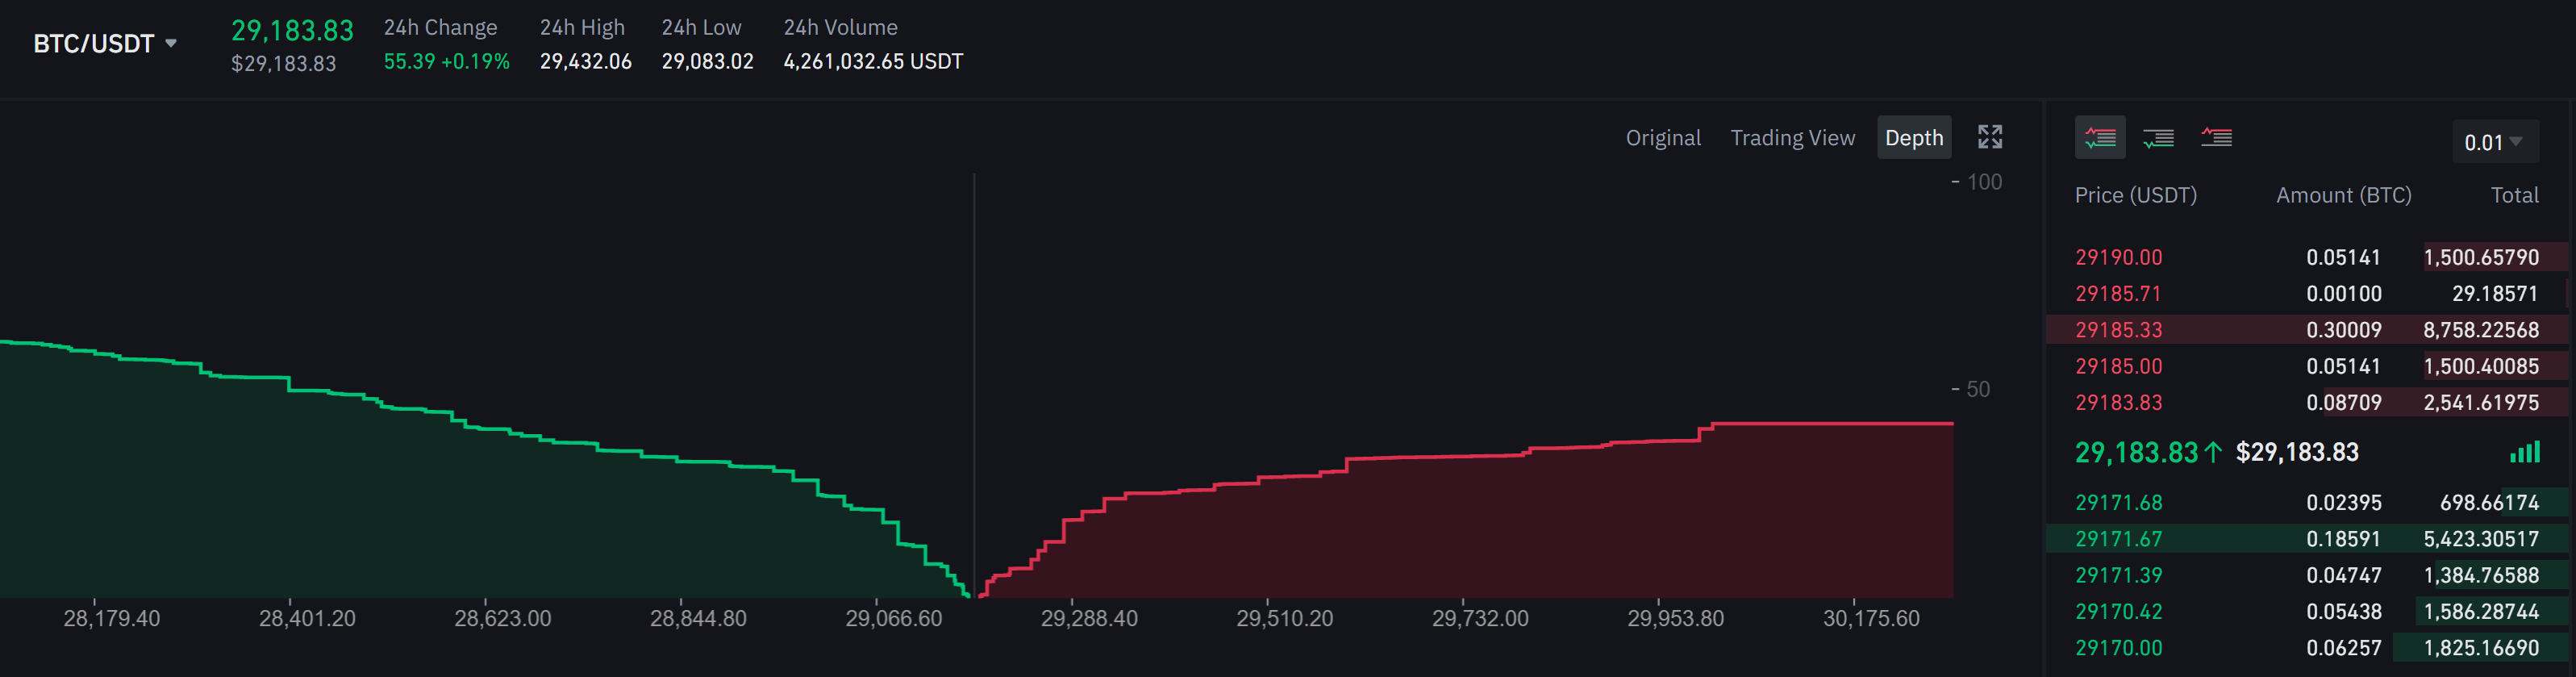
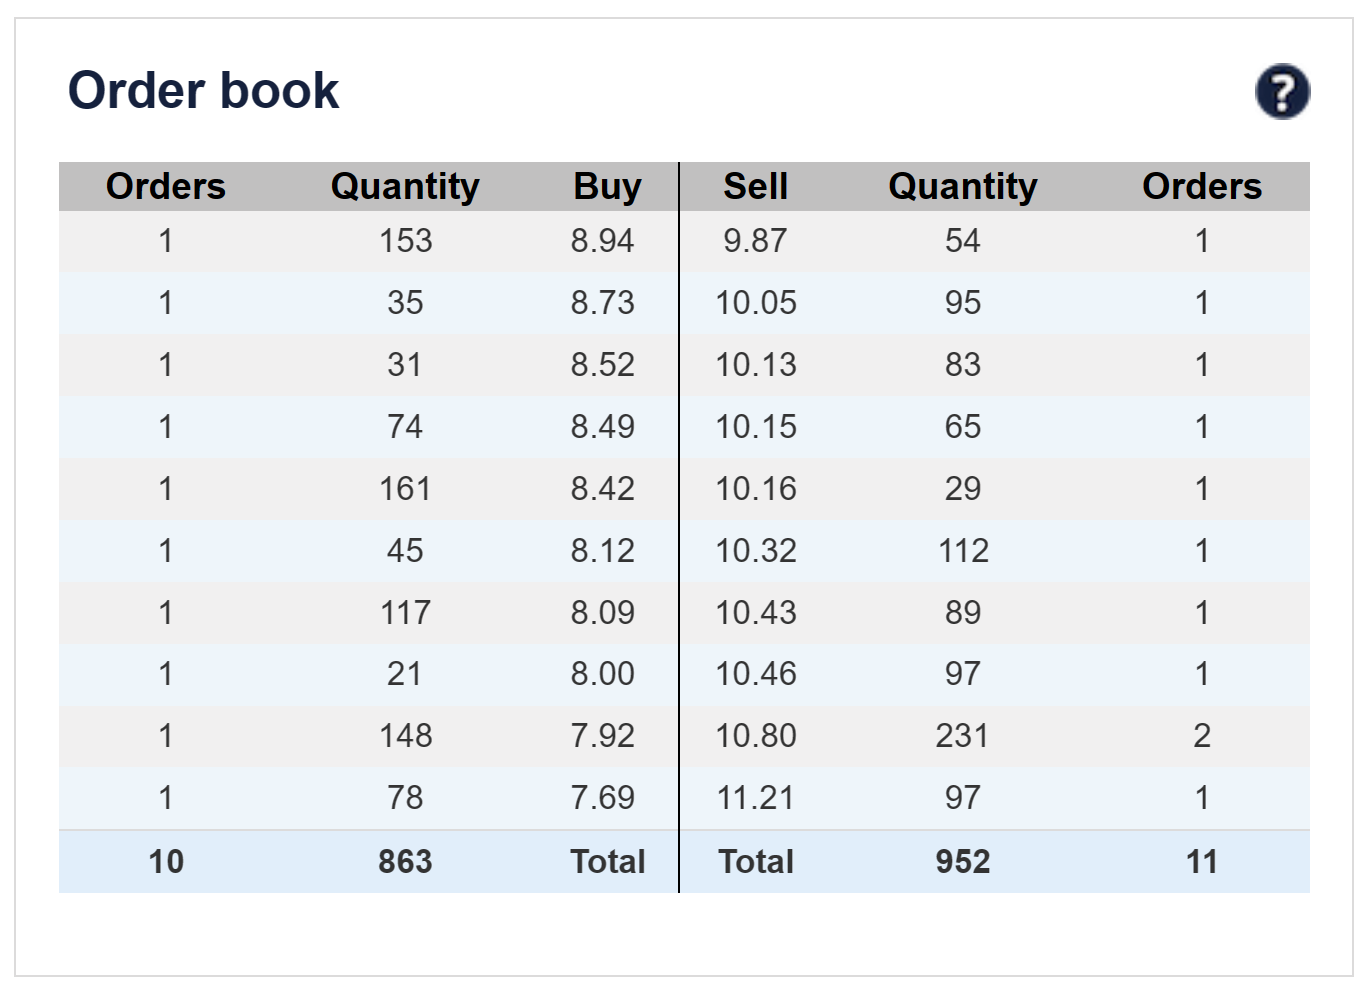
In Tables 1 and 2 below, we give below two examples of order book from online brokers. We can see the two parts of the order book side by side: the “Buy” part and the “Sell” part. Every line of the order book corresponds to a buy or sell proposition for a give price (“Buy” or “Sell” columns) and a given quantity (“Volume” columns). For a given line there may be one or more orders for the same price. When there are several orders, the quantity in the “Volume” column is equal to the sum of the quantities of the different orders. Associated to the order book, there is often a chart which indicates the cumulative quantity of the orders in the order book at a given price. This chart gives an indication of the liquidity of the market in terms of market spread, market breadth, and market depth (see below for more explanations about theses concepts).

The “Buy” and “Sell” parts of the order book can be presented side by side (Table 1) or above each other (Tables 2 and 3) with the “Sell” part (in red) above the “Buy” part (in green) as the price limits of the sell limit orders are always higher than the price limits of the buy limit orders.

Table 1. Example of an order book (buy and sell parts presented side by side).
Order book
Source: online broker (Fortuneo).

Table 2. Example of an order book (buy and sell parts presented above each other).
Order book
Source: online broker (Cryptowatch).

Table 3. Example of an order book (buy and sell parts presented next to each other).
Order book
Source: online broker (Binance).

In a typical order book, the buy side is organized in descending order, meaning that the highest buy orders (i.e., the orders with the highest bid prices) are listed first, followed by the lower buy orders in descending order of price. The highest buy order in the book represents the best bid price, which is the highest price that any buyer is currently willing to pay for the asset.

On the other side of the order book, the sell side is organized in ascending order, with the lowest sell orders (i.e., the orders with the lowest ask prices) listed first, followed by the higher sell orders in ascending order of price. The lowest sell order in the book represents the best ask price, which is the lowest price that any seller is currently willing to accept for the asset.

This organization of the order book makes it easy for traders to see the current market depth and the best available bid and ask prices for an asset. When a buy order is executed at the best ask price or a sell order is executed at the best bid price, the order book is updated in real-time to reflect the new market depth and the new best bid and ask prices.

Table 4 below represents how the order book (limit order book) in trading simulations the SimTrade application.

Table 4. Order book in the SimTrade application.
Order book in the SimTrade application

You can understand how the order book works by launching a trading simulation on the SimTrade application.

The role of the order book in trading

As mentioned before, the order book is incredibly significant in trading. It acts as a market barometer, delivering real-time information about the supply and demand for an asset. Traders can also use the order book to determine market sentiment. If the bid side of the order book is strongly occupied, for example, it could imply that traders are optimistic on the asset. Thanks to the data in the order book, traders can get different information out of it.

Three characteristics of the order book

Market spread

The market spread, also known as the bid-ask spread, is the difference between the highest price a buyer is willing to pay for an asset (the bid price) and the lowest price a seller is willing to accept (the ask price) at a particular point in time.

The market spread is a reflection of the supply and demand for the asset in the market, and it represents the transaction cost of buying or selling the asset. In general, a narrow or tight spread indicates a liquid market with a high level of trading activity and a small transaction cost, while a wider spread suggests a less liquid market with lower trading activity and a higher transaction cost.

Market breadth

Market breadth is a measure of the overall health or direction of a market, sector, or index. It refers to the number of individual stocks that are participating in a market’s movement or trend, and can provide insight into the underlying strength or weakness of the market.

Market breadth is typically measured by comparing the number of advancing stocks (stocks that have increased in price) to the number of declining stocks (stocks that have decreased in price) over a given time period. This ratio is often expressed as a percentage or a ratio, with a higher percentage or ratio indicating a stronger market breadth and a lower percentage or ratio indicating weaker breadth.

For example, if there are 1,000 stocks in an index and 800 of them are increasing in price while 200 are decreasing, the market breadth ratio would be 4:1 or 80%. This would suggest that the market is broadly advancing, with a high number of stocks participating in the upward trend.

Market depth

Finally, market depth is a measure of the supply and demand of a security or financial instrument at different prices. It refers to the quantity of buy and sell orders that exist at different price levels in the market. Market depth is typically displayed in a market depth chart or order book.

It can provide valuable information to traders and investors about the current state of the market. A deep market with large quantities of buy and sell orders at various price levels can indicate a liquid market where trades can be executed quickly and with minimal impact on the market price. On the other hand, a shallow market with few orders at different price levels can indicate a less liquid market where trades may be more difficult to execute without significantly affecting the market price.

Analyzing order book data

Data from order books can be used to gain insight into market sentiment and trading opportunities. For example, traders can use the bid-ask spread to determine an asset’s liquidity. They can also examine the depth of the order book to determine the level of buying and selling interest in the asset. Traders can also use order book data to identify potential trading signals. For example, if the bid side of the order book is heavily populated at a certain price level, this could indicate that the asset’s price is likely to rise. On the other hand, if the ask side is heavily populated at a certain price level, it could indicate that the asset’s price is likely to fall.

Benefits of using order book data for trading

Using order book data can provide traders with a number of advantages.

For starters, it can be used to gauge market sentiment and identify potential trading opportunities.

Second, it can assist traders in more effectively managing risk. Traders can identify areas of support and resistance in order book data, which can then be used to set stop losses and take profits.

Finally, it can aid traders in the identification of potential trading signals. Traders can identify areas of potential buying and selling pressure in order book data, which can then be used to enter and exit trades.

How to use order book data for trading

Traders can use order book data to gain a competitive advantage in the markets. To accomplish this, they must first identify areas of support and resistance that can be used to set stop losses and profit targets.

Traders should also look for indications of buying and selling pressure in the order book. If the bid side of the order book is heavily populated at a certain price level, it could indicate that the asset’s price is likely to rise. On the other hand, if the ask side is heavily populated at a certain price level, it could indicate that the asset’s price is likely to fall.

Finally, traders should use trading software to automate their strategies. Trading bots can be set up to monitor order book data and execute trades based on it. This allows traders to capitalize on trading opportunities more quickly and efficiently.

Conclusion

To summarize, the order book is a vital instrument for financial market traders. It gives real-time information about an asset’s supply and demand, which can be used to gauge market mood and find potential trading opportunities. Traders can also utilize order book data to create stop losses and take profits and to automate their trading techniques. Traders might obtain an advantage in the markets by utilizing the power of the order book.

Related posts on the SimTrade blog

▶ Jayna MELWANI The impact of market orders on market liquidity

▶ Lokendra RATHORE Good-til-Cancelled (GTC) order and Immediate-or-Cancel (IOC) order

▶ Clara PINTO High-frequency trading and limit orders

▶ Akshit GUPTA Analysis of The Hummingbird Project movie

Useful resources

SimTrade course Trade orders

SimTrade course Market making

SimTrade simulations Market orders   Limit orders

About the author

The article was written in March 2023 by Federico DE ROSSI (ESSEC Business School, Master in Strategy & Management of International Business (SMIB), 2020-2023).

Hedging of the crude oil price

Youssef_Louraoui

In this article, Youssef Louraoui (Bayes Business School, MSc. Energy, Trade & Finance, 2021-2022) discusses the concept of hedging and its application in the crude oil market.

This article is structured as follow: we introduce the concept of hedging in the first place. Then, we present the mathematical foundation of the Minimum Variance Hedging Ratio (MVHR). We wrap up with an empirical analysis applied to the crude oil market with a conclusion.

Introduction

Hedging is a strategy that considers taking both positions in the physical as well as the futures market to offset market movement and lock-in the price. When an individual or a corporation decides to hedge risk using futures markets, the objective is to take the opposite position to neutralize the risk as far as possible. If the company is long on the physical side (say a producer), they will mitigate the hedging by taking a short exposure in the future market. The opposite is true for a market player who is short physical. He will seek to have a long exposure in the futures market to offset the risk (Hull, 2006).

Short hedge

Selling futures contracts as insurance against an expected decrease in spot prices is known as a short hedge. For instance, an oil producer might sell crude futures or forwards if they anticipate a decline in the price of the commodity.

Long hedge

A long hedge involves purchasing futures as insurance against an increase in price. For instance, an aluminum smelter will purchase electricity futures and forward contracts, allowing the business to secure its electricity needs in the event that the physical market rises in value.

Mathematical foundations

Linear regression model

We can consider the hedge ratio as the slope of the following linear regression representing the relationship between the spot and futures price changes:

doc_SimTrade_MVHR_formula_4

where

  • ∆St the change in the spot price at time t
  • β represents the hedging parameter
  • ∆Ft the change in the futures price at time t

The linear regression model above can also be expressed with returns instead of price changes:

doc_SimTrade_MVHR_formula_5

  • RSpot the return in the spot market at time t
  • RFutures the return in the futures market at time t

Hedge ratio

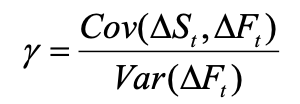
We can derive the following formula for the Minimum Variance Hedging Ratio (MVHR) denoted by the Greek letter beta β:

doc_SimTrade_MVHR_formula_3

where

  • Cov(∆St,∆Ft) the co movement of the change in spot price and futures price at time t
  • Var(∆Ft) represents the variance of the change in price of the future price at time t

The variance and covariance of spot and futures prices are time-varying due to the changing distributional features of these values across time. Accordingly, taking into consideration such dynamics in the variance and covariance term of asset prices is a more acceptable method of establishing the minimal variance hedge ratio. There is a number of different methods that account for the dynamic nature of the minimal variance hedge ratio estimation (Alizadeh, 2022):

  • Simple Rolling OLS
  • Rolling VAR or VECM
  • GARCH models
  • Markov Regime Switching
  • Minimising VaR and CVaR methods

Empirical approach to hedging analysis

Periods

We downloaded ten-year worth of weekly data for the WTI crude oil spot and futures contract from the US Energy Information Administration (EIA) website. We decompose the data into two periods to assess the effectiveness of the different hedging strategies: 1st period from 23rd March 2012 to 24th March 2017 and 2nd period from 31st March 2017 to 22nd March 2022.

First period: March 2012 – March 2017

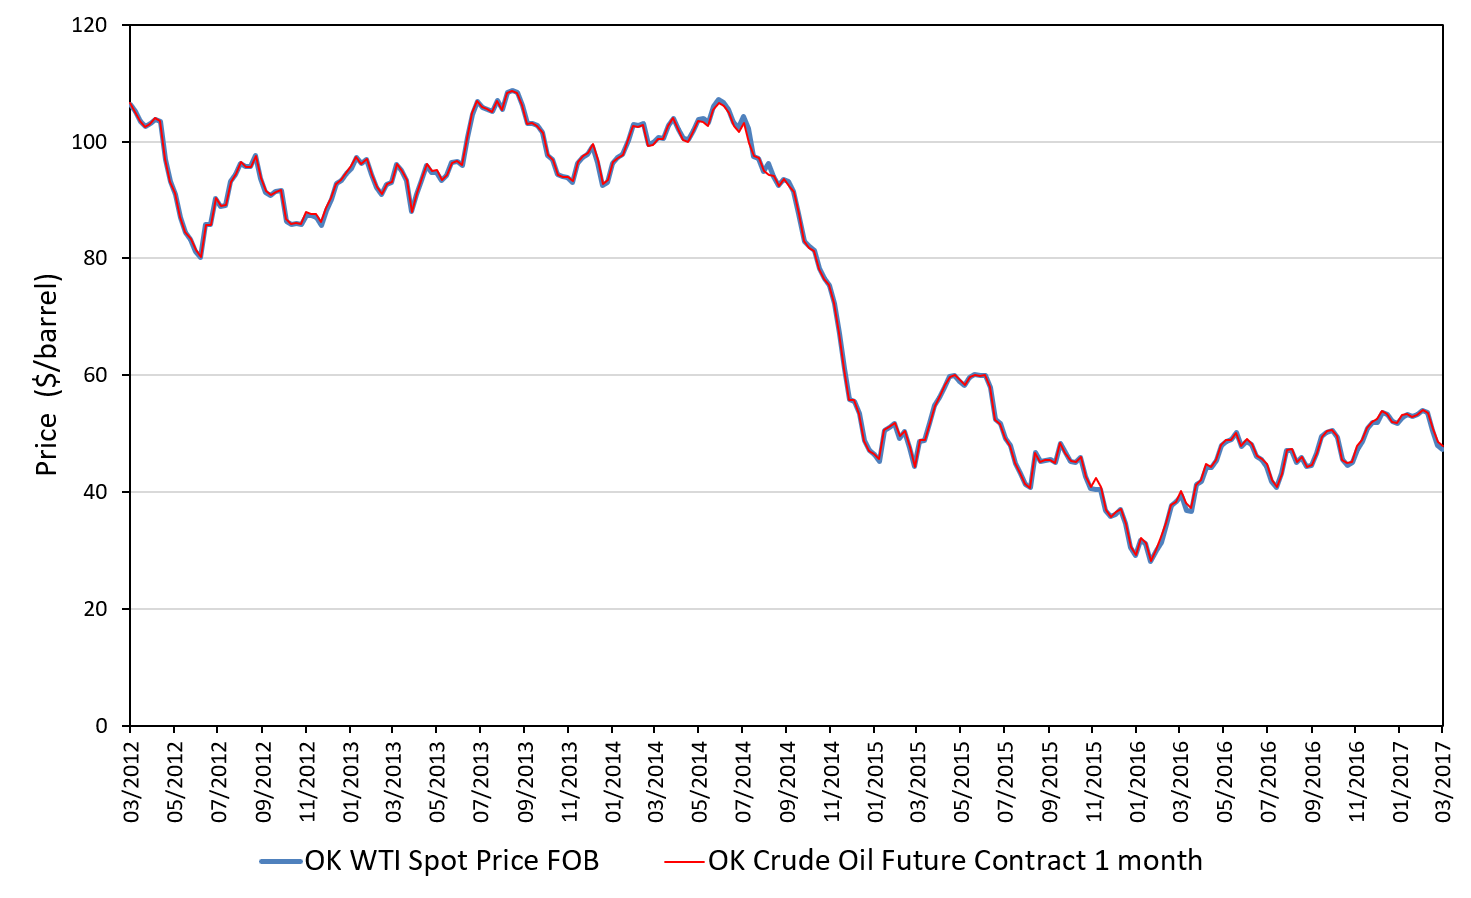
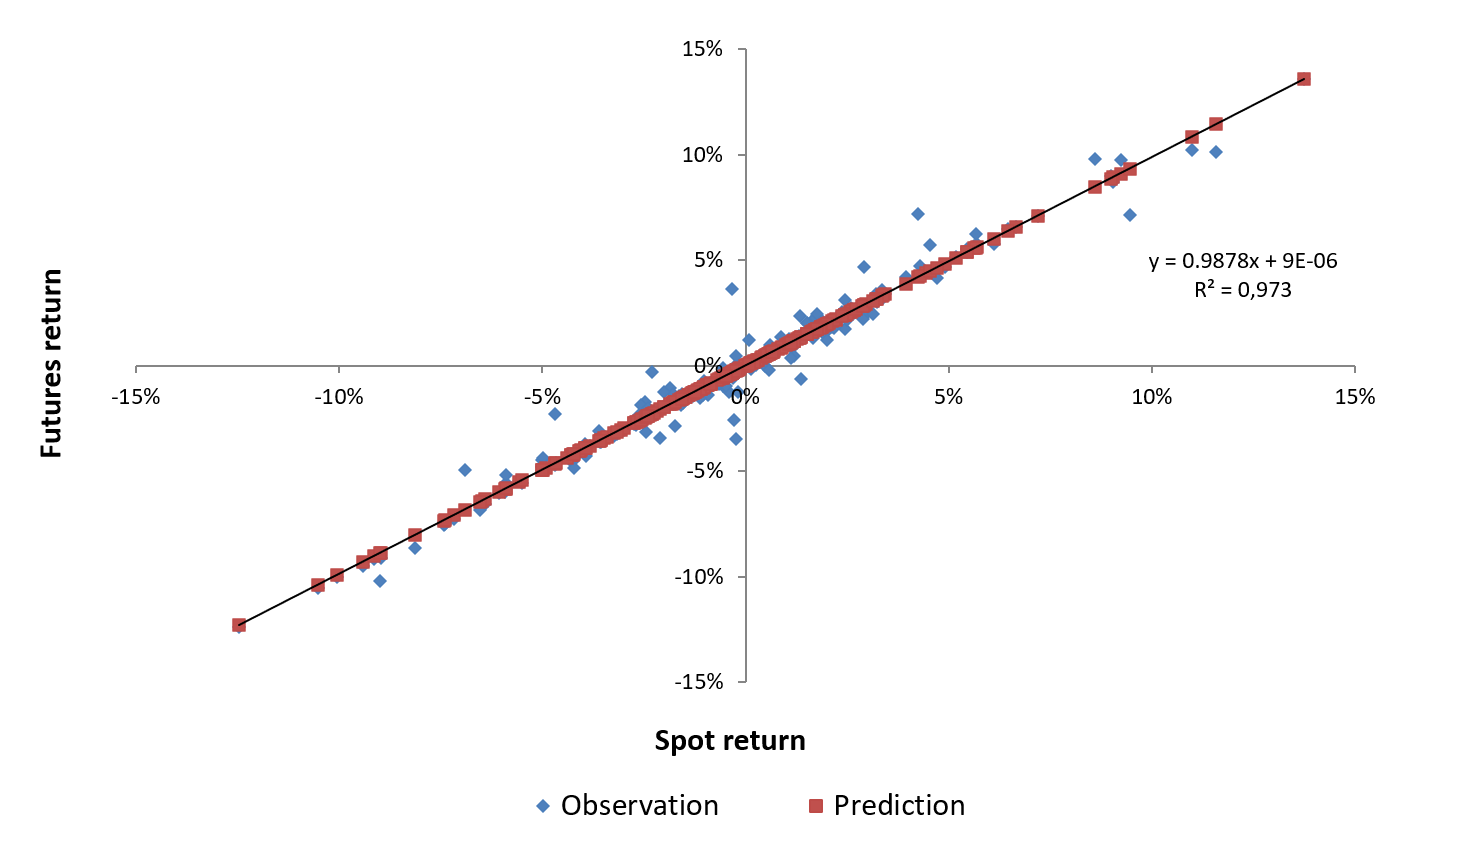
The first five years are used to estimate the Minimum Variance Hedging Ratio (Ederington, 1979). We can approach this question by using the “=slope(known_ys, known_xs)” function in Excel to obtain the gamma coefficient that would represent the MVHR. When computing the slope for the first period of the sample from 23rd March 2012 to 24th March 2017, we get a MVHR equal to 0.985. We obtain a correlation (ρ) using the Excel formula “=correl(array_1, array_2)” highlighting the logarithmic return of WTI spot and futures contract price, which yields 0.986. We can see from the figure 1 how the spot and futures prices converge closely and track each other in a very tight corridor, with very minor divergence. The regression plot between spot and futures contract returns for the first period is shown in Figure 2. This suggests that the hedger should take an opposite position in the futures market equal to 0.985 contract for each spot contract in order to minimise risk when using futures contracts as a hedging tool.

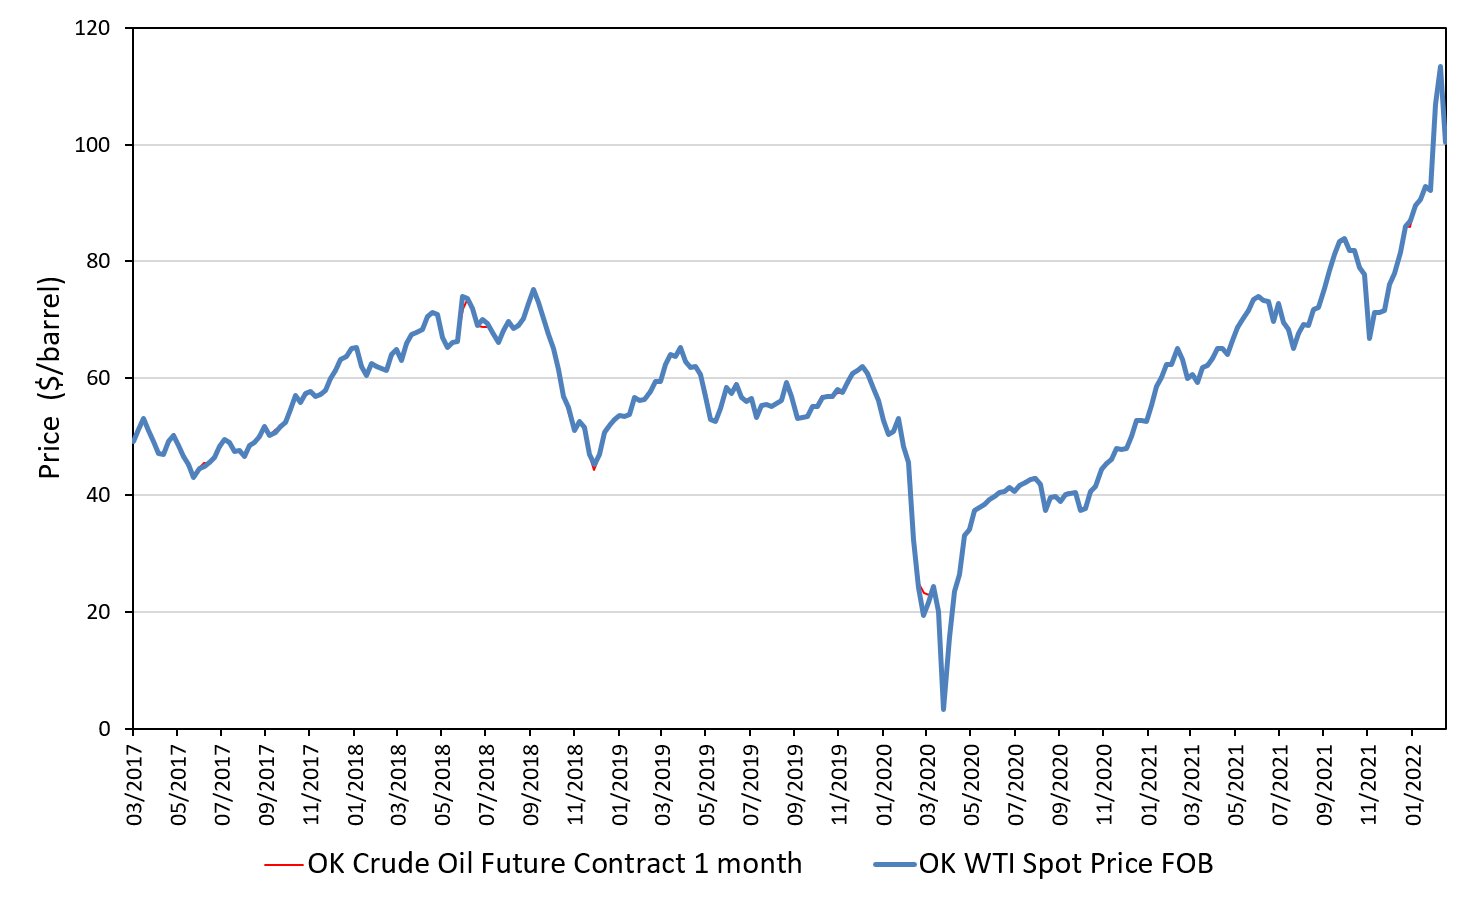
Figure 1. WTI spot and futures (1 month) prices
March 2012 – March 2017
WTI spot and futures prices
Source: computation by the author (data: EIA & Refinitiv Eikon).

Figure 2. Linear regression of WTI spot return on futures (1 month) return
March 2012 – March 2017
Linear regression of WTI spot return on futures (1 month) return
Source: computation by the author (data: EIA & Refinitiv Eikon).

A one-to-one hedge ratio (also known as naïve hedge) means that for every dollar of exposure in the physical market, we take one dollar exposure in the futures market. The effectiveness of this strategy is tied closely to how the spot/futures market correlation behaves. The effectiveness of this strategy would be equal to the correlation of the spot and the futures market prices in the second period.

Second period: March 2017 – March 2022

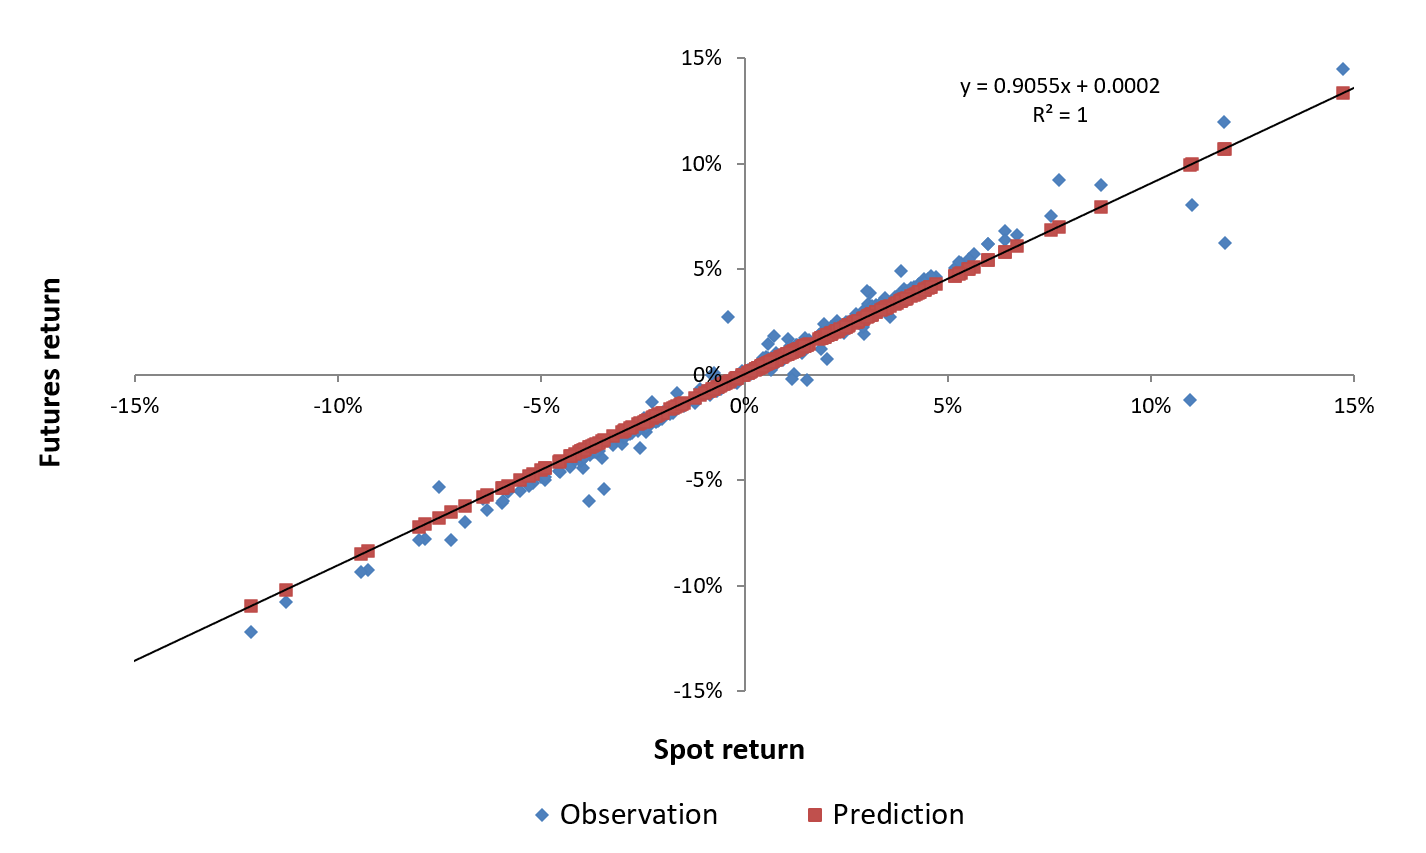
We compute the MVHR for the second period with the same approach retained in the first part by using the “=slope(known_ys, known_xs)” function in Excel to obtain the gamma coefficient that would represent the MVHR. When computing the slope for the first period of the sample from 23rd March 2017 to 24th March 2022, we get a MVHR equal to 1.095. This means that for every spot contract that we own, we need to buy 0.985 futures contracts to hedge our market risk. As previously stated, the same trend can be seen in figure 3, where spot and futures prices converge closely and track each other with just little deviation. Figure 4 represents the regression plot between spot and futures contract returns for the second period. This means that in order to reduce risk to the minimum possible amount when futures contract used as hedging instrument, for each spot contract the hedger should take an opposite position equivalent to 1.05 contract in the futures market.

Figure 3. WTI spot and futures (1 month) prices
March 2017 – March 2022.
WTI spot and futures prices
Source: computation by the author (data: EIA & Refinitiv Eikon).

Figure 4. Linear regression of WTI spot return on futures (1 month) return
March 2017 – March 2022
Linear regression of WTI spot return on futures (1 month) return
Source: computation by the author (data: EIA & Refinitiv Eikon).

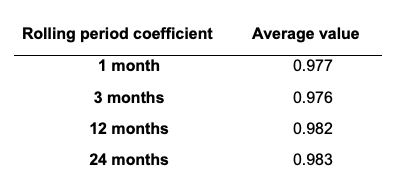
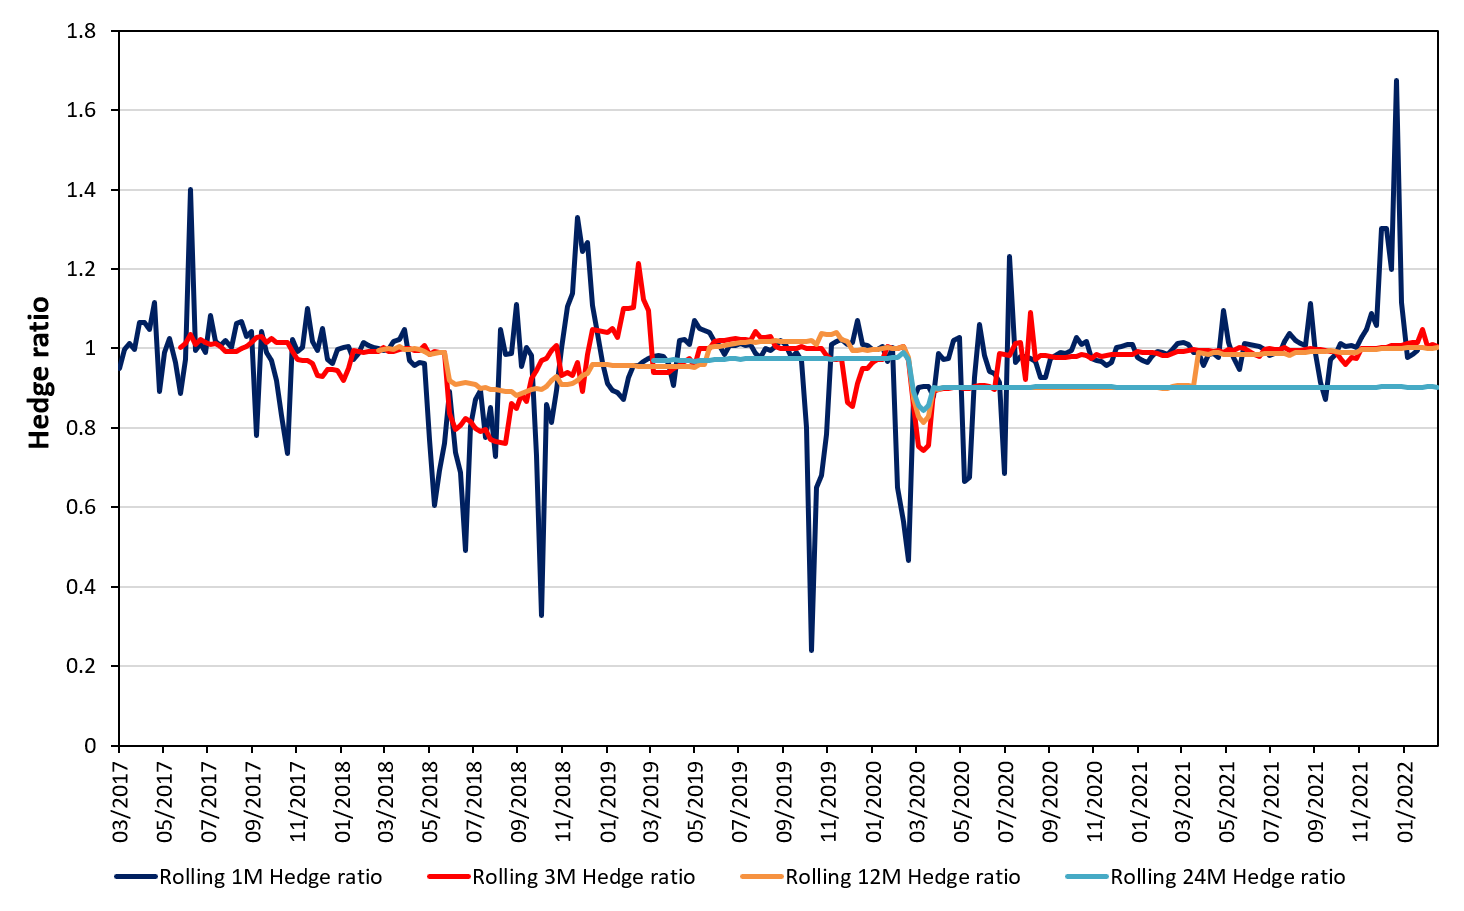
We can approach this hedging exercise in a time-varying framework. Some academics consider that covariance and correlation are not static parameters, so they came up with models to accommodate for the time-varying nature of these two parameters. We can compute the rolling regression as the rolling slope by changing the timeframe to allow for dynamic coefficients. For this example, we computed rolling regression for one month, three-month, one year and two years. We can plot the rolling regression in the graph below (Figure 5). We can average the rolling gammas and obtain an average for each rolling period (Table 1):

Table 1. Table capturing the rolling hedge ratio for WTI across different horizons.
 Hedging strategy
Source: computation by the author (data: EIA & Refinitiv Eikon).

Figure 5. WTI hedge ratio for different rolling window sizes.
Hedge ratio for WTI for rolling window sizes
Source: computation by the author (data: EIA & Refinitiv Eikon).

Conclusion

In an realistic setting, these results may be oversimplified. In some instances, cross hedging is required to calculate this strategy. This technique is used to hedge an asset’s value by relying on another asset to replicate its behaviour. Let’s use an airline as an example of a corporation seeking to hedge its jet fuel expenditures. As there is currently no jet fuel futures contract, the airline can hedge its basis risk with heating oil (an equivalent product with a valid futures market). As stated previously, the degree of correlation between the spot price and the futures price impacts the precision of cross-hedging (and hedging in general). To get the desired results and avoid instances in which we overhedge or underhedge our exposure, hedging must finally be performed appropriately.

You can find below the Excel spreadsheet that complements the explanations about of this article.

 Hedging strategy on crude oil

Why should I be interested in this post?

Understanding hedging techniques can be a valuable tool to implement to reduce the downside risk of an investment. Implementing a good hedging strategy can help professionals to better monitor and modify their trading strategies based different market environments.

Related posts on the SimTrade blog

   ▶ Youssef LOURAOUI My experience as an Oil Analyst at an oil and energy trading company

   ▶ Youssef LOURAOUI Introduction to Hedge Funds

   ▶ Youssef LOURAOUI Global macro strategy

   ▶ Youssef LOURAOUI Minimum volatility factor

   ▶ Youssef LOURAOUI VIX index

   ▶ Jayati WALIA Black Scholes Merton option pricing model

   ▶ Jayati WALIA Implied volatility

   ▶ Youssef LOURAOUI Portfolio

Useful resources

Academic research

Adler M. and B. Dumas (1984) “Exposure to Currency Risk: Definition and Measurement” Financial Management 13(2) 41-50.

Alizadeh A. (2022) Volatility of energy prices: Estimation and modelling. Oil and Energy Trading module at Bayes Business School. 46-51.

Ederington L.H. (1979). The Hedging Performance of the New Futures Markets. Journal of Finance, 34(1) 157-170.

Hull C.J. (2006). Options, futures and Other Derivatives, sixth edition. Pearson Prentice Hall. 99-373.

Business

US Energy Information Administration (EIA)

About the author

The article was written in January 2023 by Youssef LOURAOUI (Bayes Business School, MSc. Energy, Trade & Finance, 2021-2022).

Market efficiency: the case study of Yes bank in India

Aamey MEHTA

In this article, Aamey MEHTA (ESSEC Business School, Master in Finance, Singapore campus, 2022-2023) explains the key financial concept of market efficiency.

What is Market Efficiency?

An informationally efficient market is a market in which the current price of a security fully, rationally, and quickly reflects all information of that security

We can measure the efficiency of a market by observing the lag between the time that information is received to the time that the security’s price reflects this information. If there is a large lag, then traders can make use of this information to generate positive returns. For efficient markets the price of a security should not be affected by information that is already expected. The changes in price should be due to new information, i.e., information that was unexpected. For example: if a company’s earning is expected to be $10M (market consensus) and their earnings are $10M, this should not cause a change in the company’s price. However, if the earnings were $20M or $5M, then the shock news will cause the stock price to move upwards or downwards.

Market efficiency and investment styles

In a perfectly efficient market investors should use a passive investment strategy. This is because in such a market it is not possible to beat the market. In efficient markets investors can expect the market value of an assets to be equal to its intrinsic value. Using an active strategy will result in underperformance compared to the market due to transaction costs. However, if the market is inefficient, then active investment strategies can result in a profit for the investor.

What factors affect market efficiency?

Generally, markets are neither perfectly efficient or inefficient. The degree of efficiency depends on the following factors: the number of market participants, the availability of Information, and impediments to trading.

Number of market participants

The higher the number of market participants the more efficient the market is. Market participants include investors, traders, analysts, and people who follow the market. The number of participants can vary over time and across countries. Some countries prevent foreigners from trading on their markets which reduces market efficiency.

Availability of Information

The more information that is available to the investors, more efficient the market is. The easier and cheaper it is to access the information the more efficient the market will be. The access to information should not favor one group over another and should be equally available to all participants. If participants have access to material nonpublic information about the firm they should not trade on this information as this would constitute insider trading which is illegal. In developed markets there is abundance of information, and the markets are efficient. Example: New York Stock Exchange. In less developed markets the availability of information is lower and hence markets are less efficient. Example: the forwards market.

Impediments to trading

Arbitrage refers to buying an asset in one market and simultaneously selling it in another market at a higher price. This buying and selling will continue till price in both the markets are the same and arbitrage is no longer possible. Impediments to trading such as high transaction costs will restrict arbitrage opportunities and allow for some mispricing of assets.

Short selling prevents assets from being overvalued and hence short selling improves market efficiency. Restrictions on short selling, such as inability to borrow stock cheaply will reduce efficiency.

Transaction and information costs

If the cost of gathering information, analysis and trading is more than the cost of trading misvalued assets markets will be inefficient. If after deducting costs, there is no risk adjusted returns to be made from trading based on publicly available information then the markets are said to be efficient.

Types of market efficiency

Weak form of market efficiency

This form of market efficiency states that current security prices fully reflect all currently available security market data. Thus, past price and volume information will have no predictive power over the future direction of security prices because price changes will be independent from one period to the next.

Semi-strong form of market efficiency

This form holds that security prices rapidly adjust without bias to the arrival of new public information. Current security prices fully reflect all publicly available information. This form says that security prices include all past security market and non-market information available to the public. Examples: Information on the financials reports published by the company, news about the company.

Strong form of market efficiency

This form states that security prices fully reflect all information from both public and private sources. The strong form includes all types of information: past security market information, public and private (insider) information. This means that no group of investors has monopolistic access to information relevant to the formation of prices and no one should be able to generate positive risk adjusted returns.

What do we know about the efficiency of the market?

Fama

Fama, in his paper Efficient Market Hypothesis defined a market to be “informationally efficient” if prices at each moment incorporate all available information about future values.

The efficient market hypothesis states:

  • Current prices incorporate all available information and expectations.
  • Current prices are the best approximation of intrinsic value.
  • Price changes are due to unforeseen events.
  • “Mispricings” do occur but not in predictable patterns that can lead to consistent outperformance.

The efficient market hypothesis does not state:

  • All investors are rational.
  • Prices are always right.
  • Prices should be stable.
  • Professional money managers can’t earn higher than market returns.

The Grossman-Stiglitz paradox

This paradox was proposed by Stanford Grossman and Joseph Stiglitz. They argue that perfectly informationally efficient markets are an impossibility since, if prices perfectly reflected available information, there is no profit to gathering information, in which case there would be little reason to trade and markets would eventually collapse.

Investors that purchase index funds or ETFs benefit at the expense of investors who pay for financial services either indirectly or directly via investing in actively managed funds.

Case study: yes bank

Yes Bank is an Indian Bank founded in 2004 by Rana Kapoor and Ashok Kapur, headquartered in Mumbai, India.

Yes bank is a private sector bank. In March 2020, Yes Bank faced a historical crisis. There are various reasons that led Yes bank to this crisis, they are, there were a large number of bad loans given by banks and depositors have withdrawn large numbers of amounts from the bank. There was no balance between the loan sheet and the depositors’ sheet. RBI put a 30 days moratorium on Yes Bank to save it.
A major effect of the yes bank crisis was that there was a big chance that other financial institutions could collapse. But the Reserve Bank of India took initiative and saved Yes Bank from major collapse.

In May 2020 shares of Yes Bank Ltd. fell as much as 84.65 percent intraday to Rs 5.65 apiece—the lowest on record—but pared some of the losses to traded 51.63 percent lower at Rs 17.80. The S&P BSE Sensex fell 1,450 points and NSE Nifty 50 slipped below 10,900. This, after the Reserve Bank of India on Thursday evening superseded the board of the lender and imposed curbs on its operations for a month.

stock chart of yes bank
Logo of Wells Fargo
Source: internet.

Useful resources

Academic resources

Fama E. (1970) Efficient Capital Markets: A Review of Theory and Empirical Work, Journal of Finance, 25,383-417.

Fama E. (1991) Efficient Capital Markets: II Journal of Finance, 46, 1575-617.

Grossman S.J. and J.E. Stiglitz (1980) On the Impossibility of Informationally Efficient Markets The American Economic Review, 70, 393-408.

Business resources

Yes bank

Related posts on the SimTrade blog

▶ Youssef LOURAOUI Passive Investing

▶ Youssef LOURAOUI Active Investing

▶ Akshit GUPTA Portfolio manager – Job description

About the author

The article was written in November 2022 by Aamey MEHTA (ESSEC Business School, Master in Finance, Singapore campus, 2022-2023)

Reverse Convertibles

Shengyu ZHENG

In this article, Shengyu ZHENG (ESSEC Business School, Grande Ecole Program – Master in Management, 2020-2023) explains reverse convertibles, which are a structured product with a fixed-rate coupon and downside risk.

Introduction

The financial market has been ever evolving, witnessing the birth and flourish of novel financial instruments to cater to the diverse needs of market participants. On top of plain vanilla derivative products, there are exotic ones (e.g., barrier options, the simplest and most traded exotic derivative product). Even more complex, there are structured products, which are essentially the combination of vanilla or exotic equity instruments and fixed income instruments.

Amongst the structured products, reverse convertible products are one of the most popular choices for investors. Reverse convertible products are non-principal protected products linked to the performance of an underlying asset, usually an individual stock or an index, or a basket of them. Clients can enter into a position of a reverse convertible with the over-the-counter (OTC) trading desks in major investment banks.

In exchange for an above-market coupon payment, the holder of the product gives up the potential upside exposure to the underlying asset. The exposure to the downside risks still remains. Reserve convertibles are therefore appreciated by the investors who are anticipating a stagnation or a slightly upward market trend.

Construction of a reverse convertible

This product could be decomposed in two parts:

  • On the one hand, the buyer of the structure receives coupons on the principal invested and this could be considered as a “coupon bond”;
  • On the other hand, the investor is still exposed to the downside risks of the underlying asset and foregoes the upside gains, and this could be achieved by a short position of a put option (either a vanilla put option or a down-and-in barrier put option).

Positions of the parties of the transaction

A reverse convertible involves two parties in the transaction: a market maker (investment bank) and an investor (client). Table 1 below describes the positions of the two parties at different time of the life cycle of the product.

Table 1. Positions of the parties of a reverse convertible transaction

t Market Maker (Investment Bank) Investor (Client)
Beginning
  • Enters into a long position of a put (either a vanilla put or a down-and-in barrier put)
  • Receives the nominal amount for the “coupon” part
  • Invests in the amount (nominal amount plus the premium of the put) in risk-free instruments
  • Enters into a short position of a put (either a vanilla put or a down-and-in barrier put)
  • Pays the nominal amount for the “coupon” part
Interim
  • Pays pre-specified interim coupons in respective interim coupon payment dates (if any)
  • Receives interest payment from risk-free investments
  • Receives the pre-specified interim coupons in respective interim coupon payment dates (if any)
End
  • Receives the payoff (if any) of the put option component
  • Pays the pre-specified final coupon in the final coupon payment date
  • Pays the payoff (if any) of the put option component
  • Receives the pre-specified final coupon in the final coupon payment date

Based on the type of the put option incorporated in the product (either plain vanilla put option or down-and-in barrier put option), reserve convertibles could be categorized as plain or barrier reverse convertibles. Given the difference in terms of the composition of the structured product, the payoff and pricing mechanisms diverge as well.

Here is an example of a plain reverse convertible with following product characteristics and market information.

Product characteristics:

  • Investment amount: USD 1,000,000.00
  • Underlying asset: S&P 500 index (Bloomberg Code: SPX Index)
  • Investment period: from August 12, 2022 to November 12, 2022 (3 months)
  • Coupon rate: 2.50% (quarterly)
  • Strike level : 100.00% of the initial level

Market data:

  • Current risk-free rate: 2.00% (annualized)
  • Volatility of the S&P 500 index: 13.00% (annualized)

Payoff of a plain reverse convertible

As is presented above, a reverse convertible is essentially a combination of a short position of a put option and a long position of a coupon bond. In case of the plain reverse convertible product with the aforementioned characteristics, we have the blow payoff structure:

  • in case of a rise of the S&P 500 index during the investment period, the return for the reverse convertible remains at 2.50% (the coupon rate);
  • in case of a drop of the S&P 500 index during the investment period, the return would be equal to 2.50% minus the percentage drop of the underlying asset and it could be negative if the percentage drop is greater than 2.5%.

Figure 1. The payoff of a plain reverse convertible on the S&P 500 index
Payoff of a plain reverse convertible
Source: Computation by author.

Pricing of a plain reverse convertible

Since a reverse convertible is essentially a structured product composed of a put option and a coupon bond, the pricing of this product could also be decomposed into these two parts. In terms of the pricing a vanilla option, the Black–Scholes–Merton model could do the trick (see Black-Scholes-Merton option pricing model) and in terms of pricing a barrier option, two methods, analytical formula method and Monte-Carlo simulation method, could be of help (see Pricing barrier options with analytical formulas; Pricing barrier options with simulations and sensitivity analysis with Greeks).

With the given parameters, we can calculate, as follows, the margin for the bank with respect to this product. The calculated margin could be considered as the theoretical price of this product.

Table 2. Margin for the bank for the plain reverse convertible
Margin for the bank for the plain reverse convertible
Source: Computation by author.

Download the Excel file to analyze reverse convertibles

You can find below an Excel file to analyze reverse convertibles.
Download Excel file to analyze reverse convertibles

Why should I be interested in this post

As one of the most traded structured products, reverse convertibles have been an important instrument used to secure return amid mildly negative market prospect. It is, therefore, helpful to understand the product elements, such as the construction and the payoff of the product and the targeted clients. This could act as a steppingstone to financial product engineering and risk management.

Related posts on the SimTrade blog

All posts about options

▶ Jayati WALIA Black-Scholes-Merton option pricing model

▶ Akshit GUPTA The Black Scholes Merton Model

▶ Shengyu ZHENG Barrier options

▶ Shengyu ZHENG Pricing barrier options with analytical formulas

▶ Shengyu ZHENG Pricing barrier options with simulations and sensitivity analysis with Greeks

Resources

Academic references

Broadie, M., Glasserman P., Kou S. (1997) A Continuity Correction for Discrete Barrier Option. Mathematical Finance, 7:325-349.

De Bellefroid, M. (2017) Chapter 13 (Barrier) Reverse Convertibles. The Derivatives Academy. Accessible at https://bookdown.org/maxime_debellefroid/MyBook/barrier-reverse-convertibles.html

Haug, E. (1997) The Complete Guide to Option Pricing. London/New York: McGraw-Hill.

Hull, J. (2006) Options, Futures, and Other Derivatives. Upper Saddle River, N.J: Pearson/Prentice Hall.

Merton, R. (1973). Theory of Rational Option Pricing. The Bell Journal of Economics and Management Science, 4:141-183.

Paixao, T. (2012) A Guide to Structured Products – Reverse Convertible on S&P500

Reiner, E. S. (1991) Breaking down the barriers. Risk Magazine, 4(8), 28–35.

Rich, D.R. (1994) The Mathematical Foundations of Barrier Option-Pricing Theory. Advances in Futures and Options Research: A Research Annual, 7, 267-311.

Business references

Six Structured Products. (2022). Reverse Convertibles et barrier reverse Convertibles

About the author

The article was written in August 2022 by Shengyu ZHENG (ESSEC Business School, Grande Ecole Program – Master in Management, 2020-2023).