Minimum Volatility Portfolio

Youssef_Louraoui

In this article, Youssef LOURAOUI (Bayes Business School, MSc. Energy, Trade & Finance, 2021-2022) elaborates on the concept of Minimum Volatility Portfolio, which is derived from Modern Portfolio Theory (MPT) and also in practice to build investment funds.

This article is structured as follows: we introduce the concept of Minimum Volatility Portfolio. Next, we present some interesting academic findings, and we finish by presenting a theoretical example to support the explanations given in this article.

Introduction

The minimum volatility portfolio represents a portfolio of assets with the lowest possible risk for an investor and is located on the far-left side of the efficient frontier. Note that the minimum volatility portfolio is also called the minimum variance portfolio or more precisely the global minimum volatility portfolio (to distinguish it from other optimal portfolios obtained for higher risk levels).

Modern Portfolio Theory’s fundamental notion had significant implications for portfolio construction and asset allocation techniques. In the late 1970s, the portfolio management business attempted to capture the market portfolio return. However, as financial research progressed and some substantial contributions were made, new factor characteristics emerged to capture extra performance. The financial literature has long encouraged taking on more risk to earn a higher return. However, this is a common misconception among investors. While extremely volatile stocks can produce spectacular gains, academic research has repeatedly proved that low-volatility companies provide greater risk-adjusted returns over time. This occurrence is known as the “low volatility anomaly,” and it is for this reason that many long-term investors include low volatility factor strategies in their portfolios. This strategy is consistent with Henry Markowitz’s renowned 1952 article, in which he embraces the merits of asset diversification to form a portfolio with the maximum risk-adjusted return.

Academic Literature

Markowitz is widely regarded as a pioneer in financial economics and finance due to the theoretical implications and practical applications of his work in financial markets. Markowitz received the Nobel Prize in 1990 for his contributions to these fields, which he outlined in his 1952 Journal of Finance article titled “Portfolio Selection.” His seminal work paved the way for what is now commonly known as “Modern Portfolio Theory” (MPT).

In 1952, Harry Markowitz created modern portfolio theory with his work. Overall, the risk component of MPT may be evaluated using multiple mathematical formulations and managed through the notion of diversification, which requires building a portfolio of assets that exhibits the lowest level of risk for a given level of expected return (or equivalently a portfolio of assets that exhibits the highest level of expected return for a given level of risk). Such portfolios are called efficient portfolios. In order to construct optimal portfolios, the theory makes a number of fundamental assumptions regarding the asset selection behavior of individuals. These are the assumptions (Markowitz, 1952):

  • The only two elements that influence an investor’s decision are the expected rate of return and the variance. (In other words, investors use Markowitz’s two-parameter model to make decisions.) .
  • Investors are risk averse. (That is, when faced with two investments with the same expected return but two different risks, investors will favor the one with the lower risk.)
  • All investors strive to maximize expected return at a given level of risk.
  • All investors have the same expectations regarding the expected return, variance, and covariances for all hazardous assets. This assumption is known as the homogenous expectations assumption.
  • All investors have a one-period investment horizon.

Only in theory does the minimum volatility portfolio (MVP) exist. In practice, the MVP can only be estimated retrospectively (ex post) for a particular sample size and return frequency. This means that several minimum volatility portfolios exist, each with the goal of minimizing and reducing future volatility (ex ante). The majority of minimum volatility portfolios have large average exposures to low volatility and low beta stocks (Robeco, 2010).

Example

To illustrate the concept of the minimum volatility portfolio, we consider an investment universe composed of three assets with the following characteristics (expected return, volatility and correlation):

  • Asset 1: Expected return of 10% and volatility of 10%
  • Asset 2: Expected return of 15% and volatility of 20%
  • Asset 3: Expected return of 22% and volatility of 35%
  • Correlation between Asset 1 and Asset 2: 0.30
  • Correlation between Asset 1 and Asset 3: 0.80
  • Correlation between Asset 2 and Asset 3: 0.50

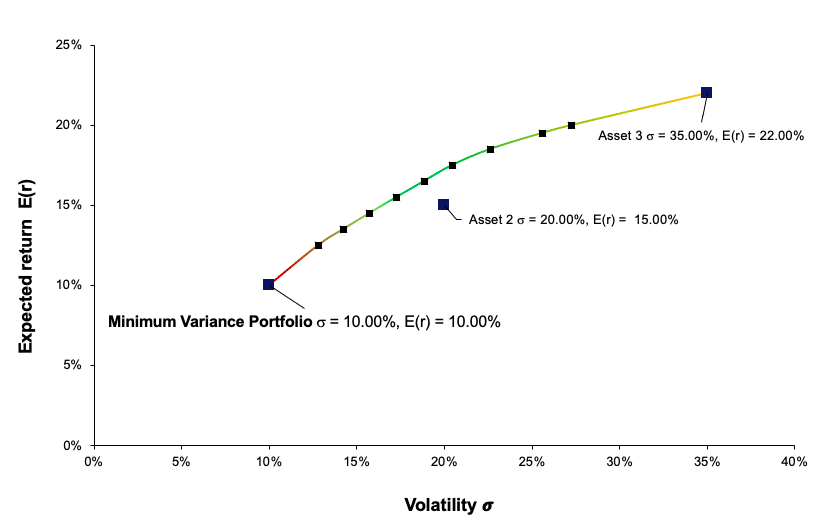
The first step to achieve the minimum variance portfolio is to construct the portfolio efficient frontier. This curve represents all the portfolios that are optimal in the mean-variance sense. After solving the optimization program, we obtain the weights of the optimal portfolios. Figure 1 plots the efficient frontier obtained from this example. As captured by the plot, we can see that the minimum variance portfolio in this three-asset universe is basically concentrated on one holding (100% on Asset 1). In this instance, an investor who wishes to minimize portfolio risk would allocate 100% on Asset 1 since it has the lowest volatility out of the three assets retained in this analysis. The investor would earn an expected return of 10% for a volatility of 10% annualized (Figure 1).

Figure 1. Minimum Volatility Portfolio (MVP) and the Efficient Frontier.
 Minimum Volatility Portfolio
Source: computation by the author.

Excel file to build the Minimum Volatility Portfolio

You can download below an Excel file in order to build the Minimum Volatility portfolio.

Download the Excel file to compute the Jensen's alpha

Why should I be interested in this post?

Portfolio management’s objective is to optimize the returns on the entire portfolio, not just on one or two stocks. By monitoring and maintaining your investment portfolio, you can accumulate a sizable capital to fulfil a variety of financial objectives, including retirement planning. This article helps to understand the grounding fundamentals behind portfolio construction and investing.

Related posts on the SimTrade blog

   ▶ Youssef LOURAOUI Markowitz Modern Portfolio Theory

   ▶ Jayati WALIA Capital Asset Pricing Model (CAPM)

   ▶ Youssef LOURAOUI Origin of factor investing

   ▶ Youssef LOURAOUI Minimum Volatility Factor

   ▶ Youssef LOURAOUI Beta

   ▶ Youssef LOURAOUI Portfolio

Useful resources

Academic research

Lintner, John. 1965a. Security Prices, Risk, and Maximal Gains from Diversification. Journal of Finance, 20, 587-616.

Lintner, John. 1965b. The Valuation of Risk Assets and the Selection of Risky Investments in Stock Portfolios and Capital Budgets.Review of Economics and Statistics 47, 13-37.

Markowitz, H., 1952. Portfolio Selection. The Journal of Finance, 7, 77-91.

Sharpe, William F. 1963. A Simplified Model for Portfolio Analysis. Management Science, 19, 425-442.

Sharpe, William F. 1964. Capital Asset Prices: A Theory of Market Equilibrium under Conditions of Risk. Journal of Finance, 19, 425-442.

Business analysis

Robeco, 2010 Ten things you should know about minimum volatility investing.

About the author

The article was written in January 2023 by Youssef LOURAOUI (Bayes Business School, MSc. Energy, Trade & Finance, 2021-2022).

Markowitz Modern Portfolio Theory

Markowitz Modern Portfolio Theory

Youssef_Louraoui

In this article, Youssef LOURAOUI (ESSEC Business School, Global Bachelor of Business Administration, 2017-2021) presents Markowitz’s Modern Portfolio Theory, a pioneering framework for understanding the impact of the number of stocks in a portfolio and their covariance relationships on portfolio diversification.

We begin by presenting Markowitz’s Modern Portfolio Theory (MPT) as the origin of factor investing (market factor). The assumptions of the model are then discussed. We’ll go through some of the model’s fundamental concepts next. We wrap up with a discussion of the concept’s limitations and a general conclusion.

Modern Portfolio Theory

The work conducted by Markowitz is widely acknowledged as a pioneer in financial economics and corporate finance for his theoretical implications and its application in financial markets. In 1990, Markowitz shared the Nobel Prize for his contributions to these domains, which he articulated in his 1952 article “Portfolio Selection” published in The Journal of Finance. His seminal work laid the groundwork for what is now often referred to as ‘Modern Portfolio Theory’ (MPT).

Modern portfolio theory was first introduced by the work of Harry Markowitz in 1952. Overall, the risk component of MPT can be quantified using various mathematical formulations and mitigated through the concept of diversification, which entails carefully selecting a weighted collection of investment assets that collectively exhibit lower risk characteristics than any single asset or asset class. Diversification is, in fact, the central notion of MPT and is predicated on the adage “never put all your eggs in one basket”.

Assumptions of the Markowitz Portfolio Theory

MPT is founded on several market and investor assumptions. Several of these assumptions are stated explicitly, while others are implied. Markowitz’s contributions to MPT in portfolio selection are based on the following basic assumptions:

  • Investors are rational (they seek to maximize returns while minimizing risk).
  • Investors will accept increased risk only if compensated with higher expected returns.
  • Investors receive all pertinent information regarding their investment decision in a timely manner.
  • Investors can borrow or lend an unlimited amount of capital at a risk-free rate of interest.

Concepts used in the MPT

Risk

Risk is equivalent to volatility in Markowitz’ portfolio selection theory—the larger the portfolio volatility, the greater the risk. Volatility is a term that refers to the degree of risk or uncertainty associated with the magnitude of variations in a security’s value. Risk is the possibility that an investment’s actual return will be less than predicted, which is technically quantified by standard deviation. A larger standard deviation implies a bigger risk and, hence, a larger potential return. If investors are prepared to take on risk, they anticipate earning a risk premium. Risk premium is defined as “the expected return on an investment that exceeds the risk-free rate of return”. The bigger the risk, the more risk premium investors need.”. Riskier investments do not necessarily provide a higher rate of return than risk-free ones. This is precisely why they are hazardous. However, historical evidence suggests that the only way for investors to obtain a better rate of return is to take on greater risk.

Systematic risk

Systematic risk is a type of risk at the macroeconomic level—risk that impacts a large number of assets to varying degrees. Inflation, interest rates, unemployment rates, currency exchange rates, and Gross National Product levels are all instances of systematic risk variables. These economic conditions have a significant influence on practically all securities. As a result, systemic risk cannot be completely eradicated.

Unsystematic risk

Unsystematic risk (or specific risk), on the other hand, is a type of risk that occurs at the micro-level risk factors that influence only a single asset or a small group of assets. It entails a distinct risk that is unrelated to other hazards and affects only particular securities or assets. For instance, Netflix’s poorly accepted adjustment to its planned consumer pricing structure elicited an extraordinarily unfavorable consumer response and defections, resulting in decreased earnings and stock prices. However, it had little effect on the Dow Jones or S&P 500 indexes, or on firms in the entertainment and media industries in general—with the probable exception of Netflix’s largest rival Blockbuster Video, whose value grew dramatically as a result of Netflix’s declining market share. Additional instances of unsystematic risk include a firm’s credit rating, poor newspaper coverage of a corporation, or a strike impacting a specific company. Diversification of assets within a portfolio can greatly minimize unsystematic risk.

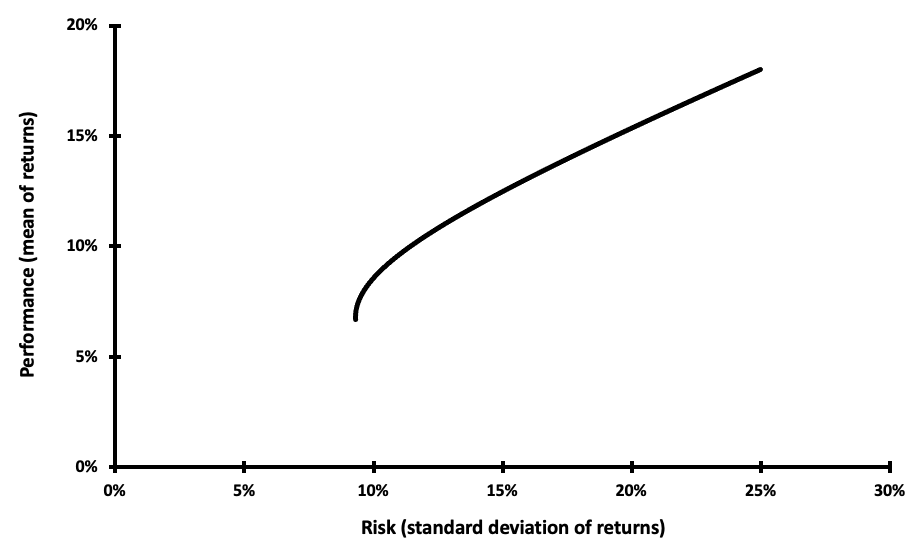
Because the returns on various assets are, in fact, connected to some extent, unsystematic risk can never be totally avoided regardless of the number of asset classes pooled in a portfolio. The Markowitz Efficient Frontier is depicted in Figure 1, with all efficient portfolios on the upper line. The efficient frontier is a set of optimal portfolios that offer the best-projected return for a specified level of risk, or the lowest risk for a specified level of return. Portfolios that fall below the efficient frontier are inefficient because they do not generate a sufficient rate of return in relation to the level of risk (Figure 1).

Figure 1. Markowitz Efficient Frontier.
MEF_MPT
Source: computations by the author.

Risk-return trade-off

The term risk-return trade-off refers to Markowitz’s fundamental theory that the riskier an investment, the larger the necessary potential return (or expected return). Investors will generally retain a hazardous investment only if the predicted return is sufficiently high to compensate them for taking the risk. Markowitz derives a relation between expected return (μ) and variance (σ2p) captured in the following expression. Refer to the post Implementation of the Markowitz allocation model for a better understanding of the mathematical foundations of this approach:

img_SimTrade_variance_Markowitz_portfolio

where

  • A, B and C = Optimization parameters
  • μ = expected return vector

Diversification

The words ‘diversification’ and ‘Diversification Effect’ relate to the correlations between portfolio risk and diversification. Diversification, a tenet of Markowitz’s portfolio selection theory and MPT, is a risk-reduction strategy that entails allocating assets among a variety of financial instruments, sectors, and other asset classes. In more straightforward terms, it refers to the aphorism “don’t put all your eggs in one basket.” If the basket is dropped, all eggs are shattered; if many baskets are used, the likelihood of all eggs being destroyed is significantly decreased. Diversification may be accomplished by investments in a variety of companies, asset types (e.g., bonds, real estate, etc.), and/or commodities such as gold or oil.

Diversification seeks to enhance returns while minimizing risk by investing in a variety of assets that will react differently to the same event (s). For example, whenever there is unfavorable news about the European debt crisis, the stock market typically declines dramatically. Simultaneously, the same news has generally benefited the price of specific commodities, such as gold. As a result, portfolio diversification methods should include not just diverse stocks inside and outside of the same industry, but also diverse asset classes, such as bonds and commodities. The Diversification Effect is a term that relates to the link between portfolio correlations and diversification. When there is an imperfect connection between assets (positive or negative), the diversification effect occurs. It is a critical and successful risk mitigation method since risk mitigation may be accomplished without jeopardizing profits. As a result, any prudent investor who is ‘risk cautious’ will diversify to a certain extent.

Limitation of the model

Despite its monumental theoretical significance, MPT has a slew of opponents who contend that its underlying assumptions and modeling of financial markets are frequently out of step with reality. One could argue that none of them are totally accurate and that each of them undermines MPT to varied degrees. Generally, some of the most common complaints include the following: irrationality of investors, relation between risk and return, treatment of information by investors, limitless borrowing capacity, perfectly efficient markets, and no taxes or transaction costs.

Irrationality of investors

It is assumed that investors are rational and aim to maximize returns while reducing risk. This is contrary to what market participants who become swept up in ‘herd behavior’ investment activity observe. For example, investors frequently gravitate into ‘hot’ industries, and markets frequently boom or burst because of speculative excesses.

Relation between risk and expected return

Increased risk = Increased expected returns. The idea that investors will only take more risk in exchange for higher predicted profits is regularly refuted by investor behavior. Frequently, investing techniques need investors to make a perceived hazardous investment (e.g., derivatives or futures) in order to lower total risk without increasing projected profits significantly. Additionally, investors may have certain utility functions that override worries about return distribution.

Treatment of information by investors

MPT anticipates that investors will get all information pertinent to their investment in a timely and thorough manner. In fact, global markets are characterized by information asymmetry (one party possesses superior knowledge), insider trading, and investors who are just more knowledgeable than others. This may explain why stocks, commercial assets, and enterprises are frequently acquired at a discount to their book or market value.

Limitless Borrowing Capacity

Another critical assumption mentioned previously is that investors have nearly unlimited borrowing capacity at a risk-free rate. Each investor has credit constraints in real-world markets. Additionally, only the federal government may borrow at the zero-interest treasury bill rate on a continuous basis.

Perfectly efficient markets

Markowitz’s theoretical contributions to MPT are predicated on the premise that markets are perfectly efficient (Markowitz, 1952). On the other hand, because MPT is based on asset values, it is susceptible to market whims such as environmental, personal, strategic, or social investment choice factors. Additionally, it ignores possible market failures like as externalities (costs or benefits that are not reflected in pricing), information asymmetry, and public goods (a non-rivalrous and non-excludable item). From another vantage point, centuries of ‘rushes’, ‘booms’, ‘busts’, ‘bubbles’, and ‘market crises’ illustrate that markets are far from efficient.

No Taxes or Transaction Costs

Neither taxes nor transaction costs are included in Markowitz’ theoretical contributions to MPT. To the contrary, genuine investment products are subject to both taxes and transaction costs (e.g., broker fees, administrative charges, and so on), and considering these costs into portfolio selection may certainly affect the optimal portfolio composition.

Conclusion

MPT has become the de facto dogma of contemporary financial theory and practice. The idea of MPT is that beating the market is tough, and those that do do it by diversifying their portfolios properly and taking above-average investing risks. The critical point to remember is that the model is only a tool—albeit the most powerful hammer in one’s financial toolbox. It has been over sixty years since Markowitz introduced MPT, and its popularity is unlikely to decrease anytime soon. His theoretical insights have served as the foundation for more theoretical investigation in the field of portfolio theory. Nonetheless, Markowitz’s portfolio theory is susceptible to and dependent on ongoing ‘probabilistic’ development and expansion.

Why should I be interested in this post?

Modern Portfolio Theory is at the heart of modern finance and its core foundations are structuring the modern investing panorama. MPT has established itself as the foundation for modern financial theory and practice. MPT’s premise is that beating the market is difficult, and those that do it by diversifying their portfolios appropriately and accepting higher-than-average investment risks.

MPT has been around for almost sixty years, and its popularity is unlikely to wane anytime soon. His theoretical contributions have laid the groundwork for more theoretical research in the field of portfolio theory. Markowitz’s portfolio theory, however, is vulnerable to and dependent on continuing ‘probabilistic’ development and expansion.

Related posts on the SimTrade blog

Portfolio Theory

   ▶ Youssef LOURAOUI Implementation of the Markowitz allocation model

   ▶ Youssef LOURAOUI Capital Asset Pricing Model (CAPM)

   ▶ Youssef LOURAOUI Implementation of the Black-Litterman model

   ▶ Youssef LOURAOUI Black-Litterman model

Factor investing

   ▶ Youssef LOURAOUI Factor Investing

   ▶ Youssef LOURAOUI Is smart beta really smart?

Factors

   ▶ Youssef LOURAOUI Size Factor

   ▶ Youssef LOURAOUI Value Factor

   ▶ Youssef LOURAOUI Yield Factor

   ▶ Youssef LOURAOUI Momentum Factor

   ▶ Youssef LOURAOUI Quality Factor

   ▶ Youssef LOURAOUI Growth Factor

   ▶ Youssef LOURAOUI Minimum Volatility Factor

Useful resources

Academic research

Ang, A., 2013. Factor Investing. Working paper.

Mangram, M.E., 2013. A simplified perspective of the Markowitz Portfolio Theory. Global Journal of Business Research, 7(1): 59-70.

Markowitz, H., 1952. Portfolio Selection. The Journal of Finance, 7(1): 77-91.

Mossin, J. 1966. Equilibrium in a Capital Asset Market. Econometrica, 34(4): 768-783.

Sharpe, W.F. 1963. A Simplified Model for Portfolio Analysis. Management Science, 9(2): 277-293.

Sharpe, W.F. 1964. Capital Asset Prices: A Theory of Market Equilibrium under Conditions of Risk. The Journal of Finance, 19(3): 425-442.

About the author

The article was written in September 2021 by Youssef LOURAOUI (ESSEC Business School, Global Bachelor of Business Administration, 2017-2021).

VIX index

VIX index

Youssef_Louraoui

In this article, Youssef LOURAOUI (ESSEC Business School, Global Bachelor of Business Administration, 2017-2021) presents the VIX index, which is a financial index that measures the uncertainty in the US equity market.

This article is structured as follows: we begin by defining the grounding notions of the VIX index. We then explain the behavior of this index and its statistical characteristics. We finish by presenting its practical usage in financial markets.

Definition

The CBOE Volatility Index, abbreviated “VIX”, is a measure of the expected S&P 500 index movement calculated by the Chicago Board Options Exchange (CBOE) from the current trading prices of options written on the S&P 500 index.

Known as Wall Street’s “fear index”, the VIX is closely monitored by a broad range of market players, and its level and pattern have become ingrained in market discussion.

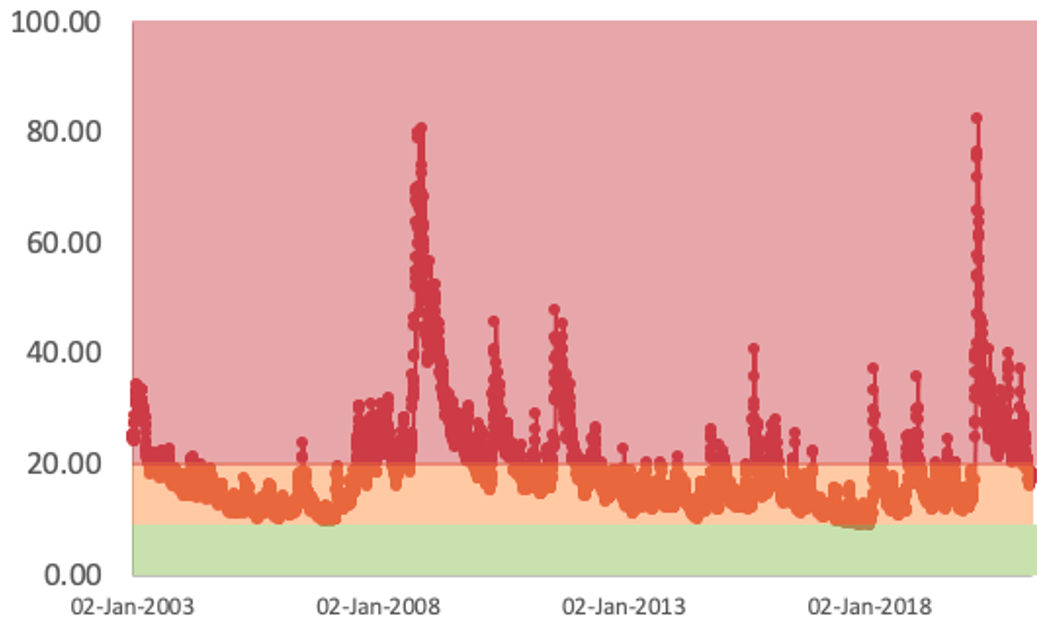
Figure 1 illustrates the evolution of the VIX index for the period from 2003 to 2021.
Figure 1 Historical levels of the VIX index from 2003-2021.
VIX_levels_analysis
Source: computation by the author (Data source: Thomson Reuters).

VIX values greater than 20 are regarded to be high by market participants. If the VIX is between 12 and 20, it is considered normal; if it is less than 12, it is considered low. As it is the case with other indices, the VIX is computed using the price of a basket of tradable components (in this case, options expiring within the next month or so). The profit or loss that option buyers and sellers realize during the option’s life will depend, among other things, on how significantly the S&P 500’s actual volatility will differ from the implied volatility given by the VIX at the start of the period (S&P Global Research, 2017).

Behavior of the VIX index

Statistical distribution of the S&P500 index returns and VIX level

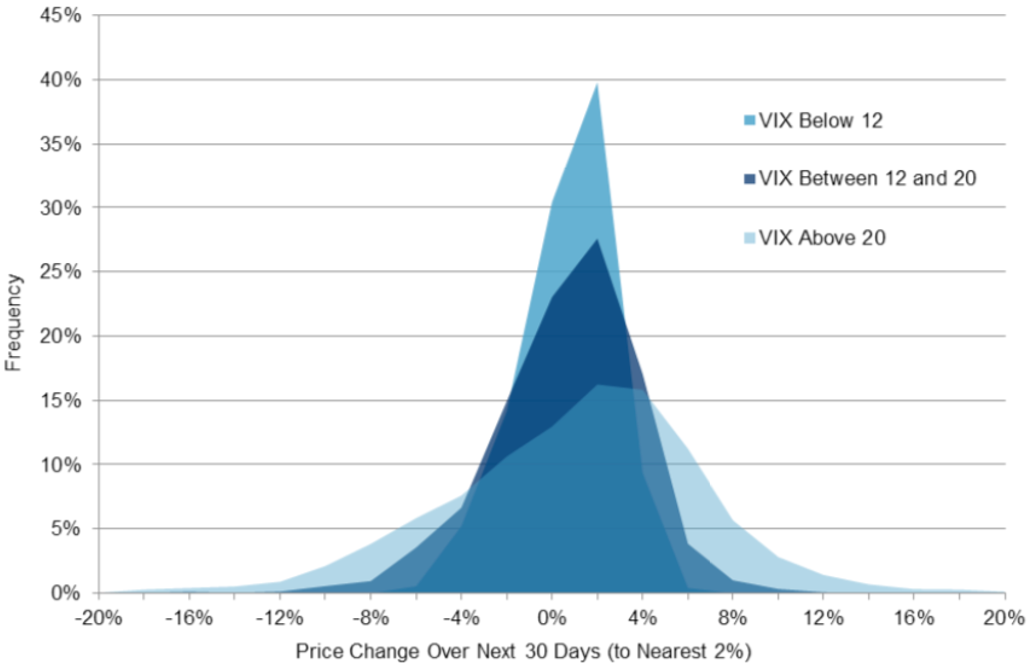
Figure 2 displays the statistical distribution of the price variations in the S&P500 index for different levels of the VIX index The higher the VIX index (by convention, greater than 20), the more severe the distribution tends to be, with negative skewness and high kurtosis indicating heightened volatility in the US market, therefore exacerbating both positive and negative swings. An opposite finding may be made for the VIX level at lower levels (often less than 12), when market swings are less evident due to less skewness and lower kurtosis (S&P Global Research, 2017).

Figure 2. The distribution of 30-day return in the S&P500 index for different VIX index levels.
Statistical distribution of the S&P500 index returns
Source: S&P Global Research (2017).

If the VIX is low, market players may benefit by purchasing options; conversely, if the VIX is high, market participants may profit from selling options. The specific utility of anticipated VIX is that it gives us with a more accurate assessment of whether VIX is high, low, or normal at any point in time (S&P Global Research, 2017). Thus, VIX may be regarded of as a crowd-sourced estimate of the S&P 500’s expected volatility. As with interest rates and dividends, one cannot invest directly in them, even though one can guess on their future worth, one cannot invest directly in VIX, and the significance of a specific VIX level is commonly misinterpreted (S&P Global Research, 2017).

Recent volatility in the S&P500 index and VIX level

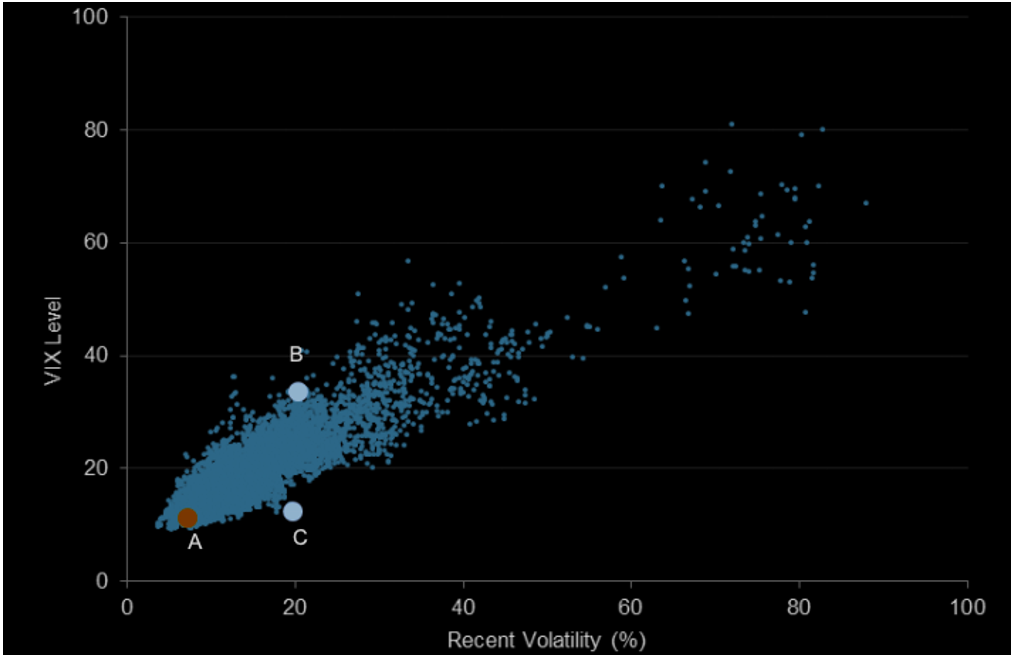
Figure 3 demonstrates that the VIX index is strongly correlated with recent market volatility. However, there is considerable variance; for example, a recent volatility level of about 20% has been associated with a VIX level of 34 (point B, when VIX was very “high”) and with a VIX level of 12 (point C, when VIX was relatively “low”). Volatility (realized or implied) has a strong propensity to return to its mean. This insight is not especially original, despite its illustrious past. There is an enormous body of data demonstrating that volatility tends to mean revert across markets, and the pioneers of this field were given the Nobel Prize in part for incorporating their results into volatility forecasts and simulations (S&P Global Research, 2017).

Figure 3. Relation between VIX and recent volatility.
VIX_regression_analysis
Source: S&P Global Research (2017).

Realized volatility in the S&P500 index and VIX level

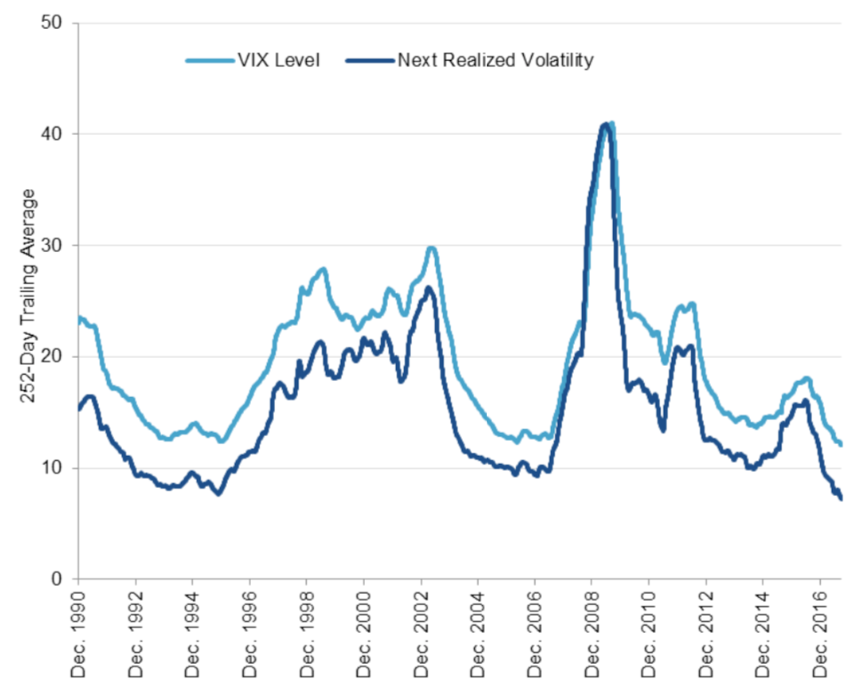
Figure 4 represents the relationship between Realized volatility in the S&P500 index over a period and the VIX level at the begining of the period.

Figure 4. VIX versus next realized volatility.
VIX_realized_graph
Source: S&P Global Research (2017).

Mean reversion

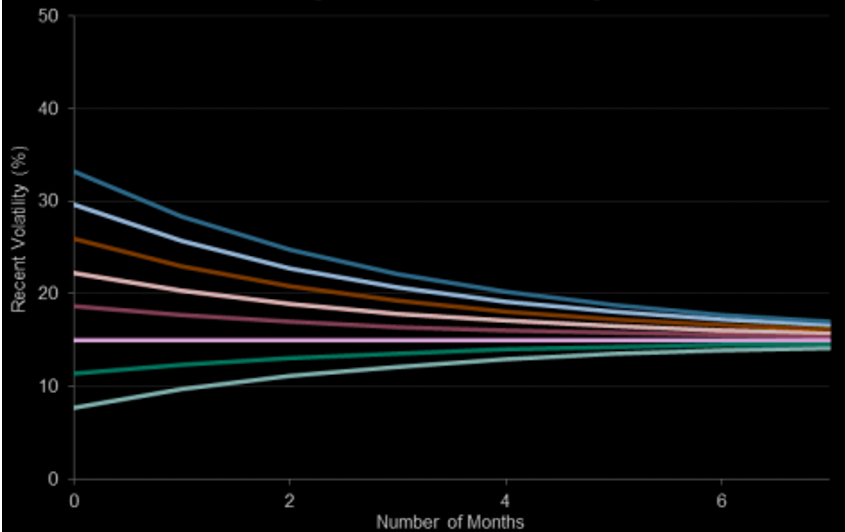
Figure 5 shows how VIX index converge to a certain llong-term level as time passes. This finding is not due to 15% being exceptional in any manner; this figure for M was calculated using historical volatility levels for the S&P 500 and their evolution. It is not implausible that M (else referred to as long-term average volatility in the US equities market) may change over time; changes in the S&P 500’s sector weightings, trade All of these factors have the ability to influence both the pace and the volume and the point at which mean reversion occurs.

Figure 5. Mean-reversion dynamic in recent volatility.
VIX mean reversion
Source: S&P Global Research (2017).

Use of the VIX index in financial markets

There are two methods for determining an asset’s volatility. Either through a statistical calculation of an asset’s realized volatility, also known as historical volatility, which serves as a pointer to the asset’s volatility behavior. This is a limited method that is based on the premise that past volatility tends to replicate itself in the future, without including a forward-looking study of volatility. The second technique is to extract an asset’s volatility from option prices referred to as “implied volatility”.

Why should I be interested in this post?

When investors make investment decisions, they utilize the VIX to gauge the degree of risk, worry, or stress in the market. Additionally, traders can trade the VIX using a range of options and exchange-traded products, or price derivatives using VIX values.

Related posts on the SimTrade blog

   ▶ All posts about Options

   ▶ Akshit GUPTA Options

   ▶ Akshit GUPTA History of Option Markets

   ▶ Jayati WALIA Implied Volatility

   ▶ Youssef LOURAOUI Minimum Volatility Factor

Useful resources

Business analysis

CBOE , 2021. VIX

Nasdaq, 2021. Realized Volatility

Nasdaq, 2021. Vix Index Volatility

S&P Global Research, 2017. Reading VIX: Does VIX Predict Future Volatility?

S&P Global Research, 2017. A Practitioner’s Guide to Reading VIX

About the author

The article was written in September 2021 by Youssef LOURAOUI (ESSEC Business School, Global Bachelor of Business Administration, 2017-2021).