Equity market neutral strategy

Youssef LOURAOUI

In this article, Youssef LOURAOUI (Bayes Business School, MSc. Energy, Trade & Finance, 2021-2022) presents the equity market neutral strategy. The objective of the equity market neutral strategy is to benefit from both long and short positions while minimizing the exposure to the equity market fluctuations.

This article is structured as follow: we introduce the equity market neutral strategy. Then, we present a practical case study to grasp the overall methodology of this strategy. We conclude with a performance analysis of this strategy in comparison with a global benchmark (MSCI All World Index and the Credit Suisse Hedge Fund index).

Introduction

According to Credit Suisse (a financial institution publishing hedge fund indexes), an equity market neutral strategy can be defined as follows: “Equity Market Neutral funds take both long and short positions in stocks while minimizing exposure to the systematic risk of the market (i.e., a beta of zero is desired). Funds seek to exploit investment opportunities unique to a specific group of stocks, while maintaining a neutral exposure to broad groups of stocks defined for example by sector, industry, market capitalization, country, or region. There are a number of sub- sectors including statistical arbitrage, quantitative long/short, fundamental long/short and index arbitrage”. This strategy makes money by holding assets that are decorrelated from a specific benchmark. The strategy can potentially generate returns in falling markets.

Mathematical foundation for the beta

This strategy relies heavily on the beta, derived from the capital asset pricing model (CAPM). Under this framework, we can relate the expected return of a given asset and its risk:

CAPM

Where :

  • E(r) represents the expected return of the asset
  • rf the risk-free rate
  • β a measure of the risk of the asset
  • E(rm) the expected return of the market
  • E(rm) – rf represents the market risk premium.

In this model, the beta (β) parameter is a key parameter and is defined as:

Beta

Where:

  • Cov(r, rm) represents the covariance of the asset return with the market return
  • σ2(rm) is the variance of market return.

The beta is a measure of how sensitive an asset is to market swings. This risk indicator aids investors in predicting the fluctuations of their asset in relation to the wider market. It compares the volatility of an asset to the systematic risk that exists in the market. The beta is a statistical term that denotes the slope of a line formed by a regression of data points comparing stock returns to market returns. It aids investors in understanding how the asset moves in relation to the market. According to Fama and French (2004), there are two ways to interpret the beta employed in the CAPM:

  • According to the CAPM formula, beta may be thought in mathematical terms as the slope of the regression of the asset return on the market return observed on different periods. Thus, beta quantifies the asset sensitivity to changes in the market return;
  • According to the beta formula, it may be understood as the risk that each dollar invested in an asset adds to the market portfolio. This is an economic explanation based on the observation that the market portfolio’s risk (measured by 〖σ(r_m)〗^2) is a weighted average of the covariance risks associated with the assets in the market portfolio, making beta a measure of the covariance risk associated with an asset in comparison to the variance of the market return.

Additionally, the CAPM makes a distinction between two forms of risk: systematic and specific risk. Systematic risk refers to the risk posed by all non-diversifiable elements such as monetary policy, political events, and natural disasters. By contrast, specific risk refers to the risk inherent in a particular asset and so is diversifiable. As a result, the CAPM solely captures systematic risk via the beta measure, with the market’s beta equal to one, lower-risk assets having a beta less than one, and higher-risk assets having a beta larger than one.

Application of an equity market neutral strategy

For the purposes of this example, let us assume that a portfolio manager wants to invest $100 million across a diverse equity portfolio while maintaining market-neutral exposure to market index changes. To create an equity market-neutral portfolio, we use five stocks from the US equity market: Apple, Amazon, Microsoft, Goldman Sachs, and Pfizer. Using monthly data from Bloomberg for the period from 1999 to 2022, we compute the returns of these stocks and their beta with the US equity index (S&P500). Using the solver function on Excel, we find the weights of the portfolio with the maximum expected return with a beta equal to zero.

Table 1 displays the target weights needed to build a portfolio with a neutral view on the equity market. As shown by the target allocation in Table 1, we can immediately see a substantial position of 186.7 million dollars on Pfizer while keeping a short position on the remaining equity positions of the portfolio totaling 86.7 million dollars in short positions. Given that the stocks on the short list have high beta values (more than one), this allocation makes sense. Pfizer is the only defensive stock and has a beta of 0.66 in relation to the S&P 500 index.

If the investment manager allocated capital in the following way, he would create an equity market neutral portfolio with a beta of zero:

Apple: -$4.6 million (-4.6% of the portfolio; a weighted-beta of -0.066)
Amazon: -$39.9 million (-39.9% of the portfolio; a weighted-beta of -0.592)
Microsoft: -$16.2 million (-16.2% of the portfolio; a weighted-beta of -0.192)
Goldman Sachs: -$26 million (-26% of the portfolio; a weighted-beta of -0.398)
Pfizer: $186.7 million (186.7% of the portfolio; a weighted-beta of 1.247)

Table 1. Target weights to achieve an equity market neutral portfolio.
Target weights to achieve an equity market neutral portfolio. Source: computation by the author (Data: Bloomberg)

You can find below the Excel spreadsheet that complements the explanations about the equity market neutral portfolio.

 Equity market neutral strategy

An extension of the equity market neutral strategy to other asset classes

A portfolio with a beta of zero, or zero systematic risk, is referred to as a zero-beta portfolio. A portfolio with a beta of zero would have an expected return equal to the risk-free rate. Given that its expected return is equal to the risk-free rate or is relatively low compared to portfolios with a higher beta. Such portfolio would have no correlation with market movements.

Since a zero-beta portfolio has no market exposure and would consequently underperform a diversified market portfolio, it is highly unlikely that investors will be interested in it during bull markets. During a bear market, it may garner some interest, but investors are likely to ask if investing in risk-free, short-term Treasuries is a better and less expensive alternative to a zero-beta portfolio.

For this example, we imagine the case of a portfolio manager wishing to invest 100M$ across a diversified portfolio, while holding a zero-beta portfolio with respect to a broad equity index benchmark. To recreate a diversified portfolio, we compiled a shortlist of trackers that would represent our investment universe. To maintain a balanced approach, we selected trackers that would represent the main asset classes: global stocks (VTI – Vanguard Total Stock Market ETF), bonds (IEF – iShares 7-10 Year Treasury Bond ETF and TLT – iShares 20+ Year Treasury Bond ETF), and commodities (DBC – Invesco DB Commodity Index Tracking Fund and GLD – SPDR Gold Shares).

To construct the zero-beta portfolio, we pulled a ten-year time series from Refinitiv Eikon and calculated the beta of each asset relative to the broad stock index benchmark (VTI tracker). The target weights to create a zero-beta portfolio are shown in Table 2. As captured by the target allocation in Table 2, we can clearly see an important weight for bonds of different maturities (56.7%), along with a 33.7% towards commodities and a small allocation towards global equity equivalent to 9.6% (because of the high beta value).

If the investment manager allocated capital in the following way, he would create a zero-beta portfolio with a beta of zero:

VTI: $9.69 million (9.69% of the portfolio; a weighted-beta of 0.097)
IEF: $18.99 million (18.99% of the portfolio; a weighted-beta of -0.029)
GLD: $18.12 million (18.12% of the portfolio; a weighted-beta of 0.005)
DBC: $15.5 million (15.50% of the portfolio; a weighted-beta of 0.070)
TLT: $37.7 million (37.7% of the portfolio; a weighted-beta of -0.143)

Table 2. Target weights to achieve a zero-beta portfolio.
Target weights to achieve a zero-beta portfolio Source: computation by the author. (Data: Reuters Eikon)

You can find below the Excel spreadsheet that complements the explanations about the zero beta portfolio.

Zero beta portfolio

Performance of the equity market neutral strategy

To capture the performance of the equity market neutral strategy, we use the Credit Suisse hedge fund strategy index. To establish a comparison between the performance of the global equity market and the equity market neutral strategy, we examine the rebased performance of the Credit Suisse managed futures index with respect to the MSCI All-World Index.

The equity market neutral strategy generated an annualized return of -0.18% with an annualized volatility of 7.5%, resulting in a Sharpe ratio of -0.053. During the same time period, the Credit Suisse Hedge Fund index had an annualized return of 4.34 percent with an annualized volatility of 5.64 percent, resulting in a Sharpe ratio of 0.174. With a neutral market beta exposure of 0.04, the results are consistent with the theory that this approach does not carry the equity risk premium. This aspect justifies the underperformance.

Figure 1 gives the performance of the equity market neutral funds (Credit Suisse Equity Market Neutral Index) compared to the hedge funds (Credit Suisse Hedge Fund index) and the world equity funds (MSCI All-World Index) for the period from July 2002 to April 2021.

Figure 1. Performance of the equity market neutral strategy.
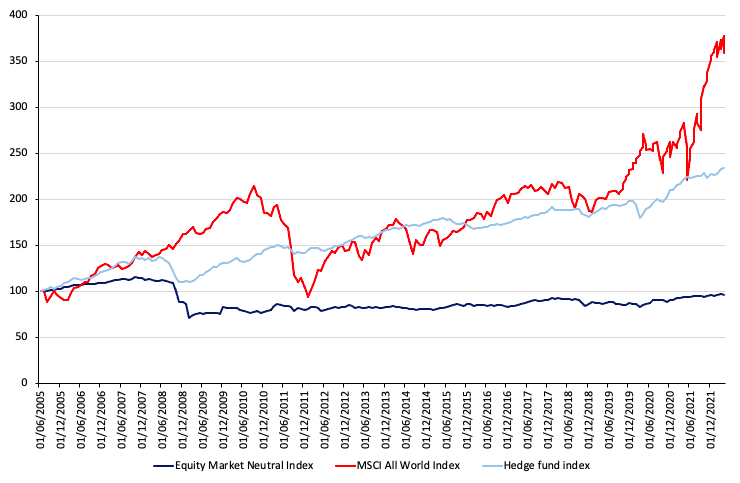
Performance of the equity market neutral strategy
Source: computation by the author (Data: Bloomberg)

You can find below the Excel spreadsheet that complements the explanations about the Credit Suisse equity market neutral strategy.

 Equity market neutral performance

Why should I be interested in this post?

Understanding the performance and risk of the equity market neutral strategy might assist investors in incorporating this hedge fund strategy into their portfolio allocation.

Related posts on the SimTrade blog

Hedge funds

   ▶ Youssef LOURAOUI Introduction to Hedge Funds

   ▶ Youssef LOURAOUI Global macro strategy

   ▶ Youssef LOURAOUI Long/short equity strategy

Financial techniques

   ▶ Youssef LOURAOUI Yield curve structure and interet rate calibration

   ▶ Akshit GUPTA Interest rate swaps

   ▶ Youssef LOURAOUI Portfolio

Useful resources

Academic research

Pedersen, L. H., 2015. Efficiently Inefficient: How Smart Money Invests and Market Prices Are Determined. Princeton University Press.

Business Analysis

Credit Suisse Hedge fund strategy

Credit Suisse Hedge fund performance

Credit Suisse Equity market neutral strategy

Credit Suisse Equity market neutral performance benchmark

About the author

The article was written in January 2023 by Youssef LOURAOUI (Bayes Business School, MSc. Energy, Trade & Finance, 2021-2022).

Global macro strategy

Youssef LOURAOUI

In this article, Youssef LOURAOUI (Bayes Business School, MSc. Energy, Trade & Finance, 2021-2022) presents the global macro equity strategy, one of the most widely known strategies in the hedge fund industry. The goal of the global macro strategy is to look for trends or disequilibrium in equity, bonds, currency or alternative assets based on broad economic data using a top-down approach.

This article is structured as follow: we introduce the global macro strategy principle. Then, we present a famous case study to grasp the overall methodology of this strategy. We conclude with a performance analysis of this strategy in comparison with a global benchmark (MSCI All World Index and the Credit Suisse Hedge Fund index).

Introduction

According to Credit Suisse, a global macro strategy can be defined as follows: “Global Macro funds focus on identifying extreme price valuations and leverage is often applied on the anticipated price movements in equity, currency, interest rate and commodity markets. Managers typically employ a top-down global approach to concentrate on forecasting how political trends and global macroeconomic events affect the valuation of financial instruments. Profits are made by correctly anticipating price movements in global markets and having the flexibility to use a broad investment mandate, with the ability to hold positions in practically any market with any instrument. These approaches may be systematic trend following models, or discretionary.”

This strategy can generate returns in both rising and falling markets. However, asset screening is of key concern, and the ability of the fund manager to capture the global macro picture that is driving all asset classes is what makes this strategy profitable (or not!).

The greatest trade in history

The greatest trade in history (before Michael Burry becomes famous for anticipating the Global financial crisis of 2008 linked to the US housing market) took place during the 1990’s when the UK was intending to join the Exchange Rate Mechanism (ERM) founded in 1979. This foreign exchange (FX) system involved eight countries with the intention to move towards a single currency (the Euro). The currencies of the countries involved would be adjustably pegged with a determined band in which they can fluctuate with respect to the Deutsche Mark (DEM), the currency of Germany considered as the reference of the ERM.

Later in 1992, the pace at which the countries adhering to the ERM mechanism were evolving at different rate of growth. The German government was in an intensive spending following the reunification of Berlin, with important stimulus from the German Central Bank to print more money. However, the German government was very keen on controlling inflation to satisfactory level, which was achieved by increasing interest rates in order to curb the inflationary pressure in the German economy.

In the United Kingdom (UK), another macroeconomic picture was taking place: there was a high unemployment coupled with already relatively high interest rates compared to other European economies. The Bank of England was put in a very tight spot because they were facing two main market scenarios:

  • To increase interest rates, which would worsen the economy and drive the UK into a recession
  • To devalue the British Pound (GBP) by defending actively in the FX market, which would cause the UK to leave the ERM mechanism.

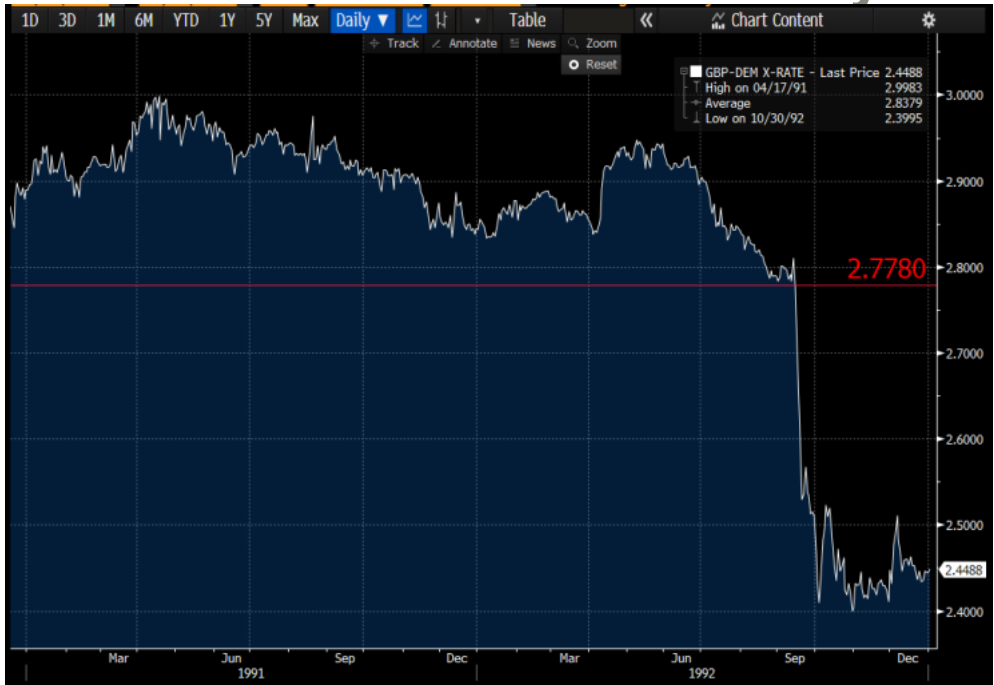
The Bank of England decided to go with the second option by defending the British Pound in the FX market by actively buying pounds. However, this strategy would not be sustainable over time. Soros (and other investors) had seen this disequilibrium and shorted British Pound and bought Deutsche Mark. The situation got completely off control for the Bank of England that in September 1992, they decided to increase interest rates, which were already at 10% to more than 15% to calm the selling pressure. Eventually, the following day, the Bank of England announced the exit of the UK from the ERM mechanism and put a hold on the increase of interest rate to the 12% until the economic conditions get better. Figure 1 gives the evolution of the exchange rate between the British Pound (GBP) and the Deutsche Mark (DEM) over the period 1991-1992.

Figure 1. Evolution of the GBP-DEM (British Pound / Deutsche Mark FX rate).
 Global macro performance
Source: Bloomberg.

It was reported that Soros amassed a position of $10 billion and gained a whopping $1 billion for this trade. This event put Soros in the scene as the “man who broke the Bank of England”. The good note about this market event is that the UK economy emerged much healthier than the European countries, with UK exports becoming much more competitive as a result of the pound devaluation, which led the Bank of England to cut rates cut down to the 5-6% level the years following the event, which ultimately helped the UK economy to get better.

Performance of the global macro strategy

Overall, the performance of the global macro funds between 1994-2020 was steady, with occasional large drawdowns (Asian crisis 1998, Dot-com bubble 2000’s, Great Financial Crisis of 2008, Covid-19 pandemic 2020). On a side note, the returns seem smaller and less volatile since 2000 onwards (Credit Suisse, 2022).

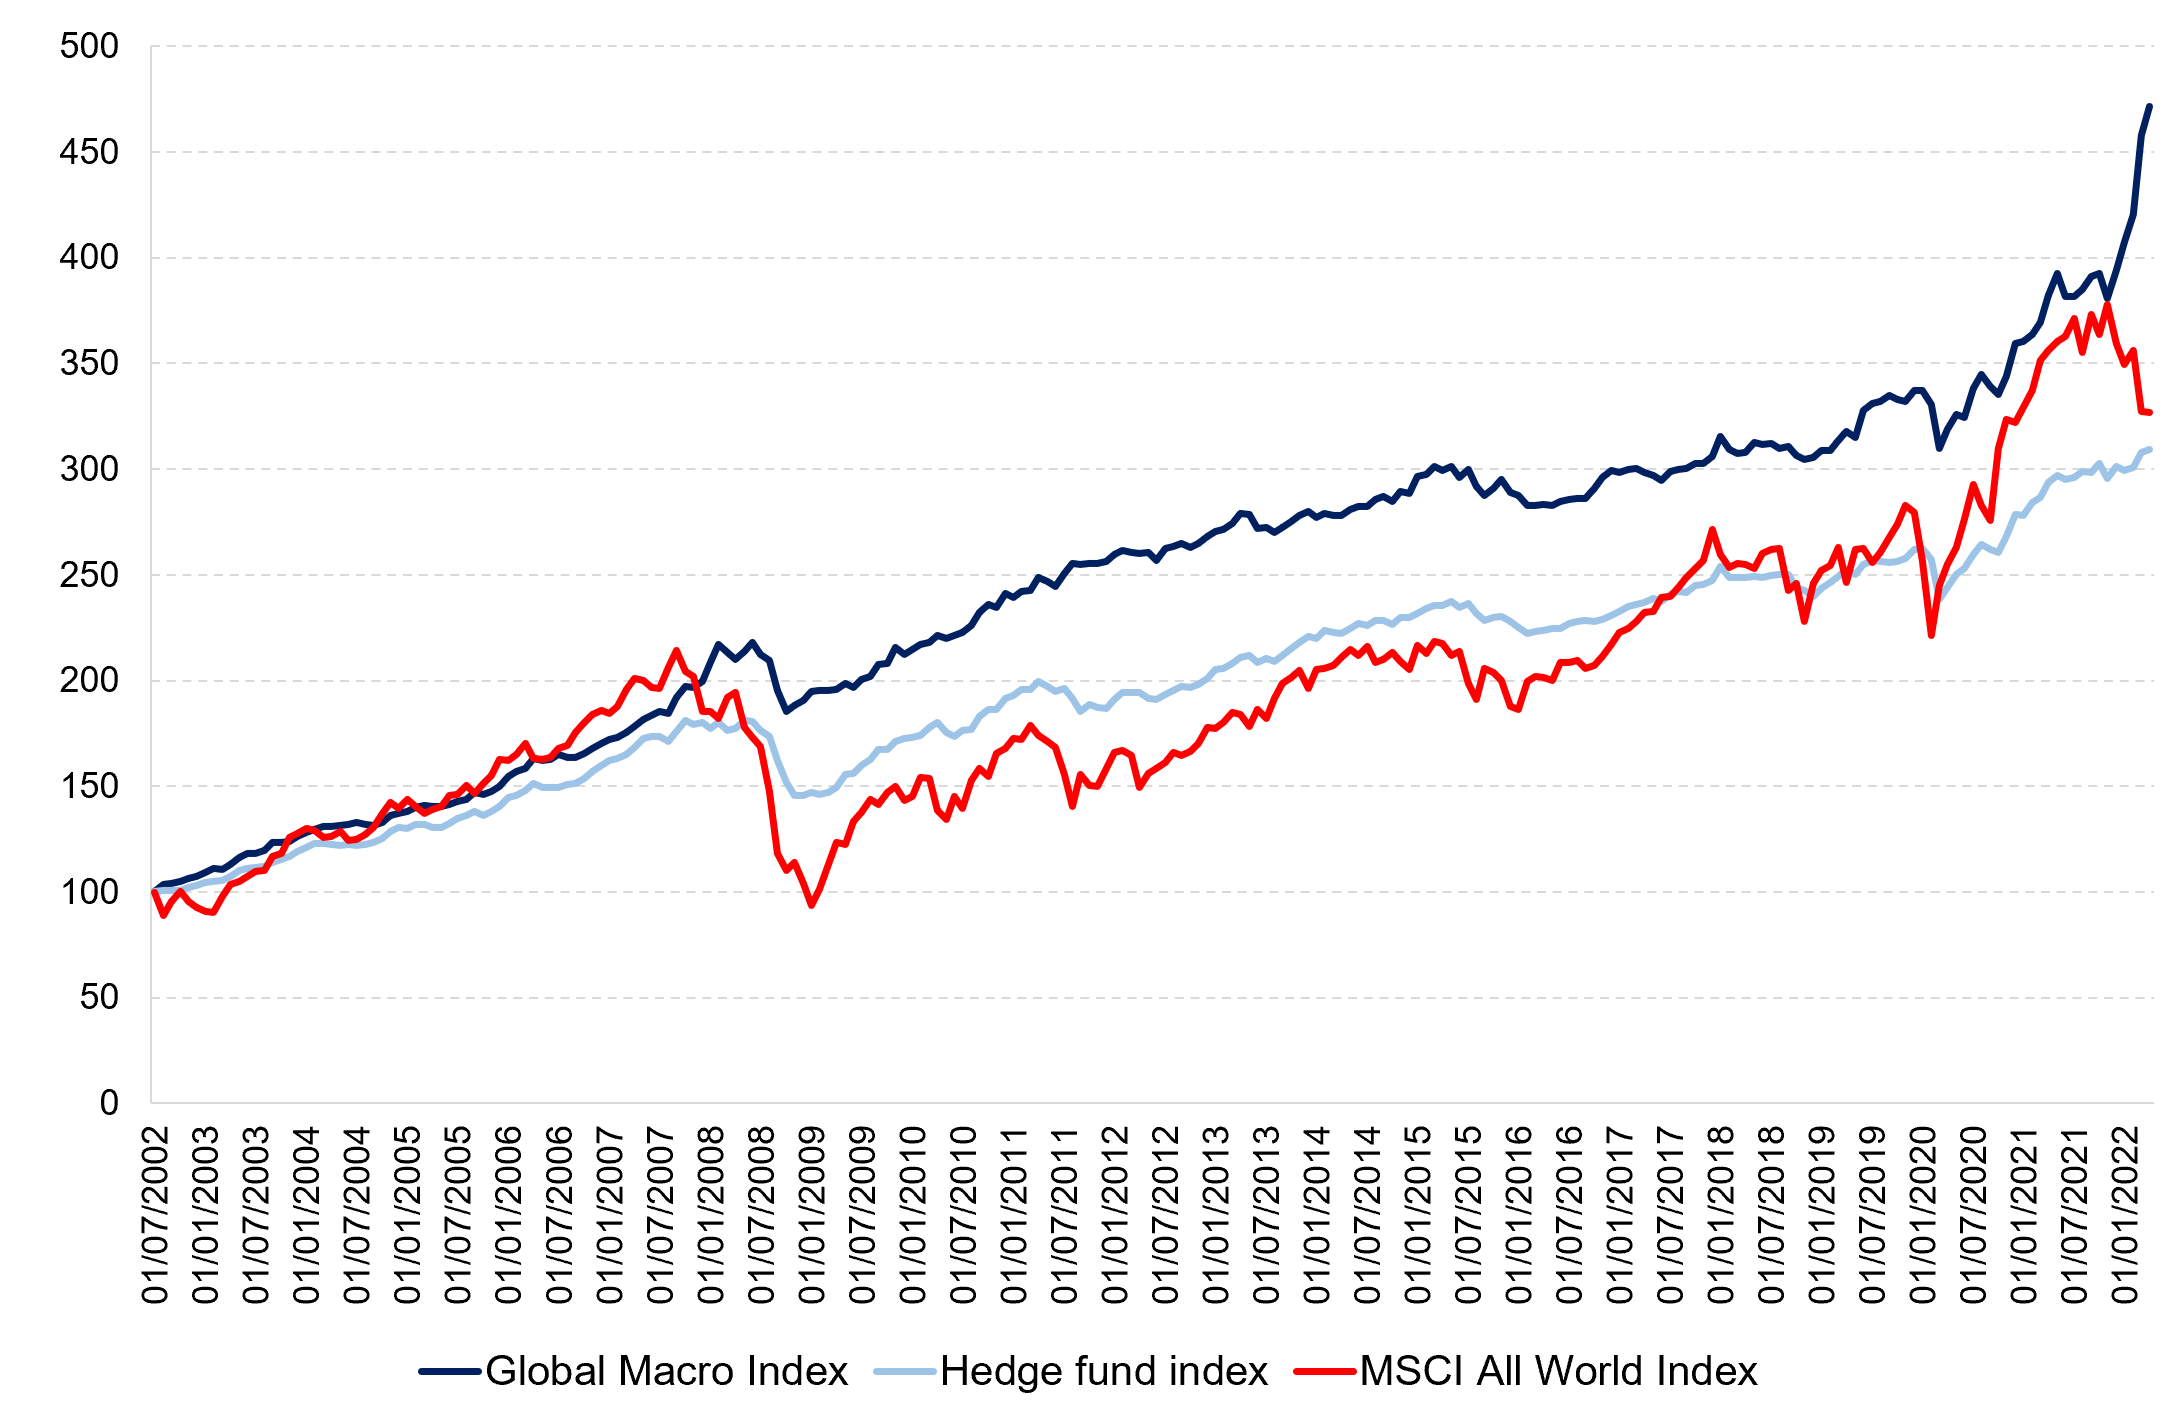
To capture the performance of the global macro strategy, we use the Credit Suisse hedge fund strategy index. To establish a comparison between the performance of the global equity market and the global macro hedge fund strategy, we examine the rebased performance of the Credit Suisse index with respect to the MSCI All-World Index. Over a period from 2002 to 2022, the global macro strategy index managed to generate an annualized return of 7.85% with an annualized volatility of 5.77%, leading to a Sharpe ratio of 0.33. Over the same period, the MSCI All World Index managed to generate an annualized return of 6.00% with an annualized volatility of 15.71%, leading to a Sharpe ratio of 0.08. The low correlation of the long-short equity strategy with the MSCI All World Index is equal to -0.02, which is close to zero. The results are in line with the idea of global diversification and decorrelation of returns derived from the global macro strategy from global equity returns. Overall, the Credit Suisse hedge fund strategy index performed better worse than the MSCI All World Index, leading to a higher Sharpe ratio (0.33 vs 0.08).

Figure 2 gives the performance of the global macro funds (Credit Suisse Global Macro Index) compared to the hedge funds (Credit Suisse Hedge Fund index) and the world equity funds (MSCI All-World Index) for the period from July 2002 to April 2021.

Figure 2. Performance of the global macro strategy.
Performance of the global macro strategy
Source: computation by the author (data: Bloomberg).

You can find below the Excel spreadsheet that complements the explanations about the global macro hedge fund strategy.

Global Macro

Why should I be interested in this post?

Global macro funds seek to profit from market dislocations across different asset classes. reduce negative risk while increasing market upside. They might, for example, invest in inexpensive assets that the fund managers believe will rise in price while simultaneously shorting overvalued assets to cut losses. Other strategies used by global macro funds to lessen market volatility can include leverage and derivatives. Understanding the profits and risks of such a strategy might assist investors in incorporating this hedge fund strategy into their portfolio allocation.

Related posts on the SimTrade blog

   ▶ Youssef LOURAOUI Introduction to Hedge Funds

   ▶ Akshit GUPTA Portrait of George Soros: a famous investor

   ▶ Youssef LOURAOUI Yield curve structure and interest rate calibration

   ▶ Youssef LOURAOUI Long/short equity strategy

   ▶ Youssef LOURAOUI Portfolio

Useful resources

Academic research

Pedersen, L. H., 2015. Efficiently Inefficient: How Smart Money Invests and Market Prices Are Determined. Princeton University Press.

Business Analysis

Credit Suisse Hedge fund strategy

Credit Suisse Hedge fund performance

Credit Suisse Global macro strategy

Credit Suisse Global macro performance benchmark

About the author

The article was written in January 2023 by Youssef LOURAOUI (Bayes Business School, MSc. Energy, Trade & Finance, 2021-2022).

Asset allocation techniques

Youssef LOURAOUI

In this article, Youssef LOURAOUI (Bayes Business School, MSc. Energy, Trade & Finance, 2021-2022) presents the concept of asset allocation, a pillar concept in portfolio management.

This article is structured as follows: we introduce the notion of asset allocation, and we use a practical example to illustrate this notion.

Introduction

An investment portfolio is a collection of assets that are owned by an investor. Individual assets, such as bonds and stocks, as well as asset baskets, such as mutual funds or exchange-traded funds, can be employed. When constructing a portfolio, investors often consider both the projected return and risk. A well-balanced portfolio includes a wide range of investments to benefit from diversification.

The asset allocation is one of the processes in the portfolio construction process. At this point, the investor (or fund manager) must divide the available capital into a number of assets that meet the criteria in terms of risk and return trade-off, while adhering to the investment policy, which specifies the amount of exposure an investor can have and the amount of risk the fund manager can hold in his or her portfolio.

The next phase in the process is to evaluate the risk and return characteristics of the various assets. The analyst develops economic and market expectations that can be used to develop a recommended asset allocation for the customer. The distribution of equities, fixed-income securities, and cash; sub asset classes, such as corporate and government bonds; and regional weightings within asset classes are all decisions that must be taken in the portfolio’s asset allocation. Real estate, commodities, hedge funds, and private equity are examples of alternative assets. Economists and market strategists may set the top-down view on economic conditions and broad market movements. The returns on various asset classes are likely to be altered by economic conditions; for example, equities may do well when economic growth has been surprisingly robust whereas bonds may do poorly if inflation soars. These situations will be forecasted by economists and strategists.

The top-down approach

A top-down approach begins with assessment of macroeconomic factors. The investor examines markets and sectors based on the existing and projected economic climate in order to invest in those that are predicted to perform well. Finally, funding is evaluated for specific companies within these categories.

The bottom up approach

A bottom-up approach focuses on company-specific variables such as management quality and business potential rather than economic cycles or industry analysis. It is less concerned with broad economic trends than top-down analysis is, and instead focuses on company particular.

Types of asset allocations

Arnott and Fabozzi (1992) divide asset allocation into three types: 1) policy asset allocation; 2) dynamic asset allocation; and 3) tactical asset allocation.

Policy asset allocation

The policy asset allocation decision is a long-term asset allocation decision in which the investor aims to assess a suitable long-term “normal” asset mix that represents an optimal mixture of controlled risk and enhanced return. The strategies that offer the best prospects of achieving strong long-term returns are inherently risky. The strategies that offer the greatest safety tend to offer very moderate return opportunities. The balancing of these opposing goals is known as policy asset allocation. The asset mix (i.e., the allocation among asset classes) is mechanistically altered in response to changing market conditions in dynamic asset allocation. Once the policy asset allocation has been established, the investor can focus on the possibility of active deviations from the regular asset mix established by policy. Assume the long-run asset mix is established to be 60% equities and 40% bonds. A variation from this mix under certain situations may be tolerated. A decision to diverge from this mix is generally referred to as tactical asset allocation if it is based on rigorous objective measurements of value. Tactical asset allocation does not consist of a single, well-defined strategy.

Dynamic asset allocation

The term “dynamic asset allocation” can refer to both long-term policy decisions and intermediate-term efforts to strategically position the portfolio to benefit from big market swings, as well as aggressive tactical strategies. As an investor’s risk expectations and tolerance for risk fluctuate, the normal or policy asset allocation may change. It is vital to understand what aspect of the asset allocation decision is being discussed and in what context the words “asset allocation” are being used when delving into asset allocation difficulties.

Tactical asset allocation

Tactical asset allocation broadly refers to active strategies that seek to enhance performance by opportunistically adjusting the asset mix of a port- folio in response to the changing patterns of reward available in the capi- tal markets. Notably, tactical asset allocation tends to refer to disciplined techniques for evaluating anticipated rates of return on various asset classes and constructing an asset allocation response intended to capture larger rewards.

Asset allocation application: an example

For this example, lets suppose the fictitious following scenario with real data involved:

Mr. Dubois recently sold his local home construction company in the south of France to a multinational homebuilder with a nationwide reach. He accepted a job as regional manager for that national homebuilder after selling his company. He is now thinking about the financial future for himself and his family. He is looking forward to his new job, where he enjoys his new role and where he will earn enough money to meet his family’s short- and medium-term liquidity demands. He feels strongly that he should not invest the profits of the sale of his company in real estate because his income currently rely on the state of the real estate market. He speaks with a financial adviser at his bank about how to invest his money so that he can retire comfortably in 20 years.

The initial portfolio objective they created seek a nominal return goal of 7% with a Sharpe ratio of at least 1 (for this example, we consider the risk-free rate to be equal to zero). The bank’s asset management division gives Mr Dubois and his adviser with the following data (Figure 1) on market expectations.

Figure 1. Risk, return and correlation estimates on market expectation.
 Time-series regression
Source: computation by the author (Data: Refinitiv Eikon).

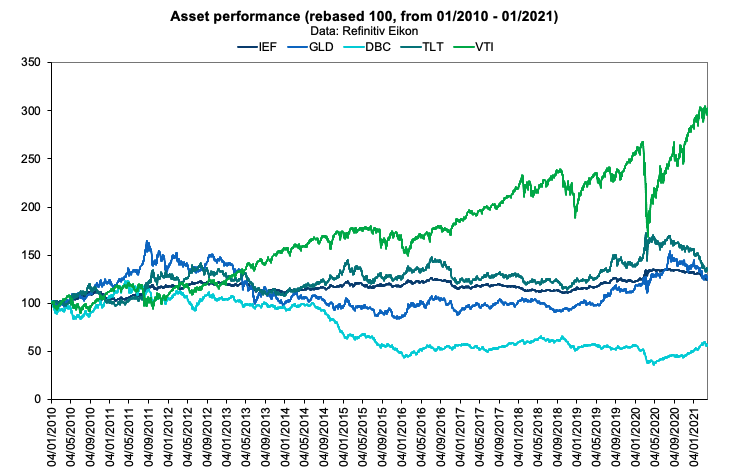
In order to replicate a global asset allocation approach, we shortlisted a number of trackers that would represent our investment universe. To keep a well-balanced approach, we took trackers that would represent the main asset classes: global equities (VTI – Vanguard Total Stock Market ETF), bonds (IEF – iShares 7-10 Year Treasury Bond ETF and TLT – iShares 20+ Year Treasury Bond ETF) and commodities (DBC – Invesco DB Commodity Index Tracking Fund and GLD – SPDR Gold Shares). To create the optimal asset allocation, we extracted the equivalent of a ten-year timeframe from Refinitiv Eikon to capture the overall performance of the portfolio in the long run. As captured in Figure 1, the global equities was the best performing asset class during the period covered (13.02% annualised return), followed by long term bond (4.78% annualised return) and by gold (4.65% annualised return).

Figure 2. Asset class performance (rebased to 100).
 Time-series regression
Source: computation by the author (Data: Refinitiv Eikon).

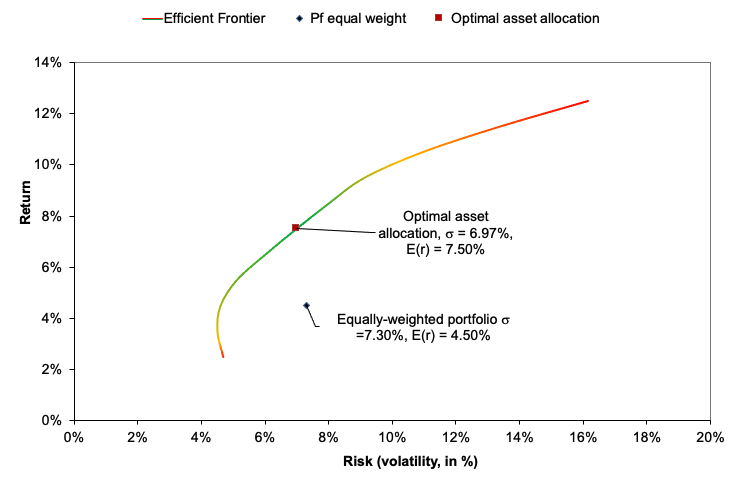
After analyzing the historical return on the assets retained, as well as their volatility and covariance (and correlation), we can apply Mean-Variance portfolio optimization to determine the optimal portfolio. The optimal asset allocation would be the end outcome of the optimization procedure. The optimal portfolio, according to Markowitz’ seminal study on portfolio construction, will seek to create the best risk-return trade-off for an investor. After performing the calculations, we notice that investing 42.15% in the VTI fund, 30.69% in the IEF fund, 24.88% in the TLT fund, and 2.28% in the GLD fund yields the best asset allocation. As reflected in this asset allocation, the investor intends to invest his assets in a mix of equities (about 43%) and bonds (approximately 55%), with a marginal position (around 3%) in gold, which is widely employed in portfolio management as an asset diversifier due to its correlation with other asset classes. As captured by this asset allocation, we can clearly see the defensive nature of this portfolio, which relies significantly on the bond part of the allocation to operate as a hedge while relying on the equities part as the main driver of returns.

As shown in Figure 3, the optimal asset allocation has a better Sharpe ratio (1.27 vs 0.62) and is captured farther along the efficient frontier line than a naive equally-weighted allocation . The only portfolio with the needed characteristics is the optimal one, as the investor’s goal was to attain a 7% projected return with a minimum Sharpe ratio of 1.

Figure 3. Optimal asset allocation and the Efficient Frontier plot.
 Time-series regression
Source: computation by the author (Data: Refinitiv Eikon).

Will this allocation, however, continue to perform well in the future? The market’s reliance on future expectations, return, volatility, and correlation predictions, as well as the market regime, will ultimately determine how much the performance predicted by this study will really change in the future.

Excel file for asset allocation

You can find below the Excel spreadsheet that complements the example above.

 Download the Excel file for asset allocation

Why should I be interested in this post?

The purpose of portfolio management is to maximize (expected) returns on the entire portfolio, not just on one or two stocks for a given level of risk. By monitoring and maintaining your investment portfolio, you can build a substantial amount of wealth for a variety of financial goals, such as retirement planning. This post facilitates comprehension of the fundamentals underlying portfolio construction and investing.

Related posts on the SimTrade blog

   ▶ Youssef LOURAOUI Markowitz Modern Portfolio Theory

   ▶ Youssef LOURAOUI Optimal portfolio

   ▶ Youssef LOURAOUI Portfolio

Useful resources

Academic research

Arnott, R. D., and F. J. Fabozzi. 1992. The many dimensions of the asset allocation decision. In Active asset allocation, edited by R. Arnott and F. J. Fabozzi. Chicago: Probus Publishing.

Fabozzi, F.J., 2009. Institutional Investment Management: Equity and Bond Portfolio Strategies and Applications. I (4-6). John Wiley and Sons Edition.

Pamela, D. and Fabozzi, F., 2010. The Basics of Finance: An Introduction to Financial Markets, Business Finance, and Portfolio Management. John Wiley and Sons Edition.

About the author

The article was written in December 2022 by Youssef LOURAOUI (Bayes Business School, MSc. Energy, Trade & Finance, 2021-2022).

Art as an asset class

Art as an asset class

Nakul Panjabi

In this article, Nakul PANJABI (ESSEC Business School, Grande Ecole Program – Master in Management, 2021-2024) talks about the Art as an asset class.

Before delving into the economics of the art market and art’s significance as an asset class, let us first recollect the definition of an asset and an asset class. An asset broadly refers to a resource from which future economic benefits are expected to flow. An asset class is a group of assets that have similar characteristics and related risk and return behavior. Common examples of asset class would be equities, fixed-income investments, and real estate.

Why have you not invested in art yet?

Although an age-old investment, art as an investment has been available to only a minority of investors most of whom are high-net-worth individuals (HNWI) or even ultra-high-net-worth individuals (UHNWI). The prime reason is that the market faces an inelastic supply. In simple terms, there are very few goods in market to be traded which leads to higher prices of each item and therefore, at equilibrium, only few people with such means could afford the good. This economic explanation of the art market would be enough if there were very few art items available to buy. However, as intuition might suggest, that is not the case. The world is filled with pieces of art and people who own it. Does this fact weaken our previous argument? The answer is simply No. Even though there are lots of art item and anyone with some spare money can buy a piece of art, almost none of those items would be classified as an asset. Art as an Asset class has an extremely limited supply. Only a few pieces of art are purchased as Asset.

Features of the Art Market

Besides limited supply and consequently higher prices, there are few other factors as well that makes art an interesting asset class. Firstly, the investable art items are highly illiquid. Selling a collectible art item is a time-consuming complex process. It requires dealers, auctions and most importantly potential buyers who could afford such an expensive item that provides no economic benefits except capital appreciation. As one might guess, there are only a handful of individuals in the world who own a 50-million-dollar painting.

Secondly, the supply of this asset class is not closely related to the cost of producing it. Most goods’ supply is based on the cost of producing them. For example, it is cheap to produce toothpaste, so it has an elastic supply. If there is a strike at a toothpaste factory, then there would be less people to make the toothpaste. This will increase the wages (cost of production) paid to them. Now fewer toothpastes would be produced at a higher price. This will make the supply of toothpaste relatively inelastic. However, this economic phenomenon seems to be missing in the art market. The supply of this asset class is highly inelastic but the goods that represent investable art are very cheap to produce. The low cost of production does not dictate the supply of collectible art. It is the rarity of these goods that cause such an inelastic supply. A lot of Investable art items are works of deceased artists. Although they probably were very cheap to produce, it is impossible to create more of them. The rarity of such items makes them so valuable.

Art has a very high maintenance cost and most of the art do not provide any recurring cashflows. One source of art cashflows is the income generated from renting art to museums. Because there is a limit to the number of paintings that can be displayed in museums, most of the return from art investments is generated through capital appreciation. However, as we discussed before, it is not so easy to sell a piece of art. Then, why would anyone, let alone the most sophisticated of investors, buy such an asset? Well, there are a lot of reason why one might invest in art.

Reasons to invest in the art market

Low correlation

Art has a low correlation with traditional asset class. Fluctuations in Apple’s stock price would probably have little effect on the price of an authentic Picasso painting. Thanks to this low correlation, a collectible painting can act as a hedge against inflation and market crashes. According to a 2022 Citibank report, art has either a weak positive correlation or zero correlation with other asset classes.

Tax Benefits

Given the fact that the value of investable art does not derive from either its future cashflows or its cost of production, it is relatively easier to manipulate its price than it is for other assets. Manipulating the price of an asset is extremely useful to manipulate income and consequently taxes.

Money laundering

Art Investments have also been used for money laundering. The logic is straightforward. A 50-million-dollar painting can be much easily hidden than cash or gold of similar value.

Status Symbol

Art is a very efficient status symbol. The rarity of the collectible art items makes owning them a source of prestige. If your friend owns one of the only five paintings created by a famous renaissance painter, you don’t need to be an expert in art to judge the economic worth of the painting or of your friend.

What Future looks like for the art market

According to the annual report by Art Basel and UBS Global Art, the worldwide art sales crossed $65.1 billion in 2021. This reflects a 29% increase from the previous year.

Moreover, with increase in the trend of NFT trading, millennials are more interested in (digital) art than ever. According to 2021 study by Art Basel and UBS Global Art, millennials were the highest spenders on fine art in 2020.

Now, with an increase in art investing funds, the barriers for art investing have also been reduced tremendously. People, who could not invest in art because of high capital requirement and lack of expertise, can now do so by investing in an art fund.

Why should I be interested in this post?

As an (wealthy) investor, art represents an asset class which is not highly correlated with traditional assets. It then can be useful for asset allocation in terms of diversification. When you think of your personal portfolio, you may think of art.

Related posts on the SimTrade blog

▶ Youssef LOURAOUI Portfolio

▶ Hélène VAGUET-AUBERT Private banking: evolving in a challenging environment

▶ Nakul PANJABI Charging Bull on Wall Street

About the author

The article was written in November 2022 by Nakul PANJABI (ESSEC Business School, Grande Ecole Program – Master in Management, 2021-2024).

Asset Allocation

Asset Allocation

Akshit Gupta

This article written by Akshit GUPTA (ESSEC Business School, Grande Ecole Program – Master in Management, 2019-2022) explains asset allocation, a much-discussed topic in asset management.

Introduction

Asset allocation refers to the process of dividing an investment among different assets and, at a more integrated level, asset classes, sectors of the economy and geographical areas.

The allocation of an investor’s money across different assets can be analyzed according to different dimensions: investment objective, risk profile, and time horizon. The allocation process helps in finding a right balance between these dimensions and ultimately generates optimal returns in terms of expected return and risk. A key concept underlying asset allocation is diversification.

There are several assets in financial markets that the investor can use in his/her asset allocation. These asset classes include traditional assets like equities, bonds and cash, and alternative assets like real estates, commodities, and cryptocurrencies. Investors may also use combinations of such basic assets like mutual funds, exchange trade funds and more complex products like structured products.

Basics of asset allocation

Characteristics of investors

The characteristics of asset allocation for investors comes from its significant impact on the portfolio performance. Asset allocation decisions rely on input of the process: investment objective, risk profile, and time horizon.

Investment objective

The process of asset allocation impacts the financial objectives of the investor. If the investor has a low-risk appetite, he/she might be exposed to high degree of risk by investing in equities. Thus, such an investor should invest in safer assets such as bonds and fixed deposits to have a low-risk portfolio.

Risk Profile

The risk appetite of an investor determines the mix of different asset classes in a portfolio. Investors aiming for low risk should include a comparatively higher mix of risk less assets like bonds and real estate than equities.

Time horizon

The time horizon of an investment is also an important characteristic of the asset allocation process. Investors can either invest for a long-term time horizon or a short term depending on their investment objective.

Characteristics of assets

The characteristics of asset allocation comes from its significant impact on the portfolio performance. Asset allocation decisions can also rely on asset’s features such as: Expected returns, risk, and correlation.

Expected returns

The main focus of any investment in financial markets is to make maximum profits (returns) within a coherent risk level. Different asset classes have traditionally offered different returns, determined by their risk levels and market correlation. Generally, bonds have offered a lower long-term return as compared to the equity markets. Thus, investors aiming for higher returns should include an higher mix of these high return asset classes like equities than bonds.

Risk

Different asset classes have different characteristics and thus, different risk levels. The bonds market is generally considered less risky as compared to the equity markets. Thus, investment in bonds exposes the investor to a lower degree of risk than investing in equities.

Correlation

Different asset classes differ in their correlation which is also an important factor while deciding the optimal portfolio mix. It is possible that one asset class might be increasing in value whereas the other may be decreasing in value. For example, if the bonds markets are trending upwards, it is possible that the equity markets might be falling. Thus, by having an optimal mix of these asset, the investor can be compensated for the losses in equity markets with gains in the bond markets. Degree of correlation plays an important role in protecting the investor from downfalls in one asset class by compensating the losses with gains in other asset class.

Asset allocation processes

The asset allocation processes can be divided into two types: strategic asset allocation and tactical asset allocation.

Strategic asset allocation

Strategic asset allocation is a long-term investment strategy driven by long term market outlook and fundamental trends in the market. The strategy follows a top-down approach, and the investor generally looks at the macro level trends followed by trends in different asset classes to take the investment decisions. The investor following this allocation type generally has a pre-defined return expectation and risk tolerance levels and practices diversification to lower the risk. These investments are made in traditional assets like equities, bonds and cash assets but can also include alternative assets.

The investor follows a fixed objective which remains unchanged throughout the investment horizon. This can include a policy mix of investing 40% of portfolio in equities, 30% in bonds, 10% in real estate and remaining 20% in cash. As opposed to the tactical asset allocation, strategic asset allocation involves periodical rebalancing of the portfolio to get higher returns. If the investor diverges from the fixed objective, he/she must rebalance the portfolio to unify it with the original mix.

This strategy is suited to new or irregular investors who seek to generate returns at par with the market returns. The standard asset class suited for this strategy includes mutual funds, ETFs, blue-chip equities, bonds, fixed deposits, and real estate.

Tactical asset allocation

Tactical asset allocation involves actively investing in asset and securities to enhance portfolio returns by constantly rebalancing the portfolio and exploiting market anomalies. Even though the investor is following strategic asset allocation, the financial markets often present attractive buying or selling opportunities which can be exploited by tactical asset allocation to attain even higher returns. These opportunities can involve cyclical deviations in businesses, momentum trends and exploiting under valuations. However, these deviations from strategic allocation are often done carefully so as not to hinder the long-term objective.

The investment horizon in this strategy can be short or long depending on the investor’s preferences. However, the investor tries to generate higher returns and constantly rebalances the portfolio to achieve these returns by exploiting the market inefficiencies. Tactical asset allocation requires good understanding of the financial markets and is generally practiced by experienced investors with moderate to high risk tolerance.

Asset allocation over time

The investors deciding on the asset allocation process over time can follow different approaches, which includes:

Passive management: the buy-and-hold approach

In a passive asset management, the aim of the investor is to replicate the performance of a benchmark index. These investors can have lower risk appetite; thus, replications help to reduce the risk exposure for them. The investors following a passive approach can buy the individual components of the index by applying similar weights and invest with a moderate to long term time horizon in mind. The suitable asset classes for such investors can include mutual funds, exchange traded funds, index funds, etc.

Active management: dynamic asset allocation

In active asset management, the aim of the investor is to maximize the returns on the portfolio by actively investing in asset classes. The portfolio mix is frequently adjusted to capitalize on the short-term trends across different asset classes. The rebalancing decisions are based on business and economic cycles, momentum trends, relative valuations across different asset classes and macro factors like inflation, GDP growth, etc. The investor tries to beat the benchmark indices by dynamically trading in different asset classes and exploiting the market inefficiencies. They generally have high risk appetite and good knowledge about different asset classes. The suitable asset classes for such investors can include equities, commodities, and bonds.

Useful resources

US Securities and Exchange Commission (SEC) Asset Allocation

Related Posts

   ▶ Youssef LOURAOUI Systematic risk and specific risk

   ▶ Youssef LOURAOUI Portfolio

About the author

Article written in July 2022 by Akshit GUPTA (ESSEC Business School, Grande Ecole Program – Master in Management, 2019-2022).

My experience as a junior financial analyst at ACE

My experience as a junior financial analyst at ACE

William LONGIN

In this article, William LONGIN (EDHEC Business School, Global BBA, 2020-2024) shares his experience as a junior financial analyst at ACE Finance et Conseil, which is a wealth management firm specialized in financial investments.

ACE Finance et Conseil

First, let me present ACE Finance et Conseil. It is a wealth management firm created by Gabriel Eschbach in 2002. It is located in Strasbourg in the East of France. ACE Finance et Conseil currently manages a portfolio of 230 clients who are individual investors. The profile of these investors varies in terms of wealth and investment objectives. Most of the clients of ACE Finance et Conseil are living in the East of France, especially in the Strasbourg area. The ambition of the company is to expand its base of clients at the national and even international level.

Logo of ACE Finance et Conseil.
Logo of ACE Finance et Conseil
Source: ACE Finance et Conseil.

The founder of the company, Gabriel Eschbach, is a graduate student from the University of Strasbourg. Gabriel also attended a program in wealth management at ESSEC Business School. Building on his past professional experience in large financial institutions and insurance companies, he has developed extensive skills and knowledge on financial markets and asset management.

My personal experience at ACE Finance et Conseil

My job was to find relevant information on the firms of interest for ACE. To find such information, I used the Bloomberg Terminal. Beyond the search of information about companies, I also spent time on building a portfolio based on our current knowledge of the market conditions. During my internship, the stock market was bullish (Summer 2021). ACE’s strategy was to find the most interesting stocks based on the risk level that the firm was willing to take on behalf of its clients.

Bloomberg – Terminal and keyboard
Bloomberg terminal and keyboard
Source: Bloomberg.

My most valuable experience in the firm was to be able to understand the investment philosophy of the firm, which relied on a rigorous analysis of the relationship between risk and (expected) return on the one hand, and on a clear understanding of the investors profile of its clients on the other hand.

Everything is planned! And what I came to realize is that investing has nothing to do with gambling. No technical analysis, no gibberish, only careful analysis of companies through the fundamental analysis of their financial accounts (balance sheet and income statement), financial ratios and company news. As we are unable to predict the future, ACE has an investment philosophy based on the rigorous investment process combining the analysis of the relationship between risk and (expected) return of financial assets and a clear understanding of the risk profile of its clients on the other hand.

The ACE Finance Conseil team.
The ACE Finance Conseil team
Source: ACE Finance et Conseil.

Core missions and duties

During my internship I had to do research on companies and create short presentations for ACE clients. For example, I prepared presentations on Chinese companies for a new client who was not familiar with the Chinese stock market. The Chinese companies involved were the so-called BATX that stands for Baidu, Alibaba, Tencent and Xiaomi. My presentations’ focus was on Tencent and Alibaba, two companies that stroked our interest at that time. The Bloomberg Terminal gave information about the profits made by each business units of the company, and its future estimates. Unlike other sources of information, Bloomberg standardizes information about the different drivers that generate revenue in a company. This gives an excellent overview of the current state of the company in addition to the existing important financial indicators such as the P/E and EPS ratios, the working capital, and the quick ratio (these financial indicators are defined below).

At ACE everyday was a different day, I had many types of missions. Every morning, I prepared a morning briefing. This allowed me to learn many things on the link between political news and companies. I really enjoyed the diversified aspect in my work, and I hope to find a job where I can thrive the same way I did at ACE Finance et Conseil.

About the skills and knowledge

For this type of internship, the prerequisites were to know how to read financial statements as well as knowing what the key financial indicators are, how they are calculated, and how they can be interpreted. Being able to browse the internet with ease and to be familiar with financial tools like the Bloomberg Terminal were important to be efficient in the job. Have an interest in the geopolitical field was an advantage to be able to interpret the news and extract the important information that would affect the economic world and the value of companies.

At ACE I understood that there is a whole other side to the iceberg, companies that are focused on b2b sales (business to business) that play a major role in the economy. These companies in the shadows are mostly part of a supply chain for major b2c (business to consumer) whose brand is known by the public. b2b businesses rarely make it on to the front pages of mainstream news medias but a lot of information is available on media for investors.

Unfamiliar with the region of the East of France I learned many things on the culture and way of living in an anchored European city. Strasbourg is considered as a capital of Europe as it hosts major European institutions such as the European Parliament and the Council of Europe. Because of its ties to both Germany and France after World War II, Strasbourg served as a symbol of reconciliation between peoples.

Key concepts

I present below some key concepts that are useful to understand the internship that I did at ACE Finance et Conseil.

Asset management

Asset management consists in managing capital in the best way by respecting the level risk decided to be taken by the manager, with respect to an estimated rate of return. The responsibility of asset management’s firm is to know how to invest and manage assets correctly and accurately.

ACE Finance provides private investors with more comprehensive advice as part of their investment advisory services and fully documents discussions. The objective is to create transparency regarding the costs and risks associated with their investments. With ACE, clients can module their portfolios and are able to express their preferences after receiving advise from the firm based on fundamental research.

Asset allocation

Asset allocation is a step-in asset management which consists in defining the weight to be given to each category of assets within an investment portfolio. Allocation is generally made by sector (cyclical, defensive, sensitive), by profile (growth, value), by geography and/or by asset class (equities, bonds, real estate, commodities, etc.)

In determining the best asset allocation, the key is to be able to balance between the expected return on assets and the riskiness associated with each of them. Asset allocation depends on the time the investor is intending to invest his/her assets, his/her tolerance for risk and the volatility of the various assets.

As mentioned earlier ACE accompanies clients in their investment and gives them the opportunity to have a say on the way of allocating assets. The level of risk, the geographical or sectoral distribution of the portfolios and the type of products used, or the time horizon of the investments is different specific to each client.

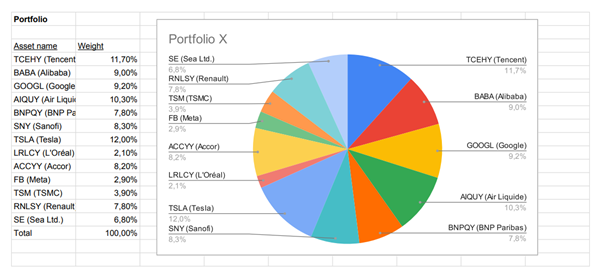
Example of equity portfolio.
 Example of equity portfolio
Source: ACE Finance et Conseil.

Active and passive asset allocation

There are two types of asset allocation management styles: passive and active. Passive management is management based on a buy-and-hold strategy. Active management is based on rebalancing of the portfolio via discretionary decisions or decisions based on quantitative models. Stock picking and market timing are key to a successful active management.

ACE is mostly focused on active management of assets. The goal in active management of assets is to be able “beat the market”, the benchmark. The work done by ACE is to select the assets, using various analysis tools, the mostly likely assets that are likely to grow faster than the benchmark and market in general. This management method, as opposed to passive management, concerns all funds and portfolios that do not aim to reproduce the performance of a reference market, but to do better than the reference market.

Stock picking

Stock picking is a methodic process were an investor searches for stocks that are likely to bring future cash flows. The analyst’s or investor’s view for the price of the stock will determine whether the position is long or short.

When it comes to stock picking ACE does research on various companies and keeps track of the news. The financial statements (balance sheet, income statement and cash flow statement) with the focus on key business indicators (sales and profits) are important to understand the structural investments in the company. ACE also pays great attention to key financial ratios such as: P/E, EPS, working capital, quick ratio, and the EBITDA.

ACE also has partner companies such as JP Morgan and Gemway Equity that collaborate with ACE in this process. Getting insight and trying to understand other people point of view is part of the culture at ACE and how it has done so well for these past 20 years.

Financial indicators

EPS ratio

The Earnings Per Share (EPS) ratio is a financial ratio that shows the amount of net profit that a stock can generate. To calculate the EPS, we divide the total earnings (net income) of the company by the number of outstanding shares issued by the company (or average of outstanding shares).

Earnings per share formula

Note that if the company issued common and preferred shares, the EPS ratio is adjusted to take into account the preferred dividends. The EPS can be positive or negative based on the positive or negative earnings (profits or loss). In case of a negative EPS the company in question does not present a profitable overall activity. However, having a negative EPS is not as rare as you might think. As firms are not always making a profit due to heavy investment (start-ups for example). A company which presents a very fluctuating EPS from one year to another or an EPS which does not stop decreasing from year to year, could cause the downfall of the stock price.

At ACE, the EPS is a ratio that we looked at as an indicator of where the wind was blowing but did not base our decisions uniquely on this ratio since it does not look at the investments made by the firm that could generate important future cash flows.

P/E ratio

The price to earnings ratio (P/E or PER) is an indicator used in stock market analysis. The calculation of PER is very straightforward, divide the market capitalization by the net earnings or by dividing the market price of a share by the earnings er share (EPS). Another way of calculating it is by dividing the individual price of a share by the net income per share. You can calculate PER based on quarterly and yearly results and even projected results which would give the expected PER ratio.

Price earnings ratio (PER)

The PER represents the number of years it would take for a company to buy all its stocks. For example, a PER of 20 means that a company would take 20 years to “redeem” all its floating capital with constant profits.

This indicator can be used to evaluate a company to its competitors despite their differences in size as it looks at firm valuation according to their profits. A lower PER indicates a cheap stock, a higher PER an expensive stock.

Analysts may consider two types of PER: the trailing PER and forward PER. Simply put, the trailing PER looks at historical earnings to calculate PER. The forward PER considers expected earnings.

Bloomberg Terminal – Relative value function (RV) – Baidu – 14.06.2021
 Bloomberg RV function
Source: Bloomberg.

The RV function on the Bloomberg Terminal gives us indications on the relative value of the firm. At ACE when doing some research on Baidu, the PER was one of lowest amongst its competitors. The value of the PER is important as it reflects investors’ expectations. Thus, the PER can reveal the speculations of investors, who anticipate a strong increase in future profits: in which case, the higher the PER, the greater the expected increase in profits. So it is important to monitor and the progress of the PER.

Working capital

Working capital is an accounting concept which represents the amount the business has available to pay total operating expenses such as suppliers and employees. This indicator gives information on the company’s ability to cover its expenses.

Working capital

Quick ratio or Acid test

The quick ratio, or acidity test, is used to determine short-term liquidity in a company. To calculate this ratio, the value of the company’s current assets, excluding inventory, is divided by the company’s current liabilities (see formula). The goal of an acid test is to estimate the financial stability of a firm by measuring the company’s ability to immediately pay its debts using cash.

Acid test ratio

Assets used to calculate the quick ratio include cash and other very liquid assets such as marketable securities and accounts receivables. Inventory is also excluded from the quick ratio formula because it cannot be sold immediately to generate cash flow.

EBITDA

EBITDA (earnings before interest, taxes, depreciation, and amortization) is an indicator that is used to compare companies on their potential ability to generate wealth regardless of the balance sheet differences. EBITDA does not consider the investment and financing policy and the impact of taxes. On the contrary, a negative EBITDA means that the company is not profitable. The EBITDA is computed as follows:

EBITDA

EBITDA is a financial indicator that measures a company’s revenue before subtracting interest, taxes, depreciation and amortization charges and provisions on fixed assets.

Why should you be interested in this post?

If you are looking at getting an internship in an investment firm, this post will surely be interesting to you. This post provides a little reminder of the basics of asset management. There are plenty of investment firms in the world however ACE is unique by its approach to understanding the markets and counselling its clients. In this post I detail some of the core missions that I had as a newcomer to the professional investing field.

Word of conclusion

As my first internship inside of an asset management firm, this initiation to the financial world was exactly what I was looking for before applying at ACE Finance et Conseil. ACE Finance et Conseil differentiates itself from other companies by its simplicity in functioning and the richness of its experience. This unique experience has made me want to explore the financial world even more.

Related posts on the SimTrade blog

   ▶ All posts about Professional experiences

   ▶ Alexandre VERLET Classic brain teasers from real-life interviews

   ▶ William LONGIN How to compute the present value of an asset?

Useful resources

ACE Finance et Conseil

Bloomberg terminal

Bloomberg market concepts

About the author

Article written in March 2022 by William LONGIN (EDHEC Business School, Global BBA, 2020-2024).

Implementing Markowitz asset allocation model

Youssef_Louraoui

In this article, Youssef LOURAOUI (Bayes Business School, MSc. Energy, Trade & Finance, 2021-2022) explains how to implement the Markowitz asset allocation model. This model is used to determine optimal asset portfolios based on the risk-return trade-off.

This article follows the following structure: first, we introduce the Markowitz model. We then present the mathematical foundations of this model. We conclude with an explanation of the methodology to build the spreadsheet with the results obtained. You will find in this post an Excel spreadsheet which implements the Markowitz asset allocation model.

Introduction

Markowitz’s work is widely regarded as a pioneer work in financial economics and corporate finance due to its theoretical foundations and applicability in the financial sector. Harry Markowitz received the Nobel Prize in 1990 for his contributions to these disciplines, which he outlined in his 1952 article “Portfolio Selection” published in The Journal of Finance. His major work established the foundation for what is now commonly referred to as “Modern Portfolio Theory” (MPT).

To find the portfolio’s minimal variance, the Markowitz model uses a constrained optimization strategy. The goal of the Markowitz model is to take into account the expected return and volatility of the assets in the investable universe to provide an optimal weight vector that indicates the best allocation for a given level of expected return or the best allocation for a given level of volatility. The expected return, volatility (standard deviation of expected return), and the variance-covariance matrix to reflect the co-movement of each asset in the overall portfolio design are the major inputs for this portfolio allocation model for an n-asset portfolio. We’ll go over how to use this complex method to find the best portfolio weights in the next sections.

Mathematical foundations

The investment universe is composed of N assets characterized by their expected returns μ and variance-covariance matrix V. For a given level of expected return μP, the Markowitz model gives the composition of the optimal portfolio. The vector of weights of the optimal portfolio is given by the following formula:

img_SimTrade_implementing_Markowitz_1

With the following notations:

  • wP = vector of asset weights of the portfolio
  • μP = desired level of expected return
  • e = identity vector
  • μ = vector of expected returns
  • V = variance-covariance matrix of returns
  • V-1 = inverse of the variance-covariance matrix
  • t = transpose operation for vectors and matrices

A, B and C are intermediate parameters computed below:

img_SimTrade_implementing_Markowitz_2

The variance of the optimal portfolio is computed as follows

img_SimTrade_implementing_Markowitz_3

To calculate the standard deviation of the optimal portfolio, we take the square root of the variance.

Implementation of the Markowitz asset allocation model in practice

We generated a large time series to obtain useful results by downloading the equivalent of 23 years of market data from a data provider (in this example, Bloomberg). We generate the variance-covariance matrix after obtaining all necessary statistical data, which includes the expected return and volatility indicated by the standard deviation of the returns for each stock during the provided period. Table 1 depicts the expected return and volatility for each stock retained in this analysis.

Table 1. Asset characteristics of Apple, Amazon, Microsoft, Goldman Sachs, and Pfizer.
img_SimTrade_implementing_Markowitz_spreadsheet_1
Source: computation by the author.

We use the data analysis tool pack supplied in Excel to run a variance-covariance matrix for ease of computation (Table 2).

Table 2. Variance-covariance matrix of asset returns.
img_SimTrade_implementing_Markowitz_spreadsheet_4
Source: computation by the author.

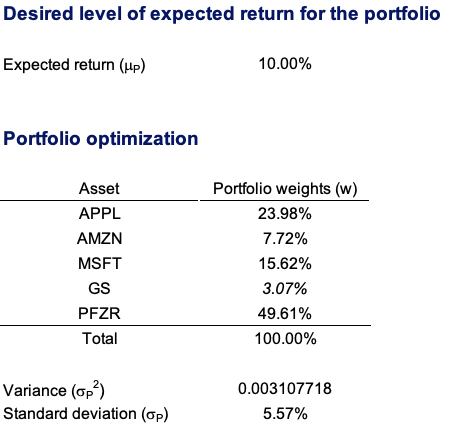
We can start the optimization task by setting a desirable expected return after computing the expected return, volatility, and the variance-covariance matrix of expected return. With the data that is fed into the appropriate cells, the model will complete the optimization task. For a 10% desired expected return, we get the following results (Table 3).

Table 3. Asset weights for an optimal portfolio.
img_SimTrade_implementing_Markowitz_spreadsheet_2
Source: computation by the author.

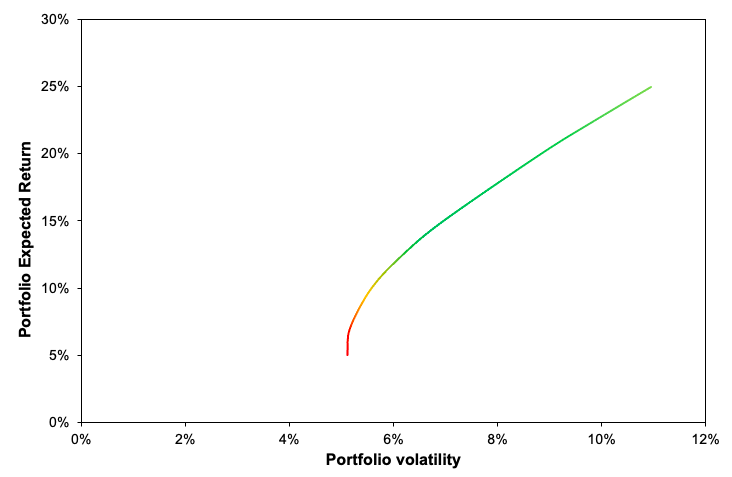
To demonstrate the effect of diversification in the reduction of volatility, we can form a Markowitz efficient frontier by tilting the desired anticipated return with their relative volatility in a graph. The Markowitz efficient frontier is depicted in Figure 1 for various levels of expected return (Figure 1).

Figure 1. Markowitz efficient portfolio frontier.
img_SimTrade_implementing_Markowitz_spreadsheet_3
Source: computation by the author.

You can download the Excel file below to use the Markowitz portfolio allocation model.

 Download the Excel file for the Markowitz portfolio allocation model

Why should I be interested in this post?

Modern Portfolio Theory (MPT) is at the heart of modern finance, shaping the modern investing landscape. MPT has become the cornerstone of current financial theory and practice. MPT has been around for nearly sixty years and shows no signs of slowing down. His theoretical contributions paved the way for more portfolio theories. This post helps you to grasp the theoretical model and its implementation.

Related posts on the SimTrade blog

   ▶ Youssef LOURAOUI Markowitz Modern Portfolio Theory

   ▶ Youssef LOURAOUI Portfolio

   ▶ Jayati WALIA Capital Asset Pricing Model (CAPM)

   ▶ Youssef LOURAOUI Black-Litterman Model

   ▶ Youssef LOURAOUI Origin of factor investing

   ▶ Youssef LOURAOUI Alpha

   ▶ Youssef LOURAOUI Factor Investing

Useful resources

Academic research

Petters, A. O., and Dong, X. 2016. An Introduction to Mathematical Finance and Applications. Springer Undergraduate Texts in Mathematics and Technology.

Markowitz, H., 1952. Portfolio Selection. The Journal of Finance, 7(1): 77-91.

About the author

The article was written in Mars 2022 by Youssef LOURAOUI (Bayes Business School, MSc. Energy, Trade & Finance, 2021-2022).