Dedicated short bias strategy

Youssef LOURAOUI

In this article, Youssef LOURAOUI (Bayes Business School, MSc. Energy, Trade & Finance, 2021-2022) presents the dedicated short bias strategy. The strategy holds a net short position, which implies more shorts (selling) than long (buying) positions. The objective of the dedicated bias strategy is to profit from shorting overvalued equities.

This article is structured as follow: we introduce the dedicated short bias strategy. Then, we present a practical case study to grasp the overall methodology of this strategy. We also present a performance analysis of this strategy and compare it a benchmark representing all hedge fund strategies (Credit Suisse Hedge Fund index) and a benchmark for the global equity market (MSCI All World Index).

Introduction

According to Credit Suisse (a financial institution publishing hedge fund indexes), a dedicated short bias strategy can be defined as follows: “Dedicated Short Bias funds take more short positions than long positions and earn returns by maintaining net short exposure in long and short equities. Detailed individual company research typically forms the core alpha generation driver of dedicated short bias managers, and a focus on companies with weak cash flow generation is common. To affect the short sale, the manager borrows the stock from a counter-party and sells it in the market. Short positions are sometimes implemented by selling forward. Risk management consists of offsetting long positions and stop-loss strategies”.

This strategy makes money by short selling overvalued equities. The strategy can potentially generate returns in falling markets but would underperform in rising equity market. The interesting characteristic of this strategy is that it can potentially offer to investors the added diversification by being non correlated with equity market returns.

Example of the dedicated short bias strategy

Jim Chanos (Kynikos Associates) short selling trade: Enron

In 2000, Enron dominated the raw material and energy industries. Kenneth Lay and Jeffrey Skilling were the two leaders of the group that disguised the company’s financial accounts for years. Enron’s directors, for instance, hid interminable debts in subsidiaries in order to create the appearance of a healthy parent company whose obligations were extremely limited because they were buried in the subsidiary accounts. Enron filed for bankruptcy on December 2, 2001, sparking a big scandal, pulling down the pension funds intended for the retirement of its employees, who were all laid off simultaneously. Arthur Andersen, Enron’s auditor, failed to detect the scandal, and the scandal ultimately led to the dissolution of one of the five largest accounting and audit firms in the world (restructuring the sector from the Big 5 to the Big 4). Figure 1 represents the share price of Enron across time.

Figure 1. Performance Enron across time.
img_SimTrade_Enron_performance
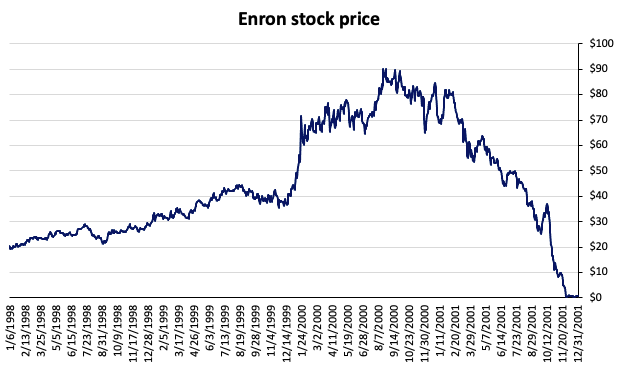
Source: Computation by the author

Fortune magazine awarded Enron Corporation “America’s Most Innovative Company” annually from 1996 to 2000. Enron Corporation was a supposedly extremely profitable energy and commodities company. At the beginning of 2001, Enron had around 20,000 employees and a market valuation of $60 billion, approximately 70 times its earnings.

Short seller James Chanos gained notoriety for identifying Enron’s problems early on. This trade was dubbed “the market call of the decade, if not the past fifty years” (Pederssen, 2015).

Risk of the dedicated short bias strategy

The most significant risk that can make this strategy loose money is a short squeeze. A short seller can borrow shares through a margin account if he/she believes a stock is overvalued and its price is expected to decline. The short seller will then sell the stock and deposit the money into his/her margin account as collateral. The seller will eventually have to repurchase the shares. If the price of the stock has decreased, the short seller gains money owing to the difference between the price of the stock sold on margin and the price of the stock paid later at the reduced price. Nonetheless, if the price rises, the buyback price may rise the initial sale price, and the short seller will be forced to sell the security quickly to avoid incurring even higher losses.

We illustrate below the risk of a dedicated short bias strategy with Gamestop.

Gamestop short squeeze

GameStop is best known as a video game retailer, with over 3,000 stores still in operation in the United States. However, as technology in the video game business advances, physical shops faced substantial problems. Microsoft and Sony have both adopted digital game downloads directly from their own web shops for their Xbox and Playstation systems. While GameStop continues to offer video games, the company has made steps to diversify into new markets. Toys and collectibles, gadgets, apparel, and even new and refurbished mobile phones are included.

However, given the increased short pressure by different hedge funds believing that the era of physical copies was dead, they started positioning in Gamestop stock and traded short in order to profit from the decrease in value. In this scenario, roughly 140% of GameStop’s shares were sold short in January 2021. In this case, investors have two choices: keep the short position or cover it (to buy back the borrowed securities in order to close out the open short position at a profit or loss). When the stock price rises, covering a short position means purchasing the shares at a loss since the stock price is now higher than what was sold. And when 140% of a stock’s float is sold short, a large number of positions are (have to be) closed. As a result, short sellers were constantly buying shares to cover their bets. When there is that much purchasing pressure, the stock mechanically continued to rise. From the levels reached in early 2020 to the levels reached in mid-2021, the stock price climbed by a factor of a nearly a hundred times (Figure 2).

Figure 2. Performance of Gamestop stock price.
 Gamestop performance
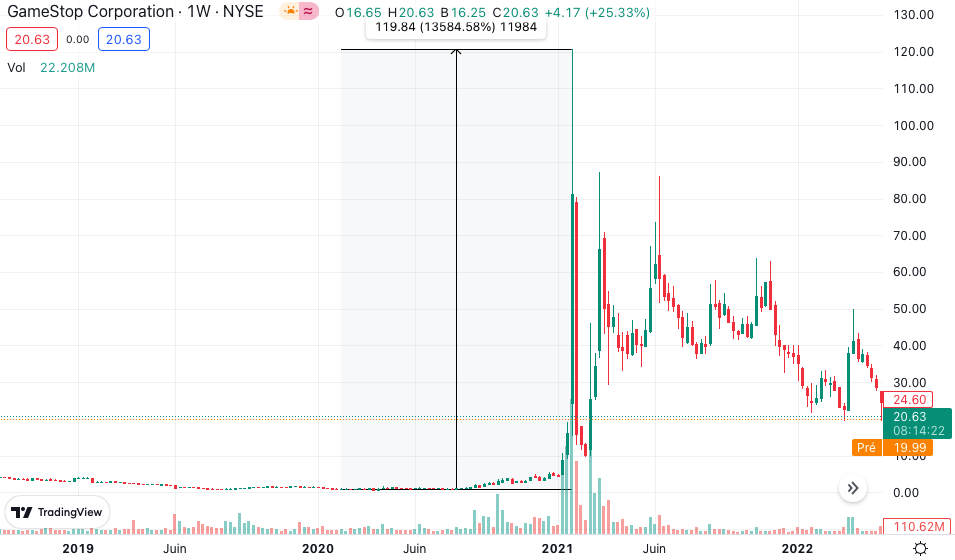
Source: (Data: Tradingview)

In the Gamestop story, the short sellers lost huge amount of money. Especially, the hedge fund Melvin Capital lost billions of dollars after being on the wrong side of the GameStop short squeeze.

Why should I be interested in this post?

Understanding the profits and risks of such a strategy might assist investors in incorporating this hedge fund strategy into their portfolio allocation.

Related posts on the SimTrade blog

Hedge funds

   ▶ Youssef LOURAOUI Introduction to Hedge Funds

   ▶ Youssef LOURAOUI Global macro strategy

   ▶ Youssef LOURAOUI Long/short equity strategy

Financial techniques

   ▶ Akshit GUPTA Short selling

   ▶ Youssef LOURAOUI Portfolio

Useful resources

Academic research

Pedersen, L. H., 2015. Efficiently Inefficient: How Smart Money Invests and Market Prices Are Determined. Princeton University Press.

Business Analysis

Credit Suisse Hedge fund strategy

Credit Suisse Hedge fund performance

Wikipedia Gamestop short squeeze

TradingView, 2023 Gamestop stock price historical chart

About the author

The article was written in January 2023 by Youssef LOURAOUI (Bayes Business School, MSc. Energy, Trade & Finance, 2021-2022).

Quantitative equity investing

Youssef_Louraoui

In this article, Youssef LOURAOUI (Bayes Business School, MSc. Energy, Trade & Finance, 2021-2022) elaborates on the concept of quantitative equity investing, a type of investment approach in the equity trading space.

This article follows the following structure: we introduce the quantitative equity investing. We present a review of the major types of quantitative equity strategies and we finish with a conclusion.

Introduction

Quantitative equity investing refers to funds that uses model-driven decision making when trading in the equity space. Quantitative analysts program their trading rules into computer systems and use algorithmic trading, which is overseen by humans.

Quantitative investing has several advantages and disadvantages over discretionary trading. The disadvantages are that the trading rule cannot be as personalized to each unique case and cannot be dependent on “soft” information such human judgment. These disadvantages may be lessened as processing power and complexity improve. For example, quantitative models may use textual analysis to examine transcripts of a firm’s conference calls with equity analysts, determining whether certain phrases are commonly used or performing more advanced analysis.

The advantages of quantitative investing include the fact that it may be applied to a diverse group of stocks, resulting in great diversification. When a quantitative analyst builds an advanced investment model, it can be applied to thousands of stocks all around the world at the same time. Second, the quantitative modeling rigor may be able to overcome many of the behavioral biases that commonly impact human judgment, including those that produce trading opportunities in the first place. Third, using past data, the quant’s trading principles can be backtested (Pedersen, 2015).

Types of quantitative equity strategies

There are three types of quantitative equity strategies: fundamental quantitative investing, statistical arbitrage, and high-frequency trading (HFT). These three types of quantitative investing differ in various ways, including their conceptual base, turnover, capacity, how trades are determined, and their ability to be backtested.

Fundamental quantitative investing

Fundamental quantitative investing, like discretionary trading, tries to use fundamental analysis in a systematic manner. Fundamental quantitative investing is thus founded on economic and financial theory, as well as statistical data analysis. Given that prices and fundamentals only fluctuate gradually, fundamental quantitative investing typically has a turnover of days to months and a high capacity (meaning that a large amount of money can be invested in the strategy), owing to extensive diversification.

Statistical arbitrage

Statistical arbitrage aims to capitalize on price differences between closely linked stocks. As a result, it is founded on a grasp of arbitrage relations and statistics, and its turnover is often faster than that of fundamental quants. Statistical arbitrage has a lower capacity due to faster trading (and possibly fewer stocks having arbitrage spreads).

High Frequency Trading (HFT)

HFT is based on statistics, information processing, and engineering, as the success of an HFT is determined in part by the speed with which they can trade. HFTs focus on having superfast computers and computer programs, as well as co-locating their computers at exchanges, actually trying to get their computer as close to the exchange server as possible, using fast cables, and so on. HFTs have the fastest trading turnover and, as a result, the lowest capacity.

The three types of quants also differ in how they make trades: Fundamental quants typically make their deals ex ante, statistical arbitrage traders make their trades gradually, and high-frequency traders let the market make their transactions. A fundamental quantitative model, for example, identifies high-expected-return stocks and then buys them, almost always having their orders filled; a statistical arbitrage model seeks to buy a mispriced stock but may terminate the trading scheme before completion if prices have moved adversely; and, finally, an HFT model may submit limit orders to both buy and sell to several exchanges, allowing the market to determine which ones are hit. Because of this trading structure, fundamental quant investing can be simulated with some reliability via a backtest; statistical arbitrage backtests rely heavily on assumptions on execution times, transaction costs, and fill rates; and HFT strategies are frequently difficult to simulate reliably, so HFTs must rely on experiments.

Table 1. Quantitative equity investing main categories and characteristics.
 Quantitative equity investing
Source: Source: Pedersen, 2015.

Conclusion

Quants run their models on hundreds, if not thousands, of stocks. Because diversification eliminates most idiosyncratic risk, firm-specific shocks tend to wash out at the portfolio level, and any single position is too tiny to make a major impact in performance.

An equity market neutral portfolio eliminates total stock market risk by being equally long and short. Some quants attempt to establish market neutrality by ensuring that the long side’s dollar exposure equals the dollar worth of all short bets. This technique, however, is only effective if the longs and shorts are both equally risky. As a result, quants attempt to balance market beta on both the long and short sides. Some quants attempt to be both dollar and beta neutral.

Why should I be interested in this post?

It may provide an opportunity for investors to diversify their global portfolios. Including hedge funds in a portfolio can help investors obtain absolute returns that are uncorrelated with typical bond/equity returns.

For practitioners, learning how to incorporate hedge funds into a standard portfolio and understanding the risks associated with hedge fund investing can be beneficial.

Understanding if hedge funds are truly providing “excess returns” and deconstructing the sources of return can be beneficial to academics. Another challenge is determining whether there is any “performance persistence” in hedge fund returns.

Getting a job at a hedge fund might be a profitable career path for students. Understanding the market, the players, the strategies, and the industry’s current trends can help you gain a job as a hedge fund analyst or simply enhance your knowledge of another asset class.

Related posts on the SimTrade blog

   ▶ Youssef LOURAOUI Introduction to Hedge Funds

   ▶ Youssef LOURAOUI Portfolio

   ▶ Youssef LOURAOUI Long-short strategy

Useful resources

Academic research

Pedersen, L. H., 2015. Efficiently Inefficient: How Smart Money Invests and Market Prices Are Determined. Chapter 9 : 133 – 164. Princeton University Press.

About the author

The article was written in December 2022 by Youssef LOURAOUI (Bayes Business School, MSc. Energy, Trade & Finance, 2021-2022).

Long-short equity strategy

Youssef LOURAOUI

In this article, Youssef LOURAOUI (Bayes Business School, MSc. Energy, Trade & Finance, 2021-2022) presents the long-short equity strategy, one of pioneer strategies in the hedge fund industry. The goal of the long-short equity investment strategy is to buy undervalued stocks and sell short overvalued ones.

This article is structured as follow: we introduce the long-short strategy principle. Then, we present a practical case study to grasp the overall methodology of this strategy. We conclude with a performance analysis of this strategy in comparison with a global benchmark (MSCI All World Index).

Introduction

According to Credit Suisse, a long-short strategy can be defined as follows: “Long-short equity funds invest on both long and short sides of equity markets, generally focusing on diversifying or hedging across particular sectors, regions, or market capitalizations. Managers have the flexibility to shift from value to growth; small to medium to large capitalization stocks; and net long to net short. Managers can also trade equity futures and options as well as equity related securities and debt or build portfolios that are more concentrated than traditional long-only equity funds.”

This strategy has the particularity of potentially generate returns in both rising and falling markets. However, stock selection is key concern, and the stock picking ability of the fund manager is what makes this strategy profitable (or not!). The trade-off of this approach is to reduce market risk but exchange it for specific risk. Another key characteristic of this type of strategy is that overall, funds relying on long-short are net long in their trading exposure (long bias).

Equity strategies

In the equity universe, we can separate long-short equity strategies into discretionary long-short equity, dedicated short bias, and quantitative.

Discretionary long-short

Discretionary long-short equity managers typically decide whether to buy or sell stocks based on a basic review of the value of each firm, which includes evaluating its growth prospects and comparing its profitability to its valuation. By visiting managers and firms, these fund managers also evaluate the management of the company. Additionally, they investigate the accounting figures to judge their accuracy and predict future cash flows. Equity long-short managers typically predict on particular companies, but they can also express opinions on entire industries.

Value investors, a subset of equity managers, concentrate on acquiring undervalued companies and holding these stocks for the long run. A good illustration of a value investor is Warren Buffett. Since companies only become inexpensive when other investors stop investing in them, putting this trading approach into practice frequently entails being a contrarian (buy assets after a price decrease). Because of this, cheap stocks are frequently out of favour or purchased while others are in a panic. Traders claim that deviating from the standard is more difficult than it seems.

Dedicated short bias

Like equity long-short managers, dedicated short bias is a trading technique that focuses on identifying companies to sell short. Making a prediction that the share price will decline is known as short selling. Similar to how purchasing stock entails profiting if the price increases, holding a short position entail profiting if the price decreases. Dedicated short-bias managers search for companies that are declining. Since dedicated short-bias managers are working against the prevailing uptrend in markets since stocks rise more frequently than they fall (this is known as the equity risk premium), they make up a very small proportion of hedge funds.

Most hedge funds in general, as well as almost all equity long-short hedge funds and dedicated short-bias hedge funds, engage in discretionary trading, which refers to the trader’s ability to decide whether to buy or sell based on his or her judgement and an evaluation of the market based on past performance, various types of information, intuition, and other factors.

Quantitative

The quantitative investment might be seen as an alternative to this traditional style of trading. Quants create systems that methodically carry out the stated definitions of their trading rules. They use complex processing of ideas that are difficult to analyse using non-quantitative methods to gain a slight advantage on each of the numerous tiny, diversified trades. To accomplish this, they combine a wealth of data with tools and insights from a variety of fields, including economics, finance, statistics, mathematics, computer science, and engineering, to identify relationships that market participants may not have immediately fully incorporated in the price. Quantitative traders use computer systems that use these relationships to generate trading signals, optimise portfolios considering trading expenses, and execute trades using automated systems that send hundreds of orders every few seconds. In other words, data is fed into computers that execute various programmes under the supervision of humans to conduct trading (Pedersen, 2015).

Example of a long-short equity strategy

The purpose of employing a long-short strategy is to profit in both bullish and bearish markets. To measure the profitability of this strategy, we implemented a long-short strategy from the beginning of January 2022 to June 2022. In this time range, we are long Exxon Mobile stock and short Tesla. The data are extracted from the Bloomberg terminal. The strategy of going long Exxon Mobile and short Tesla is purely educational. This strategy’s basic idea is to profit from rising oil prices (leading to a price increase for Exxon Mobile) and rising interest rates (leading to a price decrease for Tesla). Over the same period, the S&P 500 index has dropped 23%, while the Nasdaq Composite has lost more than 30%. The Nasdaq Composite is dominated by rapidly developing technology companies that are especially vulnerable to rising interest rates.

Overall, the market’s net exposure is zero because we are 100% long Exxon Mobile and 100% short Tesla stock. This strategy succeeded to earn significant returns in both the long and short legs of the trade over a six-month timeframe. It yielded a 99.5 percent return, with a 36.8 percent gain in the value of the Exxon Mobile shares and a 62.8 percent return on the short Tesla position. Figure 1 shows the overall performance of each equity across time.

Figure 1. Long-short equity strategy performance over time
 Time-series regression
Source: computation by the author (Data: Bloomberg)

You can find below the Excel spreadsheet that complements the example above.

 Download the Excel file to analyse a long-short equity strategy

Performance of the long-short equity strategy

To capture the performance of the long-short equity strategy, we use the Credit Suisse hedge fund strategy index. To establish a comparison between the performance of the global equity market and the long-short hedge fund strategy, we examine the rebased performance of the Credit Suisse index with respect to the MSCI All-World Index. Over a period from 2002 to 2022, the long-short equity strategy index managed to generate an annualised return of 5.96% with an annualised volatility of 7.33%, leading to a Sharpe ratio of 0.18. Over the same period, the MSCI All World Index managed to generate an annualised return of 6.00% with an annualised volatility of 15.71%, leading to a Sharpe ratio of 0.11. The low correlation of the long-short equity strategy with the MSCI All World Index is equal to 0.09, which is closed to zero. Overall, the Credit Suisse hedge fund strategy index performed somewhat slightly worse than the MSCI All World Index, but presented a much lower volatility leading to a higher Sharpe ratio (0.18 vs 0.11).

Figure 2. Performance of the long-short equity strategy compared to the MSCI All-World Index across time.
 Time-series regression
Source: computation by the author (Data: Bloomberg)

You can find below the Excel spreadsheet that complements the explanations about the Credit Suisse hedge fund strategy index.

 Download the Excel file to perform a Fama-MacBeth regression method with N-asset

Why should I be interested in this post?

Long-short funds seek to reduce negative risk while increasing market upside. They might, for example, invest in inexpensive stocks that the fund managers believe will rise in price while simultaneously shorting overvalued stocks to cut losses. Other strategies used by long-short funds to lessen market volatility include leverage and derivatives. Understanding the profits and risks of such a strategy might assist investors in incorporating this hedge fund strategy into their portfolio allocation.

Related posts on the SimTrade blog

   ▶ Youssef LOURAOUI Introduction to Hedge Funds

   ▶ Youssef LOURAOUI Portfolio

Useful resources

Academic research

Pedersen, L. H., 2015. Efficiently Inefficient: How Smart Money Invests and Market Prices Are Determined. Princeton University Press.

Business Analysis

BlackRock Long-short strategy

BlackRock Investment Outlook

Credit Suisse Hedge fund strategy

Credit Suisse Hedge fund performance

Credit Suisse Long-short strategy

Credit Suisse Long-short performance benchmark

About the author

The article was written in December 2022 by Youssef LOURAOUI (Bayes Business School, MSc. Energy, Trade & Finance, 2021-2022).

Smart Beta 1.0

Youssef_Louraoui

In this article, Youssef LOURAOUI (ESSEC Business School, Global Bachelor of Business Administration, 2017-2021) presents the concept of the smart beta 1.0, the first generation of alternative indexing investment strategies that created a new approach in the asset management industry.

This post is structured as follows: we start by defining smart beta 1.0 as a topic. Finally, we discuss an empirical study by Motson, Clare and Thomas (2017) emphasizing the origin of smart beta.

Definition

The “Smart Beta” expression is commonly used in the asset management industry to describe innovative indexing investment strategies that are alternatives to the market-capitalization-weighted investment strategy (buy-and-hold). In terms of performance, the smart beta “1.0” approach outperforms market-capitalization-based strategies. According to Amenc et al. (2016), the latter have a tendency for concentration and unrewarded risk, which makes them less appealing to investors. In finance, “unrewarded risk” refers to taking on more risk without receiving a return that is commensurate to the increased risk.

When smart beta techniques were first introduced, they attempted to increase portfolio diversification over highly concentrated and capitalization-weighted, as well as to capture the factor premium available in equity markets, such as value indices or fundamentally weighted indices which aim to capture the value premium. While improving capitalization-weighted indices is important, concentrating just on increasing diversity or capturing factor exposure may result in a less than optimal outcome. The reason for this is that diversification-based weighting systems will always result in implicit exposure to certain factors, which may have unintended consequences for investors who are unaware of their implicit factor exposures. Unlike the second generation of Smart Beta, the first generation of Smart Beta are integrated systems that do not distinguish between stock selection and weighting procedures. The investor is therefore required to be exposed to certain systemic risks, which are the source of the investor’s poor performance.

Thus, the first-generation Smart Beta indices are frequently prone to value, small- or midcap, and occasionally contrarian biases, since they deconcentrate cap weighted indices, which are often susceptible to momentum and large growth risk. Furthermore, distinctive biases on risk indicators that are unrelated to deconcentration but important to the factor’s objectives may amplify these biases even further. Indexes that are fundamentally weighted, for example, have a value bias because they apply accounting measures that are linked to the ratios that are used to construct value indexes.

Empirical study: monkeys vs passive mangers

Andrew Clare, Nick Motson, and Steve Thomas assert that even monkey-created portfolios outperform cap-weighted benchmarks in their study (Motson et al., 2017). A lack of variety in cap-weighting is at the foundation of the problem. The endless monkey theory states that a monkey pressing random keys on a typewriter keyboard for an unlimited amount of time will almost definitely type a specific text, such as Shakespeare’s whole works. For 500 businesses, there is an infinite number of portfolio weighting options totaling 100%; some will outperform the market-capitalization-weighted index, while others will underperform. The authors of the study take the company’s ticker symbol and use the following guidelines to create a Scrabble score for each stock:

  • A, E, I, O, U, L, N, S, T, R – 1 point. D and G both get two points.
  • B, C, M, P – 3 points ; F, H, V, W, Y – 4 points ; K – 5 points.
  • J, X – 8 points ; Q, Z – 10 points

The scores of each company’s tickers are then added together and divided by this amount to determine each stock’s weight in the index. As illustrated in Figure 1, the results obtained are astonishing, resulting in a clear outperformance of the randomly generated portfolios compared to the traditional market capitalization index by 1.5% premium overall.

Figure 1. Result of the randomly generated portfolio with the Cass Scrabble as underlying rule compared to market-capitalization portfolio performance.
Scrabble_performance
Source: Motson et al. (2017).

In the same line, the authors produced 500 weights that add up to one using this technique, with a minimum increase of 0.2 percent. The weights are then applied to a universe of 500 equities obtained from Bloomberg in December 2015 (Motson et al., 2017). The performance of the resultant index is then calculated over the next twelve months. This technique was performed ten million times. As illustrated in Figure 2, the results are striking, with smart beta funds outperforming nearly universally in the 10 million simulations run overall, and with significant risk-adjusted return differences (Motson et al., 2017).

Figure 2. 10 million randomly generated portfolios based on a portfolio construction of 500 stocks
Scrabble_performance
Source: Motson et al. (2017).

For performance analysis, the same method was employed, but this time for a billion simulation. This means they constructed one billion 500-stock indexes with weights set at random or as if by a monkey. Figure 9 suggests that the outcome was not accidental. The black line shows the distribution of 1 billion monkeys’ returns in 2016, while the grey line shows the cumulative frequency. 88 percent of the monkeys outperformed the market capitalization benchmark, according to the graph. The luckiest monkey returned 27.2 percent, while the unluckiest monkey returned just 3.83 percent (Motson et al., 2017) (Figure 3).

FFigure 3. Result of one billion randomly simulated portfolios based on a portfolio construction of 500 stocks.
Scrabble_performance
Source: Motson et al. (2017).

Why should I be interested in this post?

If you are a business school or university undergraduate or graduate student, this content will help you in understanding the various evolutions of asset management throughout the last decades and in broadening your knowledge of finance.

If you’re an investor, you’re probably aware that smart beta funds have become a popular topic. Smart beta is a game-changing development that fills a gap in the market for investors: a better return for a reduced risk, net of transaction and administrative costs. These strategies, in a sense, establish a new market. As a result, smart beta is gaining traction and having an impact on asset management.

Related posts on the SimSrade blog

Factor investing

   ▶ Youssef LOURAOUI Factor Investing

   ▶ Youssef LOURAOUI Origin of factor investing

   ▶ Youssef LOURAOUI Smart beta 2.0

   ▶ Youssef LOURAOUI Alternatives to market-capitalisation weighted indexes

Factor

   ▶ Youssef LOURAOUI Size Factor

   ▶ Youssef LOURAOUI Value Factor

   ▶ Youssef LOURAOUI Yield Factor

   ▶ Youssef LOURAOUI Momentum Factor

   ▶ Youssef LOURAOUI Quality Factor

   ▶ Youssef LOURAOUI Growth Factor

   ▶ Youssef LOURAOUI Minimum Volatility Factor

Useful resources

Academic research

Amenc, N., F., Goltz, F. and Le Sourd, V., 2016. Investor perception about Smart beta ETF. EDHEC Risk Institute working paper.

Amenc, N., F., Goltz, F. and Martinelli, L., 2013. Smart beta 2.0. EDHEC Risk Institute working paper.

Motson, N., Clare, A. & Thomas, S., 2017. Was 2016 the year of the monkey?. Cass Business School research paper.

About the author

The article was written in September 2021 by Youssef LOURAOUI (ESSEC Business School, Global Bachelor of Business Administration, 2017-2021).

Alternative to market-capitalization weighting strategies

Youssef_Louraoui

In this article, Youssef LOURAOUI (ESSEC Business School, Global Bachelor of Business Administration, 2017-2021) presents the different alternatives developed to the market-capitalization weighting strategy (buy-and-hold strategy).

The structure of this post is as follows: we begin by introducing alternatives to market capitalization strategies as a topic. We then will delve deeper by presenting heuristic-based weighting and optimization-based weighting strategies.

Introduction

The basic rule of applying a market-capitalization weighting methodology for the development of indexes has recently come under fire. As the demand for indices as investment vehicles has grown, different weighting systems have emerged. There have also been a number of recent projects for non-market-capitalization-weighted ETFs. Since the first basic factor weighted ETF was released in May 2000, a slew of ETFs has been released to monitor non-market-cap-weighted indexes, including equal-weighted ETFs, minimal variance ETFs, characteristics-weighted ETFs, and so on. These are dubbed “Smart Beta ETFs” since they aim to outperform traditional market-capitalization-based indexes in terms of risk-adjusted returns (Amenc et al. 2016).

The categorization approach will be the same as Chow, Hsu, Kalesnik, and Little (2011), with the following distinctions: 1) basic weighting techniques (heuristic-based weighting) and 2) more advanced quantitative weighting techniques (optimization-based weighting).

It’s an arbitrary categorization system designed to make reading easier by differentiating between simpler and more complicated approaches.

Heuristic-based weighting strategies

Equal-weighting

The equal weighting method assigns the same weight to each share making up the portfolio (or index)

EW_index

Where wi represents the weight of asset i in the portfolio and N the total number of assets in the portfolio.

Because each component of the portfolio has the same weight, equal weighting helps investors to obtain more exposure to smaller firms. Bigger firms will be more represented in the market-capitalization-weighted portfolio since their weight will be larger. The benefit of this technique is that tiny capitalization risk-adjusted-performance tends to be better than big capitalization (Banz, 1981).

In their study, Arnott, Kalesnik, Moghtader, and Scholl (2010) created three distinct indices in terms of index composition. The first group consists of enterprises with substantial market capitalization (as are capitalisation-weighted indices). Each business in the index is then given equal weight. This is how the majority of equally-weighted indexes are built (MSCI World Equal Index, S&P500 Equal Weight Index). The second is to create an index based on basic criteria and then assign equal weight to each firm. The third strategy is a hybrid of the first two. It entails averaging the ranks from the two preceding approaches and then assigning equal weight to the remaining 1000 shares.

Fundamental-weighting

The weighting approach based on fundamentals divides companies into categories based on their basic size. Sales, cash flow, book value, and dividends are all taken into account. These four parameters are used to determine the top 1,000 firms, and each firm in the index is given a weight based on the magnitude of their individual components (Arnott et al., 2005). The portfolio weight of the ith stock is defined as:

Fundamental_indexing

For a fundamental index that includes book value as a consideration, for example, the top 1,000 companies in the market with the most extensive book values are chosen. Firm xi is given a weight wi, which is equal to the firm’s book value divided by the total of the index components’ book values.

Fundamental indexation tries to address the following bias: in a cap-weighted index, if the market efficiency hypothesis is not validated and a share’s price is, for example, overpriced (greater than its fair value), the share’s weight in the index will be too high. Weighting by fundamentals will reduce the bias of over/underweighting over/undervalued companies based on criteria like sales, cash flows, book value, and dividends, which are not affected by market opinion, unlike capitalization.

Low beta weighting

Low-beta strategies are based on the fact that equities with a low beta have greater returns than those expected by the CAPM (Haugen and Heins, 1975). A beta of less than one indicates that the share price has tended to grow less than its benchmark index during bullish trends and to decrease less severely during negative trends throughout the observed timeframe. A low-beta index is created by selecting low-beta stocks and then giving each stock equal weight in the index. As a result, it’s a hybrid of a low-beta and an equal-weighting method. On the other side, high beta strategies enable investors to profit from the amplification of favourable market moves.

Reverse-capitalization weighting

The weight of an asset capitalization-weighted index can be defined as:

CW_index

where MC stands for “Market Capitalization”, and wi is the weight of asset i in the portfolio.

In a reverse market-capitalization-weighted index, the weight of an asset is defined as:

RCW

“Reverse market-capitalization” is abbreviated as RMC. This technique necessitates using a cap-weighted index to execute the approach. RCW methods, like equal-weight or low-beta strategies, are motivated by the fact that small caps have a greater risk-adjusted return than big caps. This sort of indexation requires constant rebalancing (Banz, 1981).

Maximum diversification

This technique aims to build a portfolio with as much diversification as feasible. A diversity index (DI) is employed to achieve the desired outcome, which is defined as the distance between the sum of the constituents’ volatilities and the portfolio’s volatility (Amenc, Goltz, and Martellini, 2013). Diversity weighting is one of the better-known portfolio heuristics that blend cap weighting and equal weighting. Fernholz (1995) defined stock market diversity, Dp, as

Diversity_Index(DI)_1

where p between (0,1) and x Market,i is the weight of the ith stock in the cap-weighted market portfolio, and then proposed a strategy of portfolio weighting whereby portfolio weights are defined as

Diversity_Index(DI)_2

where i = 1, . . . , N; p between (0,1); and the parameter p targets the desired level of portfolio tracking error against the cap-weighted index.

Optimization-based weighting strategies

The logic of Modern Portfolio Theory (Markowitz, 1952) is followed in Mean-Variance optimization. Theoretically, if we know the expected returns of all stocks and their variance-covariance matrix, we can construct risk-adjusted-performance optimal portfolios. However, these two inputs for the model are difficult to estimate precisely in practice. Chopra and Ziemba (1993) showed that even little inaccuracies in these parameters’ estimates may have a large influence on risk-adjusted-performance.

Minimum Variance

Chopra and Ziemba (1993) adopt the simple premise that all stocks have the same return expectation, based on the fact that stock return expectations are difficult to quantify. As a result of this premise, the best portfolio is the one that minimizes risk. The goal of minimal variance strategies, which have been around since 1990, is to provide a better risk-return profile by lowering portfolio risk without modifying return expectations. The low volatility anomaly justifies this technique. Low-volatility stocks have historically outperformed high-volatility equities. These portfolios are built without using a benchmark as a guide. The portfolio variance minimization equation for a two-asset portfolio is as follows:

MPT

In their research on the construction of this type of index, Arnott, Kalesnik, Moghtader and Scholl (2010) found that risk measures that take into account interest rates, oil prices, geographical region, sector, size, expected return, and growth, as calculated by the Northfield global risk model, a model for making one-year risk forecasts, reduce the portfolio’s absolute risk. This method is used in the MSCI World Minimum Volatility Index, which was released in 2008.

Global Minimum Variance, Maximum Decorrelation, and Diversified Minimum Variance are the three types of minimum variance techniques (Amenc, Goltz and Martellini, 2013). However, there are no indexes or exchange-traded funds (ETFs) based on the Maximum Decorrelation and Diversified Minimum Variance methods in actuality; they are still only theoretical notions.

Maximum Sharpe ratio

Because all stocks are unlikely to have the same expected returns, the minimum-variance portfolio—or any practical representation of its concept—is unlikely to have the highest ex-ante Sharpe ratio. Investors must incorporate useful information about future stock returns into a minimum-variance approach to improve it. Choueifaty and Coignard (2008) proposed a simple linear relationship between the expected premium, E(Ri) – Rf, for a stock and its return volatility, sigmai:

MSR_strategy

A related portfolio method proposed by Amenc, Goltz, Martellini, and Retkowsky (2010) implies that a stock’s expected returns are linearly related to its downside semi-volatility. They claimed that portfolio losses are more important to investors than gains. As a result, rather than volatility, risk premium should be connected to downside risk (semi-deviation below zero). The EDHEC-Risk Efficient Equity Indices are built around this assumption. Downside semi-volatility can be defined mathematically as

MSR_Semi_volatility

where Ri, t is the return for stock i in period t.

Maximum Sharpe ratio can be considered as an alternative beta technique that aims to solve the challenges of forecasting risks and returns for a large number of equities.

Why should I be interested in this post?

If you are a business school or university undergraduate or graduate student, this content will help you in understanding the various evolutions of asset management throughout the last decades and in broadening your knowledge of finance.

Smart beta funds have become a hot issue among investors in recent years. Smart beta is a game-changing invention that addresses an unmet need among investors: a higher return for lower risk, net of transaction and administrative costs. In a way, these investment strategies create a new market. As a result, smart beta is gaining traction and influencing the asset management industry.

Related posts on the SimTrade blog

Factor investing

   ▶ Youssef LOURAOUI Factor Investing

   ▶ Youssef LOURAOUI Origin of factor investing

   ▶ Youssef LOURAOUI Smart beta 1.0

   ▶ Youssef LOURAOUI Smart beta 2.0

Factors

   ▶ Youssef LOURAOUI Size Factor

   ▶ Youssef LOURAOUI Value Factor

   ▶ Youssef LOURAOUI Yield Factor

   ▶ Youssef LOURAOUI Momentum Factor

   ▶ Youssef LOURAOUI Quality Factor

   ▶ Youssef LOURAOUI Growth Factor

   ▶ Youssef LOURAOUI Minimum Volatility Factor

Useful resources

Academic research

Amenc, Noël, Felix Goltz, Lionel Martellini, and Patrice Ret- kowsky. 2010. “Efficient Indexation: An Alternative to Cap- Weighted Indices.” EDHEC-Risk Institute (February).

Amenc, N., Goltz, F., Le Sourd, V., 2016. Investor perception about Smart beta ETF. EDHEC Risk Institute working paper.

Amenc, N., Goltz, F., Martinelli, L., 2013. Smart beta 2.0. EDHEC Risk Institute working paper.

Arnot, R.D., Hsu, J., Moore, P., 2005. Fundamental Indexation. Financial Analysts Journal, 61(2):83-98.

Arnot, R.D., Kalesnik, V., Moghtader, P., Scholl, S., 2010. Beyond Cap Weight, The empirical evidence for a diversified beta. Journal of Indexes, January, 16-29.

Banz, R., 1981. The relationship between return and market value of common stocks. Journal of Financial Economics. 9(1):3-18.

Chopra, V., Ziemba, W., 1993. The Effect of Errors in Means, Variances, and Covariances on Optimal Portfolio Choice. Journal of Portfolio Management, 19:6-11.

Chow, T., Hsu, J., Kalesnik, V., Little, B., 2011. A Survey of Alternative Equity Index Strategies. Financial Analyst Journal, 67(5):35-57.

Choueifaty, Yves, and Yves Coignard. 2008. Toward Maximum Diversification. Journal of Portfolio Management, vol. 35, no. 1 (Fall):40–51.

Fernholz, Robert. 1995. Portfolio Generating Functions. Working paper, INTECH (December).

Haugen, R., Heins, J., 1975. Risk and Rate of Return of Financial Assets: Some Old Wine in New Bottles. Journal of Financial and Quantitative Analysis, 10(5):775-784.

Markowitz, H., 1952. Portfolio Selection. The Journal of Finance, 7(1):77-91.

About the author

The article was written in September 2021 by Youssef LOURAOUI (ESSEC Business School, Global Bachelor of Business Administration, 2017-2021).

Smart Beta strategies: between active and passive allocation

Smart Beta strategies: between active and passive allocation

Youssef_Louraoui

In this article, Youssef LOURAOUI (ESSEC Business School, Global Bachelor of Business Administration, 2017-2021) discusses the topic of smart beta strategies and especially the debate about its position as an active or passive allocation.

Smart beta strategies appear to be in the middle of the polarized asset management industry, which is segmented between active investing based on beating the performance of a given benchmark, and passive investing based on replicating a given benchmark.

This article is structured as follows: we begin by introducing the topic of smart beta strategies. We then discuss the different investing approach and their characteristic. A simple simulation exercise is then presented to understand how an alternative to market-capitalization-weightings indexes leads to different results. We wrap up with a general conclusion of the topic.

Introduction

Smart beta strategies are often found somewhere in the middle between active and passive investment management. In this post, we look at how investors think about this characteristic of smart beta investment strategies.

Passive funds aim at replicating or tracking an index (such as the S&P500 index in the US or the CAC40 index in France for equity markets) use a buy-and-hold strategy to achieve their goal of mimicking the performance of the market index. The beta of a passive fund is very close to the beta of the market index (benchmark).

Active funds are supervised by a portfolio manager that screens the best investments for the fund and time the market to profit from an upside potential. The excess return over the performance of the market index (benchmark) is referred to as alpha.

Smart beta funds are justified by the fact that capitalization-weighted strategies appear to be inefficient. They are based on transparent and rule-based strategies. Investors seek to obtain additional factor betas to enhance their portfolio performance.

While passive investing aims to match the market return, and active strategies rely on the fund manager’s ability to outperform the market, smart beta can be seen as a hybrid of the two approaches, with a passive component in the sense that it tracks one or more factors that are transparent and rule-based, and an active component in which the portfolio is managed, that is to say, rebalanced from time to time. Table 1 describes the main types of funds (passive, active and smart beta) and their respective strategies according to the investment approach and asset allocation methodology, and performance metrics. We also indicate the Greek letter that each strategy.

Table 1. Description of the main types of funds and their respective strategies.
main types of funds and their respective strategies
Source: table done by the author.

The passive investing approach

The Efficient Market Hypothesis (EMH) asserts that markets are efficient. The passive investing strategy is built on the concept of “buy-and-hold,” or keeping an investment position for a lengthy period without worrying about market timing or acting on the bought position. This latter technique is frequently implemented through the purchase of exchange-traded funds (ETF) that aim to closely match a given benchmark to produce a performance that is comparable to the underlying index or benchmark. The index might be broad-based, such as the S&P500 index in the US equity market for instance, or more specialized, such as an index that monitors a specific sector or geographical zone.

The active investing approach

Active management is an approach for going beyond matching a benchmark’s performance and instead aiming to outperform it. The alpha may be calculated using the same CAPM model framework, by linking the expected return with the fund manager’s extra return on the portfolio’s overall performance (Jensen, 1968). The search for alpha is done through two very different types of investment approaches: stock picking and market timing.

Stock picking

Stock picking is a method used by active managers to select assets based on a variety of variables such as their intrinsic value, the growth rate of dividends, and so on. Active managers use the fundamental analysis approach, which is based on the dissection of economic and financial data that may impact the asset price in the market.

Market timing

Market timing is a trading approach that involves entering and exiting the market at the right time. In other words, when rising outlooks are expected, investors will enter the market, and when downward outlooks are expected, investors will exit. For instance, technical analysis, which examines price and volume of transactions over time to forecast short-term future evolution, and fundamental analysis, which examines the macroeconomic and microeconomic data to forecast future asset prices, are the two techniques on which active managers base their decisions.

Review of academic literature

Passive investing

We can retrace the foundations of passive investing to the theory of portfolio construction developed by Harry Markowitz. For his theoretical implications, Markowitz’s work is widely regarded as a pioneer in financial economics and corporate finance. For his contributions to these disciplines, which he developed in his thesis “Portfolio Selection” published in The Journal of Finance in 1952. Markowitz received the Nobel Prize in economics in 1990. His groundbreaking work set the foundation for what is now known as ‘Modern Portfolio Theory’ (MPT).

William Sharpe, John Lintner, and Jan Mossin separately developed The Capital Asset Pricing Model (CAPM) as a result of Markowitz past research. The CAPM was a huge evolutionary step forward in capital market equilibrium theory because it enabled investors to appropriately value assets in terms of systematic risk. The portfolio management industry intended to capture the market portfolio return in the late 1970s, defined as a hypothetical collection of investments that contains every kind of asset available in the investment universe, with each asset weighted in proportion to its overall market participation. A market portfolio’s expected return is the same as the market’s overall expected return. But as financial research evolved and some substantial contributions were made, new factor characteristics emerged to capture some additional performance.

Active investing

As fund managers tried strategies to beat the market, financial literature delved deeper into the mechanism to achieve this purpose. Jensen’s groundbreaking work in the early ’70s gave rise to the concept of alpha in the tracking of a fund’s performance to distinguish between the fund’s manager’s ability to generate abnormal returns and the part of the returns due to luck (Jensen, 1968).

Smart beta / factor investing

Smart beta is defined as strategies that aim to address the inefficiencies of market capitalization weight indexation. In the early 2000s, as a result of numerous financial publications delving deeper into various elements that gave additional returns to increase the overall performance of the portfolio (the “Fama-French” papers), smart beta strategies evolved. Fund managers develop investment strategies based on researched factors that provide a time-tested abnormal return in exchange for taking on risk.

Understanding portfolio returns is crucial to determining how to evaluate portfolio performance. It all stems from Harry Markowitz’s groundbreaking work and pioneering research on portfolio construction and the impact of diversification in improving portfolio performance. Throughout the 1960s and 1970s, investors made no distinction between the sources of portfolio returns. Finance research in the 1980s boosted the popularity of passive investment as an alternate basis for implementation. Investors began to successfully capture market beta through passive strategies. In the 2000s, investors began to see factors as major determinants of long-term return (Figure 1).

Figure 1. Overview of the evolution of performance metrics.
Overview of the evolution of performance metrics
Source: MSCI Factor Research (2021).

Grossman and Stiglitz’s research addressed the limitations of passive investment (1980). If the fund manager actively selects assets for his portfolio rather than passively replicating the benchmark, he may get higher abnormal returns. The term “abnormal returns” refers to the disparity between the actual and projected returns. In the financial literature, this “extra return” is referred to as alpha. It is one of the most tracked performance indicators by fund managers. Grossman and Stiglitz establish that there is no such thing as a successful passive investment. Indeed, they said that the benchmark is composed of assets chosen based on certain criteria (capitalization, return, liquidity, and the weight of each asset in the sector), and that “passive investing” is the most cost-effective alternative to active investing.

As pointed out by Jensen (1968), when assembling a portfolio, there are two points to bear in mind. The first point is the fund manager’s ability to foresee the asset’s price movement, and the second point is the fund manager’s capacity to limit investment risk via diversification.

Case study: Comparison of market-capitalization-weighted portfolios and equally-weighted portfolios

The difference between two investment strategies can be evaluated by comparing the weights of the assets of their associated portfolio. Note that over time the weights can evolve with voluntary sales and purchases of the assets. Such divestments and investments refer to the rebalancing of the portfolio.

Buy-and-hold investing is a passive investment strategy in which an investor buys assets and holds them for a long period, independent of market fluctuations. A buy-and-hold investor selects companies but is indifferent to short-term market swings or technical indicators. The buy-and-hold investment strategy corresponds to market-capitalization-weighted portfolios.

The buy-and-hold approach is recommended by several prominent investors, like Warren Buffett, to individuals seeking profitable long-term returns. Buy-and-hold investors outperform active management on average over longer time horizons and after costs. Buy-and-hold investors, on the other hand, may not sell at the greatest price available, according to proponents.

Excel file for market-capitalization-weighted and equally-weighted portfolios

You can download an Excel file with data used for this exercise.

Download the Excel file to compute Exercise Market Cap Equally Weighted Portfolios

The goal of this exercise is to compare the performance of the two types of investments and to balance the two approaches to obtain a better understanding of each strategy and its market behavior. To be able to homogeneously analyze the underlying assets of the buy and hold strategy as well as the smart beta approach, three stocks have been simulated.

All the price data, number of shares, stock returns, and market-capitalization are all simulated for a more simplistic model. The buy and hold strategy is based on an evenly weighted portfolio. Only the small-cap stock (Stock 1) will have prices fluctuations to analyze the size effect as a driver of returns in a portfolio. A rebalancing exercise is implemented for the smart beta portfolio, no trading nor any related cost for implementing the strategy is applied and thus, don’t reflect the full picture as in financial markets.

Table 2 is made of three components. The first section of the table represents our data for the simulation. Each stock has a different size representing respectively a small, mid, and large-capitalization firm. Market capitalization is obtained through a simple computation by multiplying the number of shares times the price of each share. The second section of the table is the simulation of a market-capitalization-weighted portfolio. The third section represents a smart beta portfolio that uses an equally-weighted weighting indexing (Table 2). Note that with the market-capitalization-weighted portfolio there is a concentration in the stock with the largest market capitalization (due to its high past performance). An equally-weighted portfolio obtained with rebalancing (often associated with smart beta strategies such as growth) would not present such property and show a more diversified portfolio over time. Note that the frequency of rebalancing the portfolio can affect the risk/performance characteristics. Amenc et. al. (2016) show that the Sharpe ratio tends to decrease with a higher frequency for rebalancing.

Table 2. Simulation of a market-capitalization-weighted portfolio and an equally-weighted portfolio.
Smart_beta_simulation_spreadsheet
Source: simulations and calculations by the author.

The simulation unveiled that the market-capitalization-weighted portfolio’s size anomaly failed to capture the outperformance of small-cap stocks, resulting in results that were lower than those of the smart beta equally weighted portfolio, which had a good exposure to small caps (Figure 2). The key point of this simulated model is that the market-cap indexation has a defect related to the concentration of large companies in the profile of small caps which represent a small percentage of the index. The size factor is based on a risk factor that aims to capture the documented outperformance of small-cap firms compared to larger enterprises. With this simulated model, we have proven with a very simple model in the conception that the size anomaly can indeed be a vector of return, as researched in the paper of Banz (1981) which precisely describes this concept on the US equity market (Figure 2).

Figure 2. market-capitalization-weighted portfolio vs equally-weighted portfolio.
Market_cap_eq
Source: simulations and calculations by the author.

One aspect to consider in this case analysis is that one of the possible explanations for this outperformance is that the weights are changed at rebalancing dates rather than allowed to drift with the price fluctuations, which is a clear distinction between cap-weighted indexes and smart beta strategies. Some claim that this rebalancing completely explains the success of smart beta strategies (Amenc et al, 2016). This allegation, however, does not hold up under investigation. An examination of buy-and-hold portfolios vs portfolios rebalanced at various frequencies reveals that whether or not rebalancing improves performance is dependent on the return behavior of the assets in the portfolio. Rebalancing may or may not provide better results than buy-and-hold tactics (Amenc et. al., 2016).

Even if beneficial rebalancing impacts occur, Smart Beta methods may not be able to capture them. Contrary to popular belief, data shows that rebalancing an equal-weighted approach more frequently does not always increase performance. Furthermore, both short- and long-term reversal effects are empirically insignificant in explaining the performance of a wide variety of Smart Beta strategies. Naturally, rebalancing is necessary, especially to maintain diversity and target factor exposures. Rebalancing, on the other hand, is not an experimentally verified source of Smart Beta strategy performance (Amenc et. al., 2016).

Smart beta: passive or active investment strategy?

Smart beta investing is considered a hybrid strategy because it attempts to replicate the performance of a predetermined benchmark without engaging in market timing or stock picking, and an active strategy because investors choose to gain exposure to specific factors (beyond the market factor) by rebalancing the portfolio according to some rules. In practice, smart beta strategies often imply rebalancing to maintain target weights for each factor. In this sense, smart beta strategies are active, or at least more active than the buy-and-hold strategy. However, the rebalancing of portfolios of smart beta strategies is usually done with a predefined rule. In this sense, smart beta strategies are passive, or at least more passive than discretionary investment strategies based on stock picking and market timing.

Why should I be interested in this post?

If you are a business school or university undergraduate or graduate student, this content will help you in understanding the various evolutions of asset management throughout the last decades and in broadening your knowledge of finance beyond the classical 101 course.

Smart beta funds have become a hot issue among investors in recent years. Smart beta is a game-changing invention (or just a new marketing idea?) that addresses an unmet need among investors: a higher return for lower risk, net of transaction and administrative costs. In a way, these tactics create a new market. As a result, smart beta is gaining traction and influencing the asset management market.

Related posts on the SimTrade blog

   ▶ Youssef LOURAOUI Factor Investing

   ▶ Youssef LOURAOUI Origin of Factor Investing

Factor series

   ▶ Youssef LOURAOUI Size Factor

   ▶ Youssef LOURAOUI Value Factor

   ▶ Youssef LOURAOUI Yield Factor

   ▶ Youssef LOURAOUI Momentum Factor

   ▶ Youssef LOURAOUI Quality Factor

   ▶ Youssef LOURAOUI Growth Factor

   ▶ Youssef LOURAOUI Minimum Volatility Factor

Useful resources

Academic research

Amenc, N., Ducoulombier, F., Goltz, F. and Ulahel, J., 2016. Ten misconceptions about smart beta. EDHEC Risk Institute Working paper.

Banz, R.W., 1981. The relationship between return and market value of common stocks. Journal of Financial Economics, Volume 9, pp. 3-18.

Fama, E.F., French, K.R., 1992. The cross-section of expected stock returns. The Journal of Finance, 47: 427-465.

Grossman, S., Stiglitz, J., 1980. On the impossibility of Informationally efficient markets. The American Economic Review, 70(3), 393-408.

Jensen, M.C. 1968. The performance of mutual funds from 1945–1964. The Journal of Finance, 23:389-416.

Malkiel, B., 1995. Returns from Investing in Equity Mutual Funds 1971 to 1991. The Journal of Finance, 50(2):549-572.

Business analysis

BlackRock Research, 2021. What is Factor Investing?

About the author

The article was written in September 2021 by Youssef LOURAOUI (ESSEC Business School, Global Bachelor of Business Administration, 2017-2021).