In this article, Youssef Louraoui (Bayes Business School, MSc. Energy, Trade & Finance, 2021-2022) discusses the concept of hedging and its application in the crude oil market.
This article is structured as follow: we introduce the concept of hedging in the first place. Then, we present the mathematical foundation of the Minimum Variance Hedging Ratio (MVHR). We wrap up with an empirical analysis applied to the crude oil market with a conclusion.
Introduction
Hedging is a strategy that considers taking both positions in the physical as well as the futures market to offset market movement and lock-in the price. When an individual or a corporation decides to hedge risk using futures markets, the objective is to take the opposite position to neutralize the risk as far as possible. If the company is long on the physical side (say a producer), they will mitigate the hedging by taking a short exposure in the future market. The opposite is true for a market player who is short physical. He will seek to have a long exposure in the futures market to offset the risk (Hull, 2006).
Short hedge
Selling futures contracts as insurance against an expected decrease in spot prices is known as a short hedge. For instance, an oil producer might sell crude futures or forwards if they anticipate a decline in the price of the commodity.
Long hedge
A long hedge involves purchasing futures as insurance against an increase in price. For instance, an aluminum smelter will purchase electricity futures and forward contracts, allowing the business to secure its electricity needs in the event that the physical market rises in value.
Mathematical foundations
Linear regression model
We can consider the hedge ratio as the slope of the following linear regression representing the relationship between the spot and futures price changes:

where
- ∆St the change in the spot price at time t
- β represents the hedging parameter
- ∆Ft the change in the futures price at time t
The linear regression model above can also be expressed with returns instead of price changes:
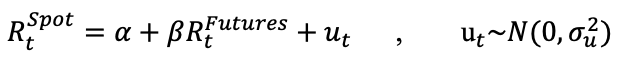
- RSpot the return in the spot market at time t
- RFutures the return in the futures market at time t
Hedge ratio
We can derive the following formula for the Minimum Variance Hedging Ratio (MVHR) denoted by the Greek letter beta β:
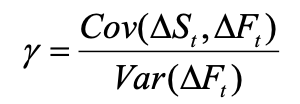
where
- Cov(∆St,∆Ft) the co movement of the change in spot price and futures price at time t
- Var(∆Ft) represents the variance of the change in price of the future price at time t
The variance and covariance of spot and futures prices are time-varying due to the changing distributional features of these values across time. Accordingly, taking into consideration such dynamics in the variance and covariance term of asset prices is a more acceptable method of establishing the minimal variance hedge ratio. There is a number of different methods that account for the dynamic nature of the minimal variance hedge ratio estimation (Alizadeh, 2022):
- Simple Rolling OLS
- Rolling VAR or VECM
- GARCH models
- Markov Regime Switching
- Minimising VaR and CVaR methods
Empirical approach to hedging analysis
Periods
We downloaded ten-year worth of weekly data for the WTI crude oil spot and futures contract from the US Energy Information Administration (EIA) website. We decompose the data into two periods to assess the effectiveness of the different hedging strategies: 1st period from 23rd March 2012 to 24th March 2017 and 2nd period from 31st March 2017 to 22nd March 2022.
First period: March 2012 – March 2017
The first five years are used to estimate the Minimum Variance Hedging Ratio (Ederington, 1979). We can approach this question by using the “=slope(known_ys, known_xs)” function in Excel to obtain the gamma coefficient that would represent the MVHR. When computing the slope for the first period of the sample from 23rd March 2012 to 24th March 2017, we get a MVHR equal to 0.985. We obtain a correlation (ρ) using the Excel formula “=correl(array_1, array_2)” highlighting the logarithmic return of WTI spot and futures contract price, which yields 0.986. We can see from the figure 1 how the spot and futures prices converge closely and track each other in a very tight corridor, with very minor divergence. The regression plot between spot and futures contract returns for the first period is shown in Figure 2. This suggests that the hedger should take an opposite position in the futures market equal to 0.985 contract for each spot contract in order to minimise risk when using futures contracts as a hedging tool.
Figure 1. WTI spot and futures (1 month) prices
March 2012 – March 2017
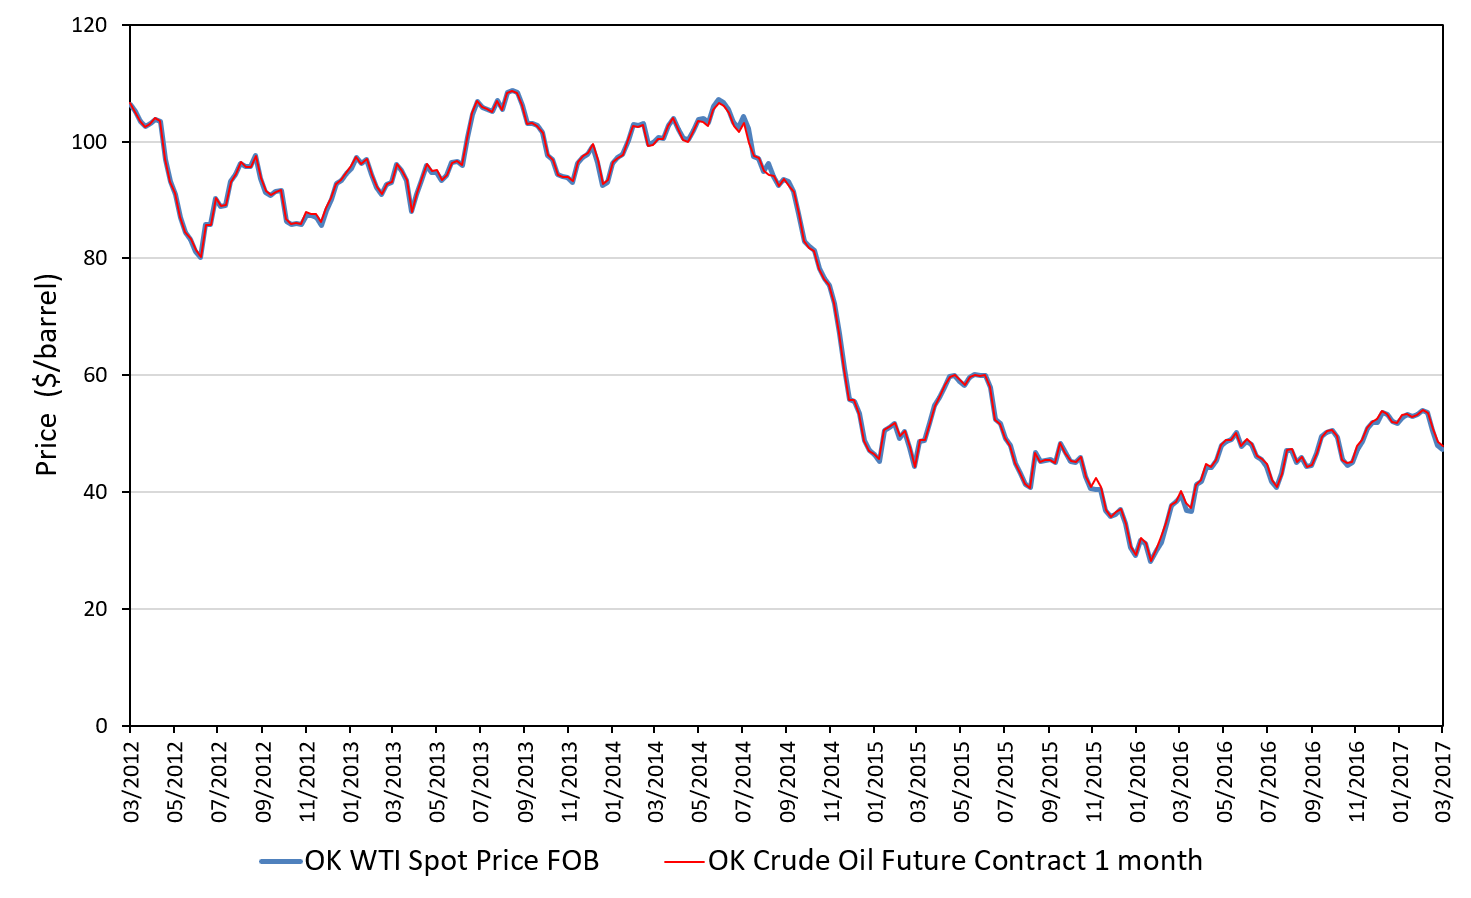
Source: computation by the author (data: EIA & Refinitiv Eikon).
Figure 2. Linear regression of WTI spot return on futures (1 month) return
March 2012 – March 2017
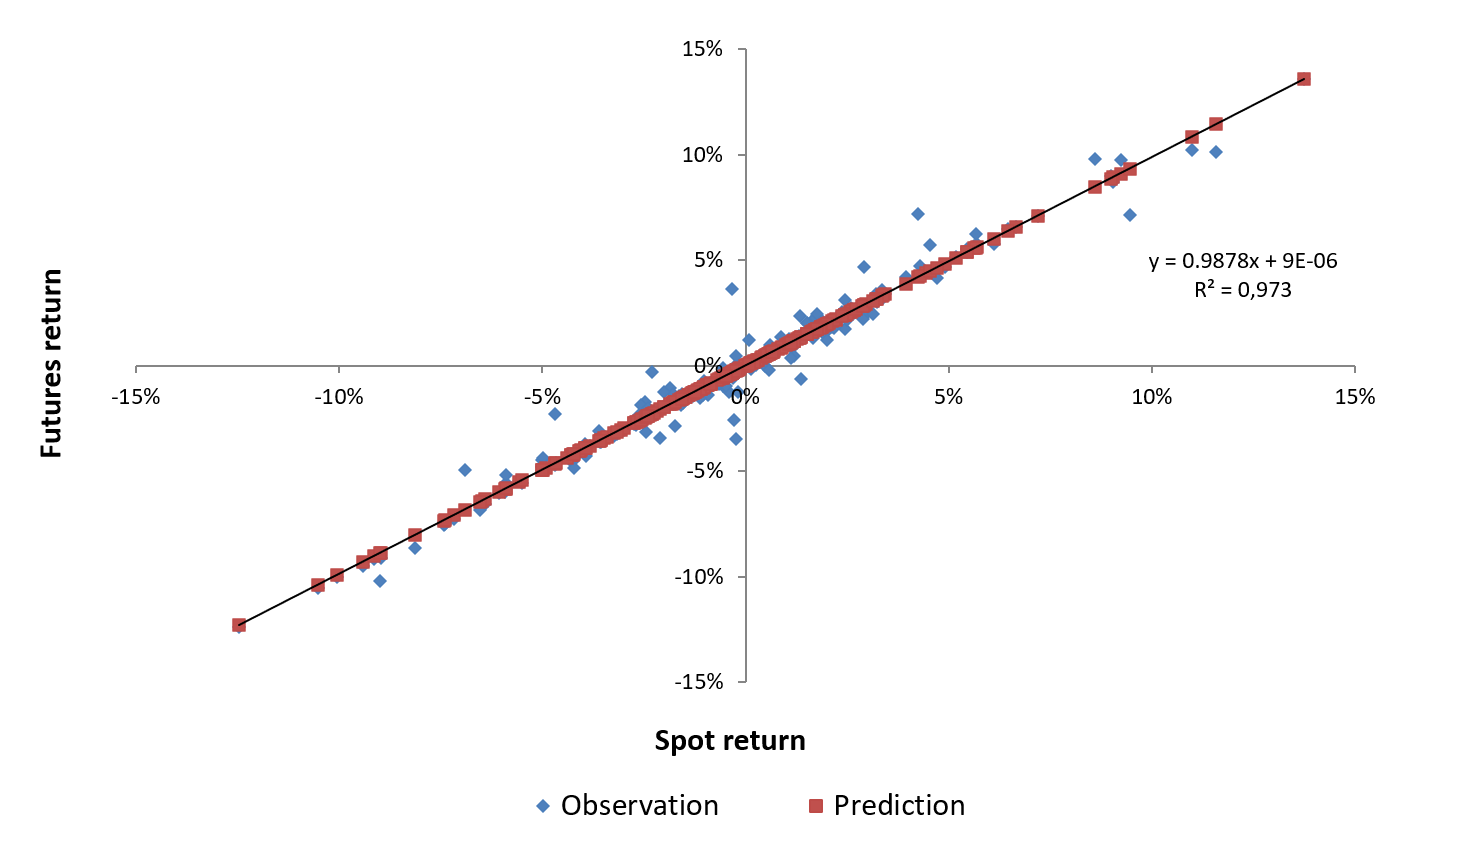
Source: computation by the author (data: EIA & Refinitiv Eikon).
A one-to-one hedge ratio (also known as naïve hedge) means that for every dollar of exposure in the physical market, we take one dollar exposure in the futures market. The effectiveness of this strategy is tied closely to how the spot/futures market correlation behaves. The effectiveness of this strategy would be equal to the correlation of the spot and the futures market prices in the second period.
Second period: March 2017 – March 2022
We compute the MVHR for the second period with the same approach retained in the first part by using the “=slope(known_ys, known_xs)” function in Excel to obtain the gamma coefficient that would represent the MVHR. When computing the slope for the first period of the sample from 23rd March 2017 to 24th March 2022, we get a MVHR equal to 1.095. This means that for every spot contract that we own, we need to buy 0.985 futures contracts to hedge our market risk. As previously stated, the same trend can be seen in figure 3, where spot and futures prices converge closely and track each other with just little deviation. Figure 4 represents the regression plot between spot and futures contract returns for the second period. This means that in order to reduce risk to the minimum possible amount when futures contract used as hedging instrument, for each spot contract the hedger should take an opposite position equivalent to 1.05 contract in the futures market.
Figure 3. WTI spot and futures (1 month) prices
March 2017 – March 2022.
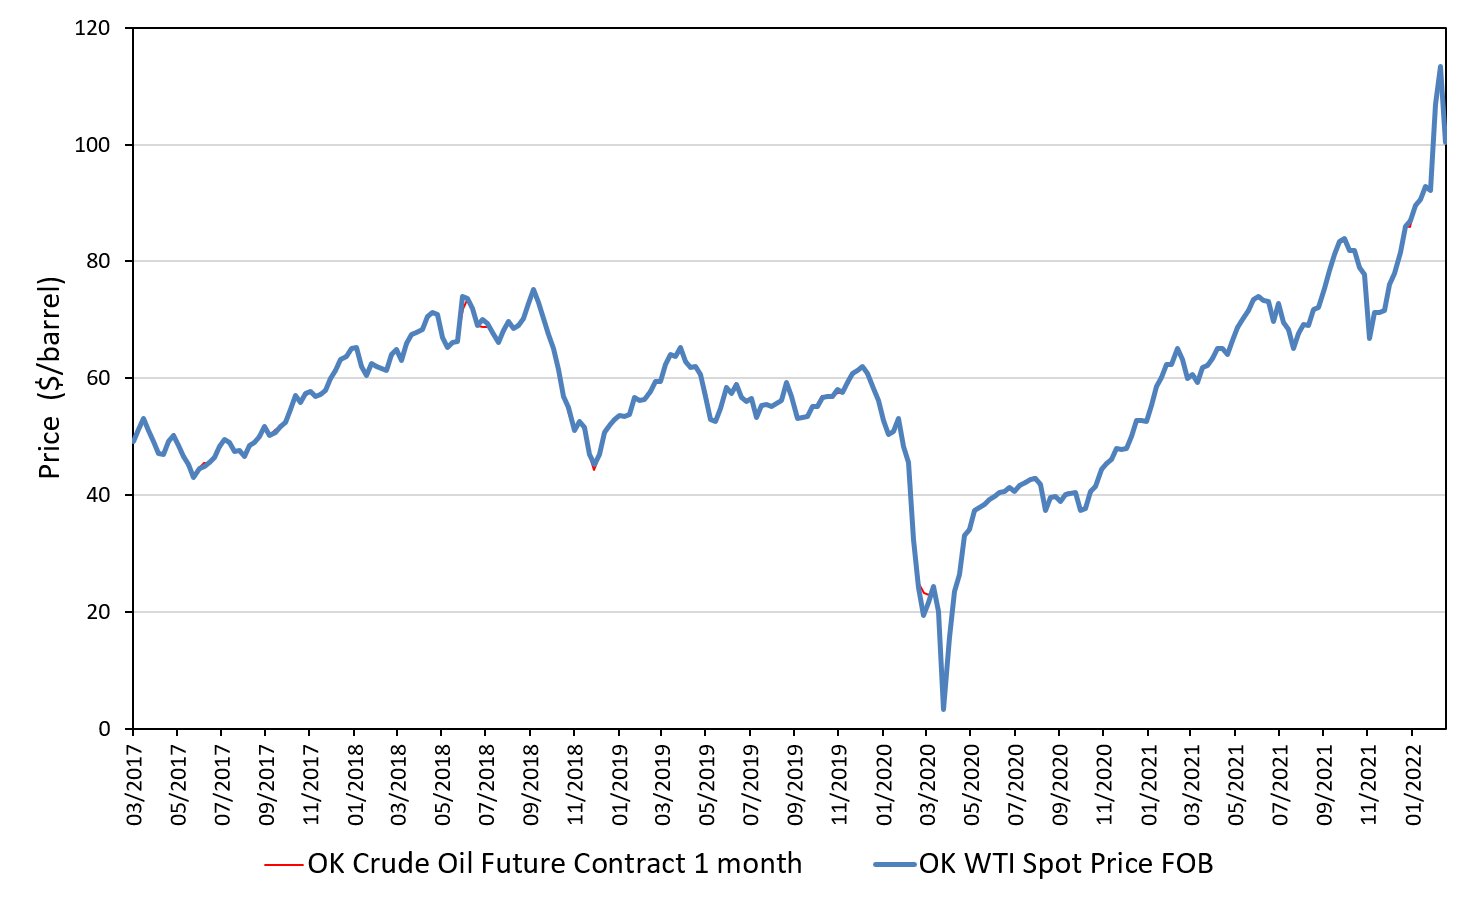
Source: computation by the author (data: EIA & Refinitiv Eikon).
Figure 4. Linear regression of WTI spot return on futures (1 month) return
March 2017 – March 2022
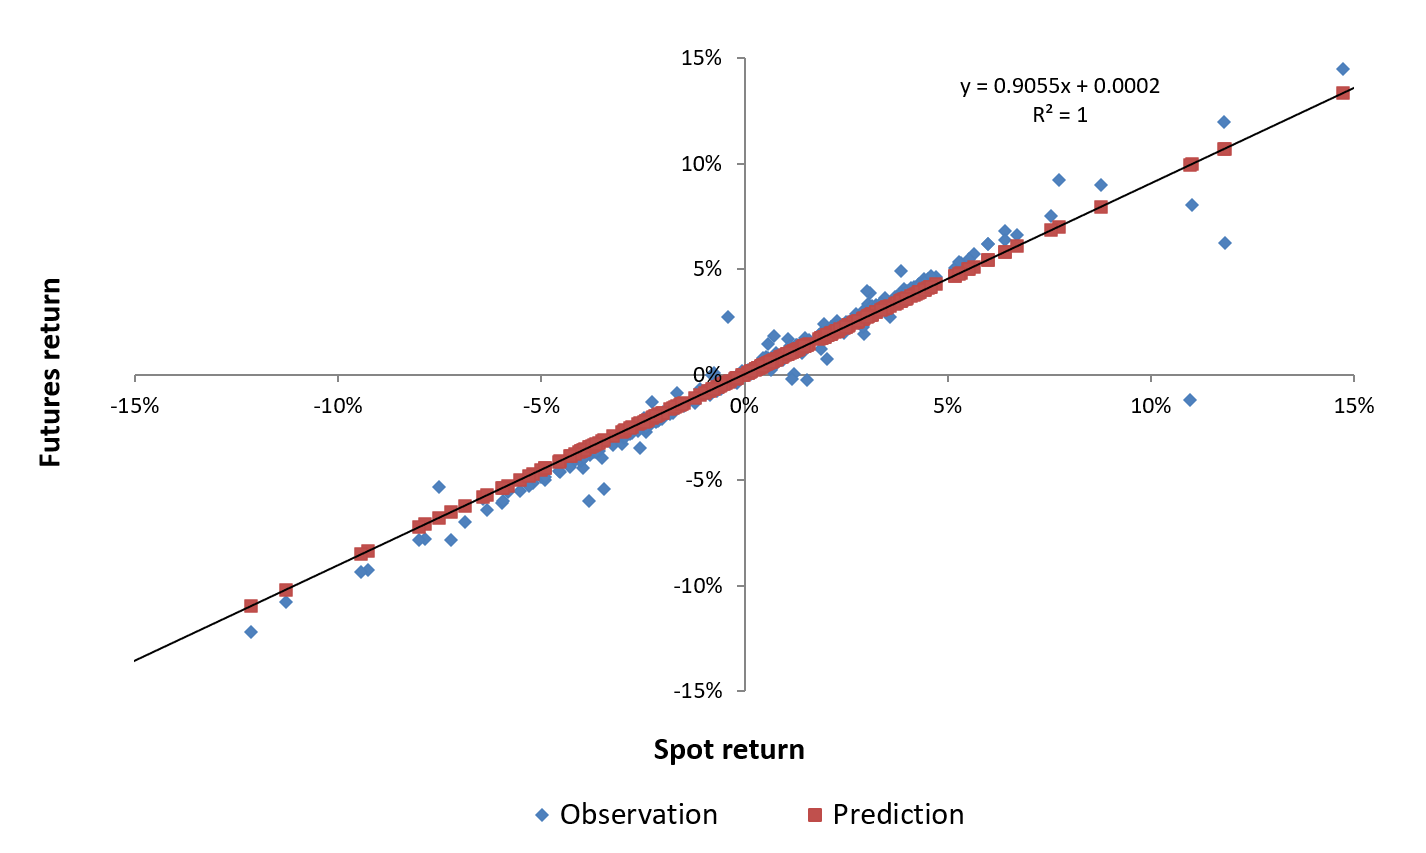
Source: computation by the author (data: EIA & Refinitiv Eikon).
We can approach this hedging exercise in a time-varying framework. Some academics consider that covariance and correlation are not static parameters, so they came up with models to accommodate for the time-varying nature of these two parameters. We can compute the rolling regression as the rolling slope by changing the timeframe to allow for dynamic coefficients. For this example, we computed rolling regression for one month, three-month, one year and two years. We can plot the rolling regression in the graph below (Figure 5). We can average the rolling gammas and obtain an average for each rolling period (Table 1):
Table 1. Table capturing the rolling hedge ratio for WTI across different horizons.
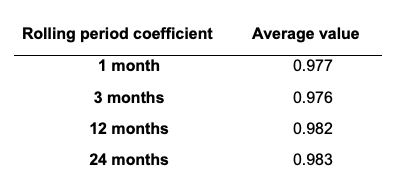
Source: computation by the author (data: EIA & Refinitiv Eikon).
Figure 5. WTI hedge ratio for different rolling window sizes.
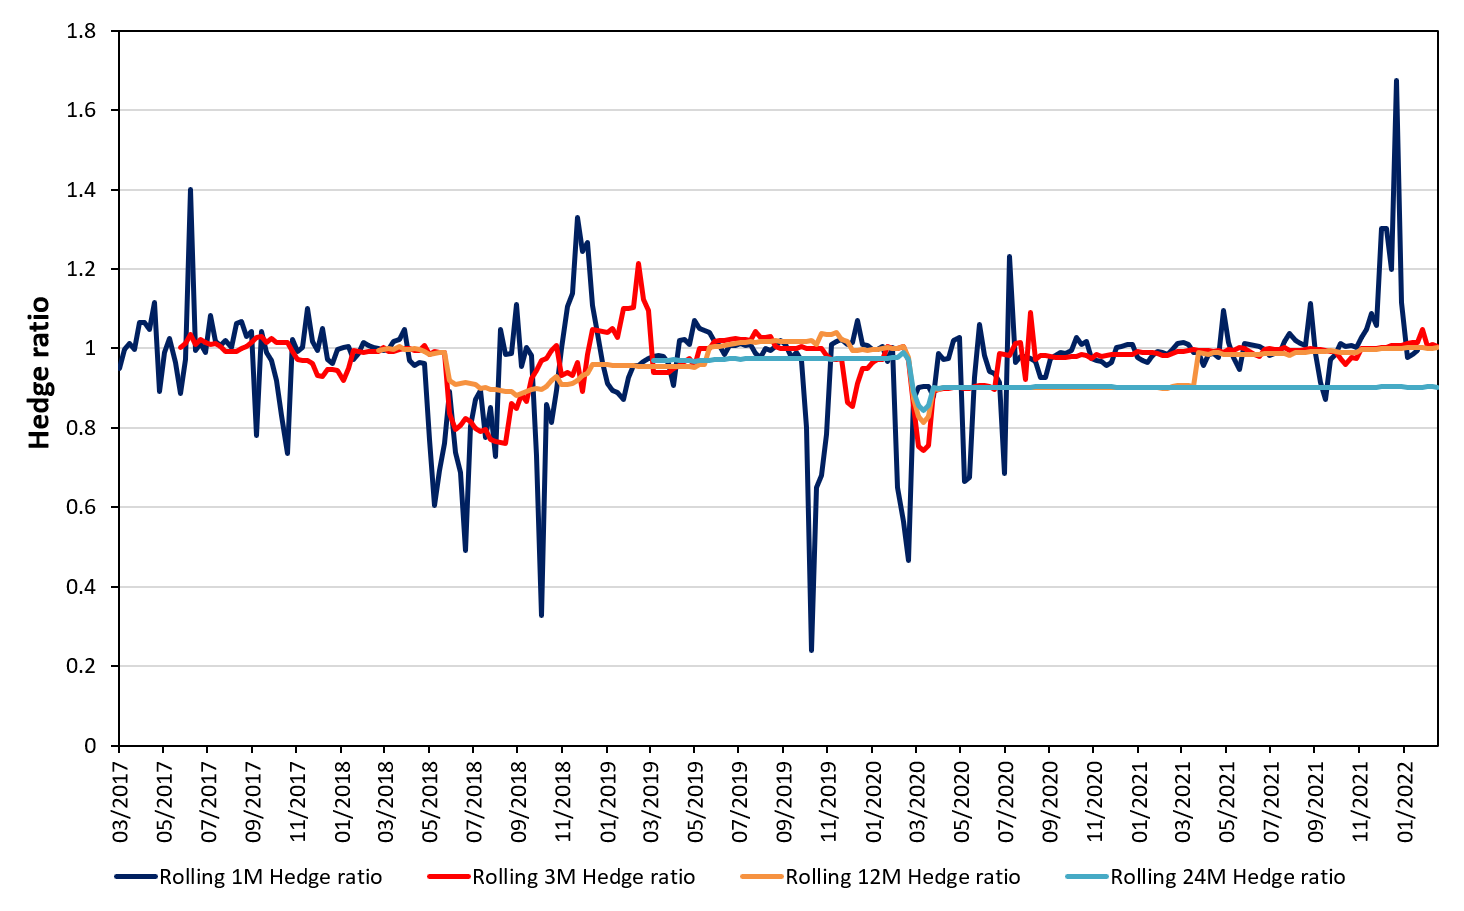
Source: computation by the author (data: EIA & Refinitiv Eikon).
Conclusion
In an realistic setting, these results may be oversimplified. In some instances, cross hedging is required to calculate this strategy. This technique is used to hedge an asset’s value by relying on another asset to replicate its behaviour. Let’s use an airline as an example of a corporation seeking to hedge its jet fuel expenditures. As there is currently no jet fuel futures contract, the airline can hedge its basis risk with heating oil (an equivalent product with a valid futures market). As stated previously, the degree of correlation between the spot price and the futures price impacts the precision of cross-hedging (and hedging in general). To get the desired results and avoid instances in which we overhedge or underhedge our exposure, hedging must finally be performed appropriately.
You can find below the Excel spreadsheet that complements the explanations about of this article.

Why should I be interested in this post?
Understanding hedging techniques can be a valuable tool to implement to reduce the downside risk of an investment. Implementing a good hedging strategy can help professionals to better monitor and modify their trading strategies based different market environments.
Related posts on the SimTrade blog
▶ Youssef LOURAOUI My experience as an Oil Analyst at an oil and energy trading company
▶ Youssef LOURAOUI Introduction to Hedge Funds
▶ Youssef LOURAOUI Global macro strategy
▶ Youssef LOURAOUI Minimum volatility factor
▶ Youssef LOURAOUI VIX index
▶ Jayati WALIA Black Scholes Merton option pricing model
▶ Jayati WALIA Implied volatility
▶ Youssef LOURAOUI Portfolio
Useful resources
Academic research
Adler M. and B. Dumas (1984) “Exposure to Currency Risk: Definition and Measurement” Financial Management 13(2) 41-50.
Alizadeh A. (2022) Volatility of energy prices: Estimation and modelling. Oil and Energy Trading module at Bayes Business School. 46-51.
Ederington L.H. (1979). The Hedging Performance of the New Futures Markets. Journal of Finance, 34(1) 157-170.
Hull C.J. (2006). Options, futures and Other Derivatives, sixth edition. Pearson Prentice Hall. 99-373.
Business
US Energy Information Administration (EIA)
About the author
The article was written in January 2023 by Youssef LOURAOUI (Bayes Business School, MSc. Energy, Trade & Finance, 2021-2022).

 Source : computation by the author.