In this article, Youssef LOURAOUI (Bayes Business School, MSc. Energy, Trade & Finance, 2021-2022) presents the systematic risk of financial assets, a key concept in asset pricing models and investment management theories more generally.
This article is structured as follows: we introduce the concept of systematic risk. We then explain the mathematical foundation of this concept. We present an economic understanding of market risk on recent events.
Portfolio Theory and Risk
Markowitz (1952) and Sharpe (1964) developed a framework on risk based on their significant work in portfolio theory and capital market theory. All rational profit-maximizing investors seek to possess a diversified portfolio of risky assets, and they borrow or lend to get to a risk level that is compatible with their risk preferences under a set of assumptions. They demonstrated that the key risk measure for an individual asset is its covariance with the market portfolio under these circumstances (the beta).
The fraction of an individual asset’s total variance attributable to the variability of the total market portfolio is referred to as systematic risk, which is assessed by the asset’s covariance with the market portfolio. Systematic risk can be decomposed into the following categories:
Interest rate risk
We are aware that central banks, such as the Federal Reserve, periodically adjust their policy rates in order to boost or decrease the rate of money in circulation in the economy. This has an effect on the interest rates in the economy. When the central bank reduces interest rates, the money supply expands, allowing companies to borrow more and expand, and when the policy rate is raised, the reverse occurs. Because this is cyclical in nature, it cannot be diversified.
Inflation risk
When inflation surpasses a predetermined level, the purchasing power of a particular quantity of money reduces. As a result of the fall in spending and consumption, overall market returns are reduced, resulting in a decline in investment.
Exchange Rate Risk
As the value of a currency reduces in comparison to other currencies, the value of the currency’s returns reduces as well. In such circumstances, all companies that conduct transactions in that currency lose money, and as a result, investors lose money as well.
Geopolitical Risks
When a country has significant geopolitical issues, the country’s companies are impacted. This can be mitigated by investing in multiple countries; but, if a country prohibits foreign investment and the domestic economy is threatened, the entire market of investable securities suffers losses.
Natural disasters
All companies in countries such as Japan that are prone to earthquakes and volcanic eruptions are at risk of such catastrophic calamities.
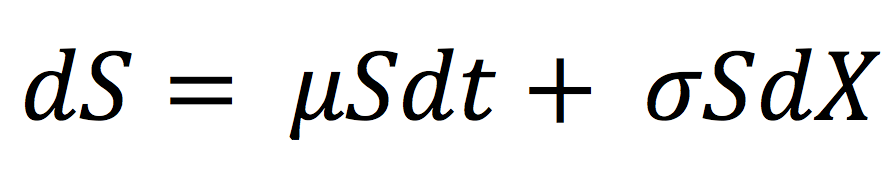
Following the Capital Asset Pricing Model (CAPM), the return on asset i, denoted by Ri can be decomposed as
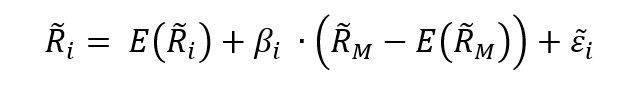
Where:
- Ri the return of asset i
- E(Ri) the risk premium of asset i
- βi the measure of the risk of asset i
- RM the return of the market
- E(RM) the risk premium of the market
- RM – E(RM) the market factor
- εi represent the specific part of the return of asset i
The three components of the decomposition are the expected return, the market factor and an idiosyncratic component related to asset only. As the expected return is known over the period, there are only two sources of risk: systematic risk (related to the market factor) and specific risk (related to the idiosyncratic component).
The beta of the asset with the market is computed as:
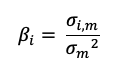
Where:
- σi,m : the covariance of the asset return with the market return
- σm2 : the variance of market return
The total risk of the asset measured by the variance of asset returns can be computed as:
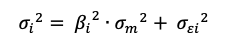
Where:
- βi2 * σm2 = systematic risk
- σεi2 = specific risk
In this decomposition of the total variance, the first component corresponds to the systematic risk and the second component to the specific risk.
Systematic risk analysis in recent times
The volatility chart depicts the evolution of implied volatility for the S&P 500 and US Treasury bonds – the VIX and MOVE indexes, respectively. Implied volatility is the price of future volatility in the option market. Historically, the two markets have been correlated during times of systemic risk, like as in 2008 (Figure 1).
Figure 1. Volatility trough time (VIX and MOVE index).
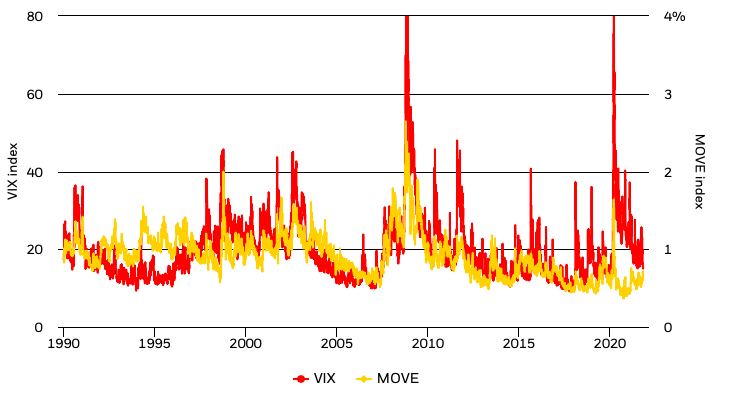
Sources: BlackRock Risk and Quantitative Analysis and BlackRock Investment Institute, with data from Bloomberg and Bank of America Merrill Lynch, October 2021 (BlackRock, 2021).
The VIX index has declined following a spike in September amid the equity market sell-off. It has begun to gradually revert to pre-Covid levels. The periodic, albeit brief, surges throughout the year underscore the underlying fear about what lies beyond the economic recovery and the possibility of a wide variety of outcomes. The MOVE index — a gauge of bond market volatility – has remained relatively stable in recent weeks, despite the rise in US Treasury yields to combat the important monetary policy to combat the effect of the pandemic. This could be a reflection of how central banks’ purchases of government bonds are assisting in containing interest rate volatility and so supporting risk assets (BlackRock, 2021).
The regime map depicts the market risk environment in two dimensions by plotting market risk sentiment and the strength of asset correlations (Figure 2).
Figure 2. Regime map for market risk environment.
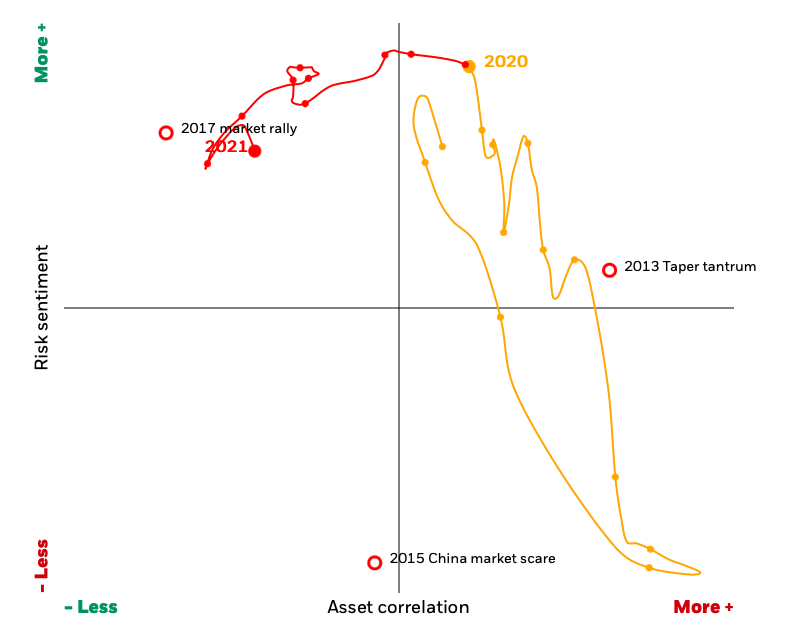
Source: BlackRock Risk and Quantitative Analysis and BlackRock Investment Institute, October 2021 (BlackRock, 2021).
Positive risk sentiment means that riskier assets, such as equities, are outperforming less risky ones. Negative risk sentiment means that higher-risk assets underperform lower-risk assets.
Due to the risk of fast changes in short-term asset correlations, investors may find it challenging to guarantee their portfolios are correctly positioned for the near future. When asset correlation is higher (as indicated by the right side of the regime map), diversification becomes more difficult and risk increases. When asset prices are less correlated (on the left side of the map), investors have greater diversification choices.
When both series – risk sentiment and asset correlation – are steady on the map, projecting risk and return becomes easier. However, when market conditions are unpredictable, forecasting risk and return becomes substantially more difficult. The map indicates that we are still in a low-correlation environment with a high-risk sentiment, which means that investors are rewarded for taking a risk (BlackRock, 2021). In essence, investors should use diversification to reduce the specific risk of their holding coupled with macroeconomic fundamental analysis to capture the global dynamics of the market and better understand the sources of risk.
Why should I be interested in this post?
Market risks fluctuate throughout time, sometimes gradually, but also in some circumstances dramatically. These adjustments typically have a significant impact on the right positioning of a variety of different types of investment portfolios. Investors must walk a fine line between taking enough risks to achieve their objectives and having the proper instruments in place to manage sharp reversals in risk sentiment.
Related posts on the SimTrade blog
▶ Louraoui Y. Systematic risk and specific risk
▶ Youssef LOURAOUI Specific risk
▶ Youssef LOURAOUI Beta
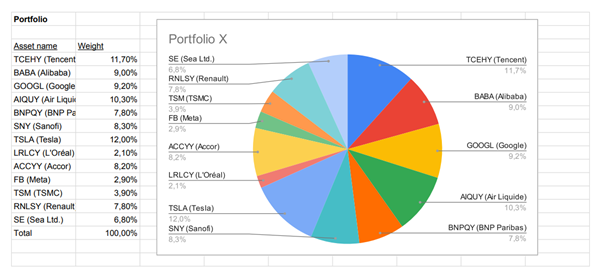
▶ Youssef LOURAOUI Portfolio
▶ Youssef LOURAOUI Markowitz Modern Portfolio Theory
▶ Jayati WALIA Capital Asset Pricing Model (CAPM)
Useful resources
Academic research
Markowitz, H. 1952. Portfolio Selection. The Journal of Finance, 7(1): 77-91.
Mossin, J. 1966. Equilibrium in a Capital Asset Market. Econometrica, 34(4): 768-783.
Sharpe, W.F. 1963. A Simplified Model for Portfolio Analysis. Management Science, 9(2): 277-293.
Sharpe, W.F. 1964. Capital Asset Prices: A Theory of Market Equilibrium under Conditions of Risk. The Journal of Finance, 19(3): 425-442.
Business analysis
BlackRock, 2021. Market risk monitor
About the author
The article was written in April 2022 by Youssef LOURAOUI (Bayes Business School, MSc. Energy, Trade & Finance, 2021-2022).