

In this article, Youssef LOURAOUI (ESSEC Business School, Global Bachelor of Business Administration, 2017-2021) presents the growth factor, which is based on a risk factor that aims to get exposure to firms with high growth potential based on a variety of parameters such as historical profits, sales, and expected earnings.
This article is structured as follows: we begin by defining the growth factor and reviewing academic studies. The MSCI Growth Factor Index, which is well used as a benchmark in the asset management industry, is next presented in terms of performance and risk-return trade-off. We showcase the ETF market for investors looking to profit from the growth factor.
Definition
In the world of investing, a factor is any aspect that helps explain an asset’s long-term risk and return performance. In the late 1970s, the portfolio management industry’s objective was to capture the market return on a portfolio. As a result of Markowitz and Tobin’s earlier research, William Sharpe, John Lintner, and Jan Mossin independently developed the Capital Asset Pricing Model (CAPM). Because it enabled investors to properly value assets in terms of systematic risk, the CAPM was a significant evolutionary step forward in the theory of capital market equilibrium (Mangram, 2013).
Eugene Fama and Kenneth French, following the CAPM’s original work, developed the Fama-French Three-Factor model in 1993 to solve the CAPM’s inadequacies. It claims that, in addition to the market risk component of the CAPM, two other factors have an effect on the returns on securities and portfolios: market capitalization (called the “size” factor) and the book-to-market ratio (referred to as the “value” factor). Other factor characteristics were developed to capture some additional performance as financial research advanced and significant contributions were made.
Academic research
The fundamental work of Fama and French may be traced back to the most significant academic works in the factor investing literature. Since the growth factor has a poor academic literature review, we will focus on the work of Fama and French (1993). In response to the CAPM’s limitations, Eugene Fama and Kenneth French developed the Fama-French three-factor model in 1993. It argues that, in addition to the market risk component provided by the CAPM, two additional factors, market capitalization (referred as “size”) and book-to-market ratio (referred as “value”), influence the returns on securities and portfolios. The major rationale for including these attributes, according to Fama and French, is that both size and book-to-market ratios are connected to the economic fundamentals of the firm issuing the securities (Fama and French, 1993).
In 2014, Fama and French claimed that their original three-factor model from 1993 was insufficient to explain certain observed differences in expected returns. As a result, Fama and French expanded their three-factor model to include two more factors: profitability and investment. The theoretical implications of the dividend discount model (DDM), which claim that profitability and investment contribute to the explanation of the returns derived from the High Minus Low premium element in the first model, justify these two aspects (Fama and French, 2015). High Minus Low can be defined as the value premium that accounts for the spread between the return of small capitalization stocks compared to large capitalization stocks.
Active managers have utilized the Growth factor to capture corporate growth possibilities using historical profits, sales, and anticipated earnings, and it has been employed as a possible source of alpha. The impact of unintended exposure, which shows that assets with strong growth can also have high valuations, high volatility, low yield, and bad quality, which can negatively influence portfolio performance, can be a difficulty when using simple selection methods to capture growth (MSCI Factor research, 2021).
Growth investing, often known as capital growth or capital appreciation, has been a prominent investment strategy since the 1950s and is one of active managers’ most intuitive and commonly used investment strategies (MSCI Factor research, 2021). Growth is a well-known investment strategy that, according to risk models, has a strong explanatory power in risk forecasting. In comparison to the MSCI ACWI Index, the pure growth factor has shown an impressive long-term return as well as low or negative correlation with other factors, which may assist diversify a multi-factor portfolio by minimizing short-term cyclicality.
Example of a “growth” stock
Any stock in a firm that is expected to expand at a pace significantly higher than the market average is considered a growth stock. Dividends are seldom paid on these stocks. This is because growth stock issuers are often businesses that seek to reinvest any profits in order to increase growth in the short term. When people buy growth stocks, they expect to profit from capital gains when they sell them later (Investopedia, 2021).
For instance, Amazon Inc. (AMZN) has been regarded as a growth stock for quite some time. It is, and has been for some time, one of the world’s largest companies in 2020. In terms of market value as of July 31, 2021, Amazon is among the top five U.S. stocks.
MSCI Growth Factor Index
MSCI Factor Indexes are rules-based, transparent indexes that target equities with favorable factor qualities, as determined by academic discoveries and empirical outcomes, and are designed for easy implementation, replicability, and usage in both standard indexed and active portfolios.
MSCI Growth Factor Index accounts for unexpected risks and exposures while also extending the notion of growth at a reasonable price (GARP) to include volatility, yield, and quality (MSCI Factor research, 2021). The impact of unintended exposure, which shows that assets with strong growth can also have high valuations, high volatility, low yield, and bad quality, which can negatively influence portfolio performance, can be a difficulty when using simple selection methods to capture growth. MSCI’s growth target index accounts for unexpected risks and exposures while also extending the notion of growth at a reasonable price (GARP) to include volatility, yield, and quality. Growth at a reasonable price (GARP), a long-held notion among growth investors, aims to avoid overpaying for a stock’s prospective growth. The GARP idea may be expanded by limiting value exposure, ensuring that the long-term premium for growth is not reduced by the unintentional and accidental impact of assets with high values, i.e., negative value exposure.
Performance of the MSCI Growth Factor Index
Figure 1 compares the MSCI Growth Factor Index’s performance to those of other factors from May 1999 to May 2020. All indices are rebalanced on a 100-point scale to ensure consistency in performance and to facilitate factor comparisons.
Figure 1. Performance of the MSCI Growth Factor Index from 1999-2020.
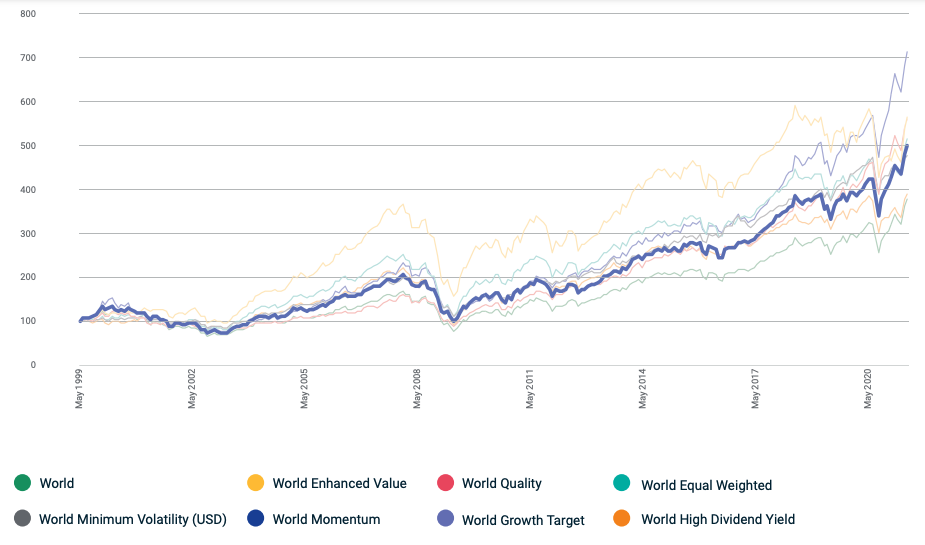
Source: MSCI Factor research, 2021.
Over the long run, the MSCI World Growth Index has traditionally delivered excess returns, with a yearly return of 1.41 percent over the MSCI World Index since 1999, as seen above. (MSCI Factor research, 2021).
Risk-return profile of MSCI Growth Factor Index
Figure 2 shows the MSCI Growth Factor Index compared to other factors over the period May 1999 – May 2020 in terms of risk/reward. The risk-return trade-off states that the potential return rises with an increase in risk. Individuals connect low levels of uncertainty about future returns with low potential returns, while high levels of uncertainty or risk are associated with large potential returns. According to the risk-return trade-off, an investor’s money can generate higher returns only if the investor is willing to endure a higher risk of loss and return (Figure 2).
Figure 2. Risk-return profile of MSCI Growth Factor Index compared to a peer group.
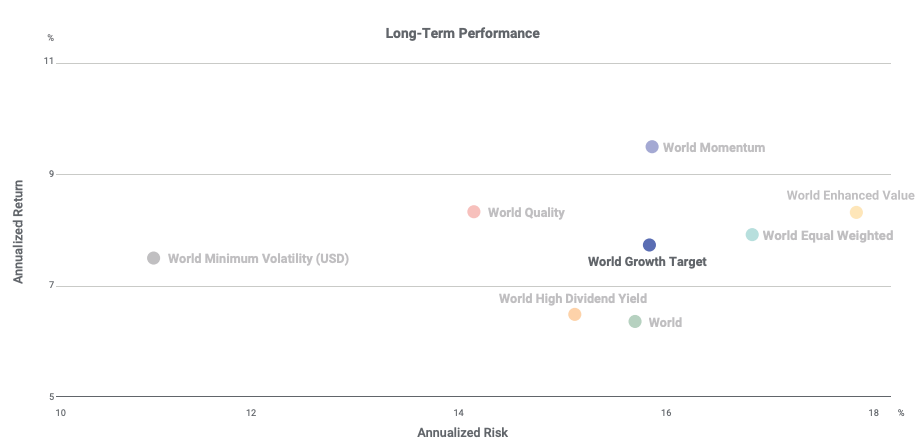
Source: MSCI Factor research, 2021.
Growth stocks are defined as firms that are projected to expand their sales, profits, or margins faster than the industry or market average. The growth factor may provide value to a multi-factor portfolio by mitigating short-term cyclicality and providing asset managers with diversity and a stable source of premia. MSCI developed the Growth Target Index, based on Barra’s equity index model characteristics, through an optimization process that captures the growth component while limiting unwanted exposures that might erode the growth premium (MSCI Factor research, 2021).
ETFs for the growth factor
Let us recall that an Exchange-Traded Fund (ETF) is an investment vehicle that seeks to mirror the performance of a benchmark like an equity index and is traded on a continuous basis during the day like stocks. By investing in ETFs, an investor gains access to a plethora of diversification options through several asset classes (equity, bonds, currency, commodity, real estate, etc.).
In terms of proportion of assets under management, Figure 3 depicts the total ETF distribution among the leading suppliers of growth factor ETFs. Despite the lack of a real monopoly, the market is more equally distributed.
It’s worth mentioning the ARK Innovation ETF, which accounts for almost a third of the entire growth ETF market that was nominated. This ETF invests on biotech, robotics, artificial intelligence, blockchain, and finance technology, among other areas. It’s a thematically focused fund that invests in a limited number of high-growth companies and makes large swings in them.
The fund’s top 10 holdings make up nearly half of the overall portfolio. The company’s largest investment is Tesla (TSLA), which accounts for about 11% of its assets, followed by Square (SQ), Teladoc Health (TDOC), and Roku (ROKU), which account for 6.5 percent, 6.3 percent, and 5.5 percent, respectively. The top 10 companies include Zillow Group (Z), Zoom Video Communications (ZM), Baidu (BIDU), Shopify (SHOP), Spotify Technology (SPOT), and Exact Sciences (EXAS). The ARK Innovation ETF (ticker: ARKK) had a 153 percent return in 2020 (etf.com, 2021).
Figure 3. Growth factor ETF market.
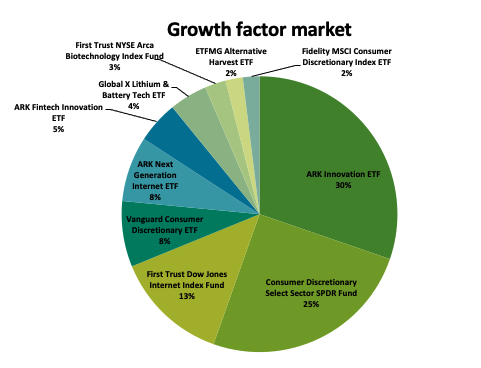
Source: etf.com (2021).
Table 1 gives more detailed information about the biggest growth factor ETF providers: the asset under management (AUM), expense ratio (ER) and the segment for the investments.
Table 1. Ranking of the biggest Growth ETF providers.
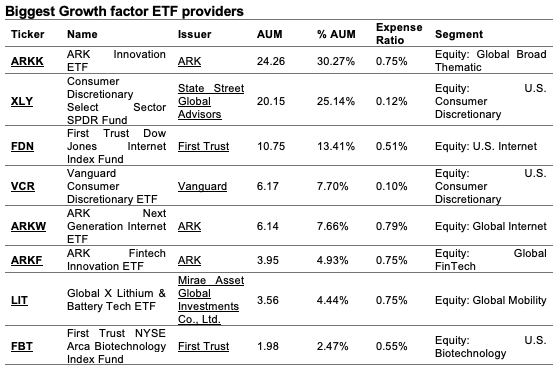
Source: etf.com (2021).
Why should I be interested in this post?
If you are an undergraduate or graduate student in a business school or at the university, you may have seen in your 101 finance course the CAPM related to the market factor. This post makes aware of the existence of another risk factor priced by the market.
If you are an investor, you may consider adding an exposure to growth factor to enhance the overall portfolio return.
Related posts on the SimTrade blog
▶ Youssef LOURAOUI Minimum Volatility
▶ Youssef LOURAOUI Value Factor
▶ Youssef LOURAOUI Yield Factor
▶ Youssef LOURAOUI Momentum Factor
▶ Youssef LOURAOUI Size Factor
▶ Youssef LOURAOUI Quality Factor
Useful resources
Academic research
Fama, E.F., French, K.R. 1992. The Cross-Section of Expected Stock Returns. The Journal of Finance, 47: 427-465.
Fama, E.F., French, K.R., A five-factor asset pricing model, Journal of Financial Economics, 116(1): 2015, 1-22.
Mangram, M.E., 2013. A simplified perspective of the Markowitz Portfolio Theory. Global Journal of Business Research, 7(1): 59-70.
Business analysis
etf.com, 2021. Biggest Growth ETF providers.
MSCI Investment Research, 2021. Factor Focus: Growth.
Investopedia, 2021. Growth Stock.
About the author
The article was written in September 2021 by Youssef LOURAOUI (ESSEC Business School, Global Bachelor of Business Administration, 2017-2021).
8 thoughts on “Growth Factor”
Comments are closed.