Interest Rate Swaps

Akshit Gupta

This article written by Akshit GUPTA (ESSEC Business School, Grande Ecole Program – Master in Management, 2019-2022) presents the derivative contract of interest rate swaps used to hedge interest rate risk in financial markets.

Introduction

In financial markets, interest rate swaps are derivative contracts used by two counterparties to exchange a stream of future interest payments with another for a pre-defined number of years. The interest payments are based on a pre-determined notional principal amount and usually include the exchange of a fixed interest rate for a floating interest rate (or sometimes the exchange of a floating interest rate for another floating interest rate).

While hedging does not necessarily eliminate the entire risk for any investment, it does limit or offset any potential losses that the investor can incur.

Forward rate agreements (FRA)

To understand interest rate swaps, we first need to understand forward rate agreements in financial markets.

In an FRA, two counterparties agree to an exchange of cashflows in the future based on two different interest rates, one of which is a fixed rate and the other is a floating rate. The interest rate payments are based on a pre-determined notional amount and maturity period. This derivative contract has a single settlement date. LIBOR (London Interbank Offered Rate) is frequently used as the floating rate index to determine the floating interest rate in the swap.

The payoff of the contract is as shown in the formula below:

(LIBOR – Fixed Interest Rate) * Notional amount * Number of days / 100

Interest rate swaps (IRS)

An interest rate swap is a hedging mechanism wherein a pre-defined series of forward rate agreements to buy or sell the floating interest rate at the same fixed interest rate.

In an interest rate swap, the position taken by the receiver of the fixed interest rate is called “long receiver swaps” and the position taken by the payer of the fixed interest rate is called “long payer swaps”.

How does an interest rate swap work?

Interest rate swaps can be used in different market situations based on a counterparty’s prediction about future interest rates.

For example, when a firm paying a fixed rate of interest on an existing loan believes that the interest rate will decrease in the future, it may enter an interest rate swap agreement in which it pays a floating rate and receives a fixed rate to benefit from its expectation about the path of future interest rates. Conversely, if the firm paying a floating interest rate on an existing loan believes that the interest rate will increase in the future, it may enter an interest rate swap in which it pays a fixed rate and receives a floating rate to benefit from its expectation about the path of future interest rates.

Example

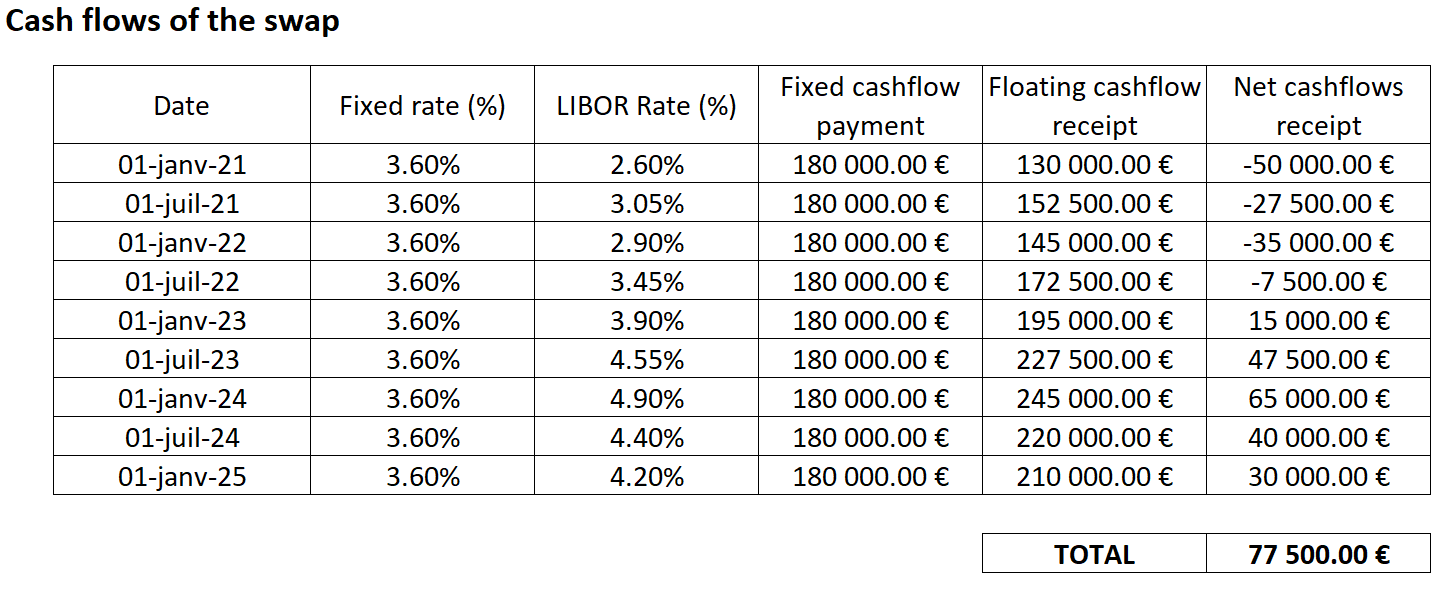
Let’s consider a 4-year swap between two counterparties A and B on January 1, 2021. In this swap, counterparty A agrees to pay a fixed interest rate of 3.60% per annum to counterparty B every six months on an agreed notional amount of €10 million. Counterparty B agrees to pay a floating interest rate based on the 6-month LIBOR rate, currently at 2.60%, to Counterparty A on the same notional amount. Here, the position taken by Counterparty A is called long payer swap and the position taken by Counterparty B is called the long receiver swap. The projected cashflow receipt to Counterparty A based on the assumed LIBOR rates is shown in the below table:

Table 1. Cash flows for an interest rate swap.
 Cash flows for an interest rate swap
Source: computation by the author

In the above example, a total of eight payments (two per year) are made on the interest rate swap. The fixed rate payment is fixed at €180,000 per observation date whereas the floating payment rate depend on the prevailing LIBOR rate at the observation date. The net receipt for the Counterparty A is equal to €77,500 at the end of 5 years. Note that in an interest rate swap the notional amount of €10 million is not exchanged between the counterparties since it has no financial value to either of the counterparties and that is why it is called the “notional amount”.

Note that when the two counterparties enter the swap, the fixed rate is set such that the swap value is equal to zero.

Excel file for interest rate swaps

You can download below the Excel file for the computation of the cash flows for an interest rate swap.

Download the Excel file to compute the protective put value

Related Posts

   ▶ Jayati WALIA Derivative Markets

   ▶ Akshit GUPTA Forward Contracts

   ▶ Akshit GUPTA Options

Useful resources

Hull J.C. (2015) Options, Futures, and Other Derivatives, Ninth Edition, Chapter 7 – Swaps, 180-211.

www.longin.fr Pricer of interest swaps

About the author

Article written in December 2022 by Akshit GUPTA (ESSEC Business School, Grande Ecole Program – Master in Management, 2019-2022).

Black-Scholes-Merton option pricing model

Jayati WALIA

In this article, Jayati WALIA (ESSEC Business School, Grande Ecole Program – Master in Management, 2019-2022) explains the Black-Scholes-Merton model to price options.

The Black-Scholes-Merton model (or the BSM model) is the world’s most popular option pricing model. Developed in the beginning of the 1970s, this model introduced to the world, a mathematical way of pricing options. Its success was essentially a starting point for new forms of financial derivatives in the knowledge that they could be priced accurately using the ideas and analyses pioneered by Black, Scholes and Merton and it set the foundation for the flourishing of modern quantitative finance. Myron Scholes and Robert Merton were awarded the Nobel Prize for their work on option pricing in 1997. Unfortunately, Fischer Black had died several years earlier but would certainly have been included in the prize had he been alive, and he was also listed as a contributor by Scholes and Merton.

Today, the Black-Scholes-Merton formula is widely used by traders in investment banks to price and hedge option contracts. Options are used by investors to hedge their portfolios to manage their risks.

Assumptions of the BSM Model

As any model, the BSM model relies on a set of assumptions:

  • The model considers European options, which we can only be exercised at their expiration date.
  • The price of the underlying asset follows a geometric Brownian motion (corresponding to log-normal distribution for the price at a given point in time).
  • The risk-free rate remains constant over time until the expiration date.
  • The volatility of the underlying asset price remains constant over time until the expiration date.
  • There are no dividend payments on the underlying asset.
  • There are no transaction costs on the underlying asset.
  • There are no arbitrage opportunities.

The BSM equation

The value of an option is a function of the price of the underlying stock and its statistical behavior over the life of the option.

A commonly used model is Geometric Brownian Motion (GBM). GBM assumes that future asset price differences are uncorrelated over time and the probability distribution function of the future prices is a log-normal distribution (or equivalently the probability distribution function of the future returns is a normal distribution). The price movements in a GBM process can be expressed as:

GBM equation

with dS being the change in the underlying asset price in continuous time dt and dX the random variable from the normal distribution (N(0, 1) or Wiener process). σ is the volatility of the underlying asset price (it is assumed to be constant). μdt represents the deterministic return within the time interval with μ representing the growth rate of asset price or the ‘drift’.

Therefore, option price is determined by these parameters that describe the process followed by the asset price over a period of time. The Black-Scholes-Merton equation governs the price evolution of European stock options in financial markets. It is a linear parabolic partial differential equation (PDE) and is expressed as:

BSM model equation

Where V is the value of the option (as a function of two variables: the price of the underlying asset S and time t), r is the risk-free interest rate (think of it as the interest rate which you would receive from a government debt or similar debt securities) and σ is the volatility of the log returns of the underlying security (say stocks).

The key idea behind the equation is to hedge the option and limit exposure to market risk posed by the asset. This is achieved by a strategy known as ‘delta hedging’ and it involves replicating the option through an equivalent portfolio with positions in the underlying asset and a risk-free asset in the right way so as to eliminate risk.

Thus, from the BSM equation we can derive the BSM formulae that describe the price of call and put options over their life time.

The BSM formulae

Note that the type of option we are valuing (call or put), the strike price and the maturity date do not appear in the above BSM equation. These elements only appear in the ‘final condition’ i.e., the option value at maturity, called the payoff function.

For a call option, the payoff C is given by:

CT = max⁡(ST – K; 0)

For a put option, the payoff is given by:

PT = max⁡(K – ST; 0)

The BSM formula is a solution to the BSM equation, given the boundary conditions (given by the payoff equations above). It calculates the price at time t for both a call and a put option.

The value for a call option at time t is given by:

Call option value equation

The value for a put option at time t is given by:

Put option value equation

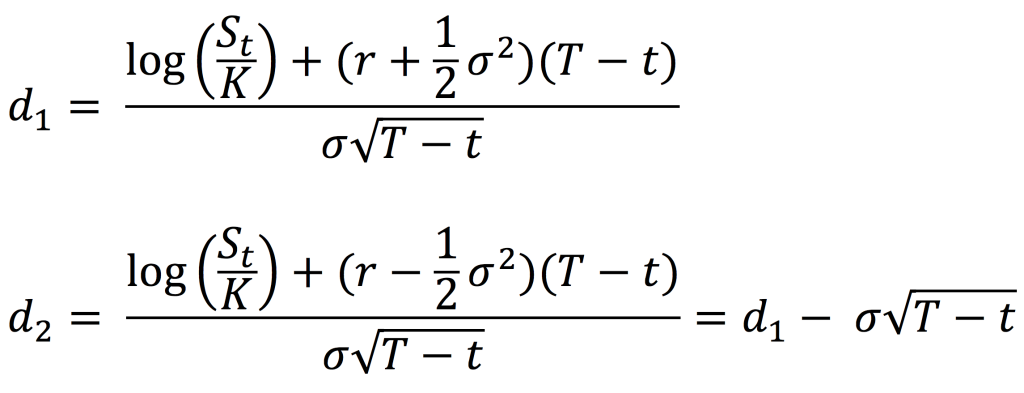
where

With the notations:
St: Price of the underlying asset at time t
t: Current date
T: Expiry date of the option
K: Strike price of the option
r: Risk-free interest rate
σ: Volatility (the standard deviation of the return on the underlying asset)
N(.): Cumulative distribution function for a normal (Gaussian) distribution. It is the probability that a random variable is less or equal to its input (i.e. d₁ and d₂) for a normal distribution. Thus, 0 ≤ N(.) ≤ 1

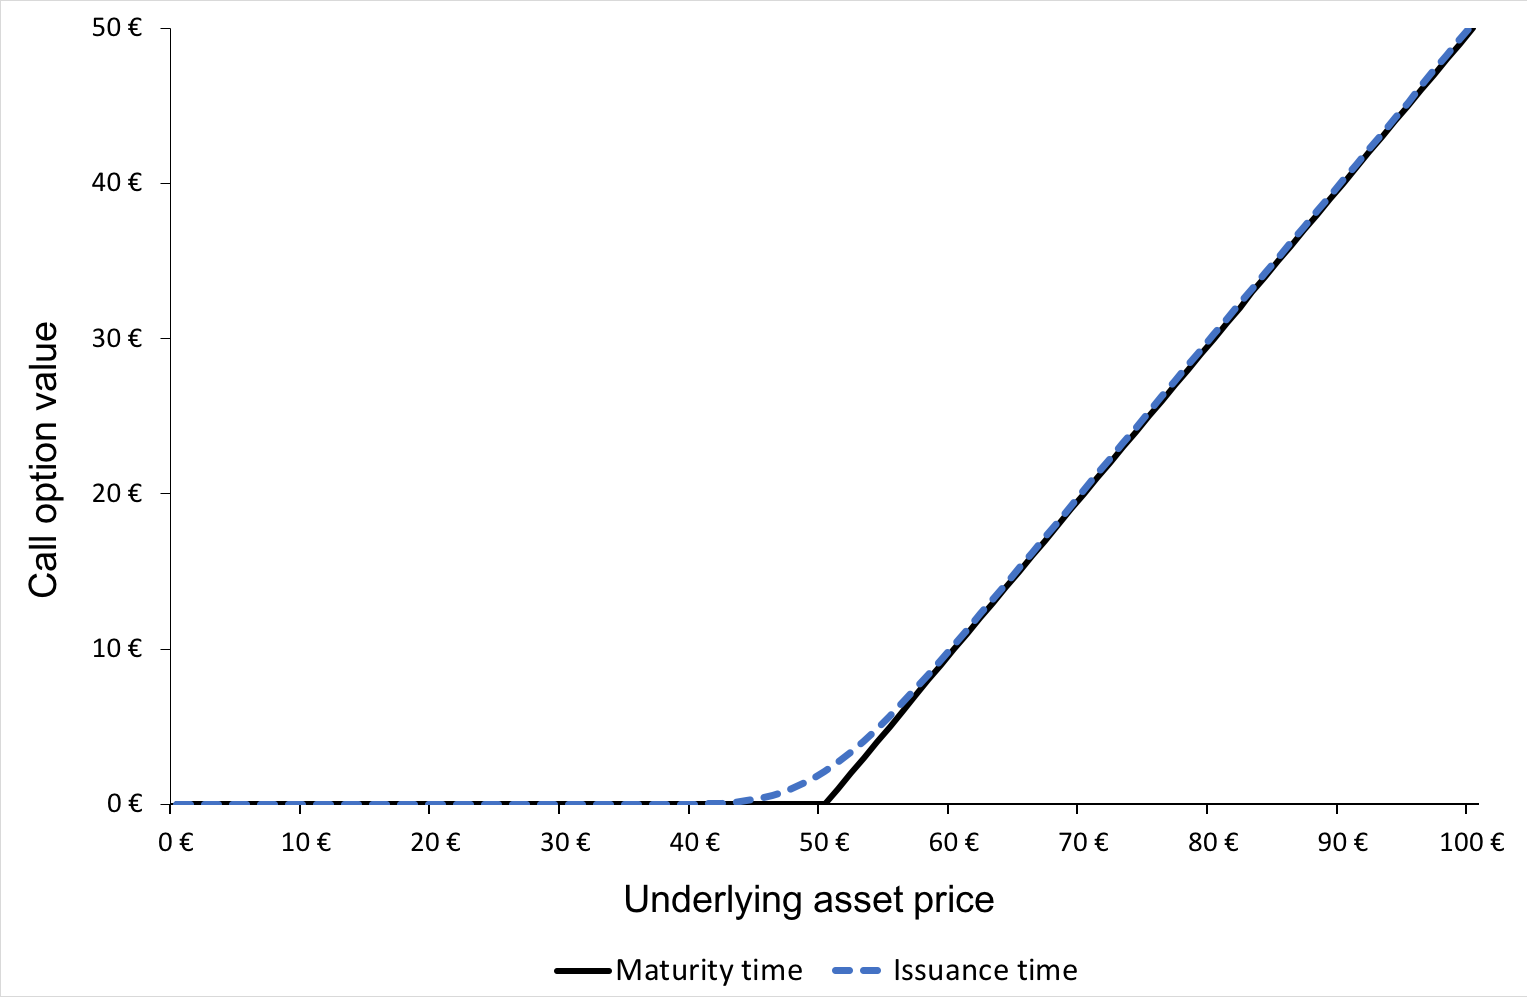
Figure 1 gives the graphical representation of the value of a call option at time t as a function of the price of the underlying asset at time t as given by the BSM formula. The strike price for the call option is 50€ with a maturity of 0.25 years and volatility of 50% in the underlying.

Figure 1. Call option value
Call option value
Source: computation by author.

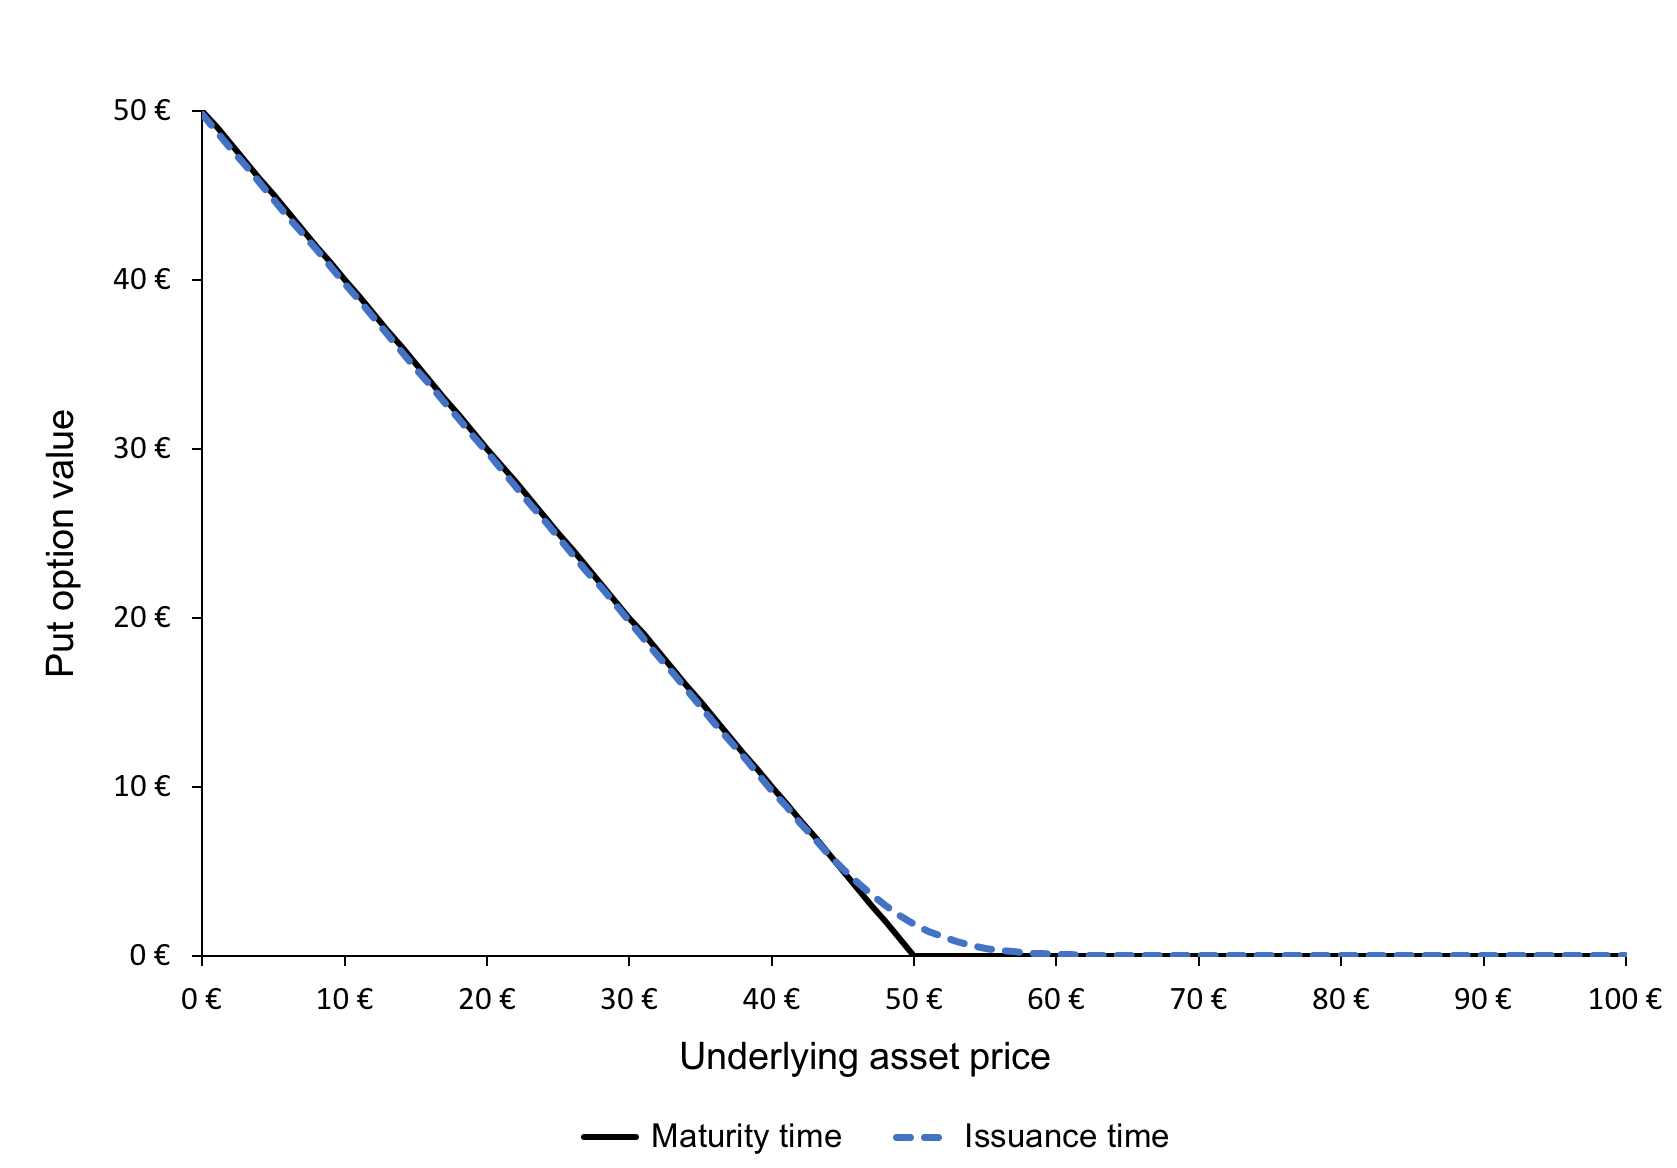
Figure 2 gives the graphical representation of the value of a put option at time t as a function of the price of the underlying asset at time t as given by the BSM formula. The strike price for the put option is 50€ with a maturity of 0.25 years and volatility of 50% in the underlying.

Figure 2. Put option valuePut option value
Source: computation by author.

You can download below the Excel file for option pricing with the BSM Model.

Download the Excel file for option pricing with the BSM Model

Some Criticisms and Limitations

American options

The Black-Scholes-Merton model was initially developed for European options. This is a limitation of the equation for American options which can be exercised at any time before the expiry date. The BSM model would then not accurately determine the option value (an important case when the underlying asset pays a discrete dividend).

Stocks paying dividends

Also, in reality, most stocks pay dividends, and no dividends was an assumption in the initial BSM model, which analysts now eliminated by accommodating the dividend yield in the formula if required.

Constant volatility

Another limitation is the use of constant volatility. Volatility is the measure of risk based on the standard deviation of the return on the underlying asset. In reality the value of an asset will change randomly, not with a specific constant pattern regarding the way it can change.

Finally, the assumption of no transaction cost neglects the liquidity risk in the market since transaction costs are clearly incurred in the real world and there exists a bid-offer spread on most underlying assets. For the most heavily traded stocks, this cost may be low but for others it may lead to an inaccuracy.

Related posts on the SimTrade blog

All posts about Options

▶ Jayati WALIA Brownian Motion in Finance

▶ Akshit GUPTA Options

▶ Akshit GUPTA The Black-Scholes-Merton model

▶ Akshit GUPTA History of options market

Useful resources

Black F. and M. Scholes (1973) The Pricing of Options and Corporate Liabilities The Journal of Political Economy 81, 637-654.

Merton R.C. (1973) Theory of Rational Option Pricing Bell Journal of Economics 4, 141–183.

About the author

The article was written in March 2022 by Jayati WALIA (ESSEC Business School, Grande Ecole Program – Master in Management, 2019-2022).

Protective Put

Protective Put

Akshit Gupta

This article written by Akshit GUPTA (ESSEC Business School, Grande Ecole Program – Master in Management, 2019-2022) presents the concept of protective put using option contracts.

Introduction

Hedging is a strategy implemented by investors to reduce the risk in an existing investment. In financial markets, hedging is an effective tool used by investors to minimize the risk exposure and change the risk profile for any investment in securities. While hedging does not necessarily eliminate the entire risk for any investment, it does limit the potential losses that the investor can incur.

Option contracts are commonly used by market participants (traders, investors, asset managers, etc.) as hedging mechanisms due to their great flexibility (in terms of expiration date, moneyness, liquidity, etc.) and availability. Positions in options are used to offset the risk exposure in the underlying security, another option contract or in any other derivative contract. There are various popular strategies that can be implemented through option contracts to minimize risk and maximize returns, one of which is a protective put.

Buying a protective put

A put option gives the buyer of the option, the right but not the obligation, to sell a security at a predefined date and price.

A protective put also called as a synthetic long option, is a hedging strategy that limits the downside of an investment. In a protective put, the investor buys a put option on the stock he/she holds in its portfolio. The protective put option acts as a price floor since the investor can sell the security at the strike price of the put option if the price of the underlying asset moves below the strike price. Thus, the investor caps its losses in case the underlying asset price moves downwards. The investor has to pay an option premium to buy the put option.

The maximum payoff potential from using this strategy is unlimited and the potential downside/losses is limited to the strike price of the put option.

Market scenario

A put option is generally bought to safeguard the investment when the investor is bullish about the market in the long run but fears a temporary fall in the prices of the asset in the short term.

For example, an investor owns the shares of Apple and is bullish about the stock in the long run. However, the earnings report for Apple is due to be released by the end of the month. The earnings report can have a positive or a negative impact on the prices of the Apple stock. In this situation, the protective put saves the investor from a steep decline in the prices of the Apple stock if the report is unfavorable.

Let us consider a protective position with buying at-the money puts. One of following three scenarios may happen:

Scenario 1: the stock price does not change, and the puts expire at the money.

In this scenario, the market viewpoint of the investor does not hold correct and the loss from the strategy is the premium paid on buying the put options. In this case, the option holder does not exercise its put options, and the investor gets to keep the underlying stocks.

Scenario 2: the stock price rises, and the puts expire in the money.

In this scenario, since the price of the stock was locked in through the put option, the investor enjoys a short-term unrealized profit on the underlying position. However, the put option will not be exercised by the investor and it will expire worthless. The investor will lose the premium paid on buying the puts.

Scenario 3: the stock price falls, and the puts expire out of the money.

In this scenario, since the price of the stock was locked in through the put option, the investor will execute the option and sell the stocks at the strike price. There is protection from the losses since the investor holds the put option.

Risk profile

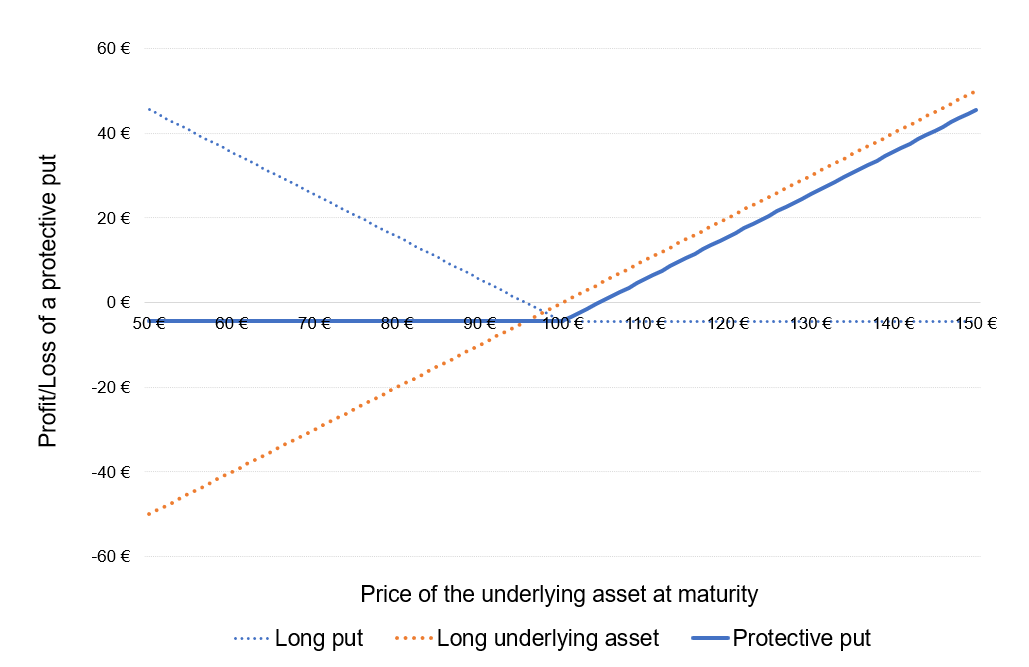
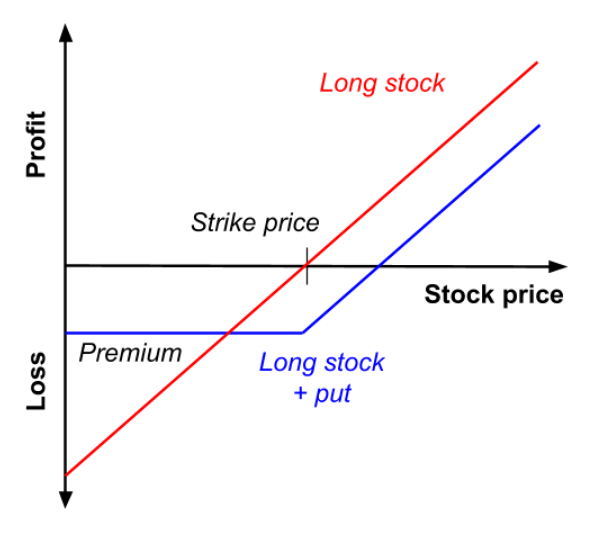
In a protective put, the total cost of the investment is equal to the price of the underlying asset plus the put price. However, the profit potential for the investment is unlimited and the maximum losses are capped to the put option price. The risk profile of the position is represented in Figure 1.

Figure 1. Profit or Loss (P&L) function of the underlying position and protective put position.

Protective put

Source: computation by the author.

You can download below the Excel file for the computation of the Profit or Loss (P&L) function of the underlying position and protective put position.

Download the Excel file to compute the protective put value

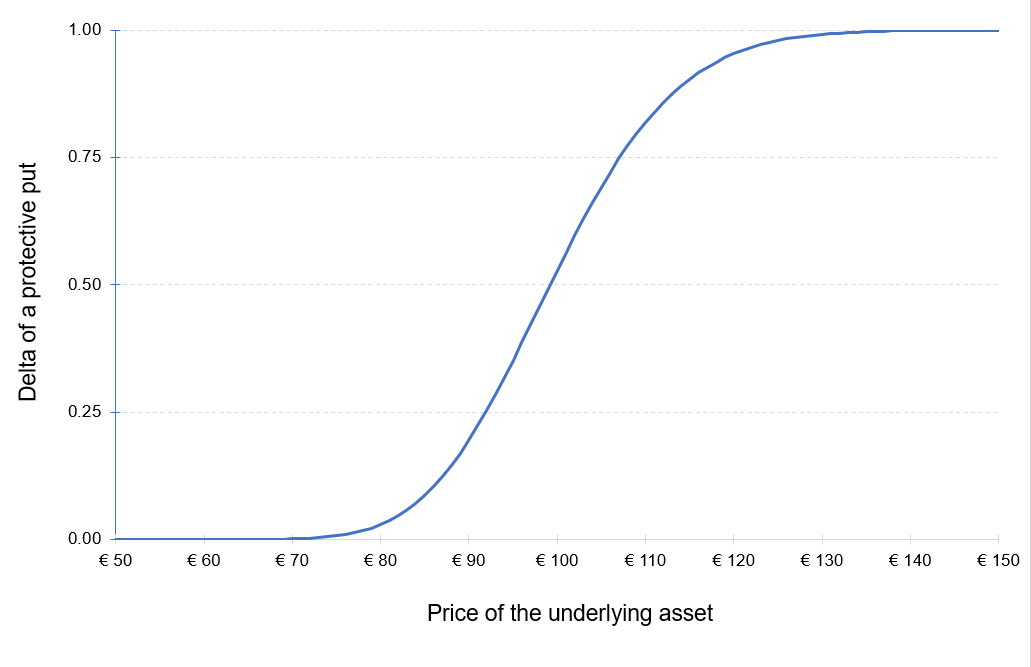
The delta of the position is equal to the sum of the delta of the long position in the underlying asset (+1) and the long position in the put option (Δ). The delta of a long put option is negative which implies that a fall in the asset price will result in an increase in the put price and vice versa. However, the delta of a protective put strategy is positive. This implies that in a protective put strategy, the value of the position tends to rise when the underlying asset price increases and falls when the underlying asset prices decreases.

Figure 2 represents the delta of the protective put position as a function of the price of the underlying asset. The delta of the put option is computed with the Black-Scholes-Merton model (BSM model).

Figure 2. Delta of a protective put position.
Delta Protective put
Source: computation by the author (based on the BSM model).

You can download below the Excel file for the computation of the delta of a protective put position.

Download the Excel file to compute the delta of the protective put position

Example

An investor holds 100 shares of Apple bought at the current price of $144 each. The total initial investment is equal to $14,400. He is skeptical about the effect of the upcoming earnings report of Apple by the end of the current month. In order to avoid losses from a possible downside in the price of the Apple stock, he decides to purchase at-the-money put options on the Apple stock (lot size is 100) with a maturity of one month, using the protective put strategy.

We use the following market data: the current price of Appel stock is $144, the implied volatility of Apple stock is 22.79% and the risk-free interest rate is equal to 1.59%.

Based on the Black-Scholes-Merton model, the price of the put option $3.68.

Let us consider three scenarios at the time of maturity of the put option:

Scenario 1: stability of the price of the underlying asset at $144

The market value of the investment $14,400. The total cost of the initial investment is the cost of acquiring the Apple stocks ($14,400) plus the cost of buying the put options ($368 = $3.68*100), which is equal to $14,768, (i.e. ($14,400 + $368)).

As the stock price is stable at $144, the investor will not execute the put option and the option will expire worthless.

By not executing the put option, the investor incurs a loss which is equal to the price of the put option which is $368.

Scenario 2: an increase in the price of the underlying asset to $155

The market value of the investment $15,500. The total cost of the initial investment is the cost of acquiring the Apple stocks ($14,400) plus the cost of buying the put options ($368 = $3.68*100), which is equal to $14,768, (i.e. ($14,400 + $368)).

As the stock price is at $155, the investor will not execute the put option and hold on the underlying stock.

By not executing the put option, the investor incurs a loss which is equal to the price of the put option which is $368.

Scenario 3: a decrease in the price of the underlying asset to $140

The market value of the investment $14,000. The total cost of the initial investment is the cost of acquiring the Apple stocks ($14,400) plus the cost of buying the put options ($368 = $3.68*100), which is equal to $14,768, (i.e. ($14,400 + $368)).

As the stock price has decreased to $140, the investor will execute the put option and sell the Apple stocks at $144. By executing the put option, the investor will protect himself from incurring a loss of $400 (i.e.($144-$140)*100) due to a decrease in the Apple stock prices.

Related Posts

   ▶ All posts about Options

   ▶ Akshit GUPTA Options

   ▶ Akshit GUPTA The Black-Scholes-Merton model

   ▶ Akshit GUPTA Option Greeks – Delta

   ▶ Akshit GUPTA Covered call

   ▶ Akshit GUPTA Option Trader – Job description

Useful Resources

Black F. and M. Scholes (1973) “The Pricing of Options and Corporate Liabilities” The Journal of Political Economy, 81, 637-654.

Hull J.C. (2015) Options, Futures, and Other Derivatives, Ninth Edition, Chapter 10 – Trading strategies involving Options, 276-295.

Merton R.C. (1973) “Theory of Rational Option Pricing” Bell Journal of Economics, 4(1): 141–183.

Wilmott P. (2007) Paul Wilmott Introduces Quantitative Finance, Second Edition, Chapter 8 – The Black Scholes Formula and The Greeks, 182-184.

About the author

Article written in January 2022 by Akshit GUPTA (ESSEC Business School, Grande Ecole Program -Master in Management, 2019-2022).

Straddle and strangle strategy

Straddle and Strangle

Akshit Gupta

This article written by Akshit GUPTA (ESSEC Business School, Grande Ecole Program – Master in Management, 2019-2022) presents the strategies of straddle and strangle based on options.

Introduction

In financial markets, hedging is implemented by investors to minimize the risk exposure and maximize the returns for any investment in securities. While hedging does not necessarily eliminate the entire risk for an investment, it does limit or offset any potential losses that the investor can incur.

Option contracts are commonly used by investors / traders as hedging mechanisms due to their great flexibility (in terms of expiration date, moneyness, liquidity, etc.) and availability. Positions in options are used to offset the risk exposure in the underlying security, another option contract or in any other derivative contract. Option strategies can be directional or non-directional.

Directional strategy is when the investor has a specific viewpoint about the movement of an asset price and aims to earn profit if the viewpoint holds true. For instance, if an investor has a bullish viewpoint about an asset and speculates that its price will rise, she/he can buy a call option on the asset, and this can be referred as a directional trade with a bullish bias. Similarly, if an investor has a bearish viewpoint about an asset and speculates that its price will fall, she/he can buy a put option on the asset, and this can be referred as a directional trade with a bearish bias.

On the other hand, non-directional strategies can be used by investors when they anticipate a major market movement and want to gain profit irrespective of whether the asset price rises or falls, i.e., their payoff is independent of the direction of the price movement of the asset but instead depends on the magnitude of the price movement. There are various popular non-directional strategies that can be implemented through a combination of option contracts to minimize risk and maximize returns. In this post, we are interested in straddle and strangle.

Straddle

In a straddle, the investor buys a European call and a European put option, both at the same expiration date and at the same strike price. This strategy works in a similar manner like a strangle (see below). However, the potential losses are a bit higher than incurred in a strangle if the stock price remains near the central value at expiration date.

A long straddle is when the investor buys the call and put options, whereas a short straddle is when the investor sells the call and put options. Thus, whether a straddle is long or short depends on whether the options are long or short.

Market Scenario

When the price of underlying is expected to move up or down sharply, investors chose to go for a long straddle and the expiration date is chosen such that it occurs after the expected price movement. Scenarios when a long straddle might be used can include budget or company earnings declaration, war announcements, election results, policy changes etc.
Conversely, a short straddle can be implemented when investors do not expect a significant movement in the asset prices.

Example

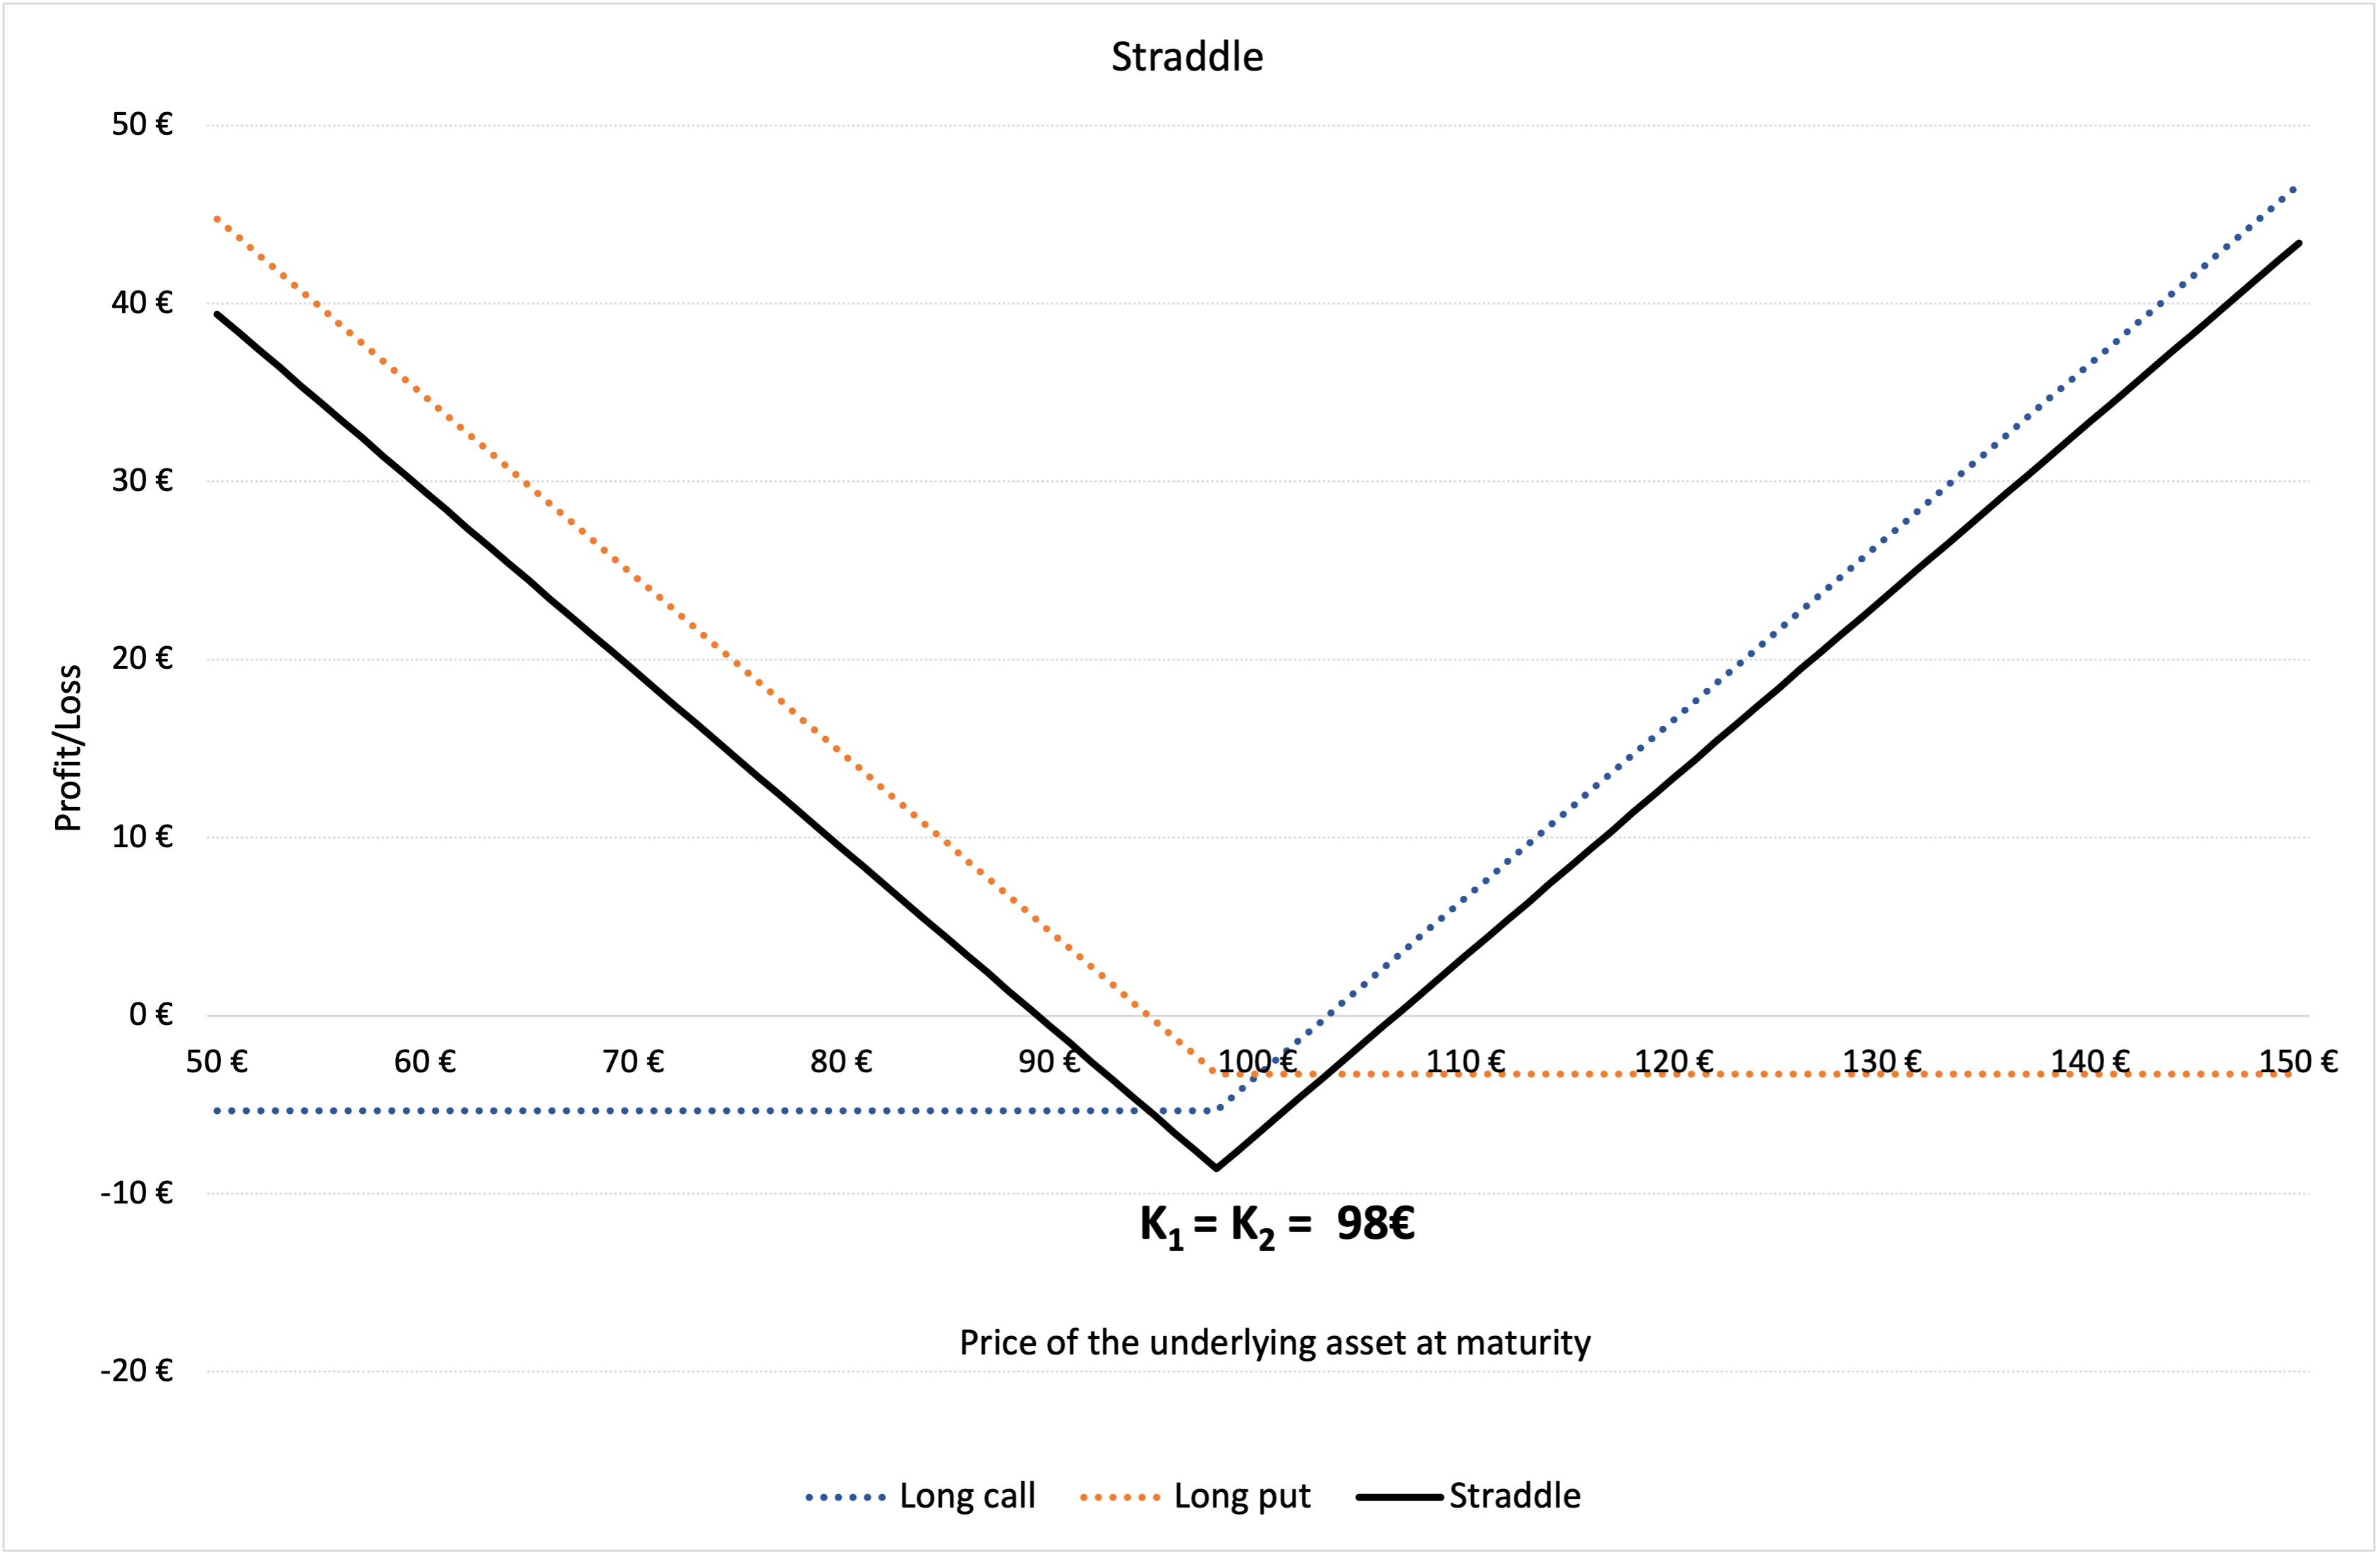
In Figure 1 below, we represent the profit and loss function of a straddle strategy using a long call and a long put option. K1 is the strike price of the long call i.e., €98 and K2 is the strike price of the long put position i.e., €98. The premium of the long call is equal to €5.33, and the premium of the long put is equal to €3.26 computed using the Black-Scholes-Merton model. The time to maturity (T) is of 18 days (i.e., 0.071 years). At the time of valuation, the price of the underlying asset (S0) is €100, the volatility (σ) of the underlying asset is 40% and the risk-free rate (r) is 1% (market data).

Figure 1. Profit and loss (P&L) function of a straddle position.
 Profit and loss (P&L) function of a straddle
Source: computation by the author.

You can download below the Excel file for the computation of the straddle value using the Black-Scholes-Merton model.

Download the Excel file to compute the straddle value

Strangle

In a strangle, the investor buys a European call and a European put option, both at the same expiration date but different strike prices. To benefit from this strategy, the price of the underlying asset must move further away from the central value in either direction i.e., increase or decrease. If the stock prices stay at a level closer to the central value, the investor will incur losses.

Like a straddle, a long strangle is when the investor buys the call and put options, whereas a short strangle is when the investor sells (issues) the call and put options. The only difference is the strike price, as in a strangle, the call option has a higher strike price than the price of the underlying asset, while the put option has a lower strike price than the price of the underlying asset.

Strangles are generally cheaper than straddles because investors require relatively less price movement in the asset to ‘break even’.

Market Scenario

The long strangle strategy can be used when the trader expects that the underlying asset is likely to experience significant volatility in the near term. It is a limited risk and unlimited profit strategy because the maximum loss is limited to the net option premiums while the profits depend on the underlying price movements.

Similarly, short strangle can be implemented when the investor holds a neutral market view and expects very little volatility in the underlying asset price in the near term. It is a limited profit and unlimited risk strategy since the payoff is limited to the premiums received for the options, while the risk can amount to a great loss if the underlying price moves significantly.

Example

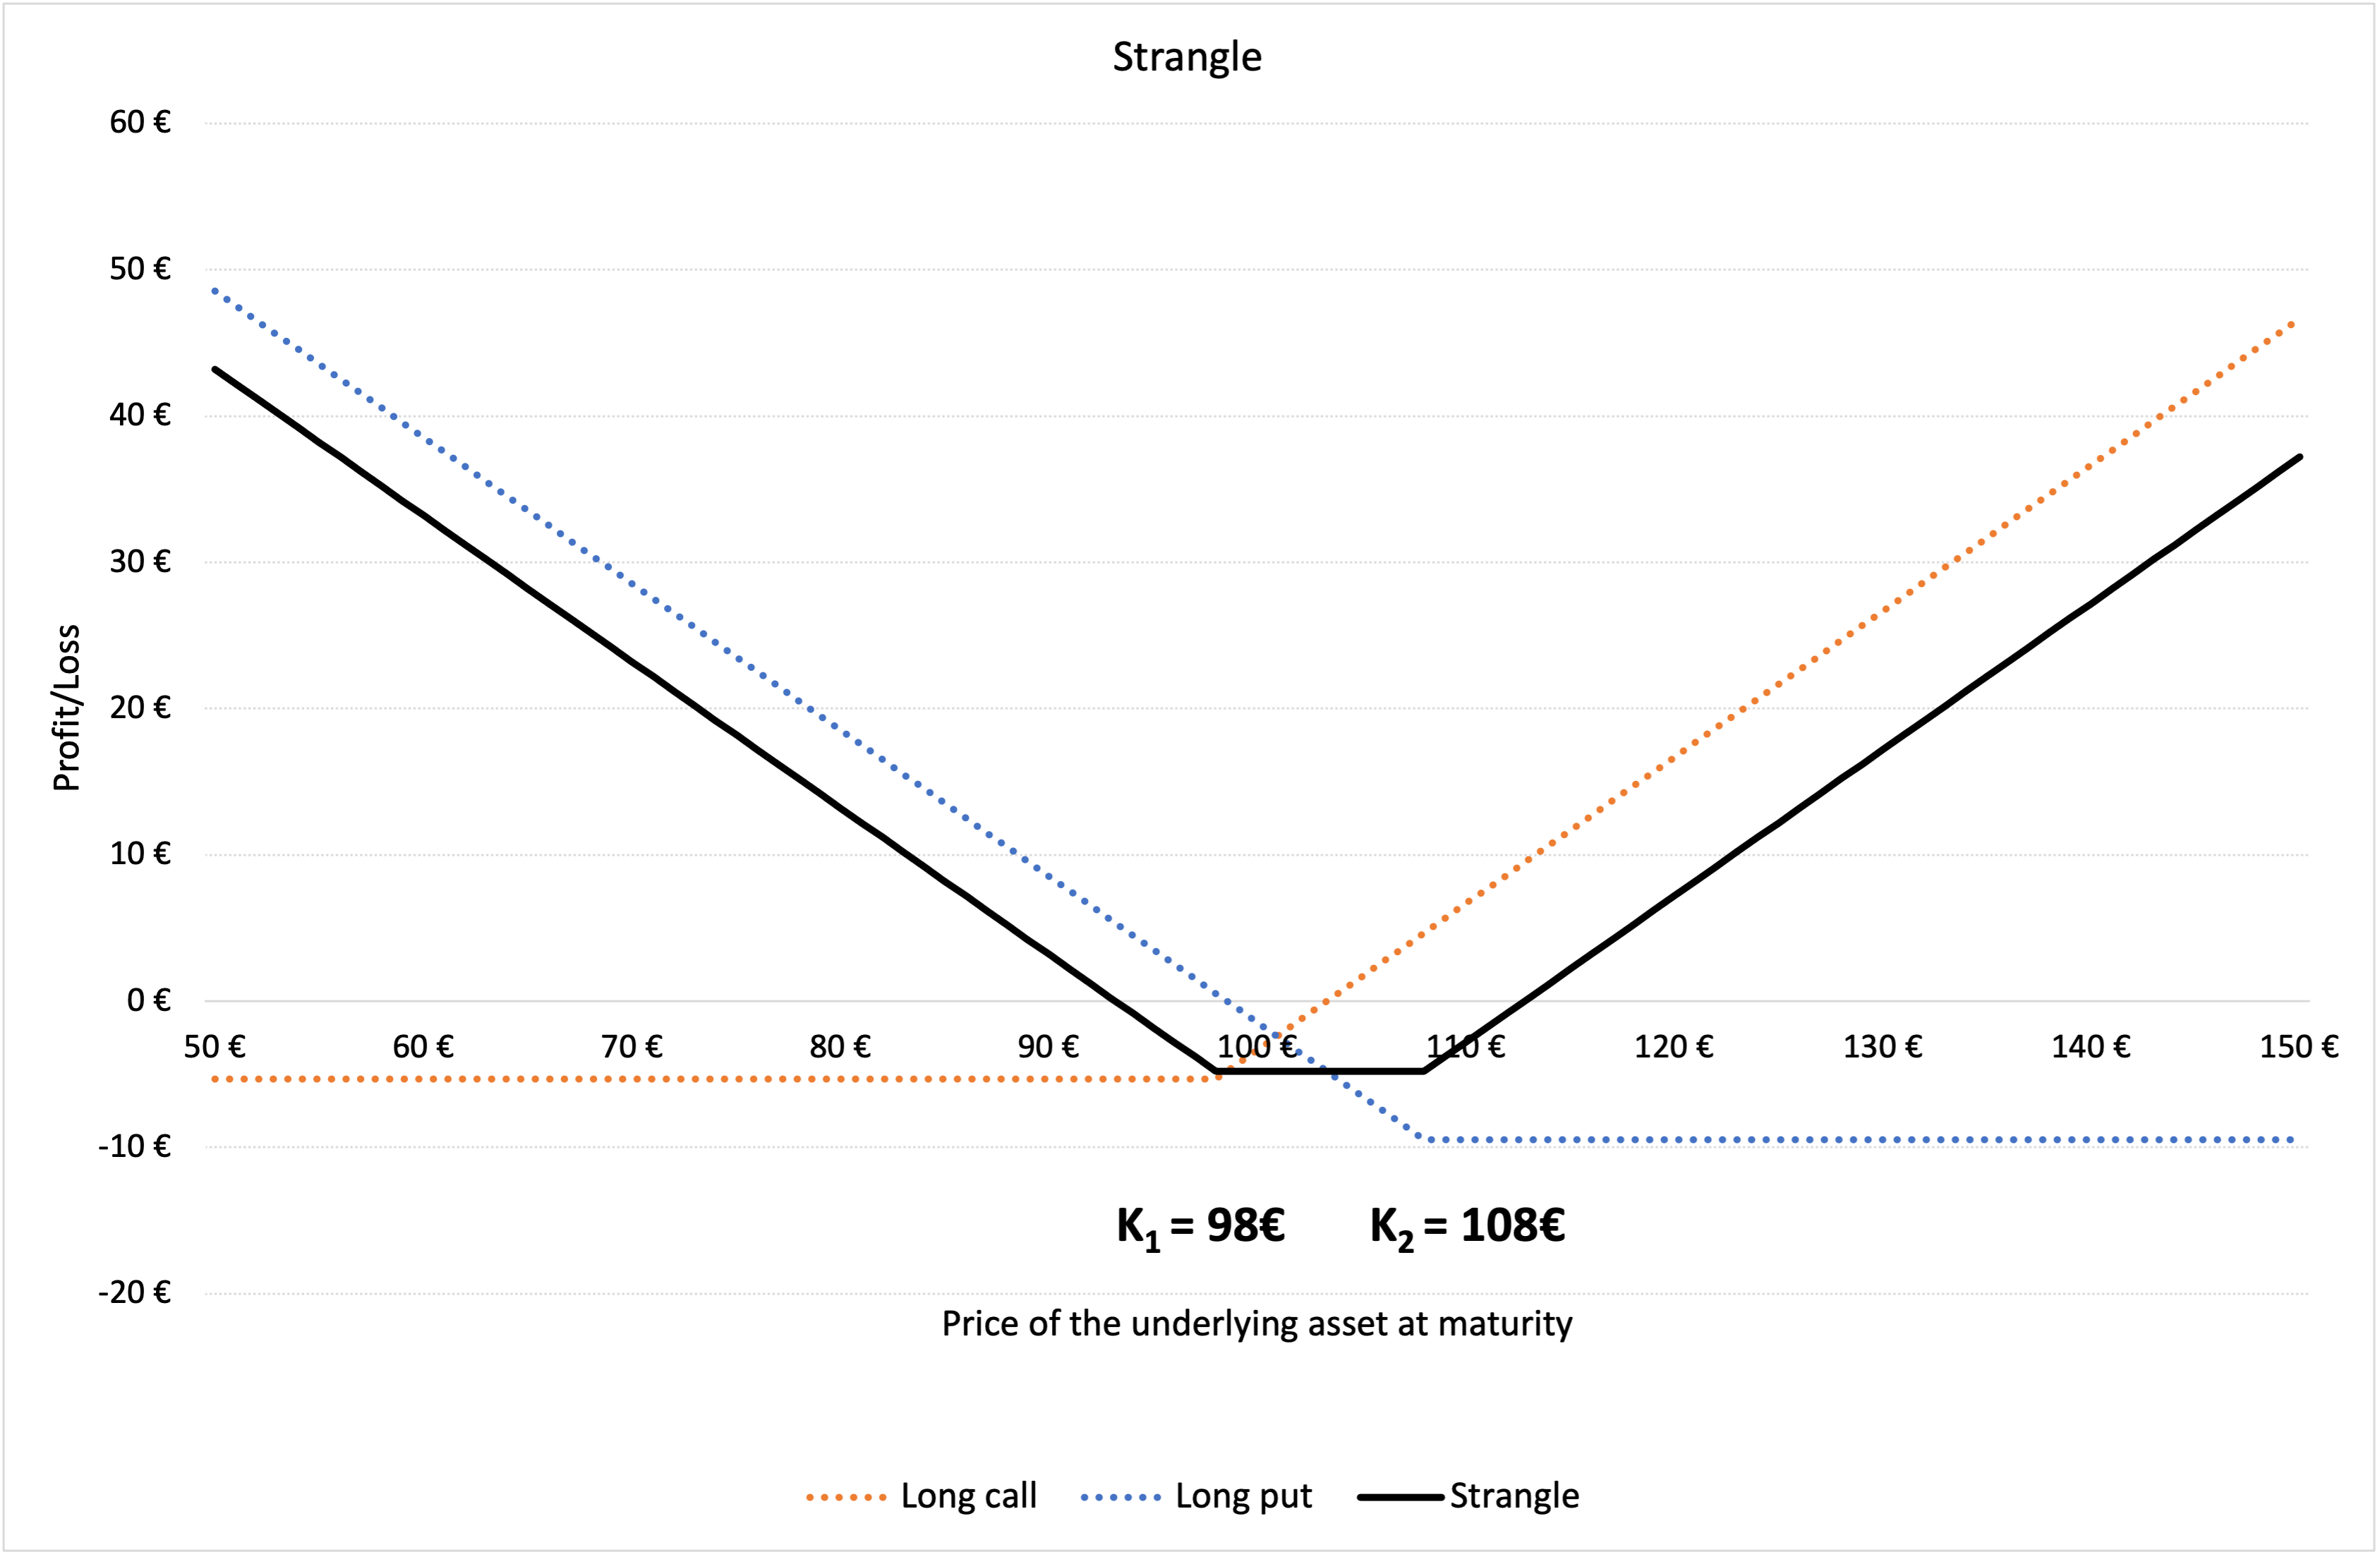
In Figure 2 below, we represent the profit and loss function of a strangle strategy using a long call and a long put option. K1 is the strike price of the long call i.e., €98 and K2 is the strike price of the long put position i.e., €108. The premium of the long call is equal to €5.33, and the premium of the long put is equal to €9.47 computed using the Black-Scholes-Merton model. The time to maturity (T) is of 18 days (i.e., 0.071 years). At the time of valuation, the price of the underlying asset (S0) is €100, the volatility (σ) of the underlying asset is 40% and the risk-free rate (r) is 1% (market data).

Figure 2. Profit and loss (P&L) function of a strangle position.
 Profit and loss (P&L) function of a Strangle
Source: computation by the author..

You can download below the Excel file for the computation of the strangle value using the Black-Scholes-Merton model.

Download the Excel file to compute the Strangle value

Related Posts

   ▶ All posts about Options

   ▶ Akshit GUPTA Options

   ▶ Akshit GUPTA The Black-Scholes-Merton model

   ▶ Akshit GUPTA Option Spreads

   ▶ Akshit GUPTA Option Trader – Job description

Useful resources

Academic research articles

Black F. and M. Scholes (1973) “The Pricing of Options and Corporate Liabilities” The Journal of Political Economy, 81, 637-654.

Merton R.C. (1973) “Theory of Rational Option Pricing” Bell Journal of Economics, 4, 141–183.

Books

Hull J.C. (2015) Options, Futures, and Other Derivatives, Ninth Edition, Chapter 10 – Trading strategies involving Options, 276-295.

Wilmott P. (2007) Paul Wilmott Introduces Quantitative Finance, Second Edition, Chapter 8 – The Black Scholes Formula and The Greeks, 182-184.

About the author

Article written in January 2022 by Akshit GUPTA (ESSEC Business School, Grande Ecole Program – Master in Management, 2019-2022).

Option Spreads

Option Spreads

Akshit Gupta

This article written by Akshit GUPTA (ESSEC Business School, Grande Ecole Program – Master in Management, 2019-2022) presents the different option spreads used to hedge a position in financial markets.

Introduction

In financial markets, hedging is implemented by investors to minimize the risk exposure for any investment in securities. While hedging does not necessarily eliminate the entire risk for an investment, it does limit or offset any potential losses that the investor can incur.

Option contracts are commonly used by traders and investors as hedging mechanisms due to their great flexibility (in terms of expiration date, moneyness, liquidity, etc.) and availability. Positions in options are used to offset the risk exposure in the underlying security, another option contract or in any other derivative contract. Option strategies can be directional or non-directional.

Spreads are hedging strategies used in trading in which traders buy and sell multiple option contracts on the same underlying asset. In a spread strategy, the option type used to create a spread has to be consistent, either call options or put options. These are used frequently by traders to minimize their risk exposure on the positions in the underlying assets.

Bull Spread

In a bull spread, the investor buys a European call option on the underlying asset with strike price K1 and sells a call option on the same underlying asset with strike price K2 (with K2 higher than K1) with the same expiration date. The investor expects the price of the underlying asset to go up and is bullish about the stock. Bull spread is a directional strategy where the investor is moderately bullish about the underlying asset, she is investing in.

When an investor buys a call option, there is a limited downside risk (the loss of the premium) and an unlimited upside risk (gains). The bull spread reduces the potential downside risk on buying the call option, but also limits the potential profit by capping the upside. It is used as an effective hedge to limit the losses.

Market Scenario

When the price of underlying asset is expected to moderately move up, investors chose to execute a bull spread and the expiration date is chosen such that it occurs after the expected price movement. If the price decreases significantly by the expiration of the call options, the investor loses money by using a bull spread.

Example

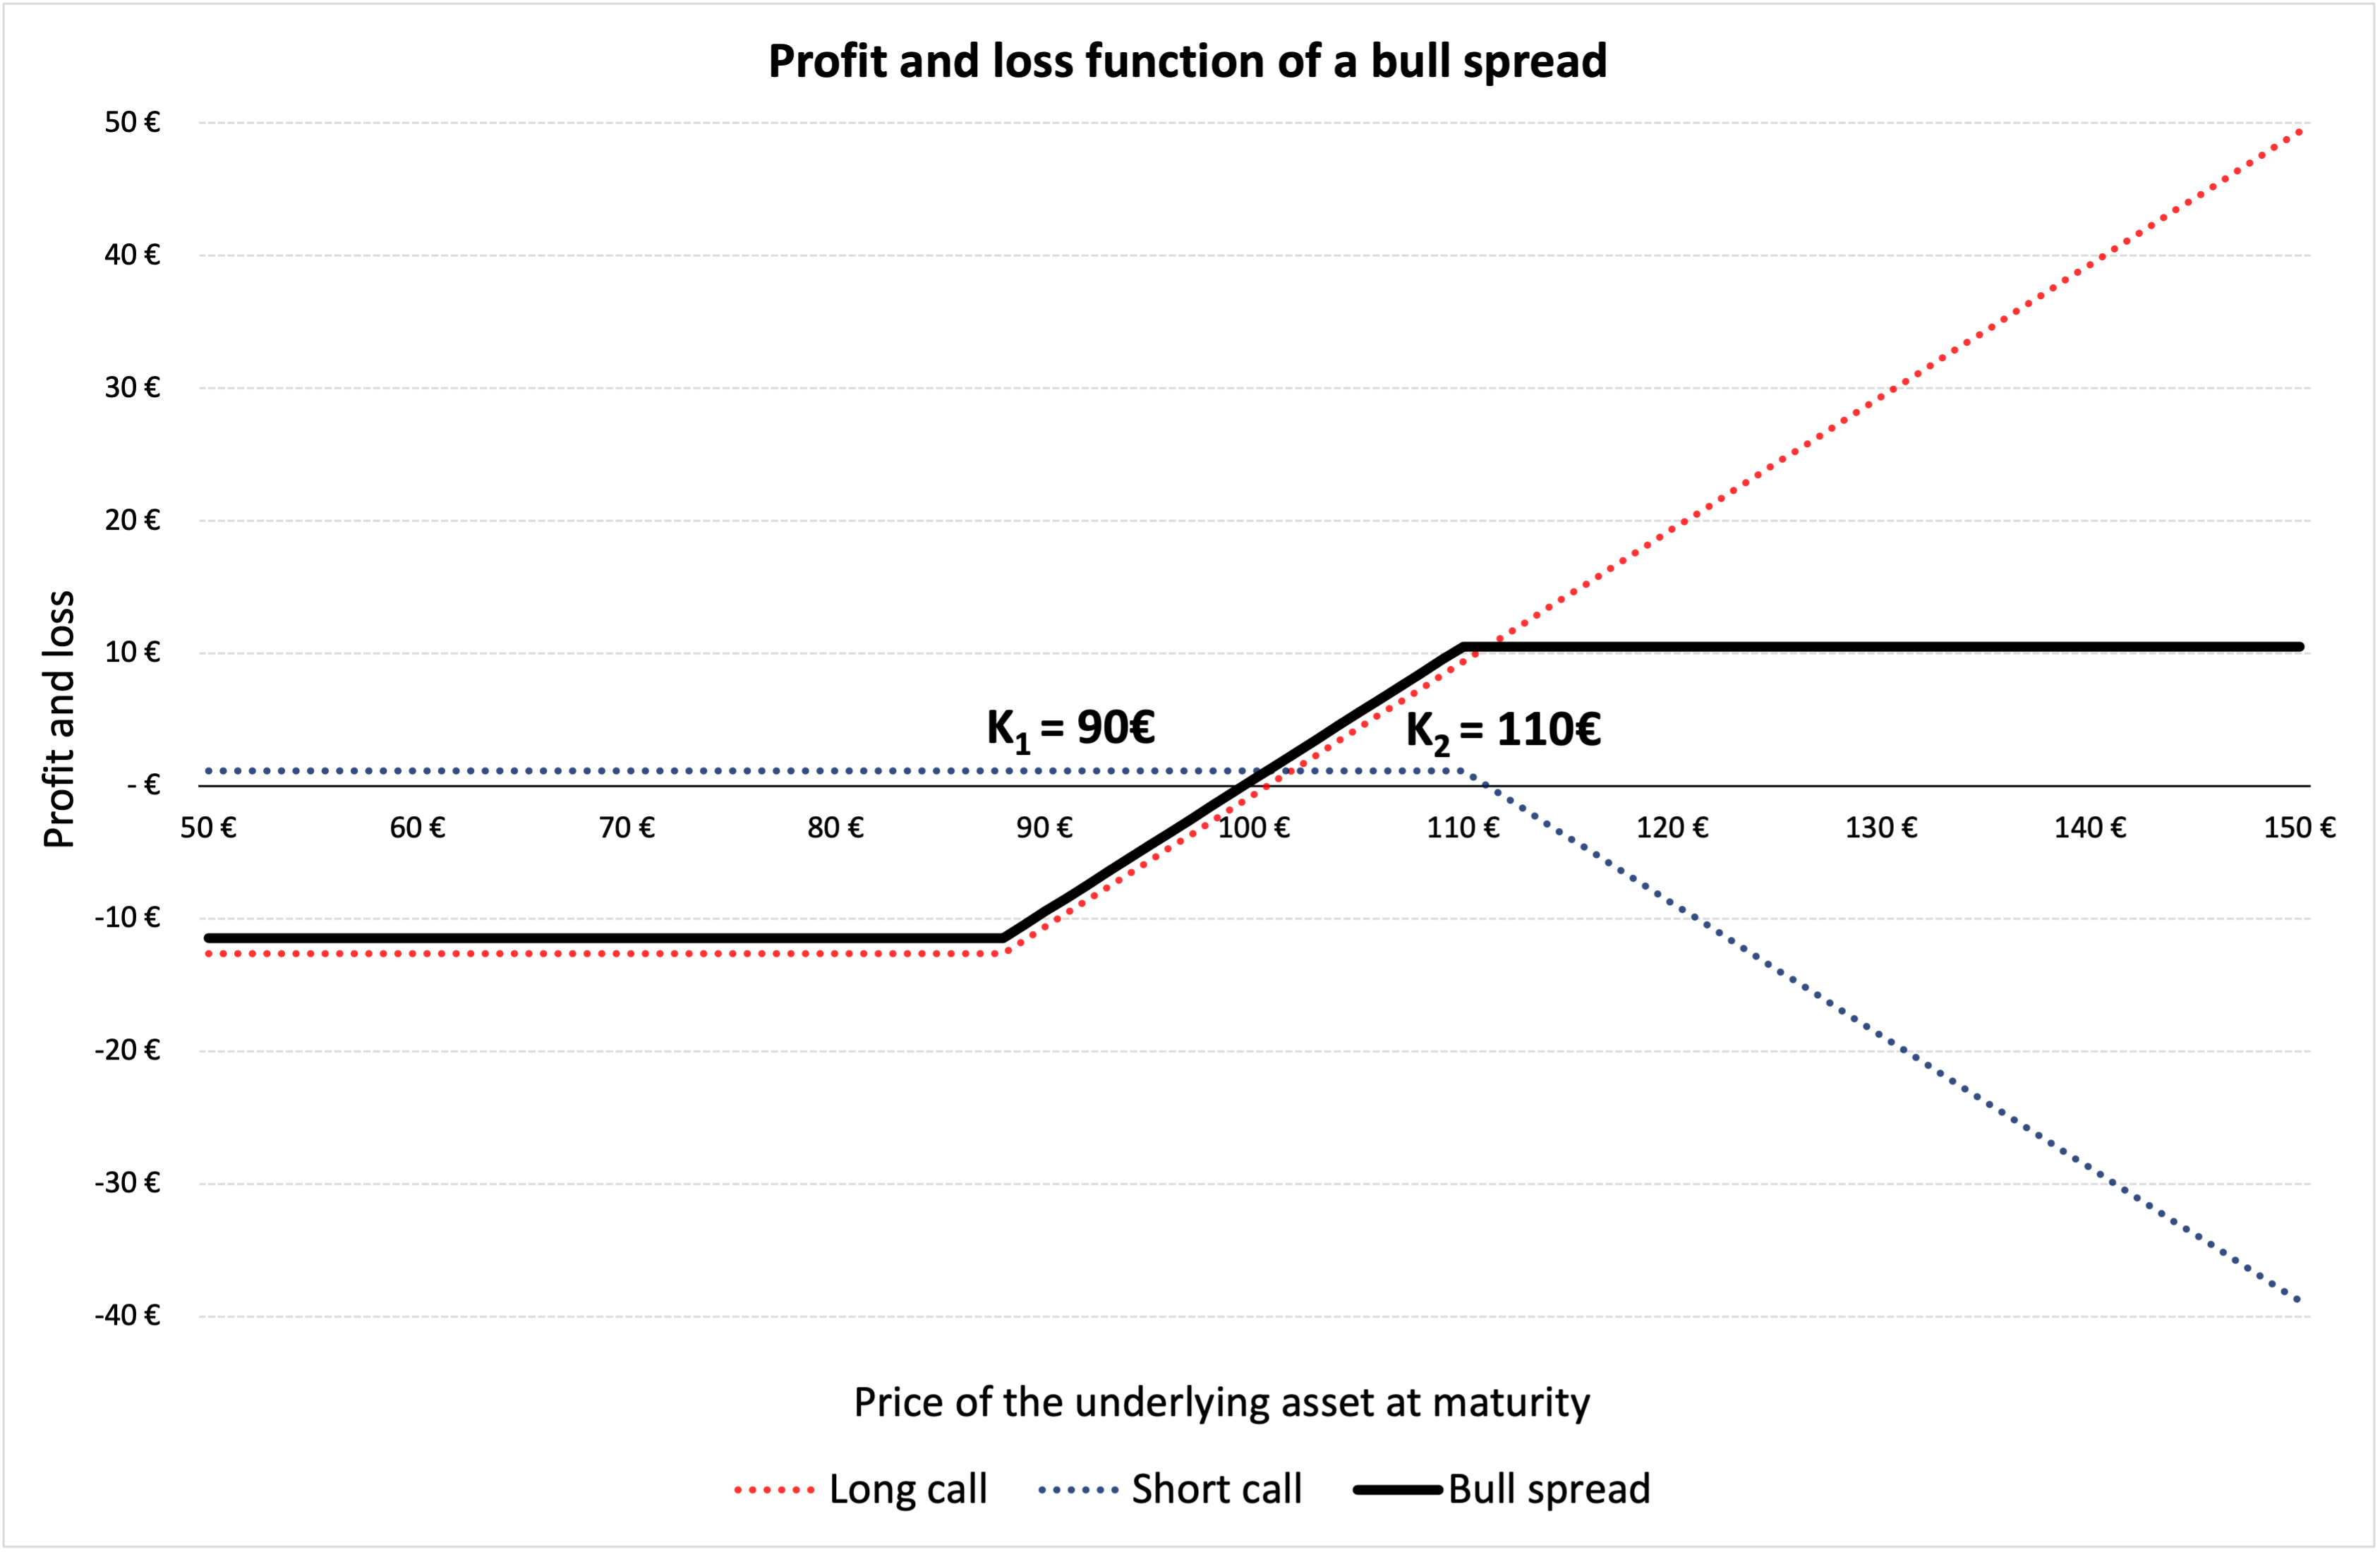
In Figure 1 below, we represent the profit and loss function of a bull spread strategy using a long and a short call option. K1 is the strike price of the long call i.e., €88 and K2 is the strike price of the short call position i.e., €110. The premium of the long call is equal to €12.62, and the premium of the short call is equal to €1.16 computed using the Black-Scholes-Merton model. The time to maturity (T) is of 18 days (i.e., 0.071 years). At the time of valuation, the price of the underlying asset (S0) is €100, the volatility (σ) of the underlying asset is 40% and the risk-free rate (r) is 1% (market data).

Figure 1. Profit and loss (P&L) function of a bull spread.

 Profit and loss (P&L) function of a bul spread

Source: computation by the author.

You can download below the Excel file for the computation of the bull spread value using the Black-Scholes-Merton model.

Download the Excel file to compute the bull spread value

Bear Spread

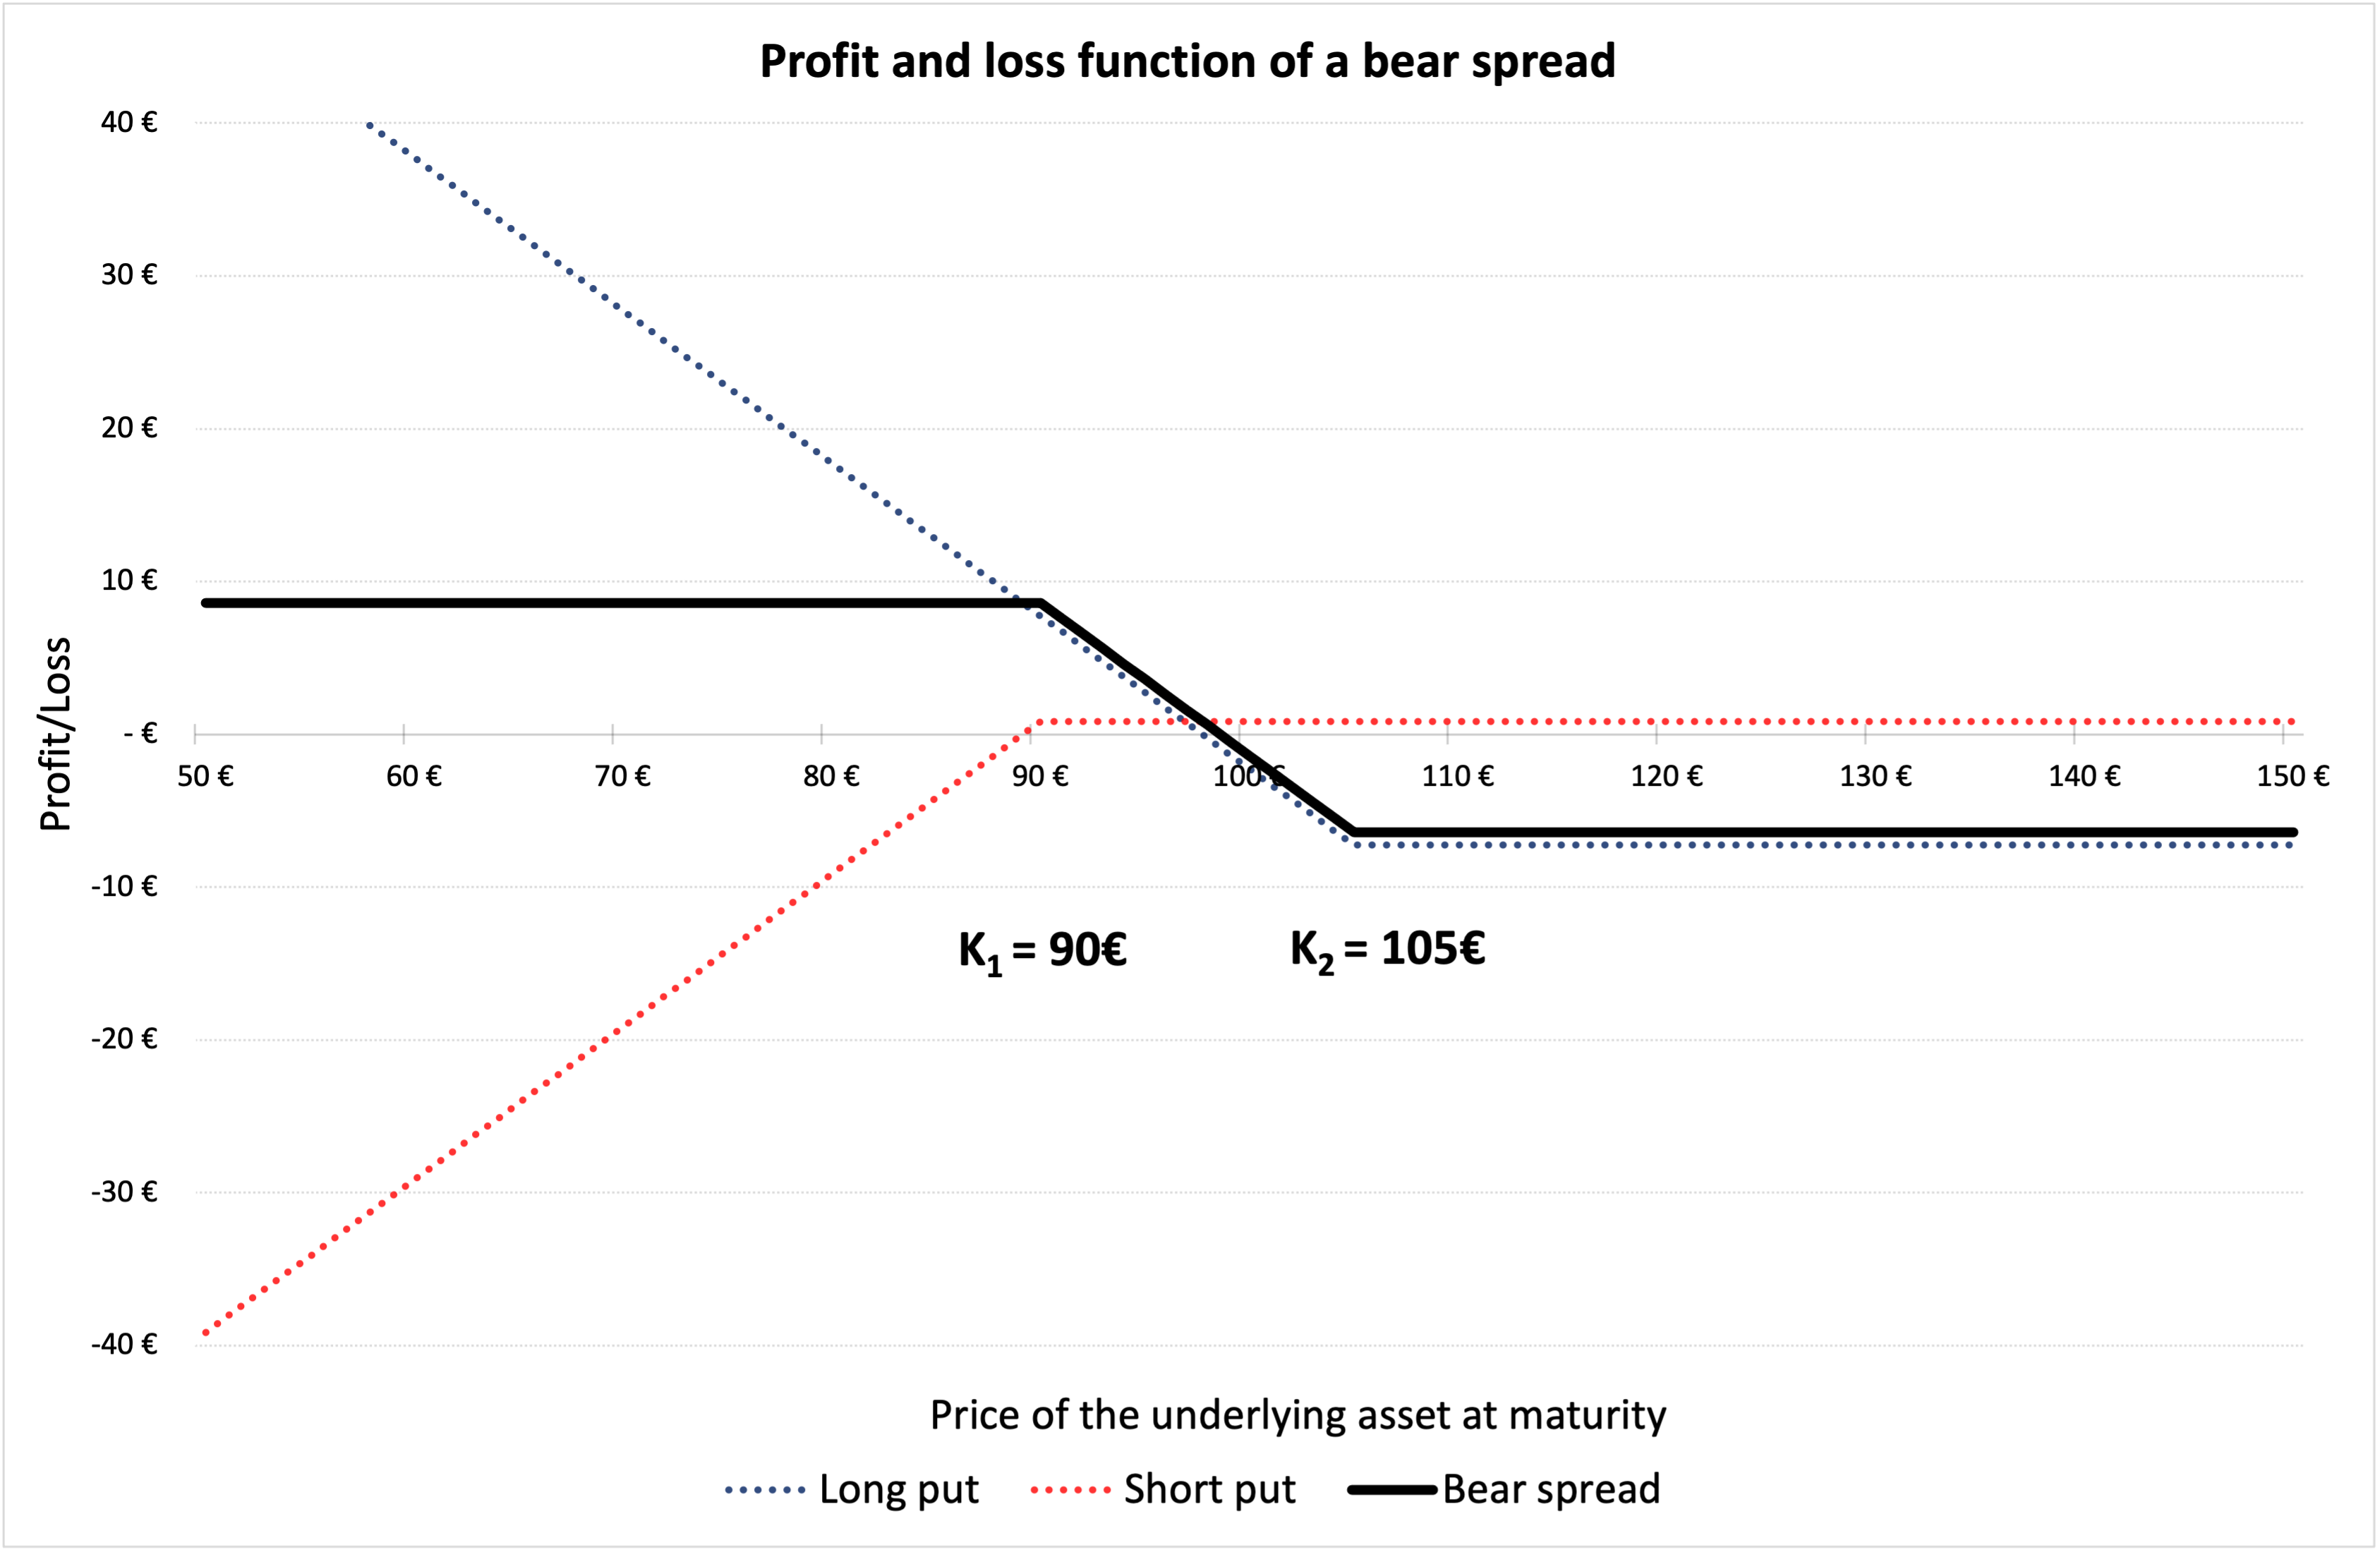
In a bear spread, the investor expects the price of the underlying asset to moderately decline in the near future. In order to hedge against the downside, the investor buys a put option with strike price K1 and sells another put option with strike price K2, with K1 lower than < K2. Initially, this initial position leads to a cash outflow since the put option bought (with strike price K1) has a higher premium than put option sold (with strike price K2) as K1 is lower than < K2.

Market Scenario

When the price of underlying asset is expected to moderately move down, investors chose to execute a bear spread and the expiration date is chosen such that it occurs after the expected price movement. Bear spread is a directional strategy where the investor is moderately bearish about the stock he is investing in. If the price increases significantly by the expiration of the put options, the investor loses money by using a bear spread.

Example

In Figure 2 below, we represent the profit and loss function of a bear spread strategy using a long and a short put option. K1 is equal to the strike price of the short put i.e., €90 and K2 is equal to the strike price of the long put i.e., €105. The premium of the short put is equal to €0.86, and the premium long put is equal to €7.26 computed using the Black-Scholes-Merton model.

The time to maturity (T) is of 18 days (i.e., 0.071 years). At the time of valuation, the price of the underlying asset (S0) is €100, the volatility (σ) of stock is 40% and the risk-free rate (r) is 1% (market data).

Figure 2. Profit and loss (P&L) function of a bear spread.

 Profit and loss (P&L) function of a bear spread

Source: computation by the author.

You can download below the Excel file for the computation of the bear spread value using the Black-Scholes-Merton model.

Download the Excel file to compute the bear spread value

Butterfly Spread

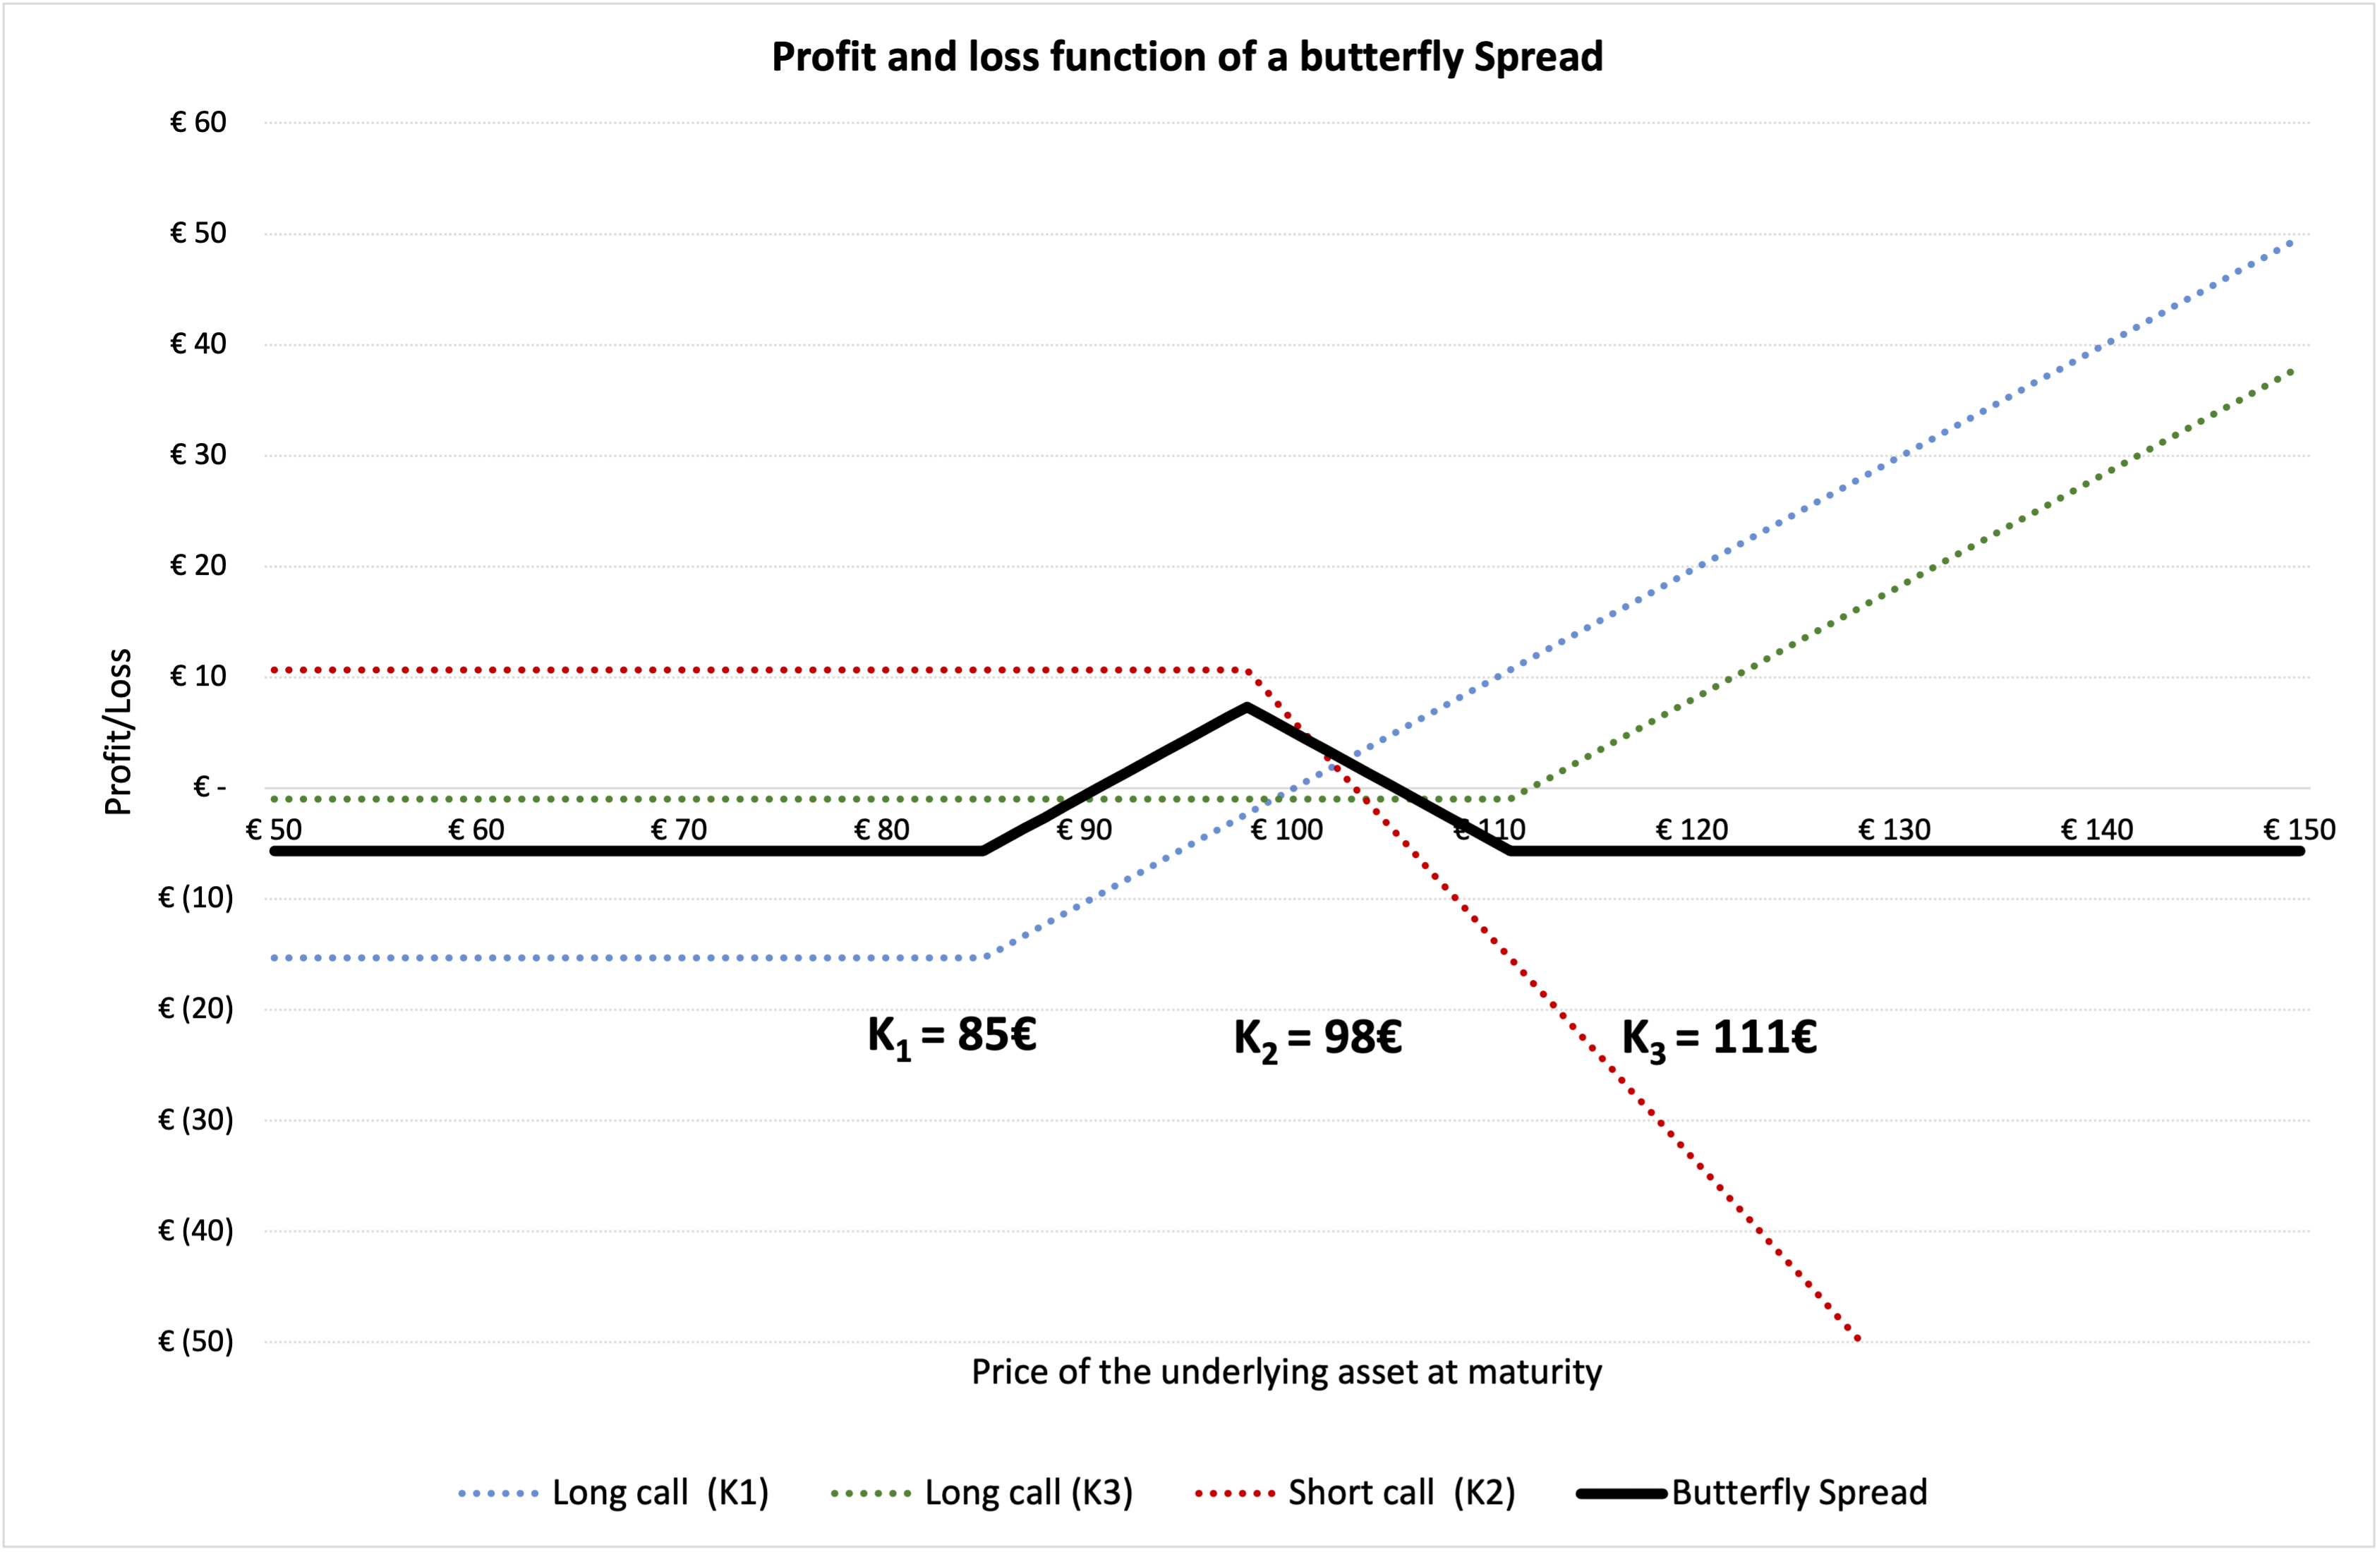
In a butterfly spread, the investor expects the price of the underlying asset to remain close to its current market price in the near future. Just as a bull and bear spread, a butterfly spread can be created using call options. In order to profit from the expected market scenario, the investor buys a call option with strike price K1 and buys another call option with strike price K3, where K1 < K3, and sells two call options at price K2, where K1 < K2 < K3. Initially, this initial position leads to a net cash outflow.

Market Scenario

When the price of underlying asset is expected to stay stable, investors chose to execute a butterfly spread and the expiration date is chosen such that the expected price movement occurs before the expiration date. Butterfly spread is a non-directional strategy where the investor expects the price to remain stable and close to the current market price. If the price movement is significant (either downward or upward) by the expiration of the call options, the investor loses money by using a butterfly spread.

Example

In Figure 3 below, we represent the profit and loss function of a butterfly spread strategy using call options. K1 is equal to the strike price of the long call position i.e., €85 and K2 is equal the strike price of the two short call positions i.e., €98 and K3 is equal to the strike price of another long call position i.e., €111. The premium of the long call K1 is equal to €15.332, the premium of the long call K3 is equal to €0.993 and the premium of the short call K2 is equal to €5.334 computed using the Black-Scholes-Merton model. The premium of the butterfly spread is then equal to €5.657 (= 15.332 + 0.993 -2*5.334), which corresponds to an outflow for the investor.

The time to maturity (T) is of 18 days (i.e., 0.071 years). At the time of valuation, the price of the (S0) is €100, the volatility (σ) of stock is 40% and the risk-free rate (r) is 1% (market data).

Figure 3. Profit and loss (P&L) function of a butterfly spread.

 Profit and loss (P&L) function of a butterfly spread

Source: computation by the author.

You can download below the Excel file for the computation of the butterfly spread value using the Black-Scholes-Merton model.

Download the Excel file to compute the butterfly spread value

Note that bull, bear, and butterfly spreads can also be created from put options or a combination of call and put options.

Related posts

   ▶ All posts about options

   ▶ Gupta A. Options

   ▶ Gupta A. The Black-Scholes-Merton model

   ▶ Gupta A. Option Greeks – Delta

   ▶ Gupta A. Hedging Strategies – Equities

Useful resources

Hull J.C. (2018) Options, Futures, and Other Derivatives, Tenth Edition, Chapter 12 – Trading strategies involving Options, 282-301.

About the author

Article written in January 2022 by Akshit GUPTA (ESSEC Business School, Grande Ecole Program – Master in Management, 2019-2022).

Understanding Options and Options Trading Strategies

Understanding Options and Options Trading Strategies

Luis RAMIREZ

In this article, Luis RAMIREZ (ESSEC Business School, Global BBA, 2019-2023) discusses the fundamentals behind options trading.

Financial derivatives

In order to understand and grasp the concept of options, knowledge of what is a derivative should be established. A financial instrument derivative is ultimately an instrument whose value derives from the value of an underlying asset (or multiple underlying assets). These underlying assets can of course be bonds, stocks, commodities, currencies, etc. Derivatives are widely common and used around the world; investment banks, commercial banks, and corporations (mainly multinational corporations) are all consistent users of derivatives. The purpose, or goal, behind derivatives is to manage risk, whether that be alleviating risk by hedging investments, or by taking on risk through speculative investments. To carry out this process, the investor must undertake one of the four types of derivatives. The four types are the following: options, forwards, futures, and swaps. In this article the focus will be solely placed on options.

What are options?

An option contract provides an investor the chance to either buy (for a call option) or sell (for a put option) the underlying asset, depending on what type of option they possess. Every option contract has an expiry date in which the investor can effectively exercise the option. A very important thing about options is that they provide investors the right, but not the obligation, to either buy or sell an asset (i.e., stock shares) at a price and at a date that have been agreed at the issuing of the cotnract.

Put options vs call options

Firstly, the main two different options are call and put options. Call options give investors (that bought the call option) the right to buy a stock at a certain price and at a certain date, and put options give investors (that bought the put option) the right to sell a stock at a certain price and at a certain date. The first step into acquiring options, either type, is paying a premium. This premium which is spent at the beginning of the process is the only loss that investors will face if the options are not exercised. However, the other side of the coin, options writers (sellers) are more exposed to risk as they are exposed to lose more than only the premium.

Sell-side vs buy-side

In an option contract, the price at which the asset is sold or bought is known as the strike price, or exercise price. When a call option has been bought, and the price of the share has
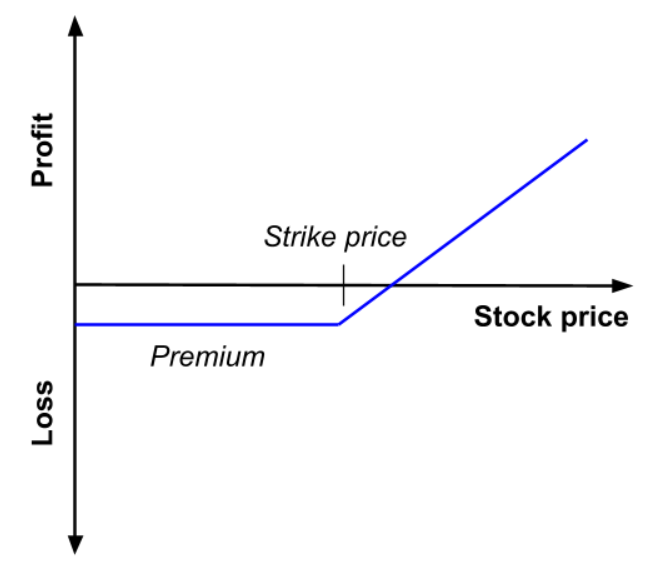
had a bullish trend and rises above the strike price, the investor can simply exercise his right to buy the share at the strike price, and then immediately sell it at the spot price, resulting in immediate profit. However, if the price of the share had a bearish trend and dropped below the strike price, the investor can decide not to exercise his right and will only lose the amount of premium paid in this case.

Figure 1. Profit and loss (P&L) of a long position in a call option
as a function of the price of the underlying asset at maturity

Profit and loss (P&L) as a function of the price of the underlying asset at maturity
Source: production by the author.

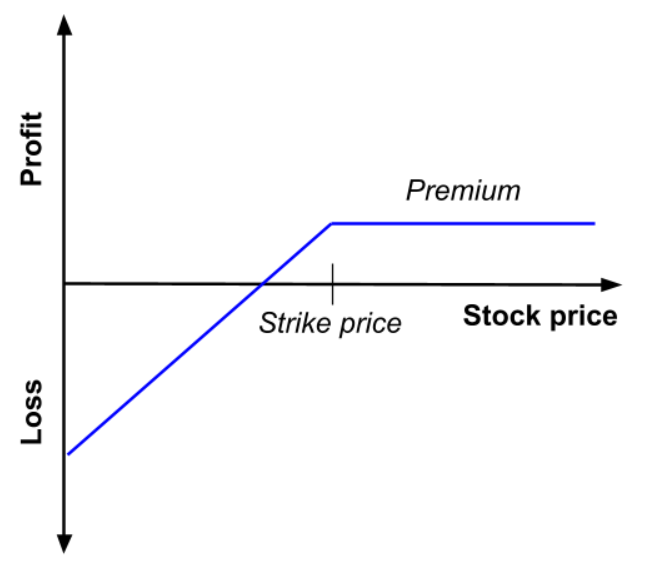
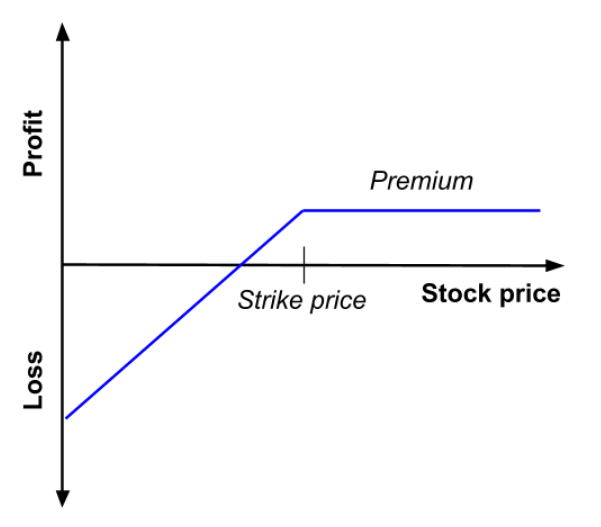
On the other hand, selling options differs. Selling options is commonly known as writing options. The way this works is that a writer receives the premium from a buyer, this is the maximum profit a writer can receive by selling call options. Normally, a call option writer is bearish, therefore he believes that the price of the stack will fall below that of the strike price. If indeed the share price falls below the strike price, the writer would profit the premium paid by the buyer, since the buyer would not exercise the option. However, if the share price surpassed the strike price, the writer would have to sell shares at the low strike price. The writer would then experience a loss, the size of the loss depends on how many shares and price the writer would have to use to cover the entire option contract. Clearly, the risk for call writers is much higher than the risk exposure call buyers when acquiring an option. To summarize, the call buyer can only lose the premium paid, and the call writer can face infinite risk because the price of a share can keep increasing.

Figure 2. Profit and loss (P&L) of a short position in a call option
as a function of the price of the underlying asset at maturity

Profit and loss (P&L) as a function of the price of the underlying asset at maturity
Source: production by the author.

As for put options, put buyers usually believe the share price will decrease under the strike price. If this does eventually happen, the investor can simply exercise the put and sell at strike price, instead of a lower spot price. If the investor wants to go long, he can substitute the shares used in the option contract and buy them for a cheaper spot price after the put has been exercised. However, if the spot price is above the strike price, and the investor choses to not exercise the put, the loss will once again only be the cost of the premium.

Figure 3. Profit and loss (P&L) of a long position in a put option
as a function of the price of the underlying asset at maturity

Profit and loss (P&L) as a function of the price of the underlying asset at maturity
Source: production by the author.

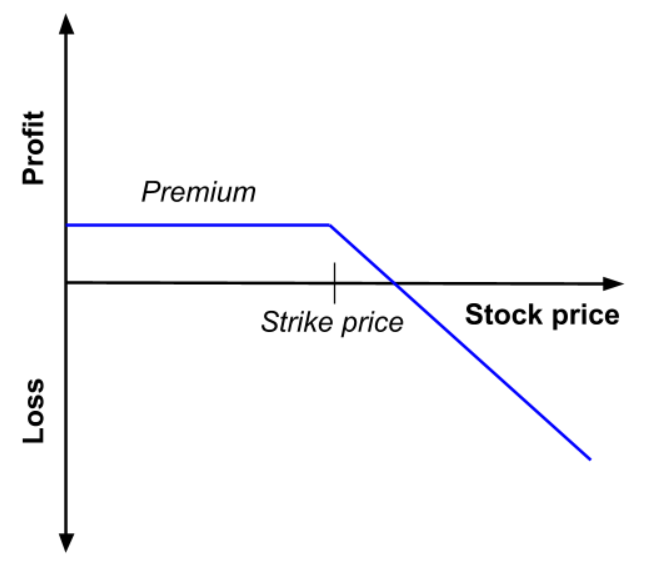
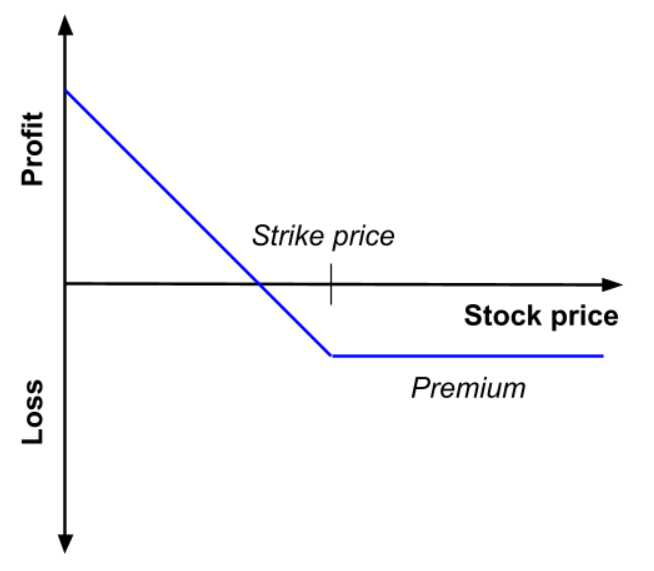
On the other hand, put writers think the share price will have a bullish trend throughout the duration of the option lifecycle. If the share price rises above strike price, the contract will expire, and the seller’s profit is the premium he received. If the share price decreases, and falls under the strike price, then the writer is obliged to buy shares at a strike price which higher than the spot price. This is when the risk is at the highest for a put writer, if the share price falls. Just like call writing, the loss can be hefty. Only that in the case of put writing, it happens if the share price tumbles down.

Figure 4. Profit and loss (P&L) of a short position in a put option
as a function of the price of the underlying asset at maturity

Profit and loss (P&L) as a function of the price of the underlying asset at maturity
Source: production by the author.

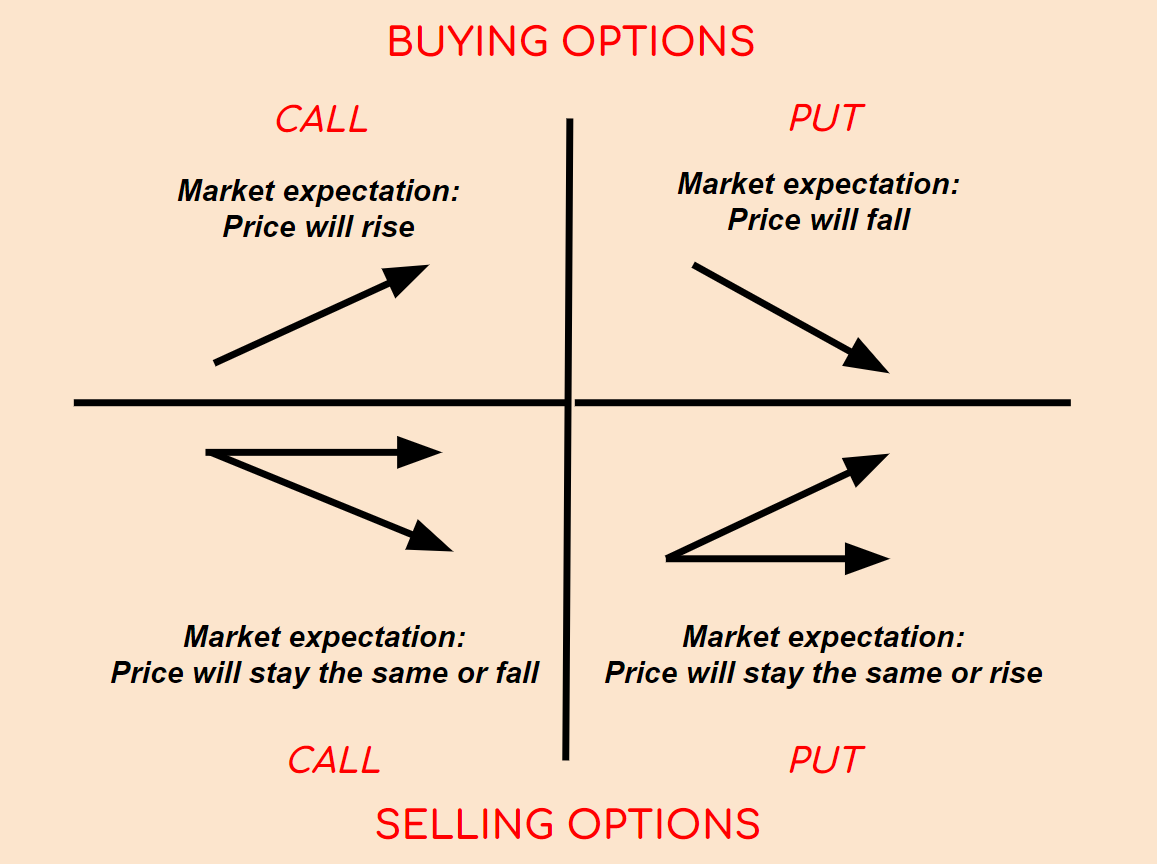
This can be shrunk down to knowing that call buyers can benefit from buying securities or assets at a lower price if the share price rises during the length of the option contract. Put buyers can benefit from selling assets at a higher strike price if the share price falls during the length of the option contract. As per writers, they receive a premium fee when writing options. However, it is not all positive points, option buyers need to pay the premium fee and discount this from their potential profit, and writers face an indefinite risk subject to the share price and quantity.

Figure 5. Market scenarios for buying and selling call and put options

Market scenarios for buying and selling call and put options
Source: production by the author.

Option Trading Strategies

Four trading strategies have already been mentioned, selling or buying either puts or calls. However, there are several different option trading strategies and new ones are being produced frequently, anyhow the article will focus on five trading strategies that most, if not all, investors are familiar with.

Covered Call

This trading strategy consists in the writer selling call options against the stock that he already owns. It is ‘covered’ because it covers the writer when the buyer of the option exercises his right to buy the shares, due to the writer already owning them, meaning that the writer can deliver the shares. This strategy is often used as an income stream from premiums. This is an employable strategy for those who believe that the asset they own will only experience a small change in price. The covered call is considered a low-risk strategy, and if used appropriately with a reliable stock, it can be a source of income.

Figure 6. Profit and loss (P&L) of a covered call
as a function of the price of the underlying asset at maturity

Profit and loss (P&L) of a covered call as a function of the price of the underlying asset at maturity
Source: production by the author.

Married put

Like a covered call, in a married put the investor buys an asset and then buys a put option with the strike price being equal to the spot price. This is done to be protected against a decrease in the asset price. Of course, when buying an option, a premium must be paid, which is a downside for a married put strategy. However, the married put limits the loss an investor could incur in case of a price decrease. On the other hand, if the price increases, profit is unlimited. This strategy is often used for volatile stocks.

Figure 7. Profit and loss (P&L) of a married put
as a function of the price of the underlying asset at maturity

Profit and loss (P&L) of a married put as a function of the price of the underlying asset at maturity
Source: production by the author.

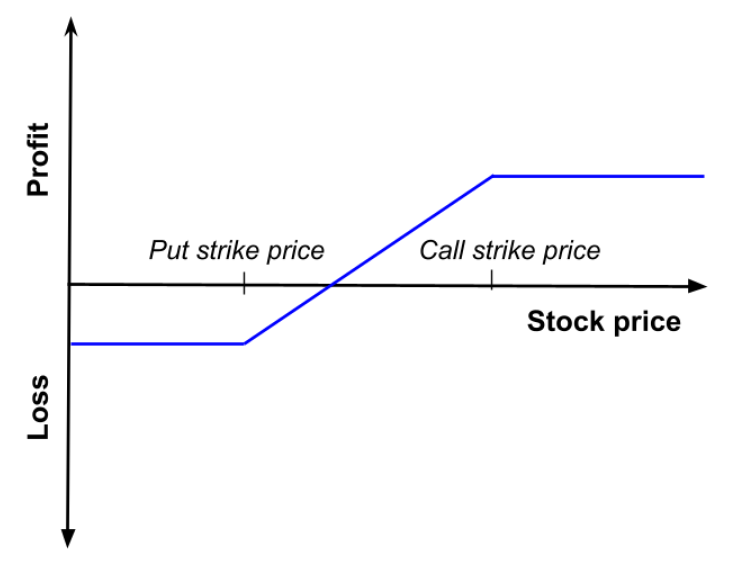
Protective Collar

This strategy is done when an investor buys a put option where the strike price is lower than the spot price, as well as instantly writing a call option where the strike price is higher than the spot price, this must be done by the investor owning said asset. This strategy protects the investor from a decrease in price. If the share price increases, large profits will be capped, however large losses will be also capped. When performing a protective collar, the best possibility for an investor is that the share price rises to the call strike price.

Figure 8. Profit and loss (P&L) of a protective collar
as a function of the price of the underlying asset at maturity

Profit and loss (P&L) of a protective collar as a function of the price of the underlying asset at maturity
Source: production by the author.

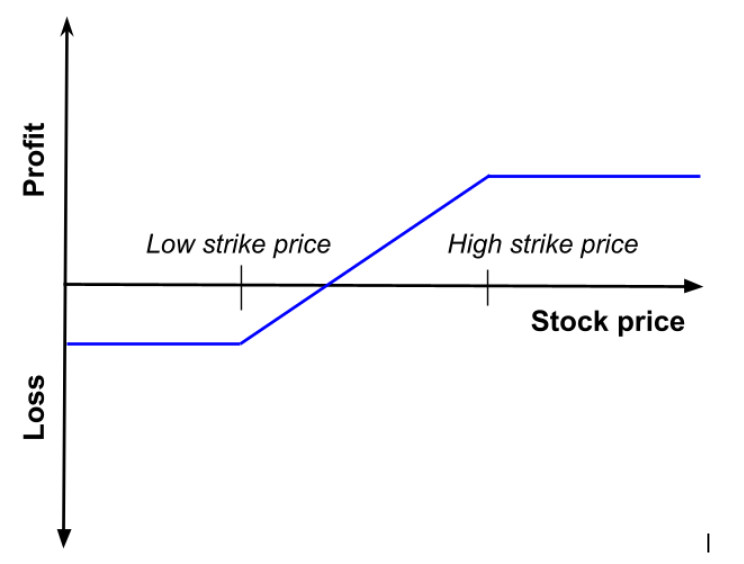
Bull Call Spread

In order to execute this strategy, an investor buys calls at the same time that he sells the equivalent order of calls, which have a higher strike price. Of course, both calls must be tied to the same asset. As seen on the name of this strategy, it is a strategy that an investor employs when he predicts a bullish trend. Just like the protective collar, it limits both, gains and losses.

Figure 9. Profit and loss (P&L) of a bull call spread
as a function of the price of the underlying asset at maturity

Profit and loss (P&L) of a bull call spread as a function of the price of the underlying asset at maturity
Source: production by the author.

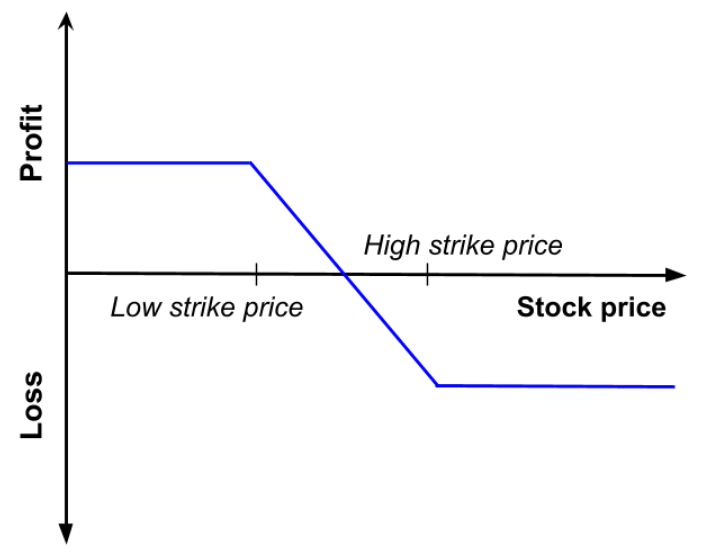
Bear Put Spread

This strategy is like the Bull Call Spread, only that it is in terms of a put option. The investor buys put options while he sells put options at a lower strike price. This can be done when the investor foresees a bearish trend, just like its call counterpart, the Bear Put Spread limits losses and gains.

Figure 10. Profit and loss (P&L) of a bear put spread
as a function of the price of the underlying asset at maturity

Profit and loss (P&L) of a bear put spread as a function of the price of the underlying asset at maturity
Source: production by the author.

Importance of options on financial markets

As seen on the variety of option trading strategies, and the different factors that play into each strategy mentioned, and dozens of other out there to explore, this instrument is a very utilized tool for investors, and financial institutions. The ‘options within options’ are of a huge variety and so much could be done. Many people have strong feelings towards this derivative, whether it is a negative, or positive stance, it all depends on the profits it brings. There is a lot of work behind options, and just like any other investment, due diligence is a key aspect of the procedure.

Related posts on the SimTrade blog

   ▶ All posts about Options

   ▶ Alexandre VERLET Understanding financial derivatives: options

   ▶ Akshit GUPTA Options

   ▶ Akshit GUPTA Option Trader – Job description

   ▶ Akshit GUPTA The Black-Scholes-Merton model

   ▶ Jayati WALIA Plain Vanilla Options

Useful Resources

Hull J.C. (2015) Options, Futures, and Other Derivatives, Ninth Edition.

Prof. Longin’s website Pricer d’options standards sur actions – Calls et puts (in French)

About the author

Article written in December 2021 by Luis RAMIREZ (ESSEC Business School, Global BBA, 2019-2023).

Plain Vanilla Options

Plain Vanilla Options

Jayati WALIA

In this article, Jayati WALIA (ESSEC Business School, Grande Ecole Program – Master in Management, 2019-2022) presents plain vanilla options.

Introduction

An option contract is a financial derivative that gives its holder the right (but not the obligation) to trade an underlying asset at a price and a date set in advance.

In finance, plain vanilla refers to the most basic version of any financial instrument with standard features. Thus, a plain vanilla option simply refers to a contract that provides the option to buy or sell an underlying stock (or any financial asset) at a fixed price (known as the exercise/strike price) at an expiration date in the future. The expiration date (or maturity) of the option is the date when the holder can exercise her option if she wants.

In the US, options were first traded on an exchange on 26th April 1973. The Chicago Board Options Exchange (CBOE) was the first to create standardized, listed options. Today, there are over 50 exchanges worldwide that trade options.

When an option is bought, its holder pays a fixed amount to the option writer as the cost for the flexibility of trading that the option provides. This cost, which is essentially the value of an option (and the margin taken by the issuer), is known as the premium. The premium depends on the characteristics of the option like the strike price and the maturity, and on market data like the price of the underlying asset and especially its volatility. Many different underlying assets can be traded through options including stocks, bonds, commodities, foreign currencies.

Types of options

Vanilla options are of two types: call and put.

Call options

The holder of a call option has the right to buy a particular asset at a strike price K at maturity T. If the asset price at maturity denoted by ST is higher than K, then it is beneficial for the call option holder to exercise his option at time T as the price set in the call option contract K is lower than the market price ST. If the asset price at maturity ST is lower than K, then it is not beneficial for the call option holder to exercise his option at time T as the price set in the call option contract K is higher than the market price ST; he is then better off to buy the asset on the market at price ST than at price K.

For example, consider a call option on BNP Paribas stock with a strike price of €50 and a maturity date March 31st. The holder of this call option thus has the right but not the obligation to buy one BNP Paribas stock for €50 at maturity. He will exercise his option on March 31st if and only if the stock price is higher than €50.

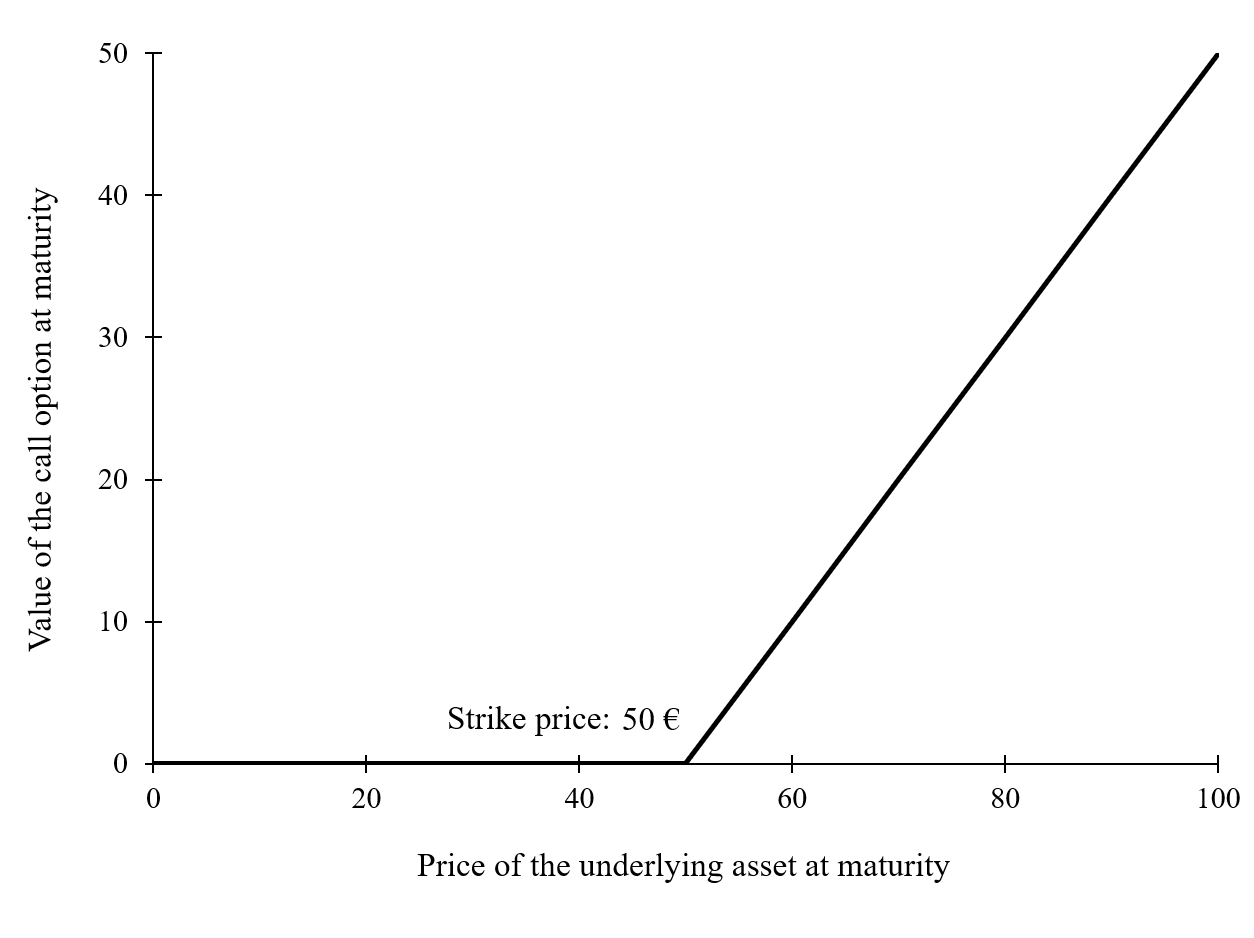
The equation below gives the pay-off function of a call option that is the value of the call option at maturity T denoted by CT as a function of the price of the underlying asset ST.

Payoff formula for a call option

Figure 1 gives a graphical representation of the pay-off function of a call option that is the value of the call option at maturity T as a function of the price of the underlying asset at maturity T, ST, for a given strike price (equal to €50 in the figure).

Figure 1. Pay-off function of a call option
 Payoff for a call option

Put options

Similarly, the holder of a put option has the right to sell a particular asset at a strike price K at maturity T. If the asset price at maturity denoted by ST is higher than K, then it is beneficial for the put option holder not to exercise his option at time T as the price set in the put option contract K is lower than the market price ST; he is then better off to sell the asset on the market at price ST than at price K. If the asset price at maturity ST is lower than K, then it is beneficial for the put option holder to exercise his option at time T as the price set in the put option contract K is higher than the market price ST.

For example, consider a put option on BNP Paribas stock with a strike price of €50 and a maturity date March 31st. The holder of this put option thus has the right but not the obligation to sell one BNP Paribas stock for €50 at maturity. He will exercise his put option on March 31st if and only if the stock price is lower than €50.

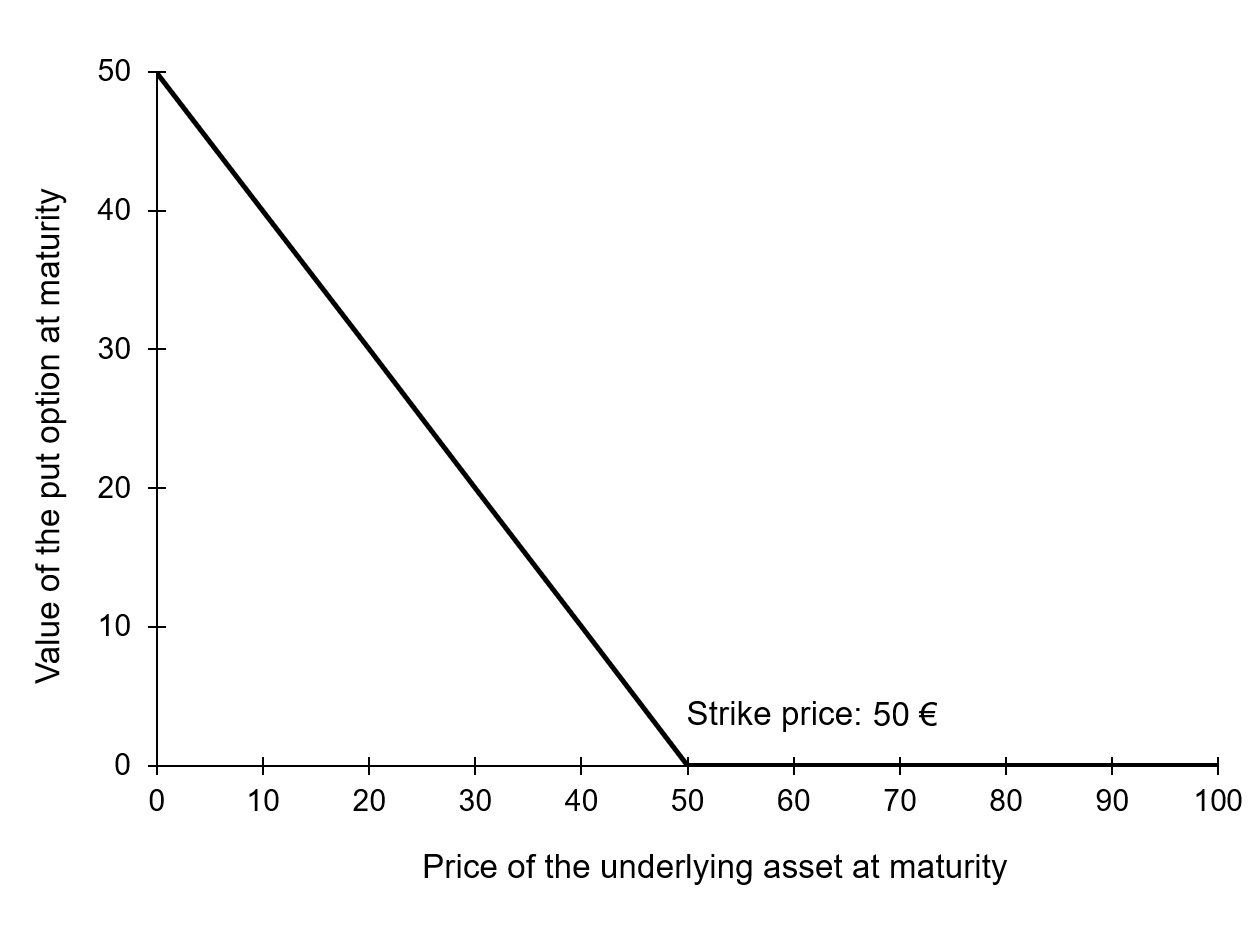
The equation below gives the pay-off function of a put option that is the value of the put option at maturity T denoted by PT as a function of the price of the underlying asset ST.

Payoff formula for a put option

Figure 2 gives a graphical representation of the pay-off function of a put option that is the value of the put option at maturity T as a function of the price of the underlying asset ST for a given strike price (equal to €50 in the figure).

Figure 2. Pay-off function of a put option
 Payoff for a put option

Types of exercise

Options can be categorized based on their exercise restrictions.

American options

American options have the most flexible arrangement allowing holders to exercise their options at any time prior to the expiration date. They are widely traded over listed exchanges.

European options

European options provide less flexibility and allow holders to exercise options on only one specific date, which is the expiration date. They thus have a lower value compared to American options and are generally traded OTC.

Bermudan options

There are also Bermudan options that allow exercise of options on a set of specific dates before the expiration and thus provide holders a level of flexibility midway between American and European Options.

Moneyness

Options can also be characterized by their “moneyness” which compares the current price of the underlying asset to the option strike.

In-the-money options

An option with a positive intrinsic value is said to be ‘in the money’. This is the case for a call option if the current market price of the asset is higher than the strike price, and similarly for a put option if the current market price of the asset is lower than the strike price.

Out-of-the-money options

An option with a zero intrinsic value is said to be ‘out of the money’. This is the case for a call option if the current market price of the asset is lower than the strike price, and similarly for a put option if the current market price of the asset is higher than the strike price.

At-the-money options

An option with a strike price close or equal to the current market price is said to be ‘at the money’.

Option writers

The above discussion mainly revolves around option purchasers. However, there is also someone who is liable to sell (for a call) or buy (for a put) the underlying security whenever any holder exercises an option. The writer of an option is the person who is obligated to buy/sell the underlying in case of a call/put exercise. As a counterpart, the writer also receives the option premium from the holder.

The best-case scenario for a writer would be that the option is not exercised by its holder as the option remains out of the money (the writer earning the premium without being obliged to pay the cash flow at maturity). However, option writers are exposed to downside risks especially if the options they write are not covered i.e., holding a long or short position already in the underlying security depending on the option written.

Benefits

For traders with strong market views looking to leverage benefits from small to medium-term fluctuations in market price, buying options is an efficient means to offset their risk exposure. The buyer only risks a small amount of investment, and the downside is only limited to the initial premium whereas the upside is a high payoff if the speculation is in her/his favor. The traders can also take up multiple positions in different assets through options and leverage trade opportunities with profitable positions covering more than the hedging costs.

Option Trading

Most vanilla options are traded through exchanges that make it convenient to match buyers with sellers and vice versa. Trading of standardized contracts also promotes liquidity of the instruments in the market. Vanilla options generally come in series of standardized strike prices and expiration dates. For instance, for an option contract on an Apple Inc. stock (AAPL) expiring on 20th August 2021, the offered strike prices are $115, $120, $125, $130 and so on. Similarly, the expiration dates for listed stock options is generally the third Friday of the month in which the contract expires. If the Friday falls on a holiday, the expiration date becomes Thursday immediately before the third Friday.

Option pricing

The value an option is known at maturity as it is given by the contract. But what is the value of an option at the time of its issuance or at a time before maturity? Many mathematical models have been developed to answer this question. The most famous model is the Black-Scholes-Merton option pricing model. It uses a Brownian motion to model the behavior of stock market prices.

Use of options

Hedging

Options are commonly used in hedging. For instance, you can purchase an option on a stock to limit your losses to say 15% of your position, should the stock decline more than that during the option period.

Speculation

If one has a strong view about the potential market direction of an underlying security, one can make great returns on exploiting options, provided the view was right. This is essentially speculation in option trading. For instance, if you have a bullish opinion regarding a stock, you can purchase a call option on it that will allow you to purchase the stock at the strike price that will be lower than the future price (hopefully!). Thus, if you are right, you could exercise the option and your payoff would be the price difference between the stock price and the strike price. If you are wrong, you lose out on the premium you paid for the option.

Volatility

The volatility of the underlying asset affects positively option prices: stocks with higher volatility have more expensive option contracts that those with low volatility. In fact, the implied volatility (IV) of an option is that value of the volatility of the underlying instrument for which an option pricing model (such as the Black-Scholes-Merton model) will return a theoretical value equal to the current market price of that option. Hence, when the implied volatility increases, the price of options increases as well, assuming all other factors remain constant. When the implied volatility increases after a trade has been placed, it is good news for the option owner and, conversely bad news for the seller. Inversely, when the implied volatility decreases after a trade has been placed, it is bad news for the option owner and, conversely good news for the seller.

Note that the implied volatility tends to depend on the strike price and maturity date of the options for a given underlying asset. Once the implied volatility for the at-the-money contracts is determined in any given expiration month, market makers use pricing models and volatility skews to calculate implied volatility at other strike prices that are less heavily traded. So, every option has an associated volatility and risk profiles can vary drastically among options. Traders may at times balance out the risk of volatility by hedging one option with another.

Thus, it is essential to interpret and analyze risks before venturing into option trading. There are also many strategies that can be applied to vanilla options in order to benefit better and limit risk such as long and short calls/puts, bull and bear spreads, straddles and strangles, butterflies, condors among many.

Related posts on the SimTrade blog

All posts about Options

▶ Jayati WALIA Derivatives Market

▶ Jayati WALIA Black-Scholes-Merton option pricing model

▶ Jayati WALIA Brownian Motion in Finance

Useful Resources

Nasdaq Historical data for Apple stock

AVATRADE What are vanilla options

TheStreet Options Trading

About the author

The article was written in August 2021 by Jayati WALIA (ESSEC Business School, Grande Ecole Program – Master in Management, 2019-2022).
Derivatives Market

Derivatives Market

Jayati WALIA

In this article, Jayati WALIA (ESSEC Business School, Grande Ecole Program – Master in Management, 2019-2022) presents an overview of derivatives market.

Introduction

A financial market refers to a marketplace where various kinds of financial securities such as stocks, bonds, commodities, etc. are traded. The term ‘market’ can also refer to exchanges that are legal organizations that facilitate the trade of financial securities between buyers and sellers. In any case, these markets are categorized based of the type of financial securities that are traded through them. One such financial market is the Derivatives Market.

Derivatives market thus refers to the financial marketplace where derivative instruments such as futures, forwards and options contracts are traded between counterparties.

It was during the 1980s and 1990s that the financial markets saw a major growth in the trade of derivatives. A derivative is a financial instrument whose value is derived from the value of an underlying asset such as stocks, bonds, currencies, commodities, interest rates and/or different market indices. These underlying assets have fluctuating prices and returns, and derivatives provides a means to investors to reduce the risk exposure and leverage profits on these assets. Thus, derivatives are an essential class of financial instruments and central to the modern financial markets providing not just economic benefits but also resilience against risks. The most common derivatives include futures, forwards, options and swap contracts.

As per the European Securities and Markets Authority (ESMA), derivatives market has grown impressively (around 24 percent per year in the last decade) into a truly global market with over €680 trillion of notional amount outstanding. The interest rate derivatives (IRDs) accounted for 82% of the total notional amount outstanding followed by currency derivatives at 11%.

Main types of derivative contracts

Derivatives derive their value from an underlying asset, or simply an ‘underlying’. There is a wide range of financial instruments that can be an underlying for a derivative such as equities or equity index, fixed-income instruments, foreign currencies, commodities, and even other securities. And thus, depending on the underlying, derivative contracts can derive their values from corresponding equity prices, interest rates, foreign exchange rates, prices of commodities and probable credit events. The most common types of derivative contracts are elucidated below:

Forwards and Futures

Forward and futures contracts share a similar feature: they are an agreement between two parties to buy or sell a specified quantity of an underlying asset at a specified price (or ‘exercise price’) on a predetermined date in the future (or ‘expiration date’). While forwards are customized contracts i.e., they can be tailor-made according to the asset being traded, expiry date and price, and traded Over-the-Counter (OTC), futures are standardized contracts traded on centralized exchanges. The party that buys the underlying is said to be taking a long position while the party that sells the asset takes a short position and both parties are obligated to fulfil their part of the contract.

Options

An option contract is a financial derivative that gives its holder the right (but not the obligation) to trade an underlying asset at a price set in advance irrespective of the market price at maturity. When an option is bought, its holder pays a fixed amount to the option writer as cost for this flexibility of trading that the option provides, known as the premium. Options can be of the types: call (right to buy) or put (right to sell).

Swaps

Swaps are agreements between two counterparties to exchange a series of cash payments for a stated period of time. The periodic payments charged can be based on fixed or floating interest rates, depending on contract terms decided by the counterparties. The calculation of these payments is based on an agreed-upon amount, called the notional principal amount (or just notional).

Exchange-traded vs Over-the-counter Derivatives Market

Exchange-traded derivatives markets

Exchange-traded derivatives markets are standardized markets for derivatives trading and follows rules set by the exchange. For instance, the exchange sets the expiry date of the derivatives, the lot-size, underlying securities on which derivatives can be created, settlement process etc. The exchange also performs the clearing and settlement of trades and provide credit guarantee by acting as a counterparty for every trade of derivatives. Thus, exchanges provide a transparent and systematic course of action for any derivatives trade.

Over-the-counter markets

Over-the-counter (also known as “OTC”) derivatives markets on the other hand, provide a lesser degree of regulations. They were almost entirely unregulated before the financial crisis of 2007-2008 (also a time when derivatives markets were criticized, and the blame was placed on Credit Default Swaps). OTCs are customized markets and run by dealers who hedge risks by indulging in derivatives trading.

Types of market participants

The participants in the derivative markets can be categorized into different groups namely,

Hedgers

Hedging is a risk-neutralizing strategy when an investor seeks to protect a current or anticipated position in the market by limiting their risk exposure. They can do so by taking up an offset or counter position through derivative contracts. Parties such as individuals or companies who perform hedging are called Hedgers. The hedger thus aims to eliminate volatility against fluctuating prices of underlying securities and protect herself/himself from any downsides.

Speculators

Speculation is a very common technique used by traders and investors in the derivatives market. It is based on when traders have a strong viewpoint regarding the market behavior of any underlying security and though it is risky, if the viewpoint is correct, the speculation may reward with attractive payoffs. Thus, speculators use derivative contracts with a view to make profit from the subsequent price movements. They do not have any risk to hedge, in fact, they operate at a relatively high-risk level in anticipation of profits and provide liquidity in the market.

Arbitrageurs

Arbitrage is a strategy in which the participant (or arbitrageur) aims to make profits from the price differences which arise in the investments made in the financial markets as a result of mispricing. Arbitrageurs aim to earn low risk profits by taking two different positions in the same or different contracts (across different time periods) or on different exchanges to in-cash on price discrepancies or market inefficiencies.

Margin Traders

Margin is essentially the collateral amount deposited by an investor investing in a financial instrument to the counterparty in order to cover for the credit risk associated with the investment. In margin trading, the trader or investor is not required to pay the total value of your position upfront. Instead, they only need pay the margin amount which may vary and are usually fixed by the stock exchanges considering factors like volatility. Thus, margin traders buy and sell securities over a single session and square off their position on the same day, making a quick payoff if their speculations are right.

Criticism of derivatives

While derivatives provide numerous benefits and have significantly impacted modern finance and markets, they pose many risks too. In a 2002 letter to Berkshire Hathaway shareholders, Warren Buffet even described derivatives as “financial weapons of mass destruction”.

Derivatives are more highly leveraged due to relatively relaxed regulations surrounding them, and where one may need to put up half the money or more with buying other securities, derivatives traders can get by with just putting up a few percentage points of the total value of a derivatives contract as a margin. If the price of the underlying asset keeps falling, covering the margin account can lead to enormous losses. Derivatives are thus often criticized as they may allow investors to obtain unsustainable positions that elevates systematic risk so much that it can be equated to legalized gambling. Derivatives are also exposed to counterparty credit risk wherein there is scope of default on the contract by any of the parties involved in the contract. The risk becomes even greater while trading on OTC markets which are less regulated.

Derivatives have been associated with a number of high-profile credit events over the past two decades. For instance, in the early 1990s, Procter and Gamble Corporation lost more than $100 million in transactions in equity swaps. In 1995, Barings collapsed when one of its traders lost $1.4 billion (more than twice its then capital) in trading equity index derivatives.

The amounts involved with derivatives-related corporate financial distresses in the 2000s increased even more. Two such events were the bankruptcy of Enron Corporation in 2001 and the near collapse of AIG in 2008. The point of commonality among these events was the role of OTC derivative trades. Being an AAA-rated company, AIG was being exempted from posting collateral on most of its derivatives trading in 2008. In addition, AIG was unique among CDS market participants and acted almost exclusively as credit protection seller. When the global financial crisis reached its peak in late 2008, AIG’s CDS portfolios recorded substantial mark-to-market losses. Consequently, the company was asked to post $40 billion worth of collateral and the US government had to introduce a $150 billion financial package to prevent AIG, once the world’s largest insurer by market value, from filing for bankruptcy.

Conclusion

Derivatives were essentially created in response to some fundamental changes in the global financial system. If correctly handled, they help improve the resilience of the system, hedge market risks and bring economic benefits to the users. Thus, they are expected to grow further with financial globalization. However, past credit events have exposed many weaknesses in the organization of their trading. The aim is to minimize the risks associated with such trades while enjoying the benefits they bring to the financial system. An important challenge is to design new rules and regulations to mitigate the risks and to promote transparency by improving the quality and quantity of statistics on derivatives markets.

Related posts on the SimTrade blog

   ▶ All posts about Options

   ▶ Alexandre VERLET Understanding financial derivatives: options

   ▶ Jayati WALIA Plain Vanilla Options

   ▶ Alexandre VERLET Understanding financial derivatives: forwards

   ▶ Alexandre VERLET Understanding financial derivatives: futures

   ▶ Alexandre VERLET Understanding financial derivatives: swaps

Useful resources

Role of Derivatives in the 2008 Financial Crisis

ESMA Annual Statistical Report 2020

About the author

The article was written in August 2021 by Jayati WALIA (ESSEC Business School, Grande Ecole Program – Master in Management, 2019-2022).

Understanding financial derivatives: options

Alexandre VERLET

In this article, Alexandre VERLET (ESSEC Business School, Master in Management, 2017-2021) explains why financial markets invented options and how they function.

A historical perspective on options

The history of options is surrounded by legends.. This story is linked to human’s desire to control the unpredictable, sometimes to protect himself from it, often to profit from it. This story is also that of a flower: the tulip. At the beginning of the seventeenth century, in the Netherlands, the tulip was at the origin of the first known speculative bubble. Furthermore, this was historically the first time that options contracts were used on such a large scale. The possibility of profiting from the rise in the price of tulips by paying only a small part of the price aroused great interest on the part of speculators, thus increasing the price of the precious flower tenfold. Soon the price of the tulip reached levels completely unrelated to its market value. Then, suddenly, demand dried up, causing the price to fall even faster than the previous rise. The crisis that followed had serious consequences and confirmed Amsterdam’s loss of world leadership in finance to the benefit of London, which had already taken over the Dutch capital as the world’s center for international trade. Educated by the Dutch experience, the British became increasingly sceptical about options, so much so that they eventually banned them for over a century. The ban was finally lifted towards the end of the 19th century. It was also at this time that options were introduced in the United States.

The American options market entered a new dimension at the end of the 20th century. Indeed, 1973 was a pivotal year in the history of options in more ways than one. In March 1973, a floating exchange rate regime was adopted as the standard for converting international currencies, creating unprecedented instability in the currency market. This was also the year of the “first oil shock”. Also in 1973, the Chicago Board Options Exchange (CBOE), the first exchange entirely dedicated to options, opened its doors. The same year saw the birth of the Options Clearing Corporation (OCC), the first clearing house dedicated to options. Finally, 1973 saw the publication of the work of Fischer Black and Myron Scholes. This work was completed by Robert Merton, leading to the Black-Scholes-Merton model. This model is of capital importance for the evaluation of the price of options.

What’s an option?

There are two types of option contracts: calls and puts. Since these contracts can be both bought and sold, there are four basic transactions. Thus, in options trading, it is possible to either go long (buy a call contract, buy a put contract), or to be short (sell a call contract, sell a put contract). An option contract can therefore be defined as a contract that gives the counterparty buying the contract (the long) the right, but not the obligation, to buy or sell an asset (the underlying) at a predetermined price (the strike price), date (the maturity date) and amount (the nominal value). It is useful to note that the counterparty selling the contracts (the short) is in a completely different situation. This counterparty must sell or buy the underlying asset if the transaction is unfavorable to it. However, if the transaction is favorable, this counterparty will not receive any capital gain, because the counterparty buying the contract (the long) will not have exercised its call option. To compensate for the asymmetry of this transaction, the counterparty selling the option contracts (the short) will receive a premium at the time the contract is initiated. The selling counterparty therefore has a role similar to that of an insurance company, as it is certain to receive the premium, but has no control over the time of payment or the amount to be paid. This is why it is important to assess the amount of the premium.

The characteristic of an option contract

Options contracts can have as underlying assets financial assets (interest rates, currencies, stocks, etc.), physical assets (agricultural products, metals, energy sources, etc.), stock or weather indices, and even other derivatives (futures or forwards). The other important feature of an option contract is its expiration date. Options contracts generally have standardized expiry dates. Expiry dates can be monthly, quarterly or semi-annually. In most cases, the expiration date coincides with the third Friday of the expiration month. In addition, options whose only possible exercise date is the maturity date are called European options. However, when the option can be exercised at any time between signing and expiration, it is called an American option. Ultimately, what will drive the holder of an option contract to exercise his right is the difference between the underlying price and the strike price. The strike price is the purchase or sale price of the underlying asset. This price is chosen at the time the option contract is signed. The strike price will remain the same until the end of the option contract, unlike the price of the underlying asset, which will vary according to supply and demand. In organised markets, brokers usually offer the possibility to choose between several strike prices. The strike price can be identical to the price of the underlying asset. The option is then said to be “at-the-money” (or “at par”).

In the case of a call, if the proposed strike price is higher than the price of the underlying, the call is said to be “out of the money”.

Are you “in the money”?

Let’s take an example: a share is quoted at 10 euros. You are offered a call with a price of 11 euros. If we disregard the premium, we can see that a resale of the call, immediately after buying it, will result in a loss of one euro. For this reason, the call is said to be “out of the money”. On the other hand, when the strike price offered for a call is lower than the price of the underlying asset, the call is said to be “in the money”. Another example: the stock is still trading at 10 euros. This time you are offered a call with a strike price of 9 euros. If you disregard the premium, you can see that you earn one euro if you sell the call immediately after buying it. This is why this call is called “in the money”. Note that our potential gain of one euro is also called the “intrinsic value” of the call. Of course, the intrinsic value is only valid for “in the money” options. For puts, it is the opposite. A put is said to be “out of the money” if its strike price is lower than the price of the underlying asset.

Finally, a put is said to be “in the money” if its strike price is higher than the price of the underlying asset. If you are one of those people who think that you can make money with options by simply buying and selling calls or puts “in the money”, I have bad news for you! In reality, the premiums of the different contracts are calculated in such a way as to cancel out the advantage that “in the money” contracts offer over other contracts.

Related posts on the SimTrade blog

   ▶ All posts about Options

   ▶ Alexandre VERLET Understanding financial derivatives: futures

   ▶ Alexandre VERLET Understanding financial derivatives: forwards

   ▶ Alexandre VERLET Understanding financial derivatives: swaps

Useful resources

ISDA

About the author

Article written in July 2021 by Alexandre VERLET (ESSEC Business School, Master in Management, 2017-2021).

Forward Contracts

Forward Contracts

Akshit Gupta

This article written by Akshit GUPTA (ESSEC Business School, Grande Ecole Program – Master in Management, 2019-2022) introduces Forward contracts.

Introduction

Forward contracts form an essential part of the derivatives world and can be a useful tool in hedging against price fluctuations. A forward contract (or simply a ‘forward’) is an agreement between two parties to buy or sell an underlying asset at a specified price on a given future date (or the expiration date). The party that will buy the underlying is said to be taking a long position while the party that will sell the asset takes a short position.

The underlying assets for forwards can range from commodities and currencies to various stocks.

Forwards are customized contracts i.e., they can be tailored according to the underlying asset, the quantity and the expiry date of the contract. Forwards are traded over-the-counter (OTC) unlike futures which are traded on centralized exchanges. The contracts are settled on the expiration date with the buyer paying the delivery price (the price agreed upon in the forward contract for the transaction by the parties involved) and the seller delivering the agreed upon quantity of underlying assets in the contract. Unlike option contracts, the parties in forwards are obligated to buy or sell the underlying asset upon the maturity date depending on the position they hold. Generally, there is no upfront cost or premium to be paid when a party enters a forward contract as the payoff is symmetric between the buyer and the seller.

Terminology used for forward contracts

A forward contract includes the following terms:

Underlying asset

A forward contract is a type of a derivative contract. It includes an underlying asset which can be an equity, index, commodity or a foreign currency.

Spot price

A spot price is the market price of the asset when the contract is entered into.

Forward price

A forward price is the agreed upon forward price of the underlying asset when the contract matures.

Maturity date

The maturity date is the date on which the counterparties settle the terms of the contract and the contract essentially expires.

Forward Price vs Spot Price

Forward and spot prices are two essential jargons in the forward market. While the strict definitions of both terms differ in different markets, the basic reference is the same: the spot price (or rate according to the underlying) is the current price of any financial instrument being traded immediately or ‘on the spot’ while the forward price is the price of the instrument at some time in the future, essentially the settlement price if it is traded at a predetermined date in the future. For example, in currency markets, the spot rate would refer to the immediate exchange rate for any currency pair while the forward rate would refer to a future exchange rate agreed upon in forward contracts.

Payoff of a forward contract

The payoff of a forward contract depends on the forward price (F0) and the spot price (ST) at the time of maturity.

Pay-off for a long position

Long Position

Pay-off for a short position

Short Position

With the following notations:
N: Quantity of the underlying assets
ST = Price of the underlying asset at time T
F0 = Forward price at time 0

For example, an investor can enter a forward contract to buy an Apple stock at a forward price of $110 with a maturity date in one month.

If at the maturity date, the spot price of Apple stock is $120, the investor with a long position will gain $10 from the forward contract by buying Apple stock for $110 with a market price of $120. The investor with a short position will lose $10 from the forward contract by selling the apple stock at $110 while the market price of $120.

Figure 1. Payoff for a long position in a forward contract
long forward

Payoff for a short position in a forward contract
Short forward

Use of forward contracts

Forward contracts can be used as a means of hedging or speculation.

Hedging

Traders can be certain of the price at which they will buy or sell the asset. This locked price can prove to be significant especially in industries that frequently experience volatility in prices. Forwards are very commonly used to hedge against exchange rates risk with most banks employing both spot and forward foreign exchange-traders. In a forward currency contract, the buyer hopes the currency to appreciate, while the seller expects the currency to depreciate in the future.

Speculation

Forward contracts can also be used for speculative purposes though it is less common than as forwards are created by two parties and not available for trading on centralized exchanges. If a speculator believes that the future spot price of an asset will be greater than the forward price today, she/he may enter into a long forward position and thus if the viewpoint is correct and the future spot price is greater than the agreed-upon contract price, she/he will gain profits.

Risks Involved

Liquidity Risk

A forward contract cannot be cancelled without the agreement of both counterparties nor can it be transferred to a third party. Thus, the forward contract is neither very liquid nor very marketable.

Counterparty risk

Since forward contracts are not traded on exchanges, they involve high counterparty risk. In these contracts, either of the counterparties can fail to meet their obligation resulting in a default.

Regulatory risk

A forward contract is traded over the counter due to which they are not regulated by any authority. This leads to high regulatory risk since it is entered with mutual consent between two or more counterparties.

Related posts in the SimTrade blog

   ▶ Akshit GUPTA Futures contract

Useful Resources

Hull J.C. (2015) Options, Futures, and Other Derivatives, Ninth Edition, Chapter 1 – Introduction, 23-43.

Hull J.C. (2015) Options, Futures, and Other Derivatives, Ninth Edition, Chapter 5 – Determination of forward and futures prices, 126-152.

About the author

Article written in June 2021 by Akshit GUPTA (ESSEC Business School, Grande Ecole Program – Master in Management, 2019-2022).

Understanding financial derivatives: swaps

Understanding financial derivatives: swaps

Alexandre VERLET

In this article, Alexandre VERLET (ESSEC Business School, Grande Ecole Program – Master in Management, 2017-2021) explains why financial markets invented swaps and how they function.

The origins of swaps

The origins of swaps lie in ‘parallel loans’. In the 1970s, while floating exchange rates were common, the transfer of capital between countries remained tightly controlled. Multinational companies were particularly affected when they transferred capital between their subsidiaries and their headquarter. In order to solve this problem, parallel loans were set up. To understand the principle of these loans, let us take an example. Michelin and General Motors (GM) are two multinational companies. Michelin, a French company, has a subsidiary in the United States, and General Motors, a US company, has a subsidiary in France. Suppose that both companies want to transfer funds to their respective subsidiary. In order to circumvent international transfers, the two parent companies can simply agree to lend an equivalent amount of money to their counterparty’s subsidiary. For example, Michelin’s parent company would transfer X amount in euros to General Motors’ French subsidiary, while General Motors’ parent company would transfer the equivalent amount in dollars to Michelin’s US subsidiary. With swaps, companies are also able to have access to cheaper capital and better interest rates.
As this type of financing arrangement became more popular, it became increasingly difficult for companies to find counterparties with exactly the opposite needs. In order to centralise supply and demand, financial institutions began to act as intermediaries. In doing so, they improved the original product (parallel loans) to swaps.

How big is the swap market?

The word swap comes from the English verb “to swap”. In finance, swap means an exchange of flows (and sometimes capital). Financial institutions were the first to realise the huge potential of the swaps market. In order to satisfy the growing demand, an interbank market was created. In the wake of this, several financial institutions became market makers (or dealers) to organize the market and bring liquidity to market participants. The role of a market maker is to offer bid and ask prices in a continuous manner. The financial institutions involved in the swap market have also come together in an association called the International Swap Dealers Association (ISDA). As a result, swaps became the first OTC market to have a standardised contract, further accelerating their development. With this success, the ISDA contract quickly became the standard for other OTC derivatives markets, allowing ISDA to expand its area of influence. The latter will be renamed the International Swaps and Derivatives Association. The ISDA ‘s work turned out to be an unprecedented success in the financial world. According to figures from the Bank for International Settlements (BIS), more than 75% of the outstanding amounts in the OTC markets involve swaps.

The GDP worldwide is about ten times less than the total known outstanding amounts in the OTC derivatives markets! The reason for this discrepancy is probably the almost systematic use of leverage in transactions involving derivatives.

Interest rate swaps

Interest rate swaps are a must in the OTC derivatives markets, with the notional amount outstanding in OTC interest rate swaps of over $400 trillion. In their most basic form (plain vanilla swaps), they provide a very simple understanding of how swaps work.
A plain vanilla swap is a financial mechanism in which entity A pays a fixed interest rate to entity B, and entity B pays a floating interest rate to entity A, all in the same currency. With this mechanism, it is possible to transform a fixed interest rate into a floating rate, and vice versa. It should be noted, however, that the plain vanilla is not the only type of interest rate swap. The definition of all interest rate swaps is as follows: an interest rate swap is a transaction in which two counterparties exchange financial flows in the same currency, for the same nominal amount and on different interest rate references. This definition obviously includes plain vanilla (a fixed rate against a floating rate in the same currency), but also other types of interest rate swaps (e.g. a floating rate against another floating rate in the same currency).

Currency Swaps

Currency swaps are the oldest family of swaps. A currency swap is a transaction in which two counterparties exchange cash flows in different currencies for the same nominal amount. Unlike interest rate swaps, in the case of currency swaps there is an exchange of the nominal amount at the beginning and end of the swap. Currency swaps can be classified into four categories, depending on the nature of the rates used:

Counterparty A (fixed rate) versus counterparty B (fixed rate)

Counterparty A (fixed rate) versus counterparty B (floating rate)

Counterparty A (floating rate) versus Counterparty B (fixed rate)

Counterparty A (floating rate) versus Counterparty B (floating rate)

This type of swap can reverse the currencies of two debts denominated in different currencies and also the type of interests (fixed or floating). In other words, companies use it to transform an interest payment in euros into an interest payment in dollars for instance, and a fixed interest into a floating interest for example.

Equity and commodity swaps

Interest rate and currency swaps are by far the most common families of swaps used by market participants. However, there are other types of swaps, notably equity swaps and commodity swaps. Since indices are made up of a set of stocks, equity swaps work in a similar way to index swaps. It is a matter of exchanging an interest rate (fixed or variable) against the performance of a stock or an index. Swaps have also been put in place for the commodity market. A commodity swap allows a counterparty to buy (or sell) a given quantity of a commodity at a future date, at a price fixed in advance, and to sell (or buy) a given quantity of a commodity at a future date, at a price varying according to supply and demand in the market.

Let us consider company A, that owns a certain amount of gold. The value of this asset is not stable, as it varies according to the price of gold on the markets. In order to protect itself against this over a specific time period, company A can simply ask its bank to arrange a swap in which the company exchanges (“swaps”) the variable price of its gold stock against a price fixed in advance. The mechanism for this type of swap is quite similar to the mechanism for equity swaps, which we discussed previously.

We could think of infinitely more types of swaps, as it has become a very common way to hedge against risk. Perhaps the most famous one would be the Credit Default Swap (CDS), which is a credit derivative that allows its buyer to protect himself against the risk of default of a company. In return, the buyer of the CDS pays a periodic premium to the seller of the CDS. The CDS has played an important role in the 2008 financial crisis, but this story deserves an article of its own.

Useful resources

ISDA

Related posts on the SimTrade blog

   ▶ Alexandre VERLET Understanding financial derivatives: options

   ▶ Alexandre VERLET Understanding financial derivatives: futures

   ▶ Alexandre VERLET Understanding financial derivatives: forwards

   ▶ Akshit GUPTA Currency swaps

About the author

This article was written in May 2021 by Alexandre VERLET (ESSEC Business School, Grande Ecole Program – Master in Management, 2019-2022).

Film analysis: Rogue Trader

Film analysis: Rogue Trader

Marie Poff

This article written by Marie POFF (ESSEC Business School, Global Bachelor of Business Administration, 2020) analyzes the Rogue trader film and explains the related financial concepts.
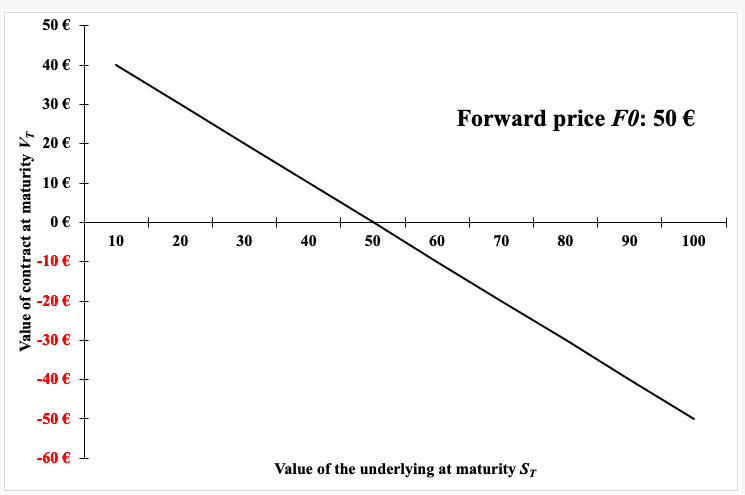
Based on a true story, ‘Rogue Trader’ details how risky trades made by Nick Leeson, an employee of investment banking firm Barings Bank, lead to its insolvency. This film explores how financial oversight and a lack of risk management from Leeson’s supervisors, lead to irrecoverable losses and the eventual fall of the banking giant.

Film summary

‘Rogue Trader’ recounts the exploits of Nick Leeson and his role in the downfall of Barings Bank, one of the single largest financial disasters of the nineties. Directed by James Dearden, this film encapsulates the economic and social changes of a tumultuous period. Leeson is a young derivatives trader sent to work in Singapore for Barings Bank, a major investment bank at the time. After opening a Future and Options office in Singapore, Leeson is placed in a position of authority where he takes advantage of the thriving Asian market by arbitraging between the Singapore International Monetary Exchange (SIMEX) and the Nikkei in Japan. He begins making unauthorised trades, which initially do make large profits for Barings – however he soon begins using the bank’s money to make bets on the market to recoup his own trading losses. At first, he tries to hide his losses in accounts, but eventually loses over $1 billion of Barings capital as its head of operations on the Singapore Exchange. He eventually flees the country with his wife, but inevitably, he must face how his actions lead to the bankruptcy of Barings Bank.

The Rogue Trader film

Financial concepts from the Rogue Trader film

Financial derivatives

For any new investors, financial derivatives describe a broad class of trading instruments that have no tangible worth of their own, but “derive” their value from a claim to some other financial asset or security. A few examples include futures contracts, forward contracts, put and call options, warrants, and swaps. Derivative trading started from the practice of fixing contracts ahead of time, as a way for market players to insure against fluctuations in the price of agricultural goods. Eventually the practice was extended to cover currencies and other commodities. As exchange rates became increasingly unstable, the derivatives trade facilitated huge profits for those estimating the future relative value of various commodities and currencies, through the buying and selling complex products.

Barings Bank

Founded in 1762, Barings Bank was the second oldest merchant bank in the world before its collapse in 1995. Barings grew from being a conservative merchant bank to becoming heavily reliant on speculation in the global stock markets to accumulate its profits. The derivatives market was somewhere this could be done in a very short space of time. Following the stock market crash of 1987, derivatives became central to the banks’ operations as they sought to offset their declining profits. The volume of their derivative trading soared from less than $2 trillion in 1987, to $12 trillion in 1993. As finance capital became increasingly globalised, Barings branched out to exploit these new markets in Latin America and the Far East.

Tiger Economies

The term “tiger economies” is used to describe the booming Southeast Asian economies of South Korea, Taiwan, Hong Kong, and Singapore. Following export-led growth and especially the development of sophisticated financial and trading hubs, Western interest spiked for these untapped markets in the 1990s.

Arbitrage

Profitable arbitrage opportunities are the result of simultaneously buying and selling in different markets, or by using derivatives, to take advantage of differing prices for the same asset. In the film, Leeson makes a profit by exploiting the small price fluctuations between SIMEX in Singapore and the Nikkei 225 in Japan.

Cash neutral business

A cash neutral business means managing an investment portfolio without adding any capital. For Leeson, any money made or lost on the trades should have belonged to the clients, and only a small proportion of the trades were meant to be proprietary. However, Leeson used Baring Bank’s money to make bets on the market to recoup his trading losses.

Short straddle position

A short straddle is an options strategy which takes advantage of a lack of volatility in an asset’s price, by selling both a call and a put option with the same strike price and expiration date, to create a narrow trading range for the underlying stock. Lesson used this strategy but sold disproportionate amounts of short straddles for each long futures position he took, because he needed to pay the new trades, the initial margin deposits, and meet the mounting margin calls on his existing positions.

Errors account

An errors account is a temporary account used to store and compensate for transactions related to errors in trading activity, such as routing numbers to an incorrect or wrong account. This practice allows for the separation of a transaction so that a claim can be made and resolved quickly. Leeson used this accounting to conceal the losses to Barings Bank which eventually amounted to over £800 million, though the account was supposedly activated to cover-up the loss made by an inexperienced trader working under Leeson’s supervision.

Key insights for investors

Don’t Lose Sight of Reality

An important insight is noticing how Leeson forgot to consider the real-world impact of his trades. He reflects on seeing trading as just artificial numbers flashing across screens, “it was all paid by telegraphic transfer, and since we lived off expense accounts, the numbers in our bank balances just rolled up. The real, real money was the $100 I bet Danny each day about where the market would close, or the cash we spent buying chocolate Kinder eggs to muck around with the plastic toys we found inside them.” Leeson saw the Kobe earthquake as nothing more than an opportunity and conducted more trading in one day than he ever had before as the market was butchered. Investors can avoid Leeson’s mistake by keeping a firm grasp on reality, and remembering the real companies and people represented by the stock exchange.

Destructive Practices

Other employees at Barings Bank most likely relied on internal auditors to discern wrongdoings or mistakes made by others, but as can be seen from Leeson’s case, regulators can be slow to catch on to any wrongdoing – especially when there are large profits involved. The lesson here is that an investor must be aware and proactive in helping to prevent other investors from engaging in destructive trading practices. This is especially true when it comes to newer markets or products, where regulators are unsure what entails best practice.

Tacit Agreement

While Leeson is assumed to be the villain, consider how Barings was able to contravene laws forbidding the transfer of more than 25 percent of the bank’s share capital out of the country for nearly every quarter during 1993 and 1994? Ignorance is not an excuse – tacit agreement is as effective as active engagement. A lesson here is that investors should remain informed on all their business engagements regardless of how much profit it being made.

Relevance to the SimTrade certificate

Through the SimTrade course, as well as a strong understanding about trading platforms and orders, you are taught about information in financial markets and how to use this to make successful trades. Several case studies teach you how to analyse market information to make valuations, and correctly assess how market activities will affect your own trades. The simulation and contest allow you to compete against others in the course and deepen your understanding of how a market reacts to different players.

Famous quote from the Rogue trader film

Nick Lesson: “Despite rumours of secret bank accounts and hidden millions, I did not profit personally from my unlawful trading. To be absolutely honest, sometimes I wish I had.”

Trailer of the Rogue trader film

Related posts on the SimTrade blog

All posts about financial movies and documentaries

▶ Akshit GUPTA Analysis of The Rogue Trader movie (another analysis)

▶ Akshit GUPTA The bankruptcy of the Barings Bank (1996)

▶ Jayati WALIA Value at Risk

About the author

Article written in November 2020 by Marie POFF (ESSEC Business School, Global Bachelor of Business Administration, 2020).