

In this article, Youssef LOURAOUI (ESSEC Business School, Global Bachelor of Business Administration, 2017-2021) presents the momentum factor, which is based on a risk factor that aims to get exposure to stocks that have a winning tendency in the upside and downside assuming that they will continue to do well in the short term.
Another similar concept related to momentum is trend following. It is a trading strategy that seeks to profit on an asset’s momentum in a certain direction. A trend occurs when the price moves in a consistent direction (upward or downward). Momentum investing and trading are based on the premise that prices respond to the strength of their supply and demand sources (at least in part) (Investopedia, 2021). It’s considered as a forward-looking strategy. Momentum manifests itself in a variety of different ways. It might be based on publicly traded firms’ earnings reports, the connection between buyers and sellers in the market, or even the usual pace of price rises and decreases in the past.
This article is structured as follows: we begin by defining the momentum factor and reviewing academic studies. The MSCI Momentum Factor Index, which is well used as a benchmark in the asset management industry, is next presented in terms of performance, risk-return trade-off, and behavior during the Covid-19 crisis. We showcase the ETF market for investors looking to profit from the momentum factor.
Definition
In the world of investing, a factor is any attribute that helps explain an asset’s long-term risk and return performance. In the late 1970s, the portfolio management industry’s objective was to capture the market return on a portfolio. As a result of Markowitz and Tobin’s earlier research, William Sharpe, John Lintner, and Jan Mossin independently developed the Capital Asset Pricing Model (CAPM). Because it enabled investors to properly value assets in terms of systematic risk, the CAPM was a significant evolutionary step forward in the theory of capital market equilibrium (Mangram, 2013).
Eugene Fama and Kenneth French, following the CAPM’s original work, developed the Fama-French three-factor model in 1993 to solve the CAPM’s inadequacies. It claims that, in addition to the market risk component of the CAPM, two other factors have an effect on the returns on securities and portfolios: market capitalization (called the “size” factor) and the book-to-market ratio (referred to as the “value” factor).
Other factor characteristics were developed to capture some additional performance as financial research advanced and significant contributions were made.
The Momentum factor refers to a winning stock’s tendency to continue doing well in the short term (Jegandeesh and Titman, 1993).
Academic research
The momentum premium was originally found by academics in 1993, when UCLA researchers Narasimhan Jegadeesh and Sheridan Titman proved that buying well-performing equities and selling underperforming ones provided large positive returns over three to twelve-month holding periods. The study finds that these techniques are profitable not because of their systematic risk or delayed stock price responsiveness to common causes. However, a portion of the anomalous returns achieved in the first year following portfolio creation fade away during the next two years. A similar pattern of returns is often observed around the earnings releases of previous winners and losers (Jegandeesh and Titman, 1993).
Empirical studies
Numerous subsequent research have established that the momentum factor exists across stock sectors, nations, and, more broadly, asset classes. Momentum is not as well understood as other variables, even though several theories seek to explain it. Some feel it is remuneration for taking on a high degree of risk, while others believe it is a result of market inefficiencies caused by delayed pricing reactions to firm-specific information.
While contrarian strategies have garnered much attention in recent academic research, the early work on market efficiency concentrated on relative strength strategies that invest in previous winners and sell past losers. Notably, Levy (1967) asserts that a trading method that purchases equities at prices significantly higher than their average price over the previous 27 weeks generates considerable anomalous profits. Jensen and Bennington (1970), on the other hand, note that Levy developed his trading rule after evaluating 68 alternative trading rules in his dissertation and express reservations about his results as a result (Jegandeesh and Titman, 1993). Jensen and Rennington examine the profitability of Levy’s trading rule over a lengthy period that falls mostly outside of Levy’s initial sample period. They discover that Levy’s trading rule does not outperform a buy and hold strategy throughout their sample period, and so ascribe Levy’s outcome to selection bias (Jegandeesh and Titman, 1993).
Economical interpretation
While the scholarly discussion has shifted away from relative strength trading rules, a lot of practitioners continue to utilize relative strength as a stock selection criterion. For example, Grinblatt and Titman (1989, 1991) found that most mutual funds purchased equities that had grown in price over the preceding quarter (Jegandeesh & Titman, 1993).
MSCI Momentum Factor Index
MSCI Factor Indexes are rules-based, transparent indexes that target equities with favorable factor qualities, as determined by academic discoveries and empirical outcomes, and are designed for easy implementation, replicability, and usage in both standard indexed and active portfolios. Momentum is classified as a “persistence” component, which means that it benefits from long-term market (MSCI Factor research, 2021). The MSCI Momentum Index measures:
- Risk-adjusted excess return – that is, return that surpasses the benchmark – during a 6-month period
- Risk-adjusted excess return that outperforms the benchmark over a 12-month period
These findings conclude in the research paper of Moskowitz et all (1999) hold up to a variety of criteria and treatments and provide critical practical insights into the profitability of momentum investing (Moskowitz, 1999). For example, these findings suggest that momentum strategies are not very well diversified, as both winners and losers typically come from the same industry. Additionally, if trading on momentum is desired, industry-based techniques tend to be more profitable and implementable. Unlike individual stock momentum techniques, which appear to be primarily driven by the sell side, industry momentum generates as much or more profit on the purchase side as on the sell side. Additionally, unlike individual stock momentum, sector momentum earnings continue to be robust among the largest, most liquid companies (Moskowitz, 1999).
Performance of the MSCI Momentum Factor Index
Figure 1 compares MSCI Momentum Factor Index performance to those of other factors from May 1999 to May 2020. All indices are rebalanced on a 100-point scale to ensure consistency in performance and to facilitate factor comparisons.
Figure 1. Performance of the MSCI Momentum Factor Index from 1999-2020.
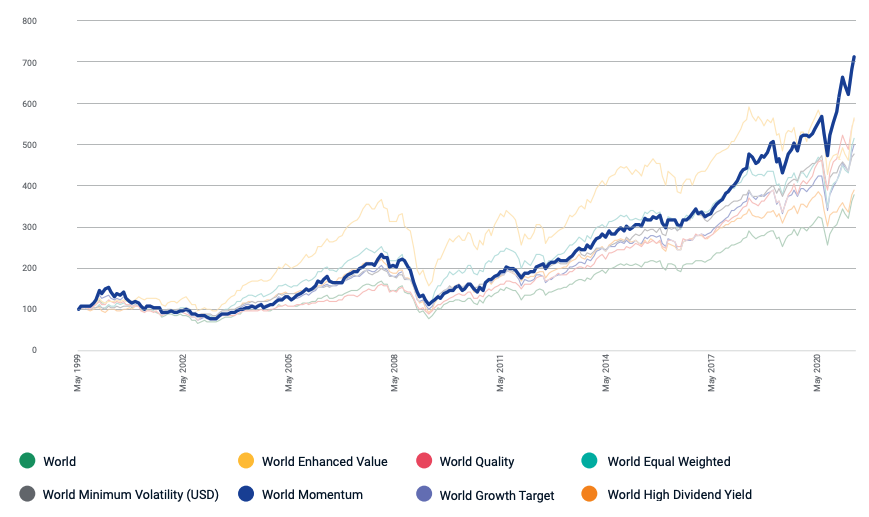
Source: MSCI Factor research (2021).
According to MSCI research, the momentum component has historically been one of the most effective generators of excess returns, consistently excelling in macro conditions characterized by a prolonged cycle in underlying market trends. As per the figure below, the MSCI World Momentum Index has historically generated excess returns over the long run, outperforming the MSCI World Index by 3.17 percent year since 1999 (MSCI Factor study, 2021).
Risk-return profile of MSCI Momentum Factor Index
Figure 2 shows the MSCI Momentum Factor Index compared to other factors over the period May 1999 – May 2020 in terms of risk/reward. The risk-return tradeoff states that the potential return rises with an increase in risk. Individuals connect low levels of uncertainty about future returns with low potential returns, while high levels of uncertainty or risk are associated with large potential returns. According to the risk-tradeoff trade-off, an investor’s money can generate higher returns only if the investor is willing to endure a higher risk of loss (Figure 2).
Figure 2. Risk-return profile of MSCI Momentum Factor Index compared to a peer group.
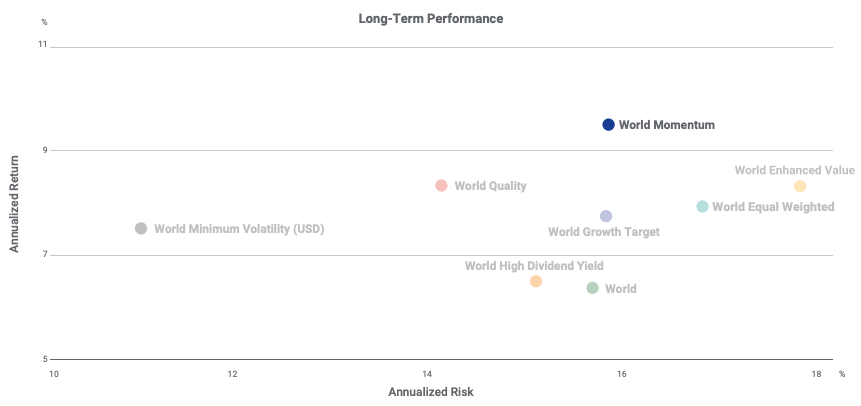
Source: MSCI Factor research (2021).
Behavior of the MSCI Momentum Factor Index during the Covid-19 crisis
The Covid-19 crisis has not only caused significant social and economic suffering, but it had also an impact on financial markets. To study the behavior of the factors during the Covid-19 crisis, we compute the return of the MSCI Factor indexes during the different stages of the crisis. The MSCI Factor indexes are: value, size, quality, momentum and minimum volatility. Following Pagano et al. (2020) and Hasaj and Sherer (2021), we decompose the Covid-19 crisis into five stages: origin, incubation, outbreak, fever, and treatment. Each stage is described below.
- Origin (01/11/2019 – 01/01/2020): the first instances are reported in Wuhan, China.
- Incubation (02/01/2020 – 17/01/2020): during this phase, the number of patients began to rise at a faster rate, raising concerns about the disease’s severity.
- Outbreak (20/01/2020 – 21/02/2020): the number of cases rose to the point that the World Health Organization (WHO) decided that this illness may pose a major threat to the world’s population, and the pandemic was proclaimed.
- Fever (24/02/2020 – 20/03/2020): markets are extremely volatile, owing to government restrictions aimed at flattening the infection curve, with the decision to impose a lockdown in numerous nations as the most notable measures, among others.
- Treatment (23/03/2020 – 15/04/2020): most of this turnaround occurs between March and June 2020, which corresponds with the start of good news about the discovery and widespread use of the vaccine.
Table 1 gives the performance of the MSCI factor indexes during the different stages of the Covid-19 crisis. Performance is measured by the return computed on the time-period of each stage, and then annualized for comparison across the different stages. We use data are from Thomson Reuters.
Table 1. Performance of the MSCI factor indexes during the Covid-19 crisis.
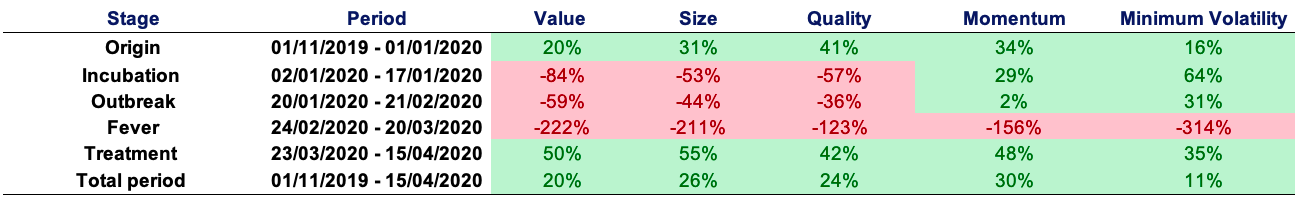
Source: computation by the author (data source: Thomson Reuters).
Both during the pre-lockdown phase (January 2nd to January 17th 2020) and during the post-lockdown phase (23 March 2020 – 15 April 2021), the momentum component performed well, attaining the second best risk/reward tradeoff (Table 1).
ETFs to capture the Momentum factor
Let us recall that an Exchange-Traded Fund (ETF) is an investment vehicle that seeks to mirror the performance of a benchmark like an equity index and is traded on a continuous basis during the day like stocks. By investing in ETFs, an investor gains access to a plethora of diversification options through several asset classes (equity, bonds, currency, commodity, real estate, etc.).
Figure 3 illustrates the overall ETF distribution of the major providers of momentum factor ETFs in terms of percentage of asset under management. By examining the market overview for momentum factor investments, we can observe Blackrock’s dominance (iShares), with assets under management underpinning $27 billion of the overall market value, holding 55% of the overall percentage of the benchmark retained.
Figure 3. Momentum factor ETF market.
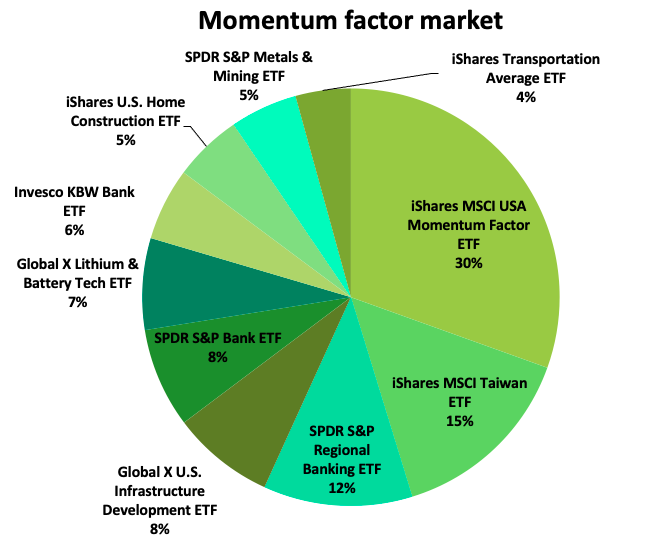
Source: etf.com (2021).
Table 2 gives more detailed information about the biggest momentum factor ETF providers: the asset under management (AUM), expense ratio (ER) and the segment for the investments.
Table 2. Ranking of the biggest Momentum ETF providers.
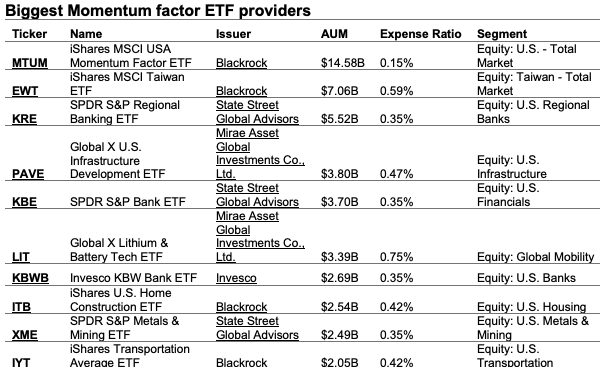
Source: etf.com (2021).
Why should I be interested in this post?
If you are an undergraduate or graduate student in a business school or at the university, you may have seen in your 101 finance course the CAPM related to the market factor. This post makes aware of the existence of an other risk factor priced by the market.
If you are an investor, you may consider adding an exposure to momentum factor to enhance the overall portfolio return.
Related posts on the SimTrade blog
▶ Youssef LOURAOUI Minimum Volatility
▶ Youssef LOURAOUI Value Factor
▶ Youssef LOURAOUI Yield Factor
▶ Youssef LOURAOUI Size Factor
▶ Youssef LOURAOUI Quality Factor
▶ Youssef LOURAOUI Growth Factor
Useful resources
Academic research
Fama, E.F. and French, K.R. (1992), The Cross-Section of Expected Stock Returns. The Journal of Finance , 47: 427-465.
Jegandeesh, N., Titman, S., 1993. Returns to buying winners and selling losers: Implication for stock market efficiency. The Journal of Finance , 48(1), 1-34.
Jensen, M. C., Benington, G. A. 1970. Random walks and technical theories: Some additional evidence. The Journal of Finance , 25: 469-482
Levy, R. A. 1967. Relative strength as a criterion for investment selection. The Journal of Finance , 22: 595-610.
Mangram, M. E., 2013. A simplified perspective of the Markowitz Portfolio Theory. Global Journal of Business Research , 7(1): 59-70.
Hasaj, M., Sherer, B., 2021. Covid-19 and Smart-Beta: A Case Study on the Role of Sectors. EDHEC-Risk Institute Working Paper, 1-35.
Pagano, M., Wagner, C., Zechner, J. 2020. Disaster Resilience and Asset Prices, Working paper.
Business analysis
etf.com, 2021. Biggest Momentum ETF providers.
MSCI Investment Research, 2021. Factor Focus: Momentum
Investopedia, 2021. The difference between Trends and Momentums
About the author
The article was written in September 2021 by Youssef LOURAOUI (ESSEC Business School, Global Bachelor of Business Administration, 2017-2021).
9 thoughts on “Momentum Factor”
Comments are closed.