In this article, Nithisha CHALLA (ESSEC Business School, Grande Ecole Program – Master in Management, 2021-2023) presents the Russell 2000 index and details its characteristics.
The Russell 2000 index
As we can already notice in the name, Russell 2000 Index is a stock market index that tracks the performance of 2,000 small-cap companies in the United States. It was introduced by the Russell Investment Group in 1984 and is now created, managed, and distributed by FTSE Russell, a subsidiary of the London Stock Exchange Group. The Russell Index family has three indexes in it, Russell 1000, Russell 2000 and the Russell 3000.
The Russell 2000 has historically outperformed the larger-cap S&P 500 Index over the long term. According to data from FTSE Russell, the Russell 2000 has returned an average of 10.7% annually over the past 20 years, compared to an average return of 7.5% for the S&P 500 over the same period.
The Russell 2000 is widely used as a benchmark by active fund managers who specialize in small-cap stocks. As of March 2023, the largest sector in the Russell 2000 was healthcare, followed by technology and financials. The index is market-capitalization weighted, which means that larger companies have a greater impact on the index performance. The index is also used as the basis for exchange-traded funds (ETFs) and other financial products that allow investors to gain exposure to small-cap stocks.
FTSE Russell is known for its commitment to transparency and the accuracy of its index calculations. The company uses a rules-based methodology for selecting and weighting stocks in its indices, and it provides detailed documentation on its methodology and data sources to ensure that investors can make informed decisions about using its indices for benchmarking and investment purposes.
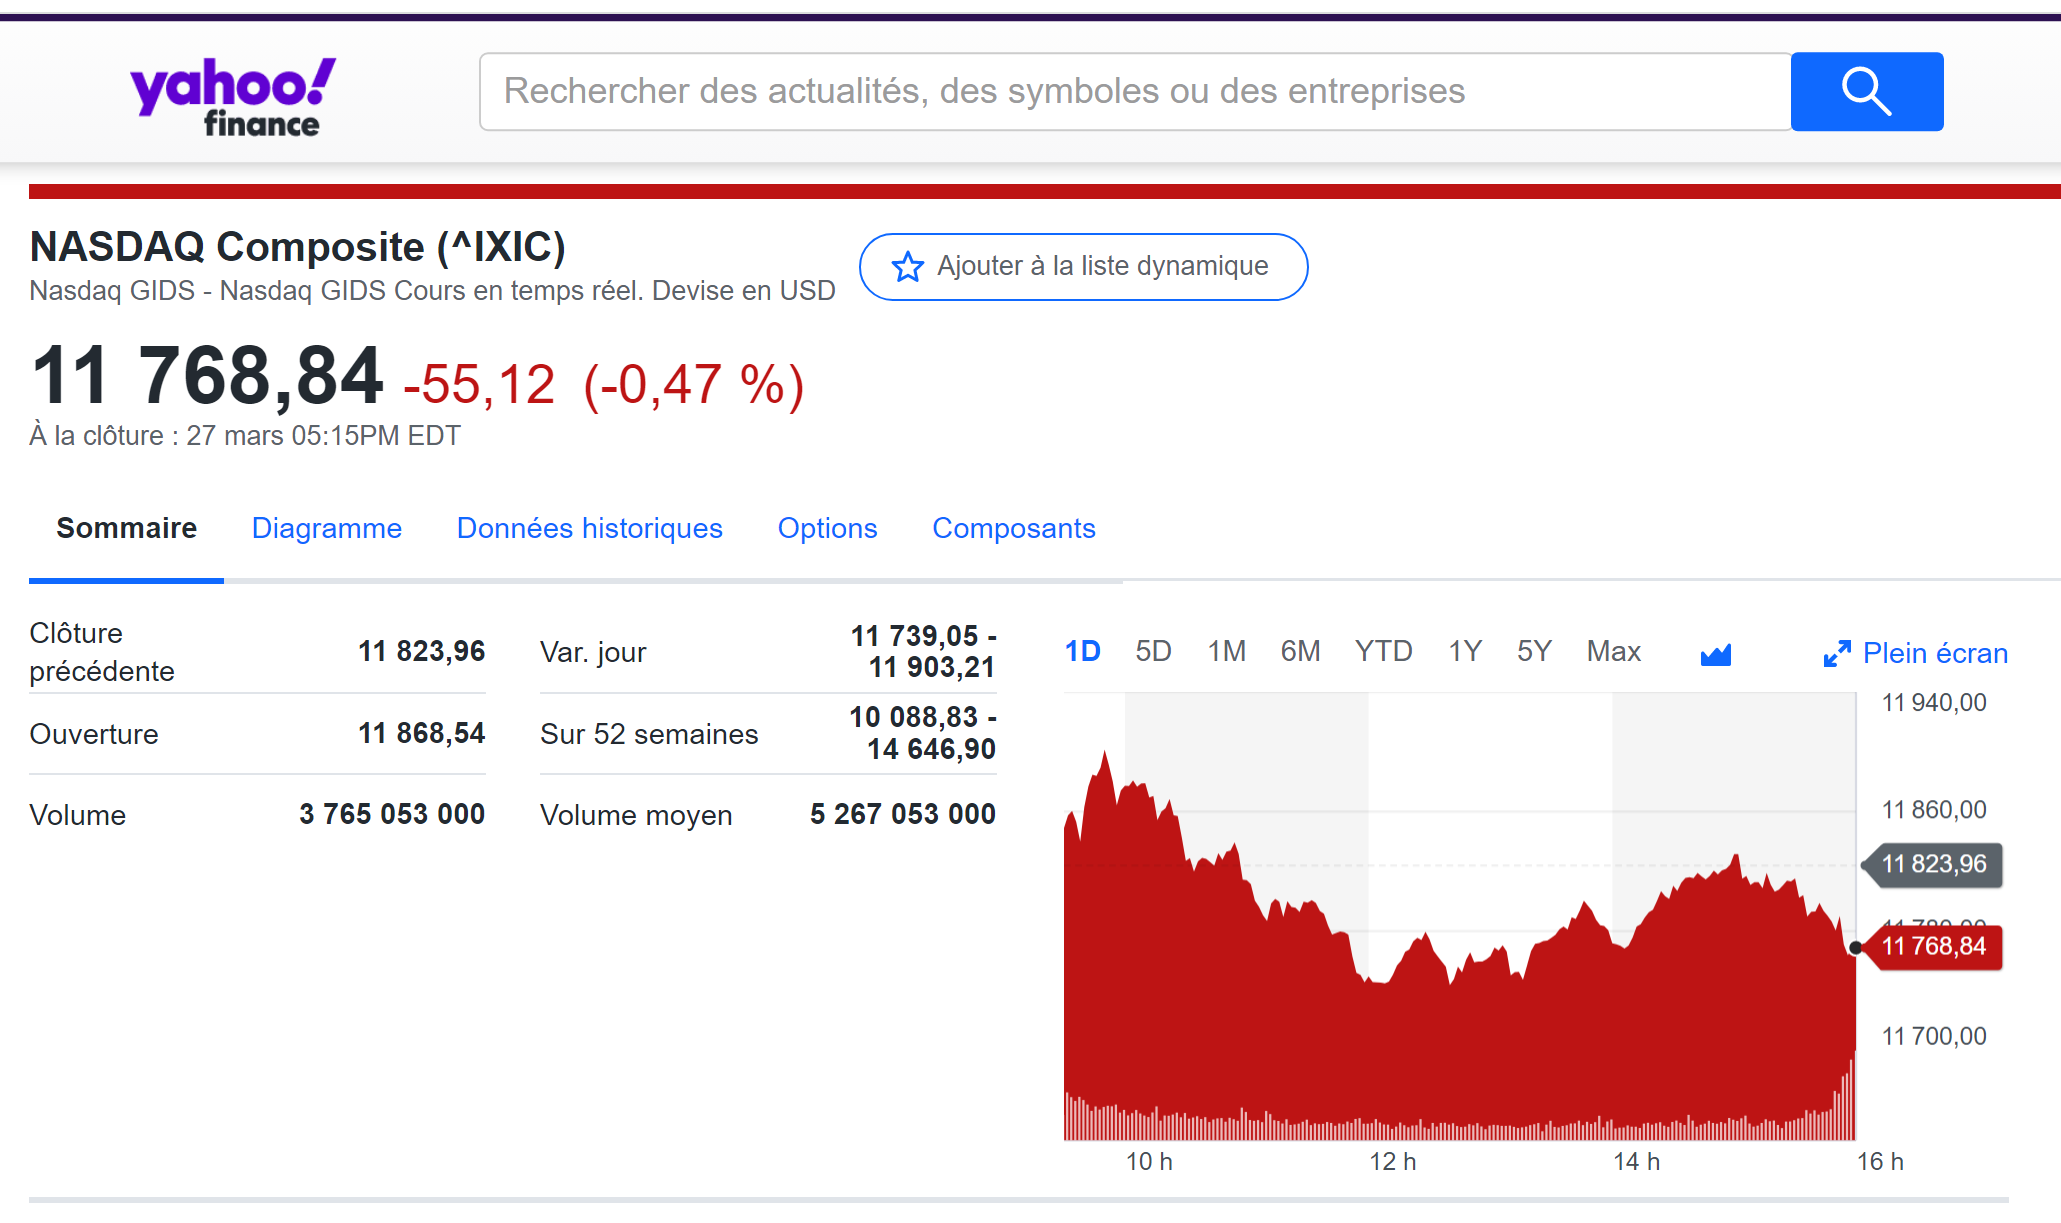
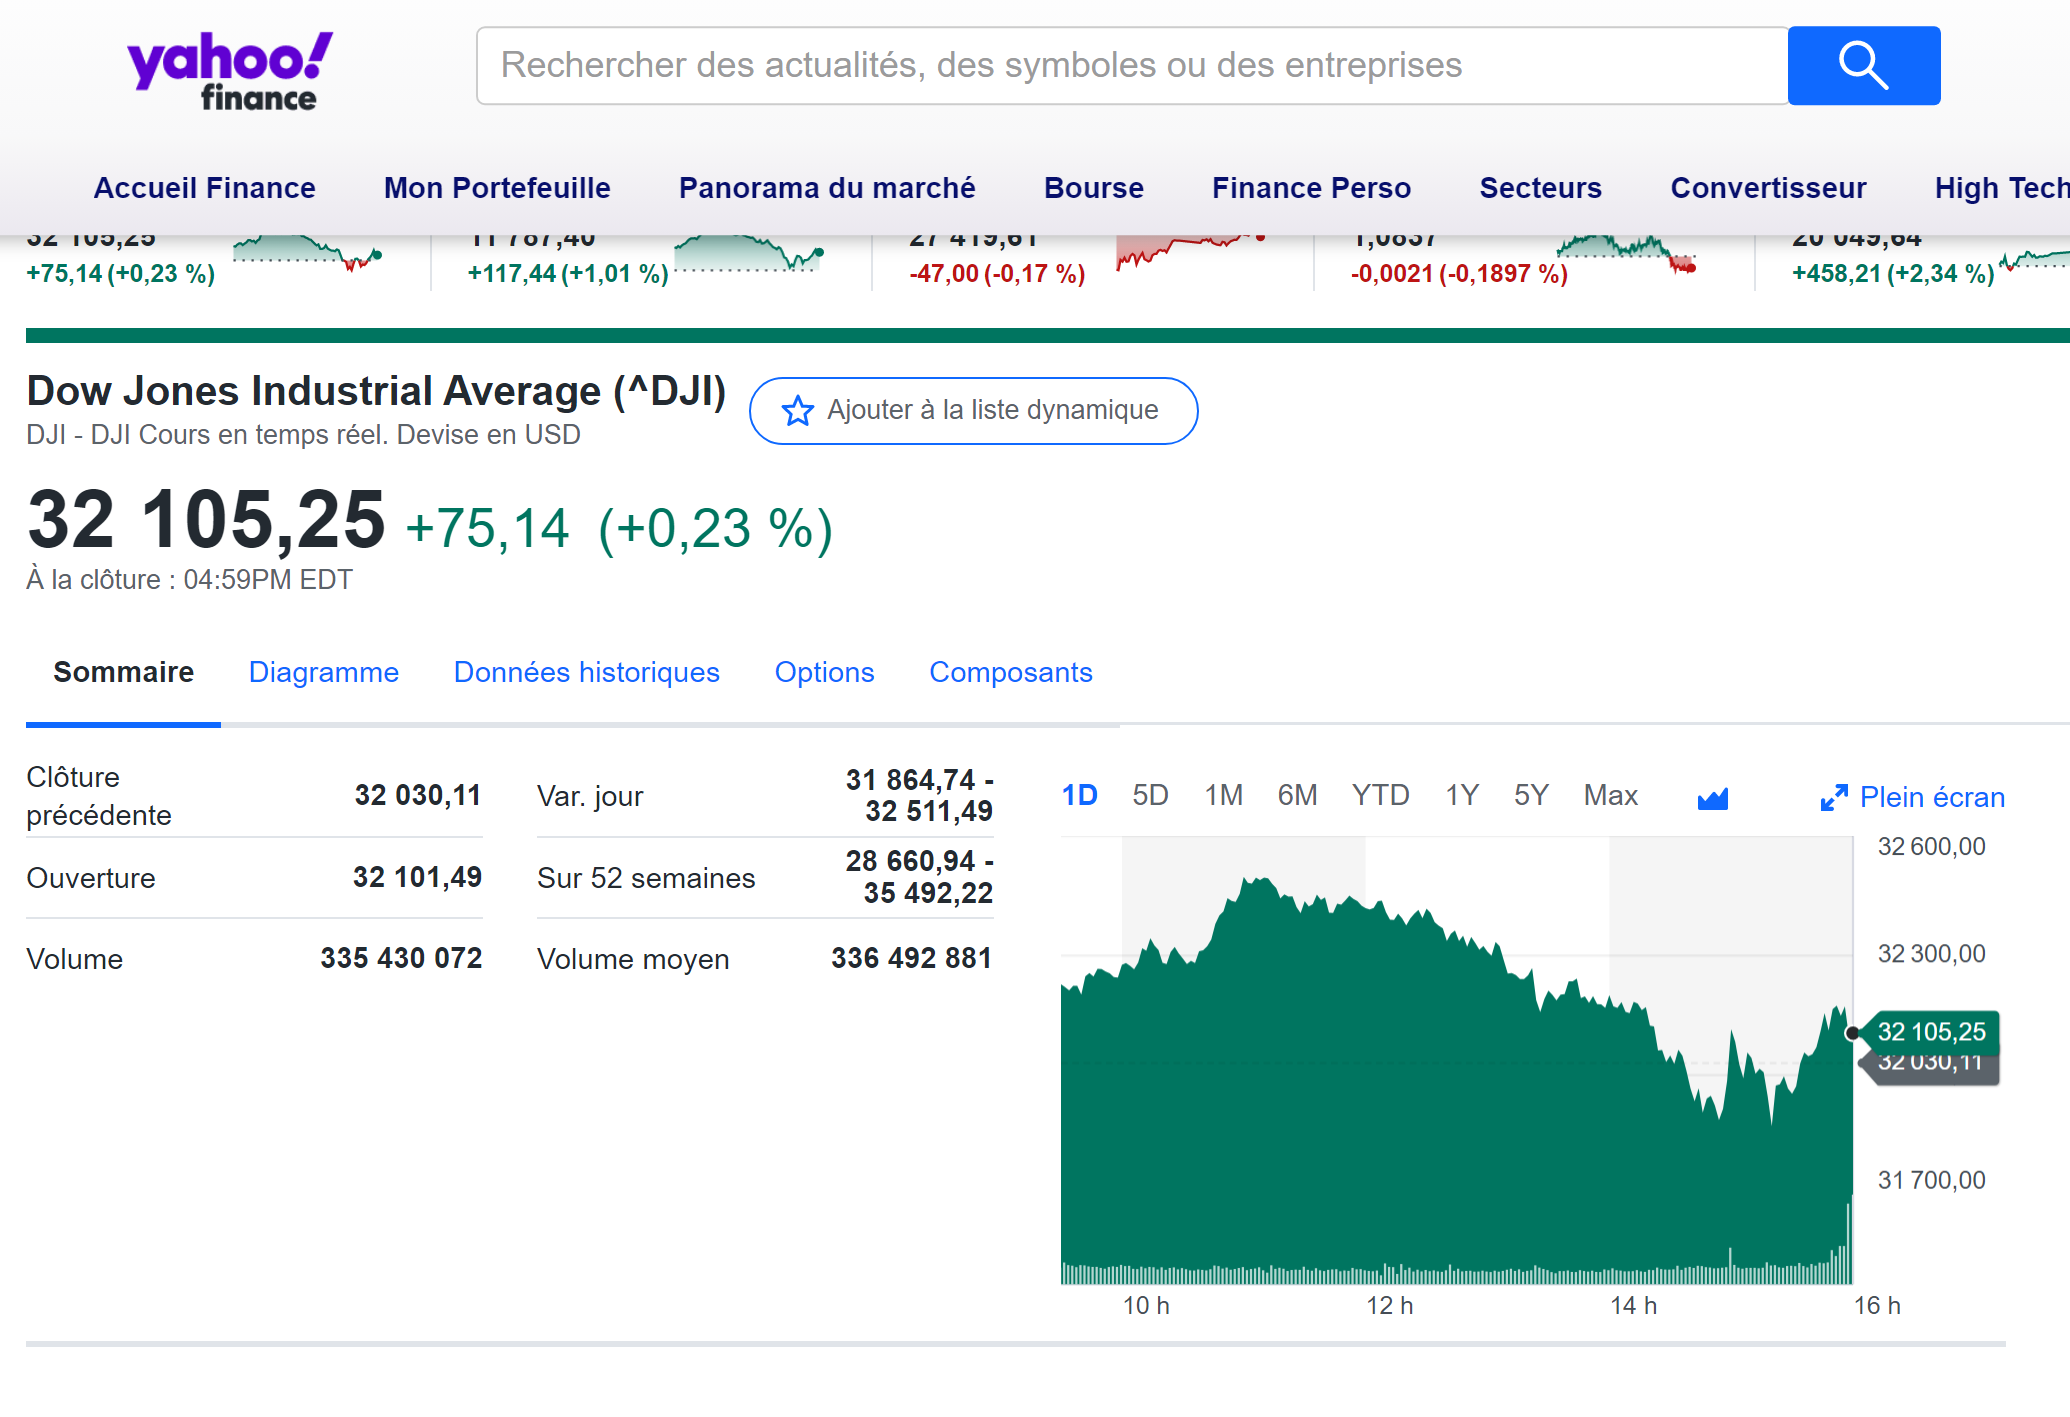
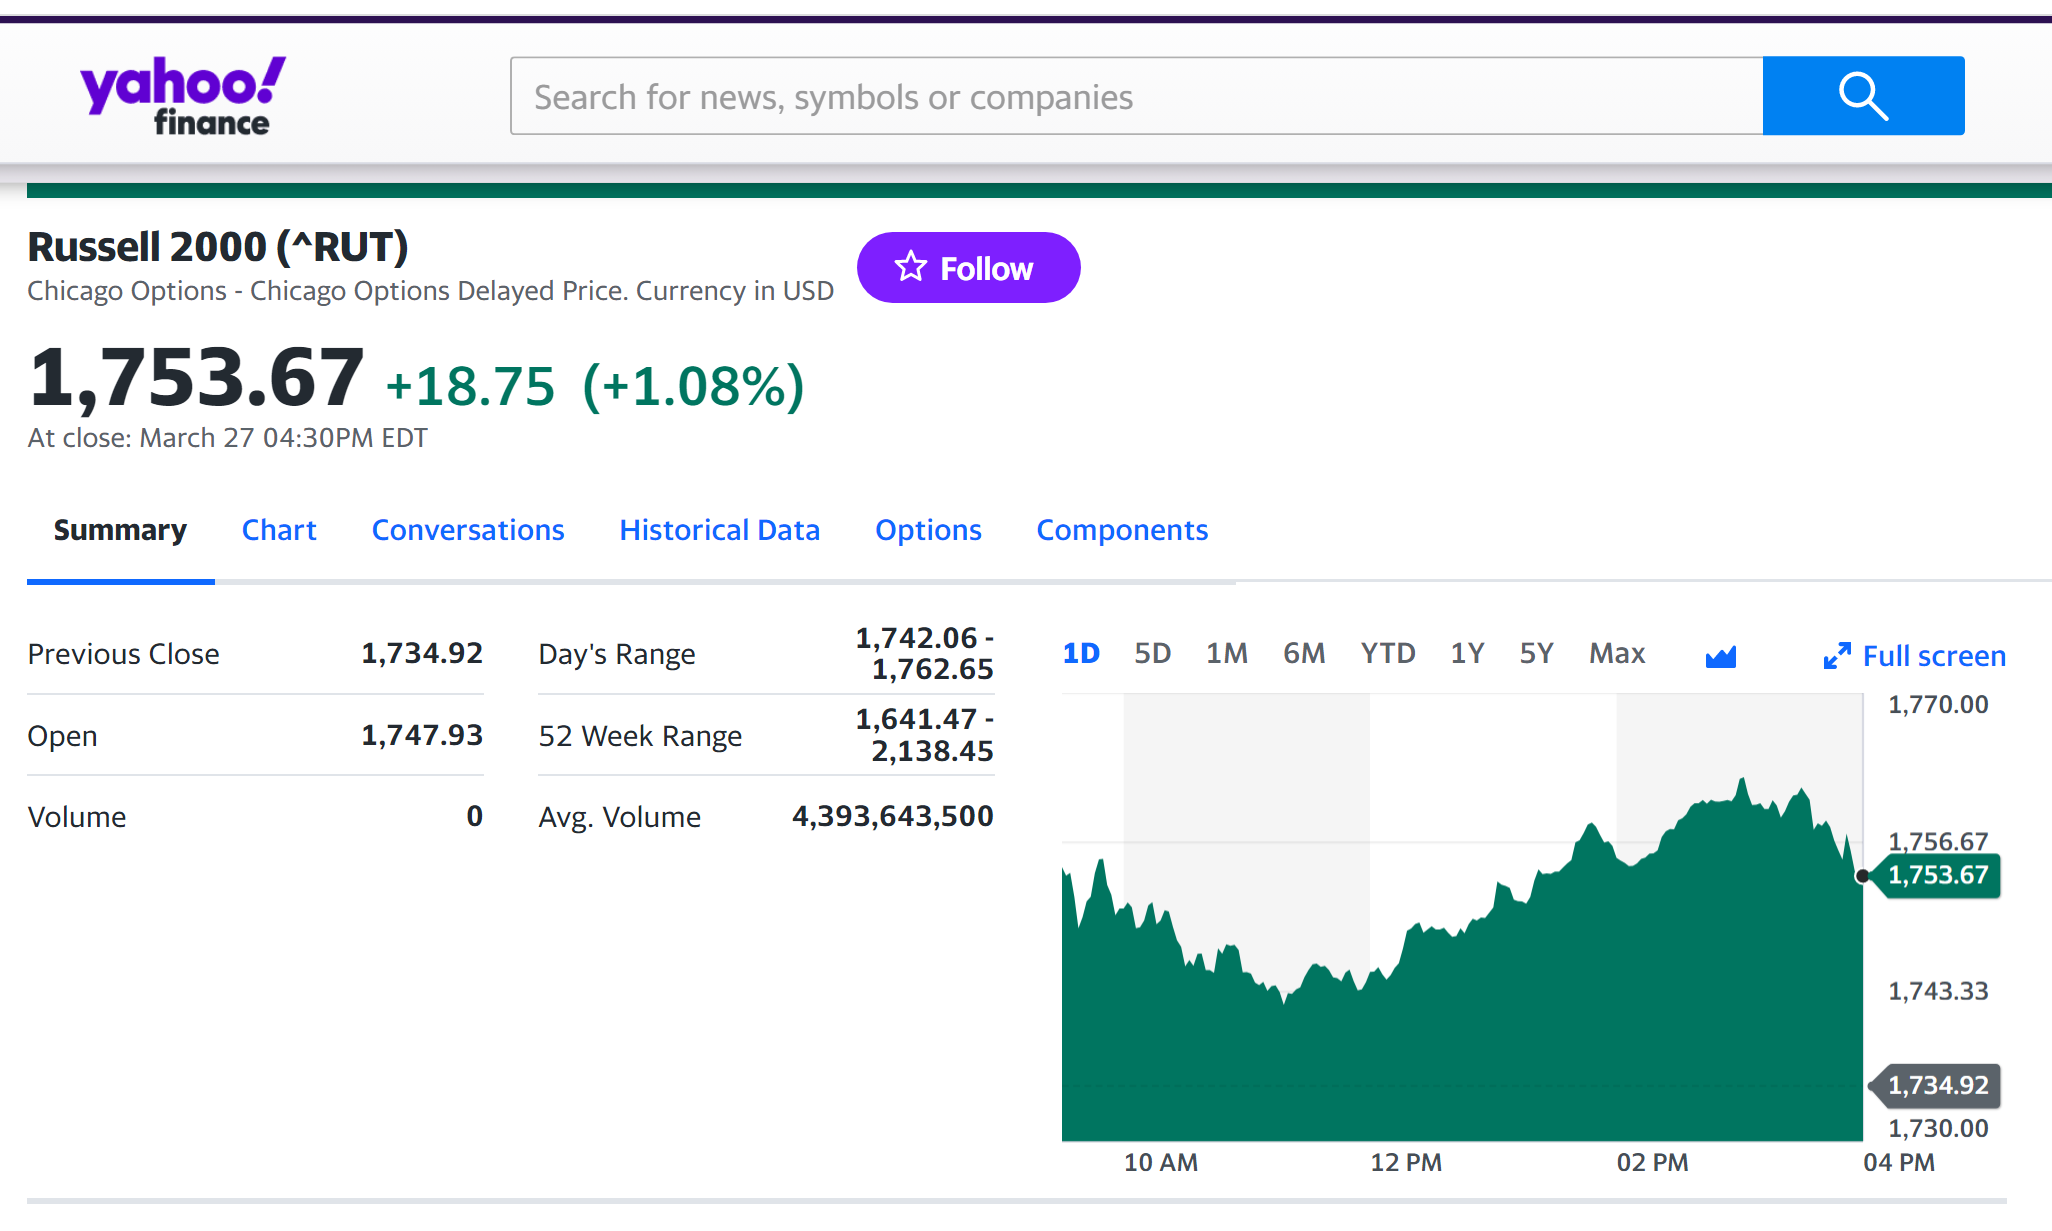
How is the Russell 2000 index represented in trading platforms and financial websites? The ticker symbol used in the financial industry for the Russell 2000 index is “RUT”.
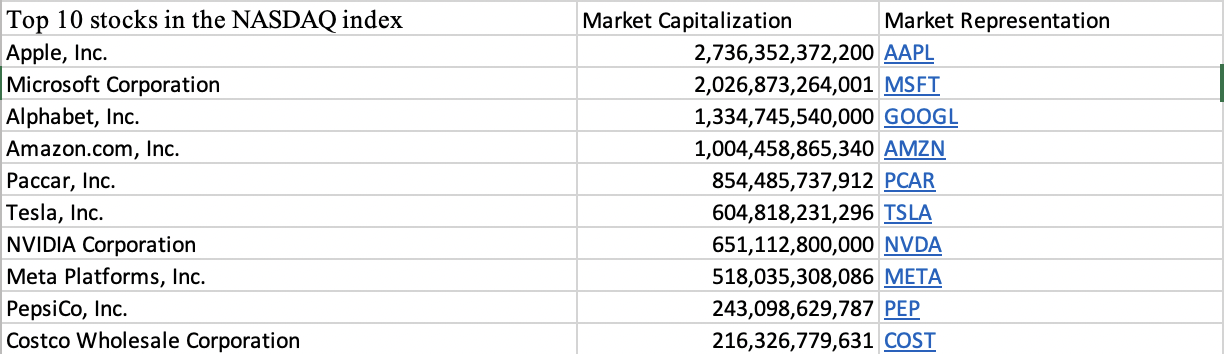
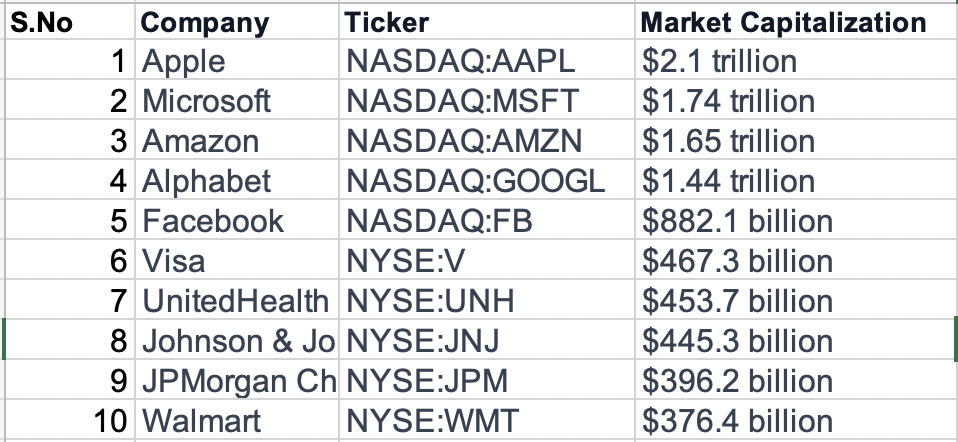
Table 1 below gives the Top 10 stocks in the Russell 2000 index in terms of market capitalization as of January 31, 2023.
Table 1. Top 10 stocks in the Russell 2000 index.
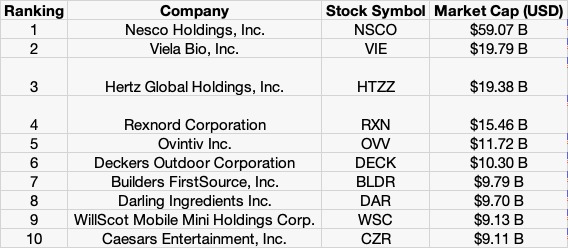
Source: computation by the author (data: YahooFinance! financial website).
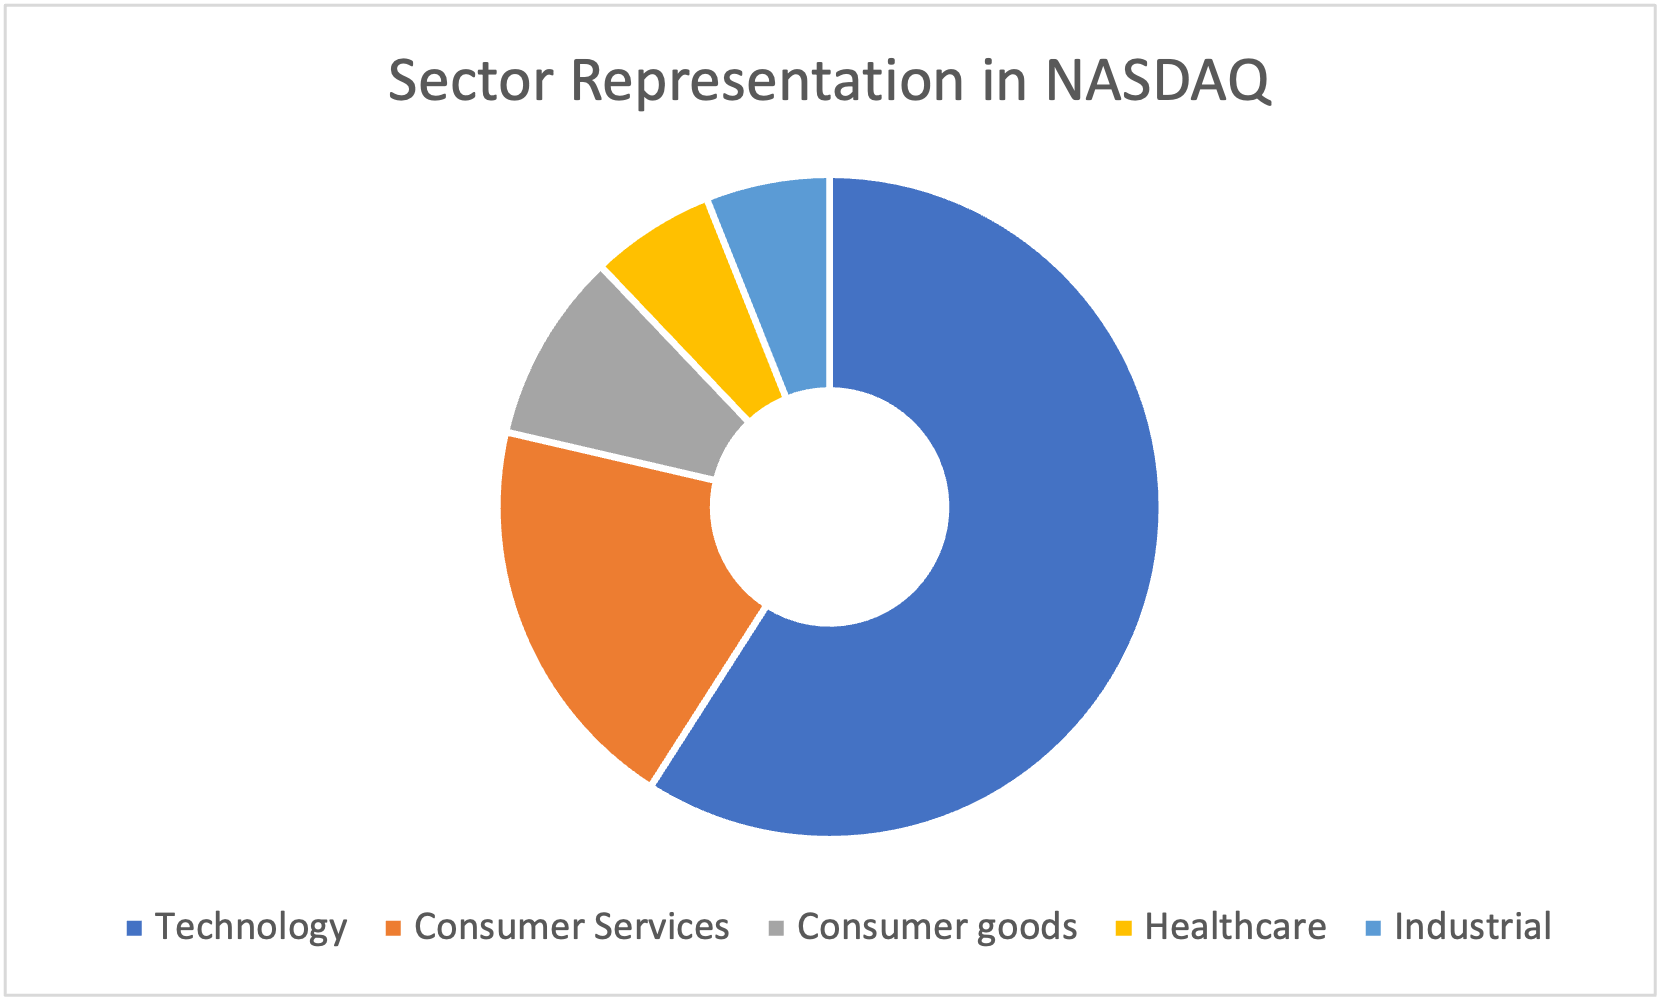
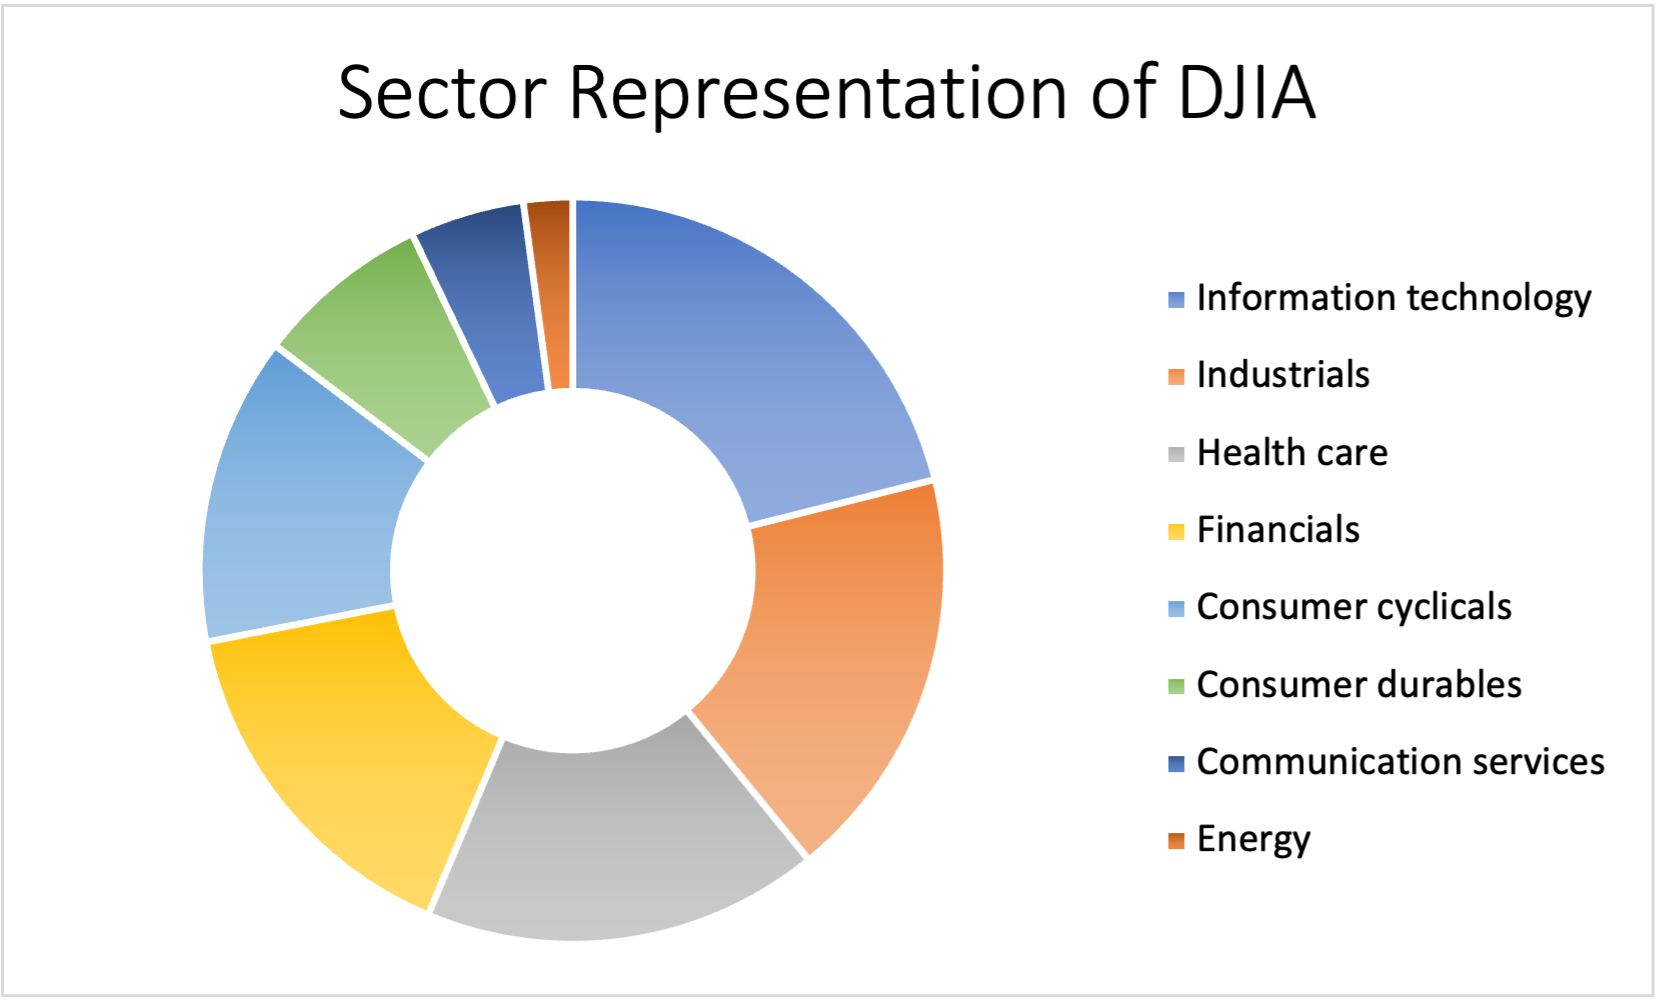
Table 2 gives the sector representation of the Russell 2000 index in terms of number of stocks and market capitalization as of January 31, 2023.
Table 2. Sector representation in the Russell 2000 index.
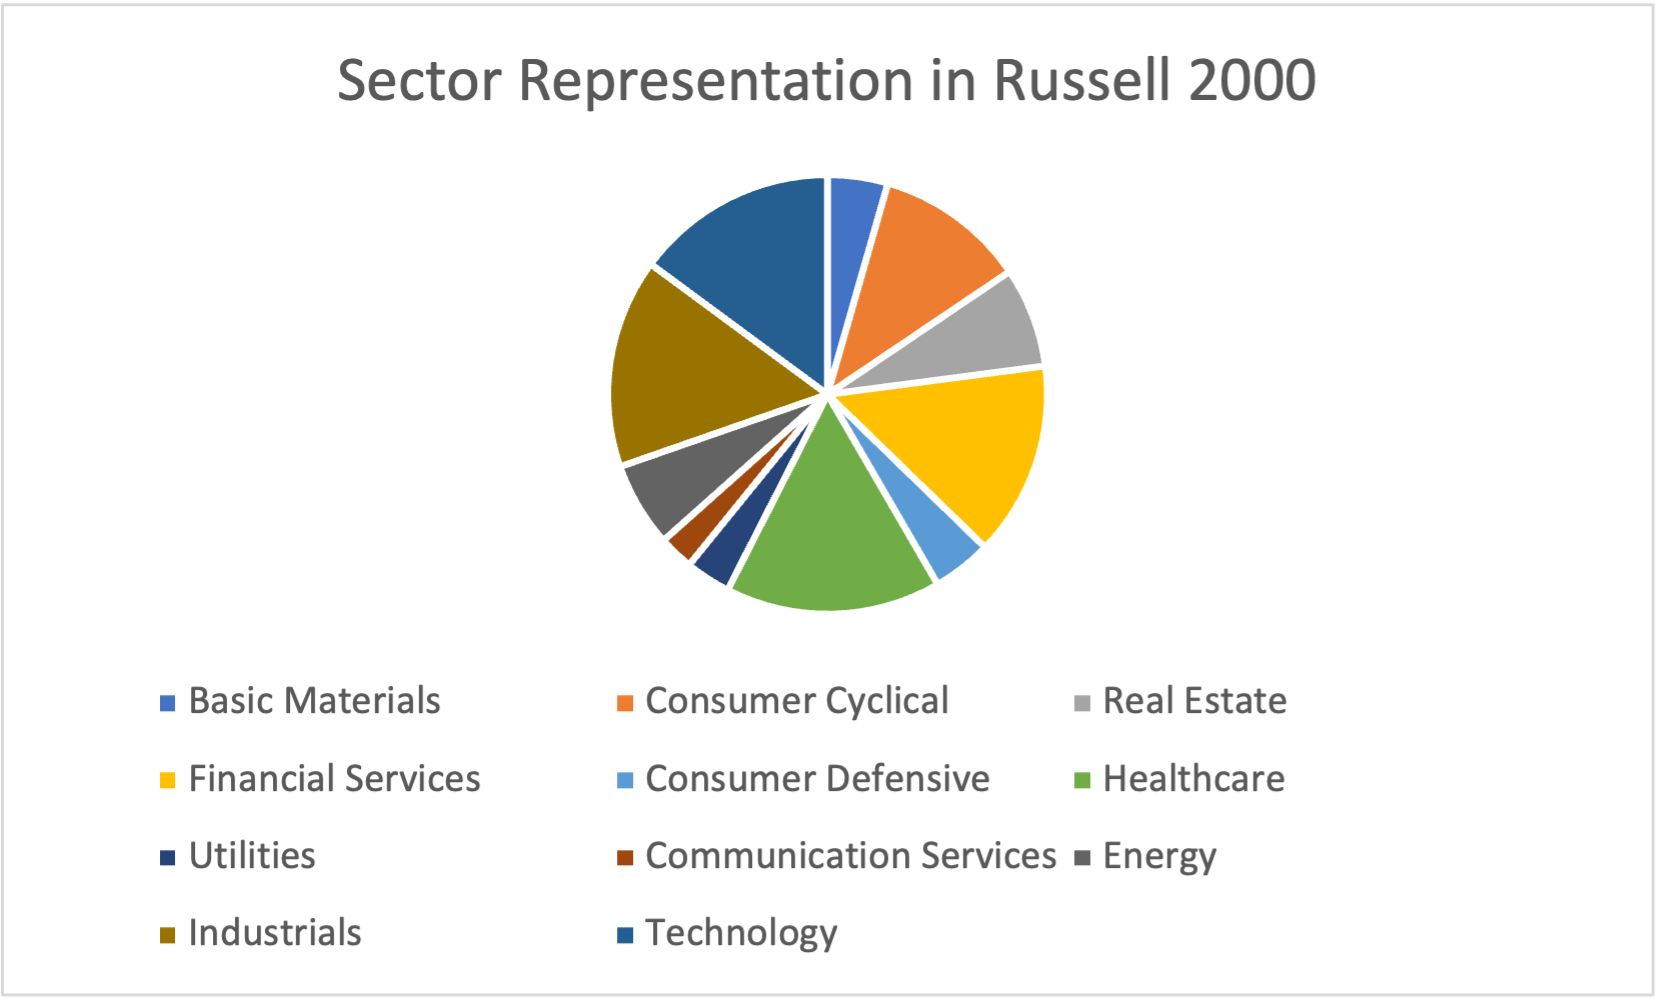
Source: computation by the author (data: YahooFinance! financial website).
Calculation of the Russell 2000 index value
The value of the Russell 2000 Index is calculated using a formula that takes into account the market capitalization of the individual stocks that are included in the index. This means the larger companies have a greater impact on the index than the smaller companies.
The Russell 2000 is reconstituted annually, typically in June. During this process, the index is updated to include the most recent data on small-cap stocks, and companies are added or removed from the index based on their market capitalization.
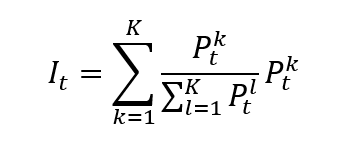
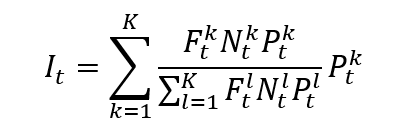
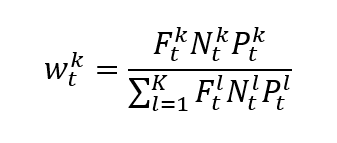
The formula for a market capitalization-weighted index is given by
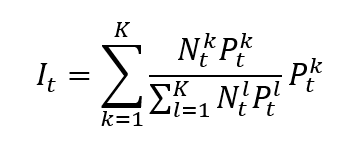
where I is the index value, k a given asset, K the number of assets in the index, Pk the market price of asset k, Nk the number of issued shares for asset k, and t the time of calculation of the index.
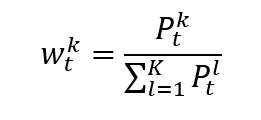
In a market capitalization-weighted index, the weight of asset k is given by formula can be rewritten as
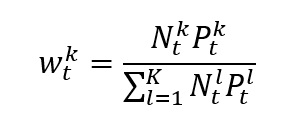
which clearly shows that the weight of each asset in the index is its market capitalization of the asset divided by the sum of the market capitalizations of all assets.
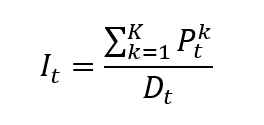
Note that the divisor, whose calculation is based on the number of shares, is typically adjusted for events such as stock splits and dividends. The divisor is used to ensure that the value of the index remains consistent over time despite changes in the number of outstanding shares.
Use of the Russell 2000 index in asset management
The Russell 2000 index is widely used in asset management as a benchmark for small-cap stocks in the United States. Small-cap stock experts who run active funds frequently use the Russell 2000 as a benchmark for their performance. On the other hand, passive fund managers can create index funds or exchange-traded funds (ETFs) that follow the performance of the Russell 2000 using the Russell 2000 as a base. In addition to serving as a benchmark for active and passive fund managers, the Russell 2000 index is also used by individual investors who are interested in small-cap stocks. Overall, the Russell 2000 index is a valuable tool for asset managers, and it has a significant impact on the investment strategies and decisions made in this market segment.
Benchmark for equity funds
Equity funds are actively managed investment vehicles that pool capital from a number of investors to buy stocks from a variety of industries. The Russell 2000 index serves as a benchmark for fund managers when assessing the performance of their small-cap equity funds. Fund managers might use a variety of investment strategies, such as top-down sector allocation or bottom-up stock selection, to outperform the benchmark.
Investors can get a good idea of how well a small-cap equity fund is doing in relation to the overall market by comparing the fund’s performance to that of the Russell 2000 index. However, it’s crucial to keep in mind that there are additional elements, such as fees, expenses, and the expertise and experience of the fund manager, that can impact the performance of an equity fund.
Financial products around the Russell 2000 index
There are a number of financial products that either provide exposure to the index or use information from the index. Not just the index funds but there are numerous ETFs and other financial products such as mutual funds, futures and options etc.
- Exchange-Traded Funds, Options Contracts, Futures Contracts, Index funds and Mutual funds.
- ETFs are the investment funds that are traded like stocks. ETFs based on the Russell 2000 Index include the iShares Russell 2000 ETF and the Vanguard Russell 2000 ETF.
- Index mutual funds that track the performance of the Russell 2000 Index typically have low expense ratios and are designed to provide returns that closely match the performance of the index.
- Futures and options contracts based on the Russell 2000 Index are traded on several exchanges, including the Chicago Mercantile Exchange (CME) and the Intercontinental Exchange (ICE).
Historical data for the Russell 2000 index
How to get the data?
The Russell 2000 index is the most common index used in finance, and historical data for the Russell 2000 index can be easily downloaded from the internet.
For example, you can download data for the Russell 2000 index from September 10, 1987 on Yahoo! Finance (the Yahoo! code for Russell 2000 index is ^RUT).
Source: Yahoo! Finance.
You can also download the same data from a Bloomberg terminal.
R program
The R program below written by Shengyu ZHENG allows you to download the data from Yahoo! Finance website and to compute summary statistics and risk measures about the Russell 2000 index.

Data file
The R program that you can download above allows you to download the data for the Russell 2000 index from the Yahoo! Finance website. The database starts on September 10, 1987. It also computes the returns (logarithmic returns) from closing prices.
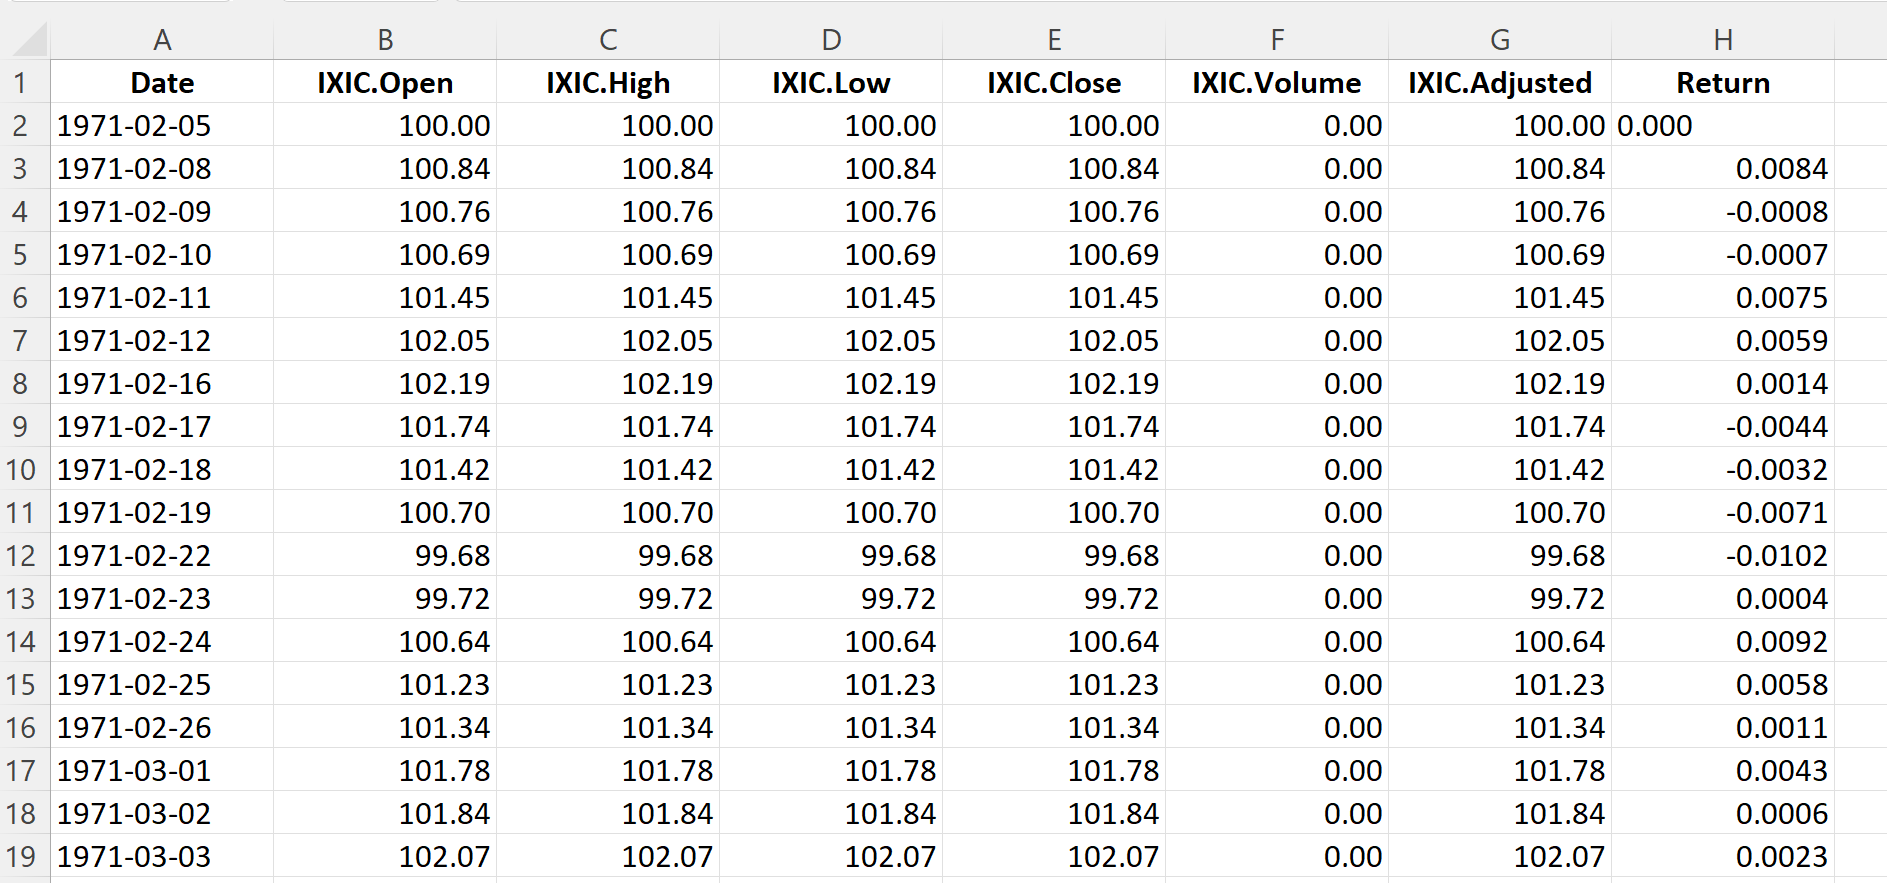
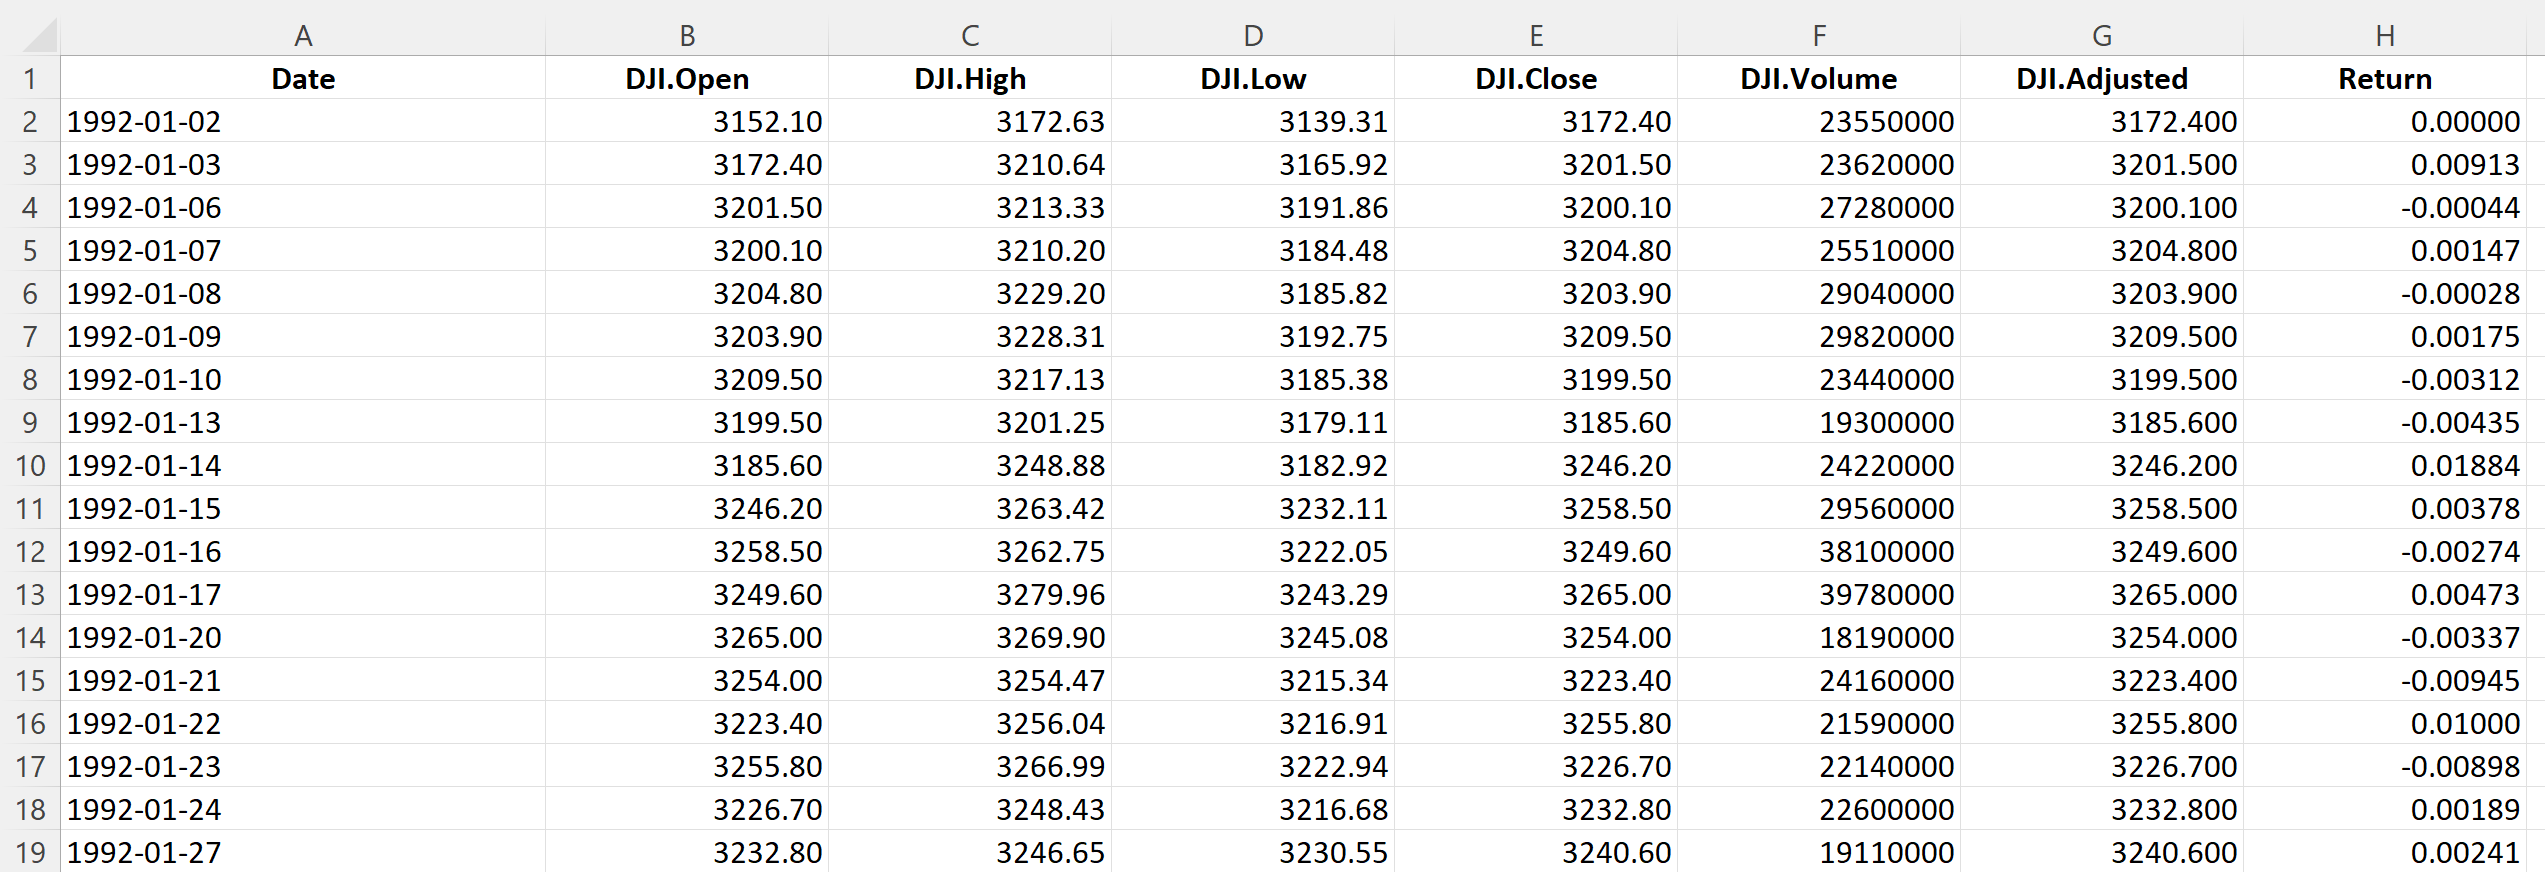
Table 3 below represents the top of the data file for the Russell 2000 index downloaded from the Yahoo! Finance website with the R program.
Table 3. Top of the data file for the Russell 2000 index.
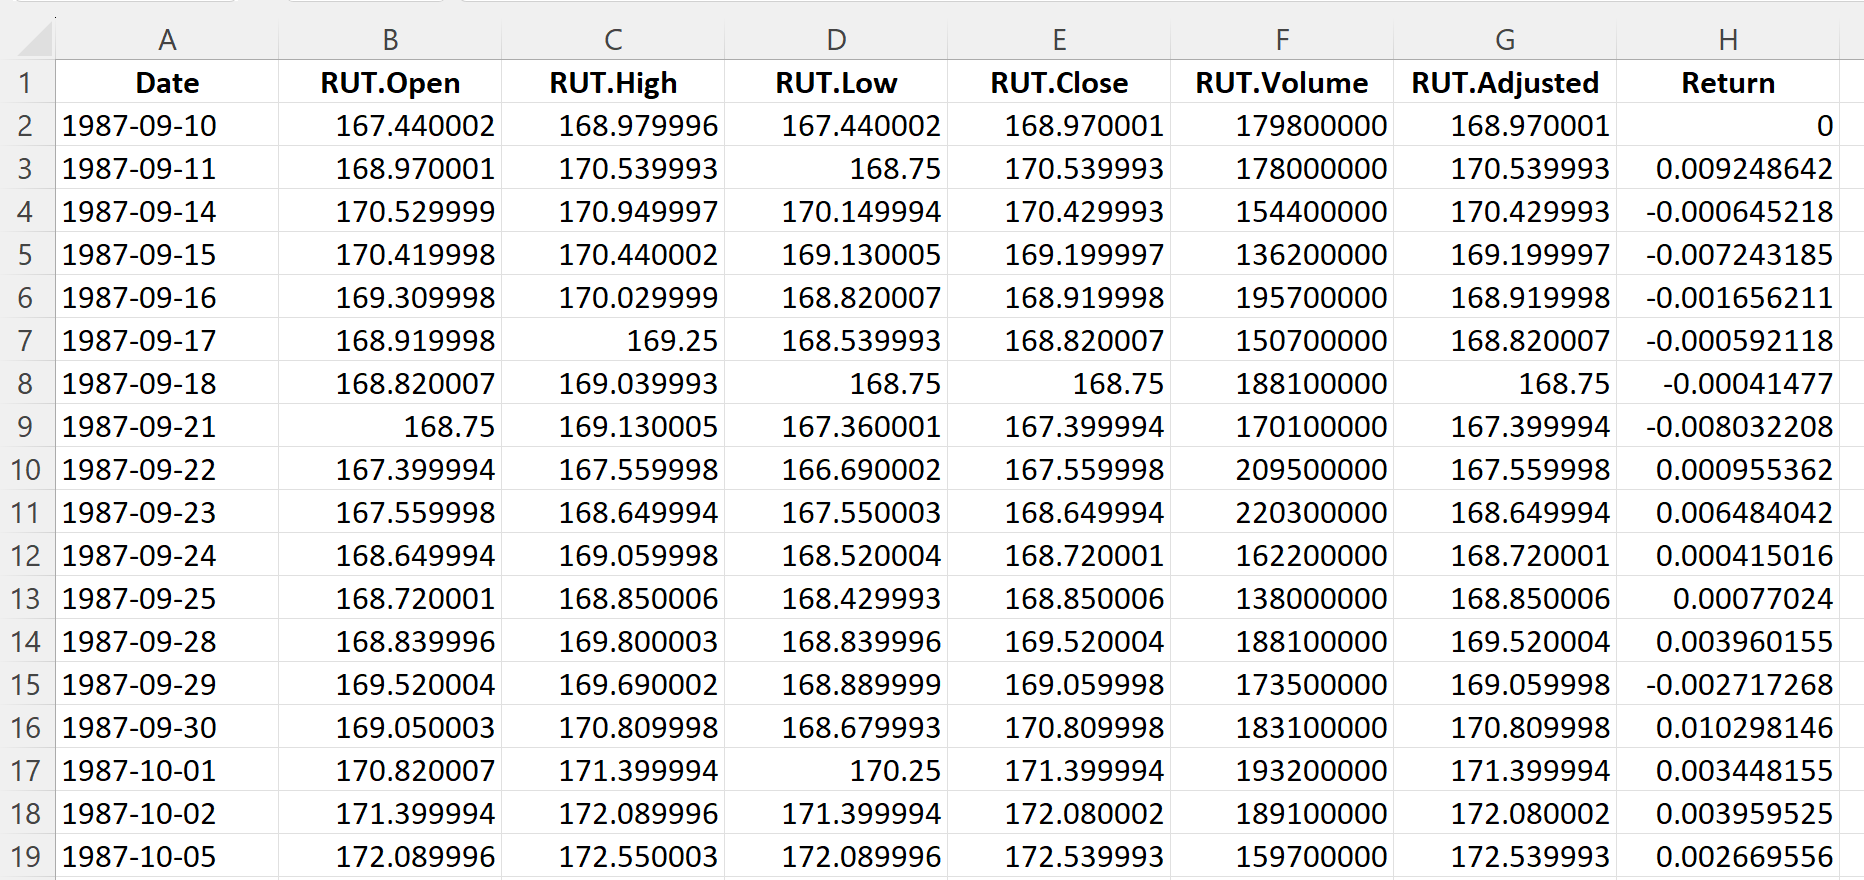
Source: computation by the author (data: Yahoo! Finance website).
Evolution of the Russell 2000 index
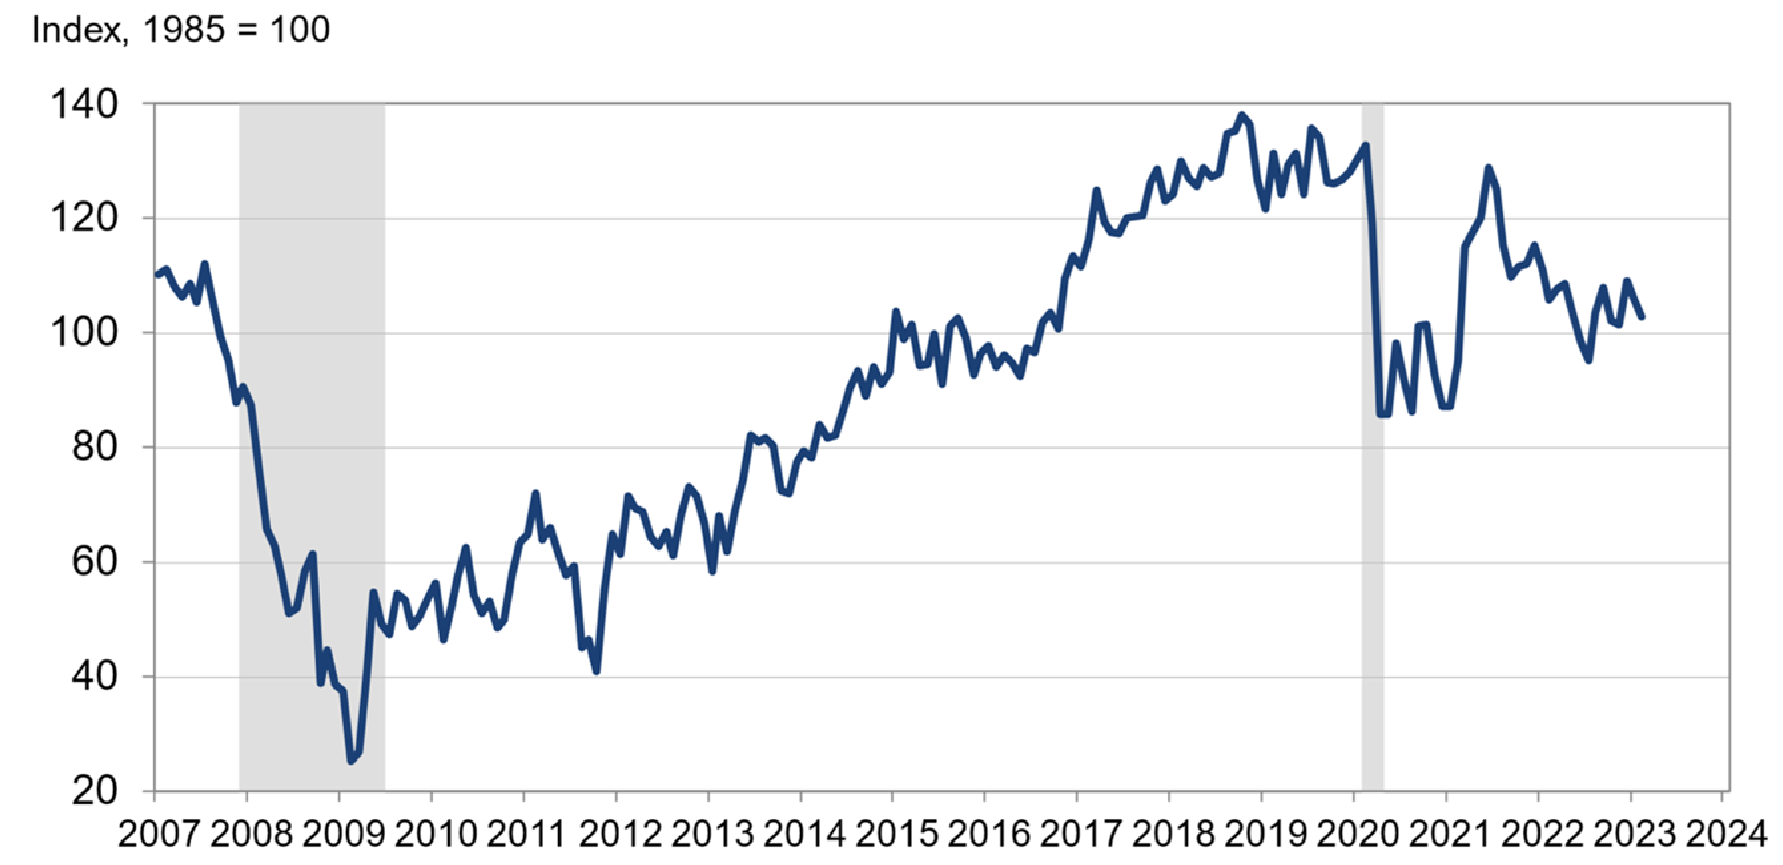
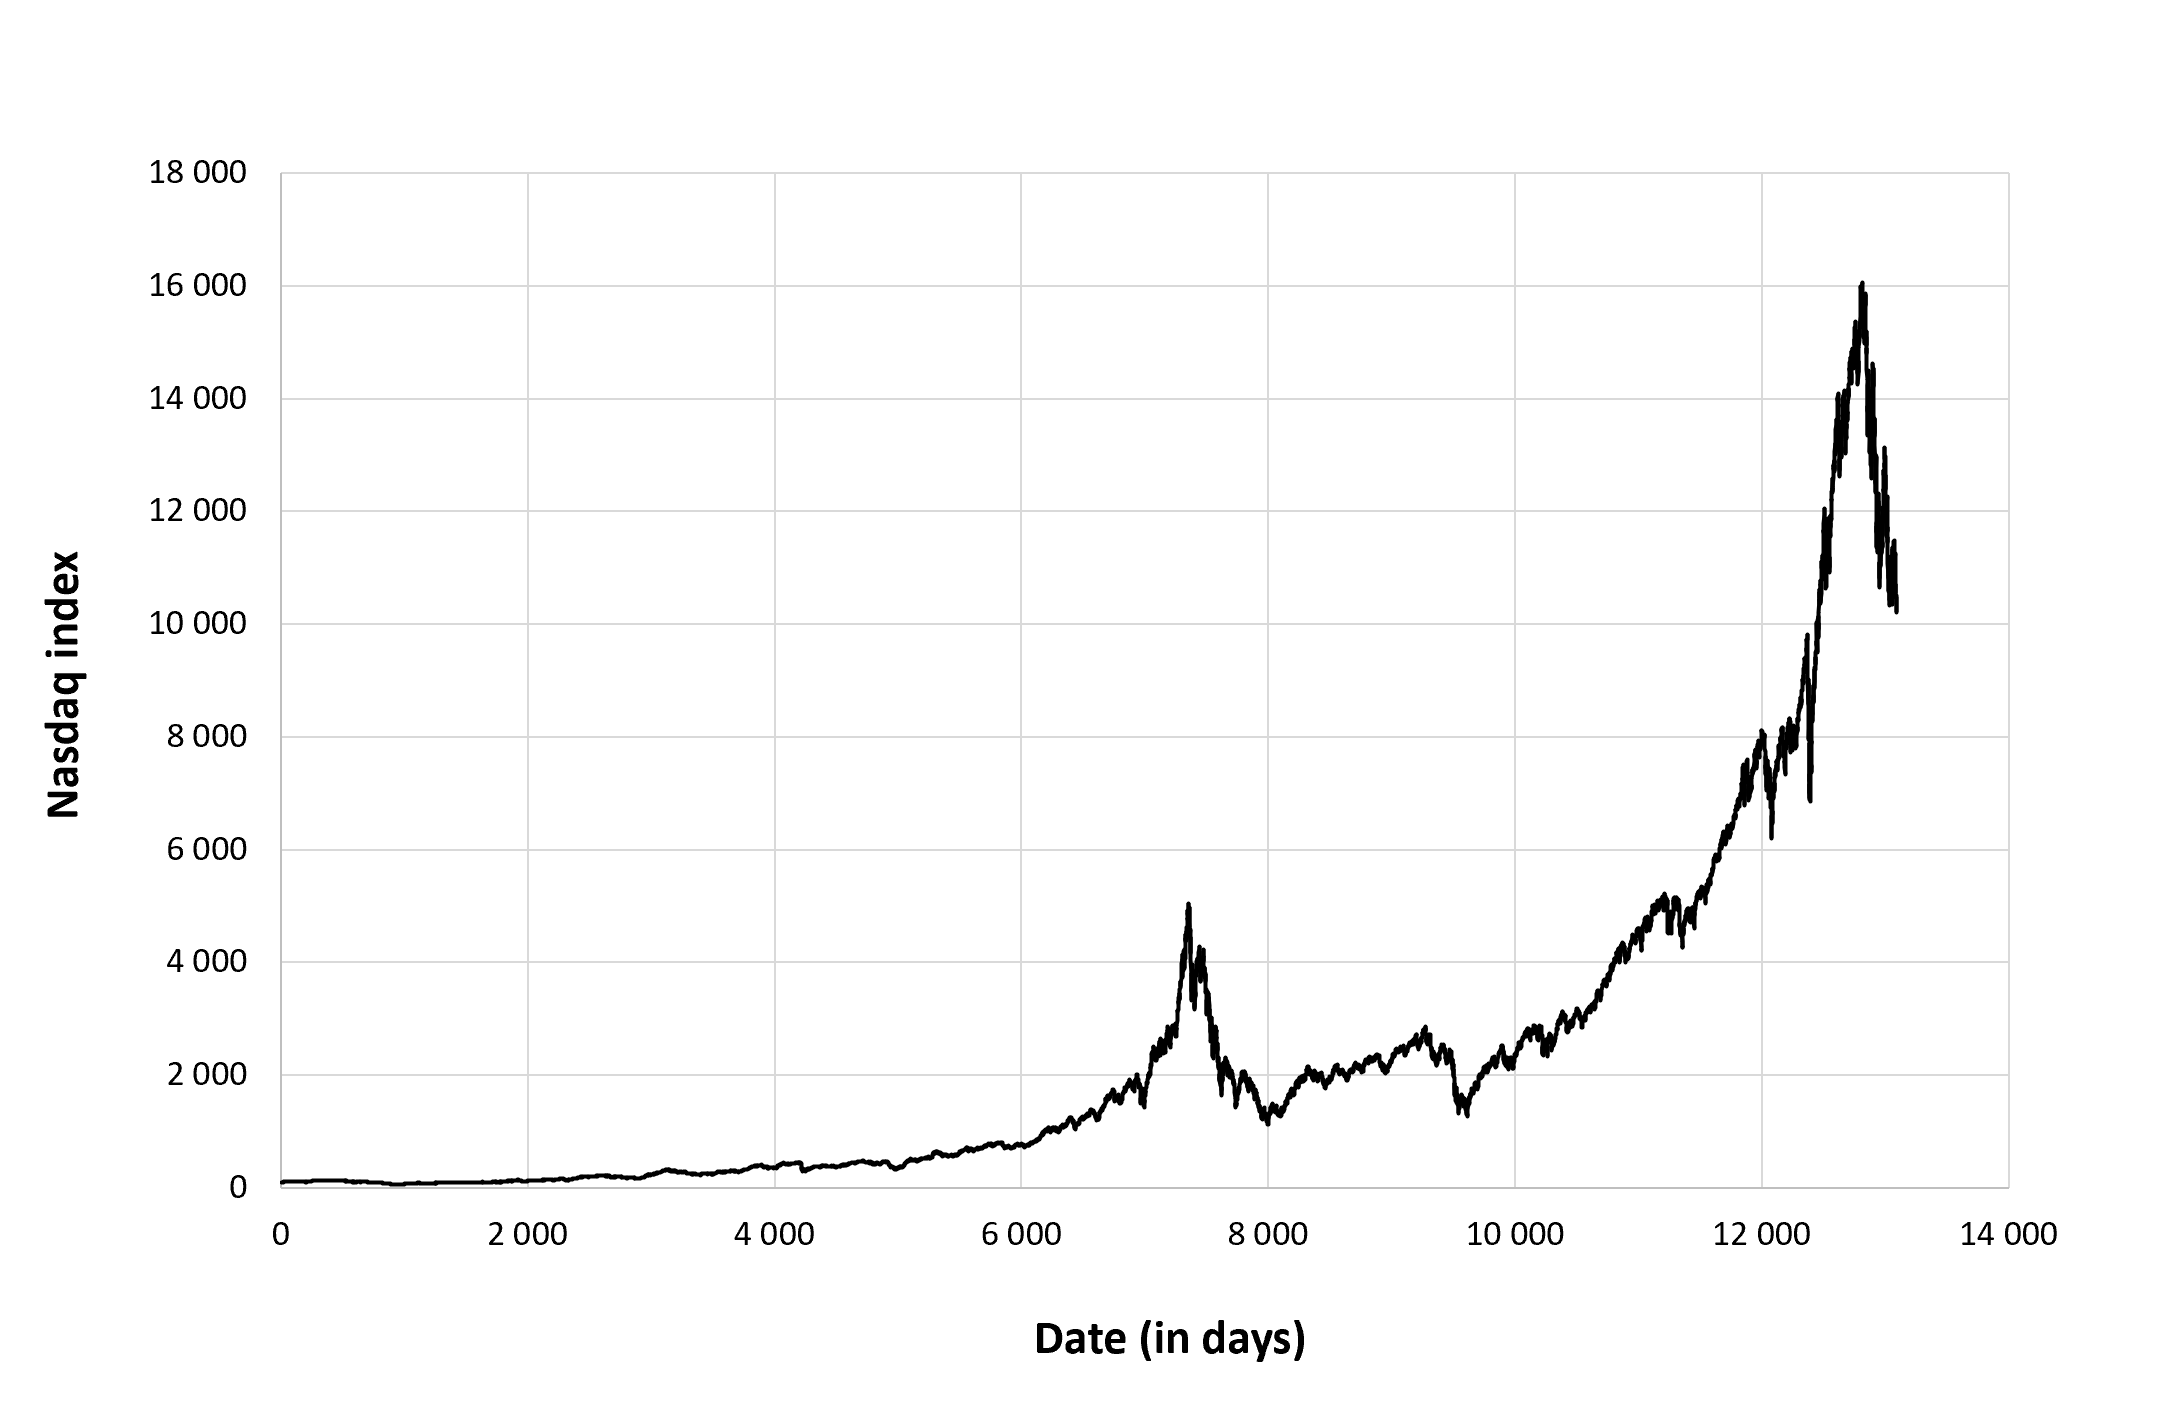
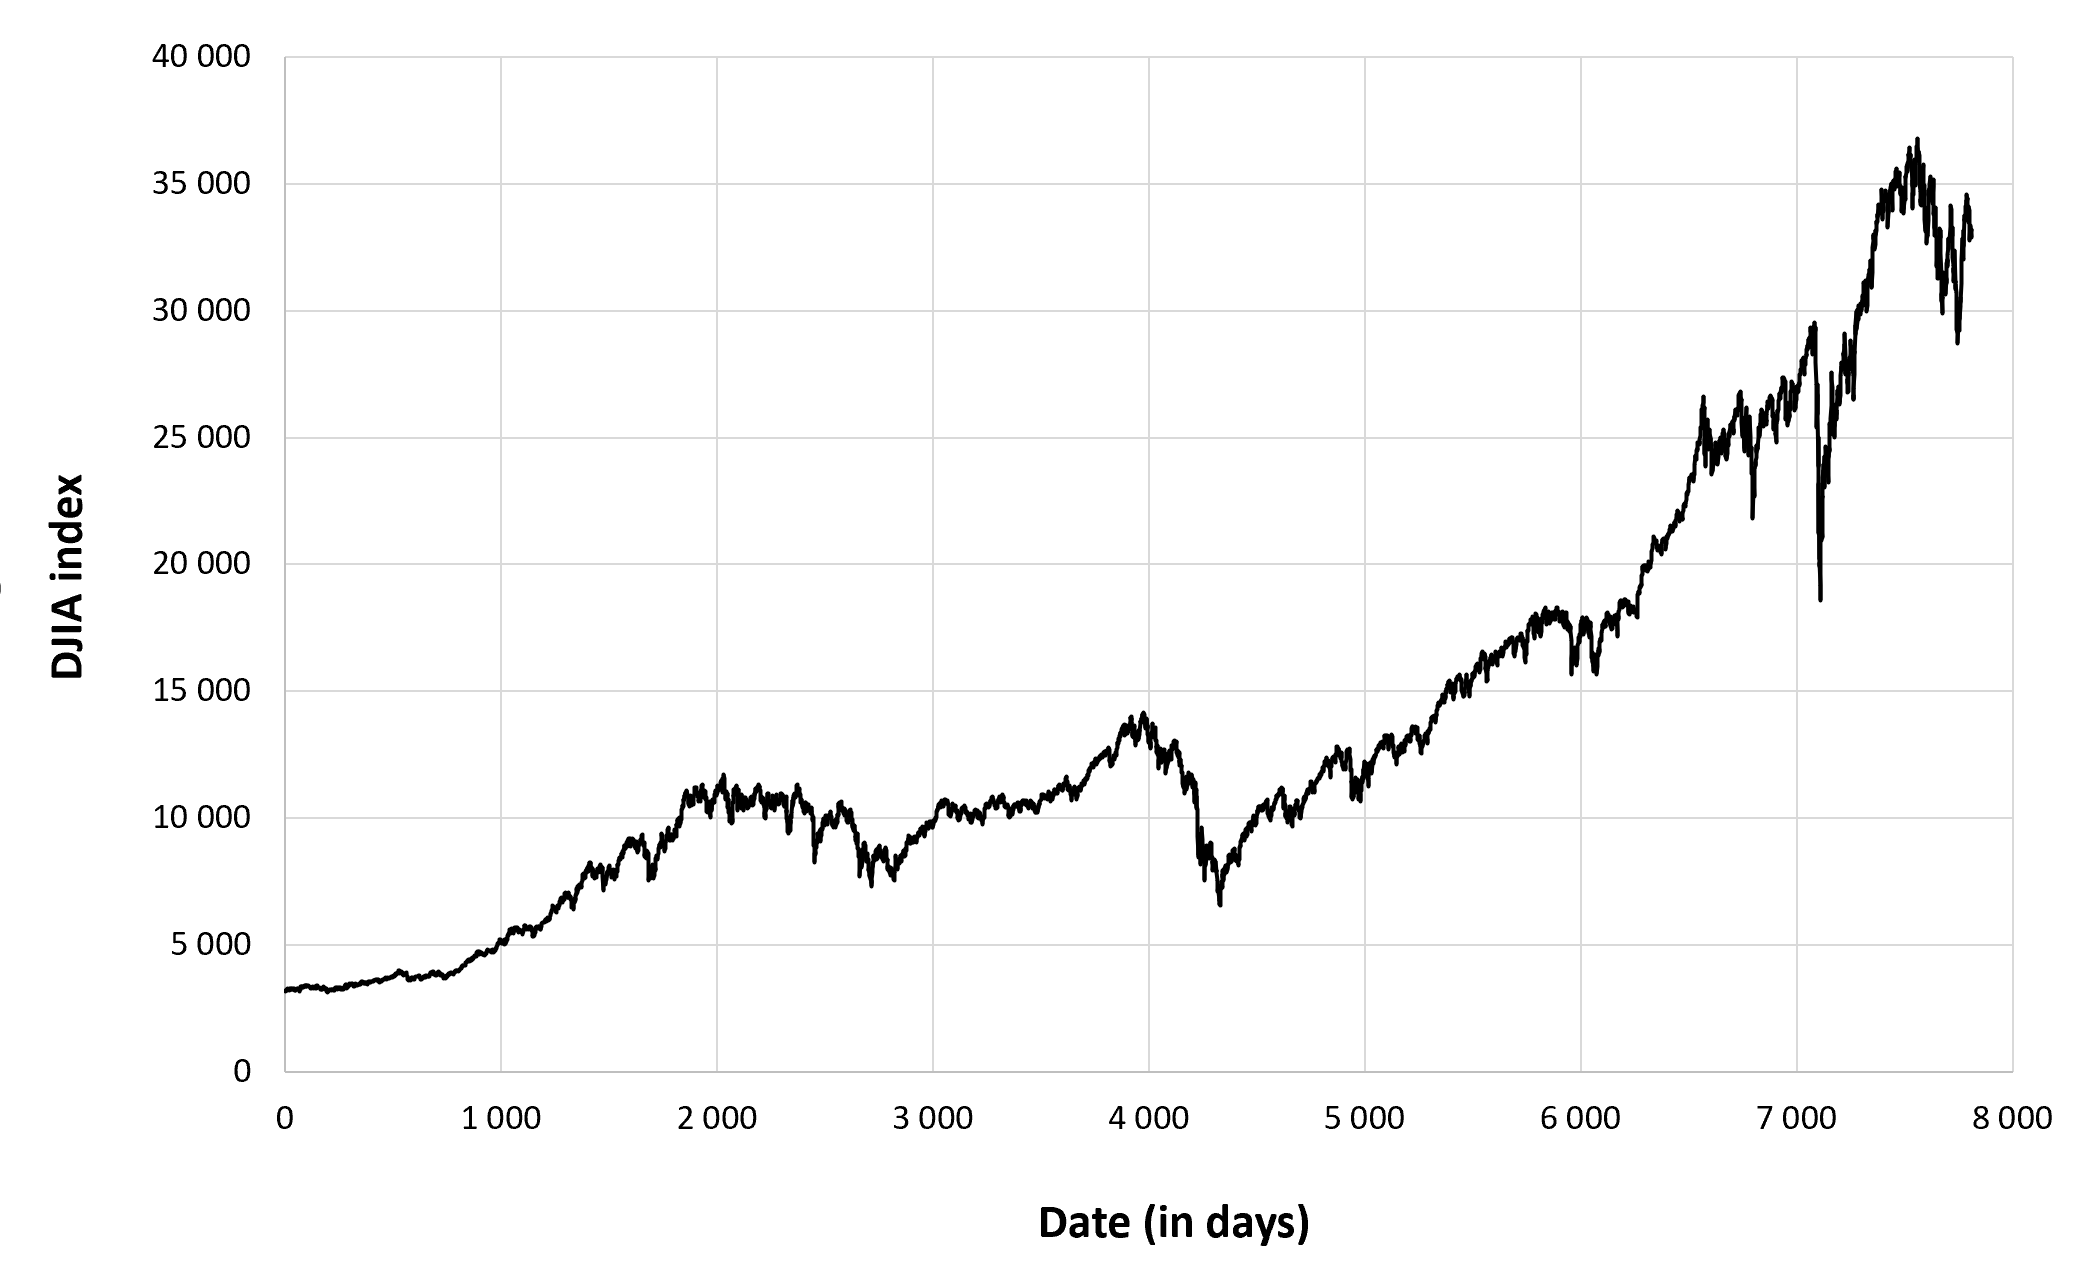
Figure 1 below gives the evolution of the Russell 2000 index from September 10, 1987 to December 30, 2022 on a daily basis.
Figure 1. Evolution of the Russell 2000 index.
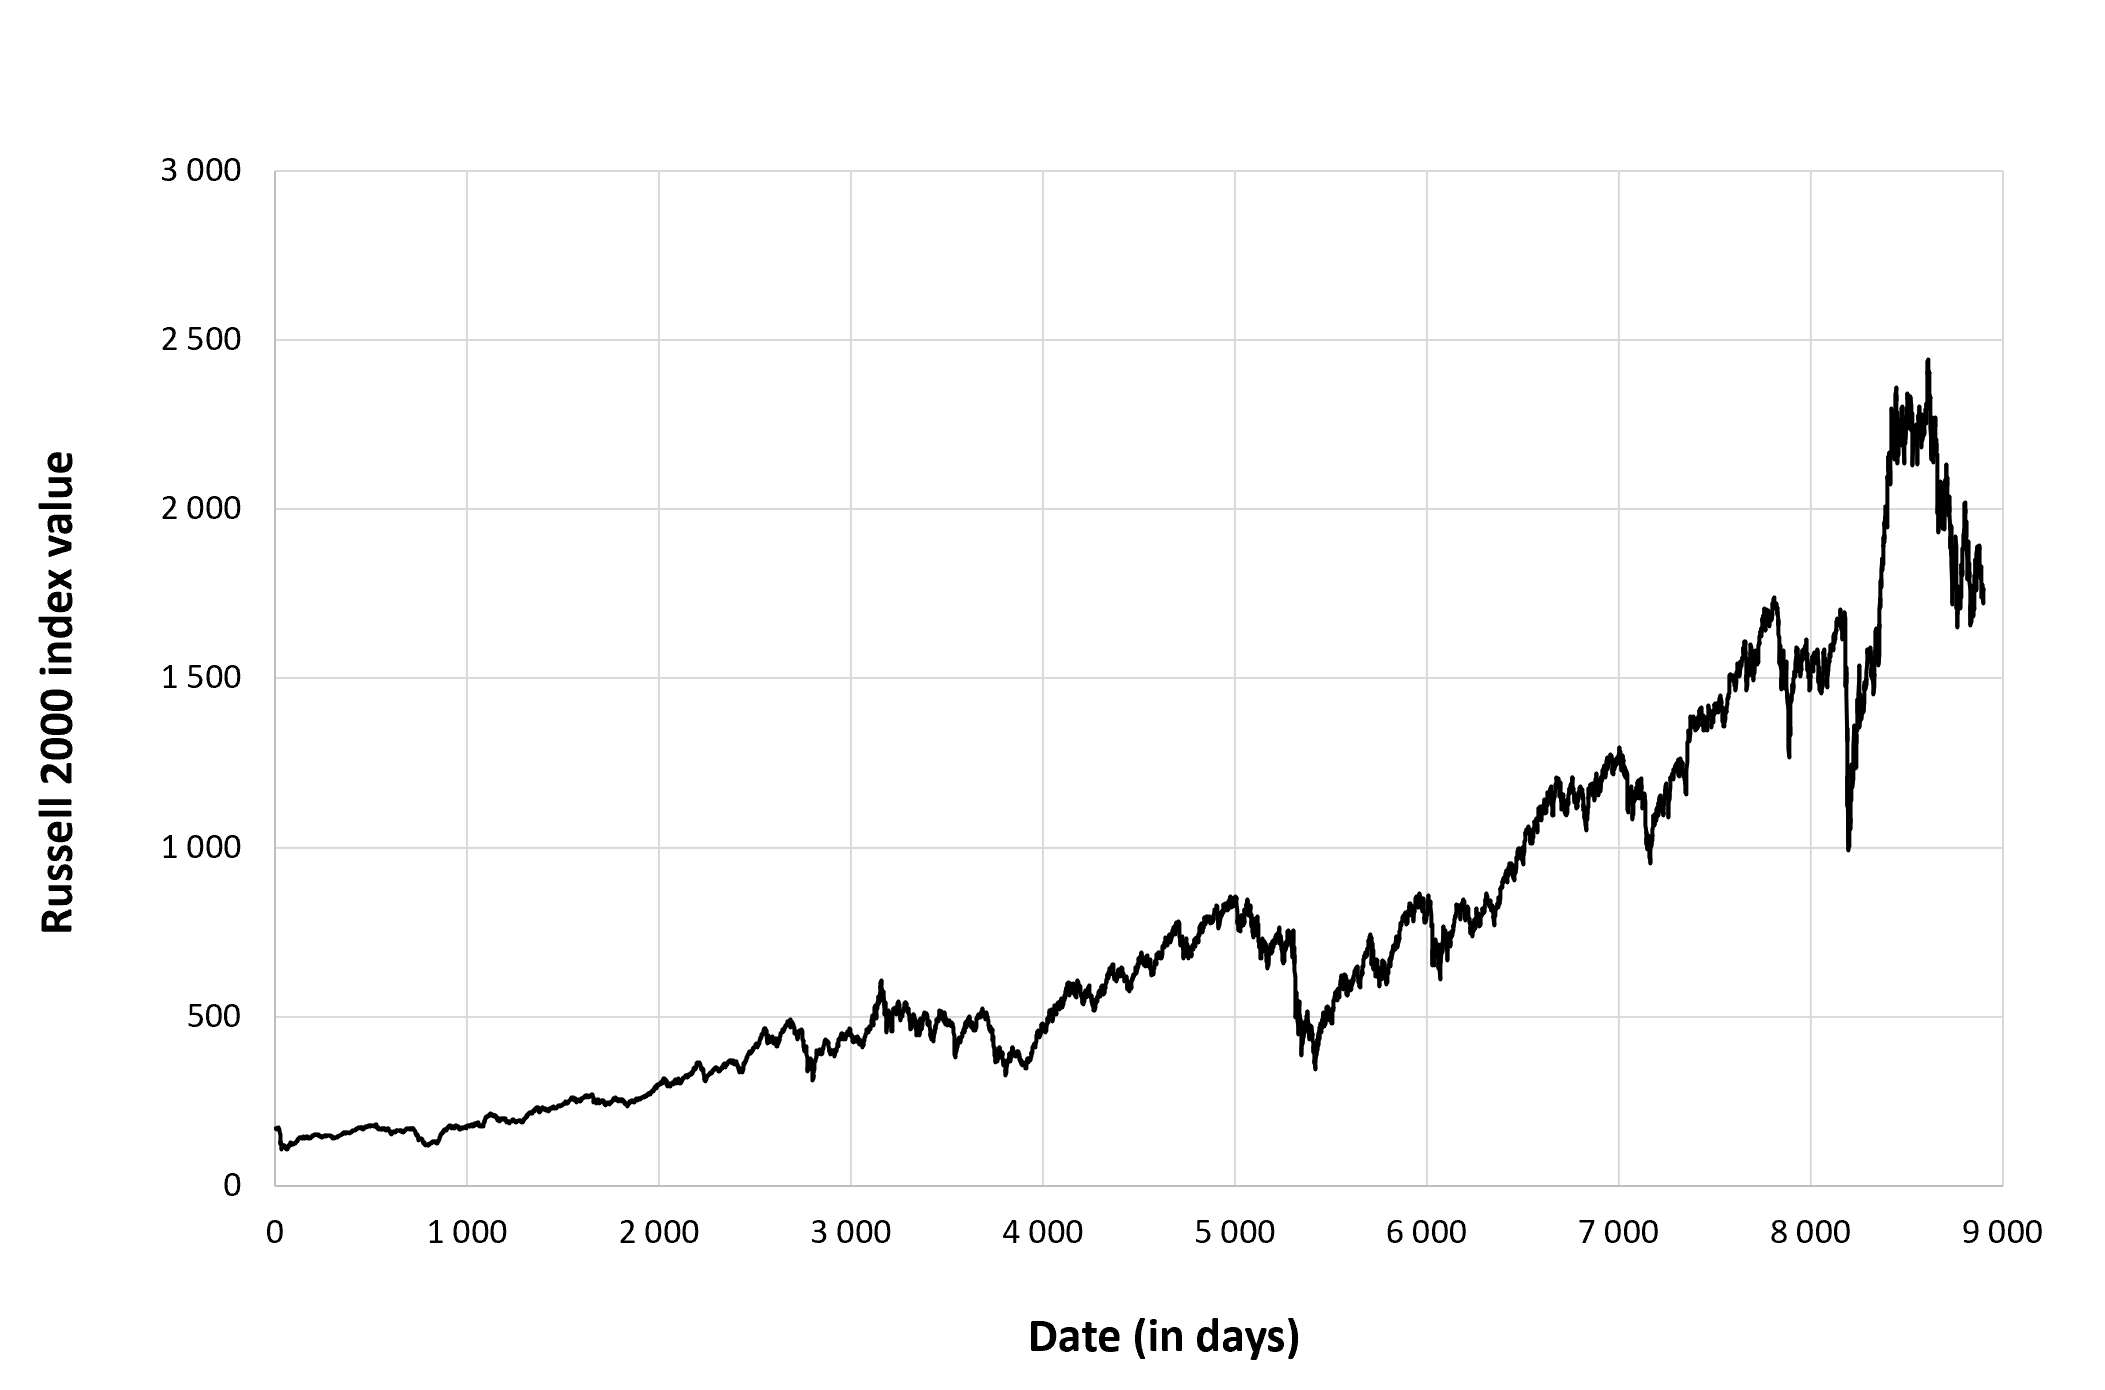
Source: computation by the author (data: Yahoo! Finance website).
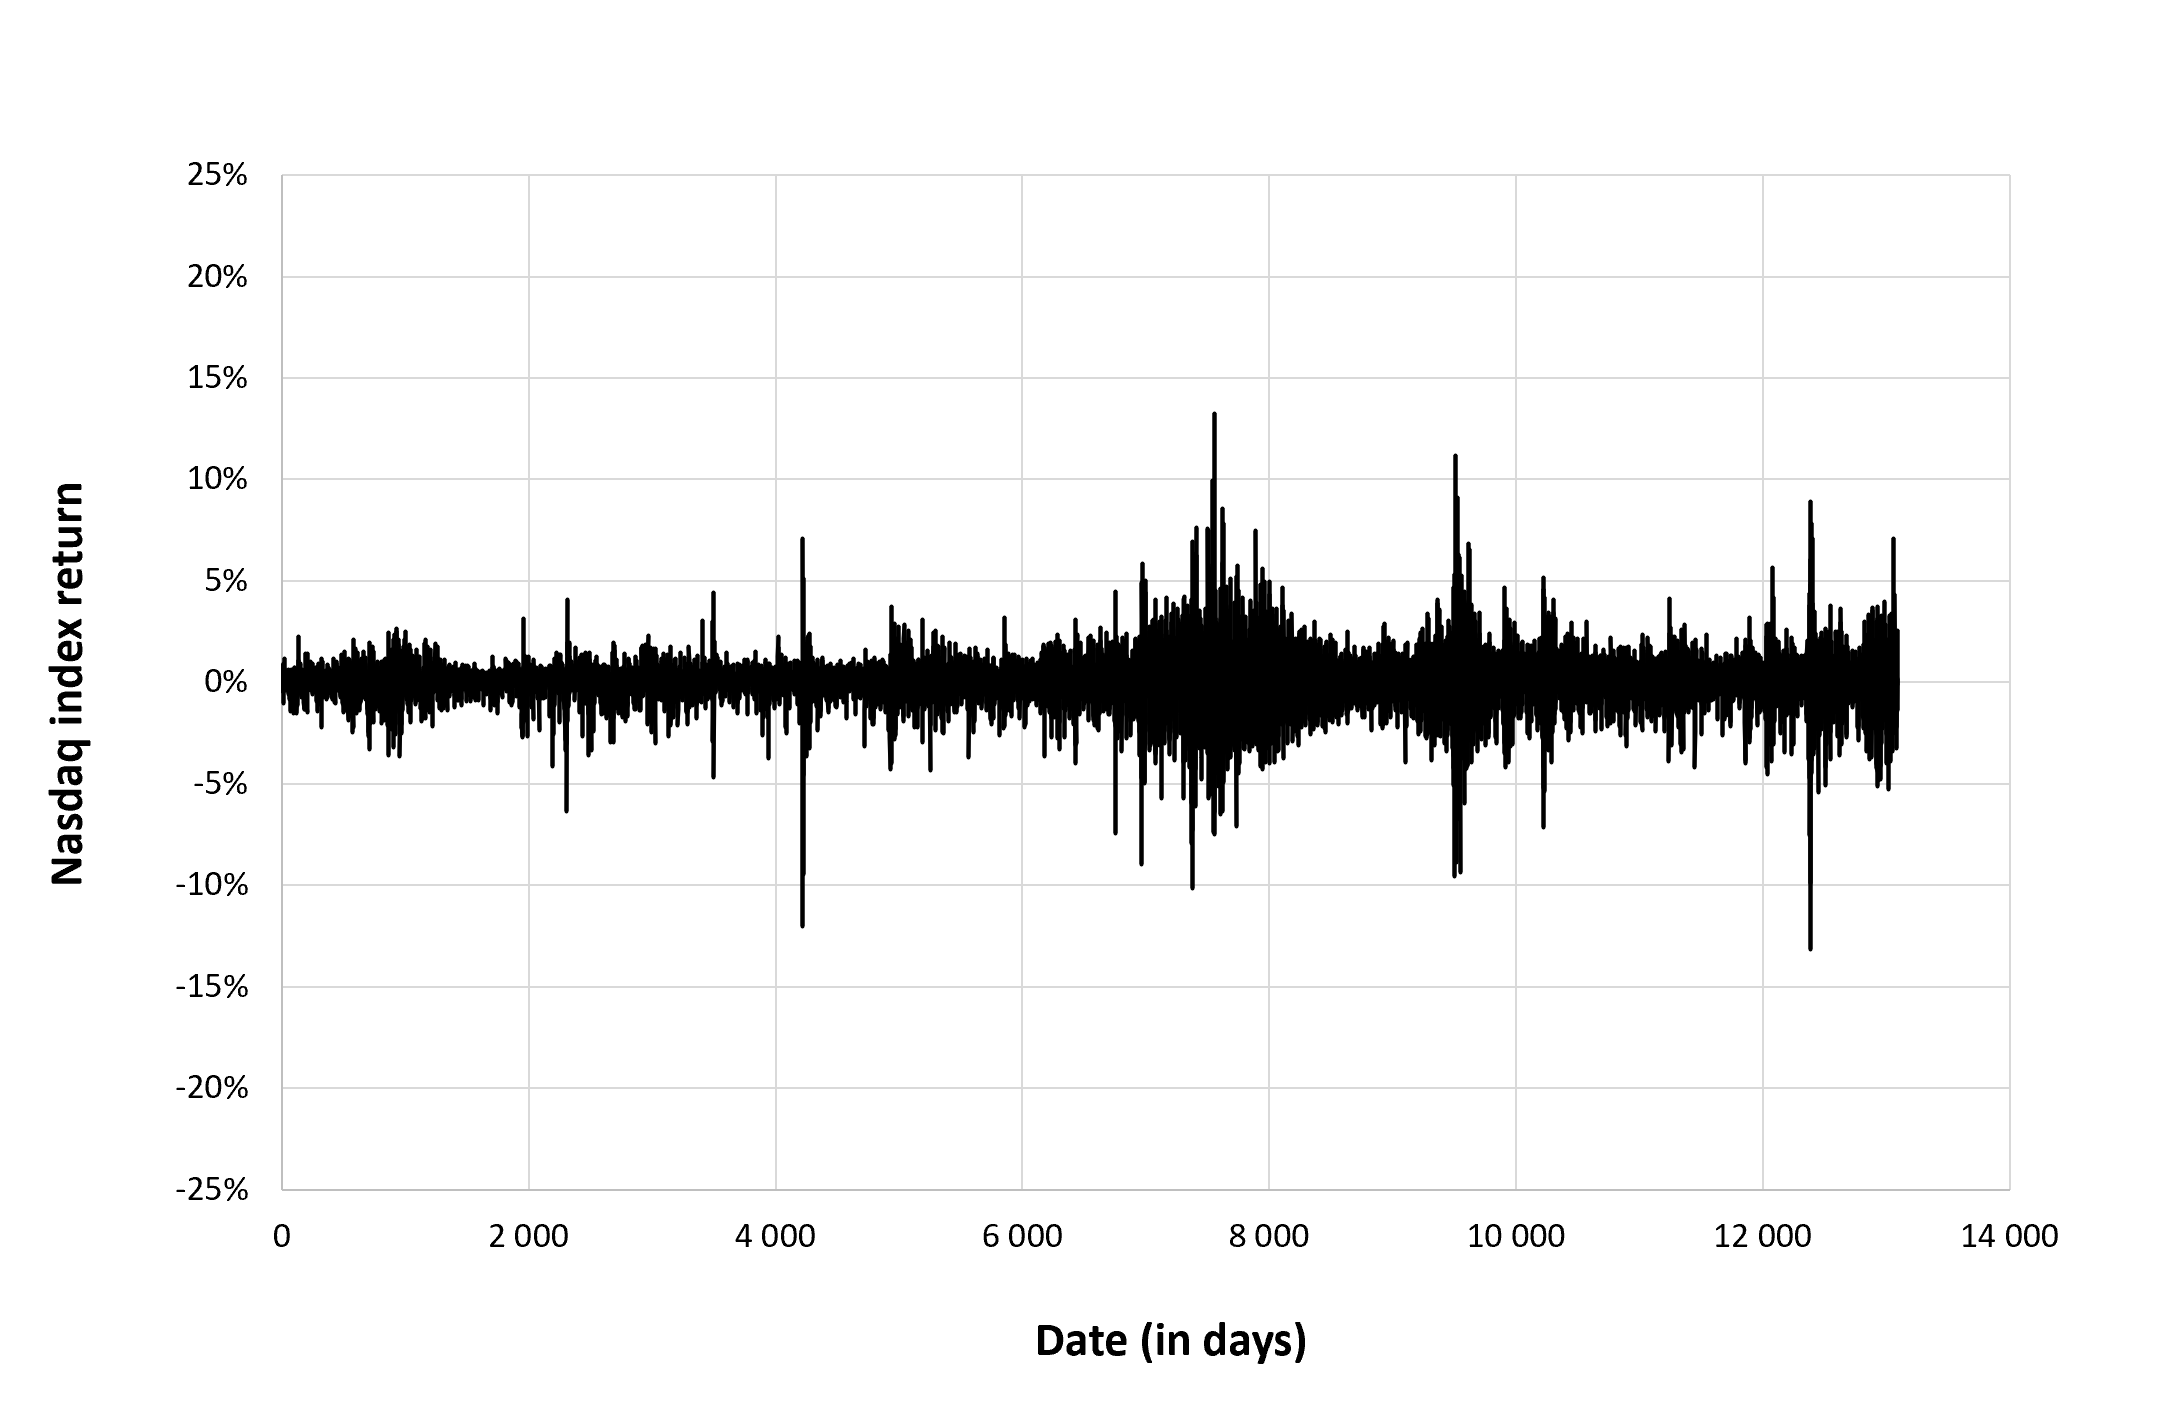
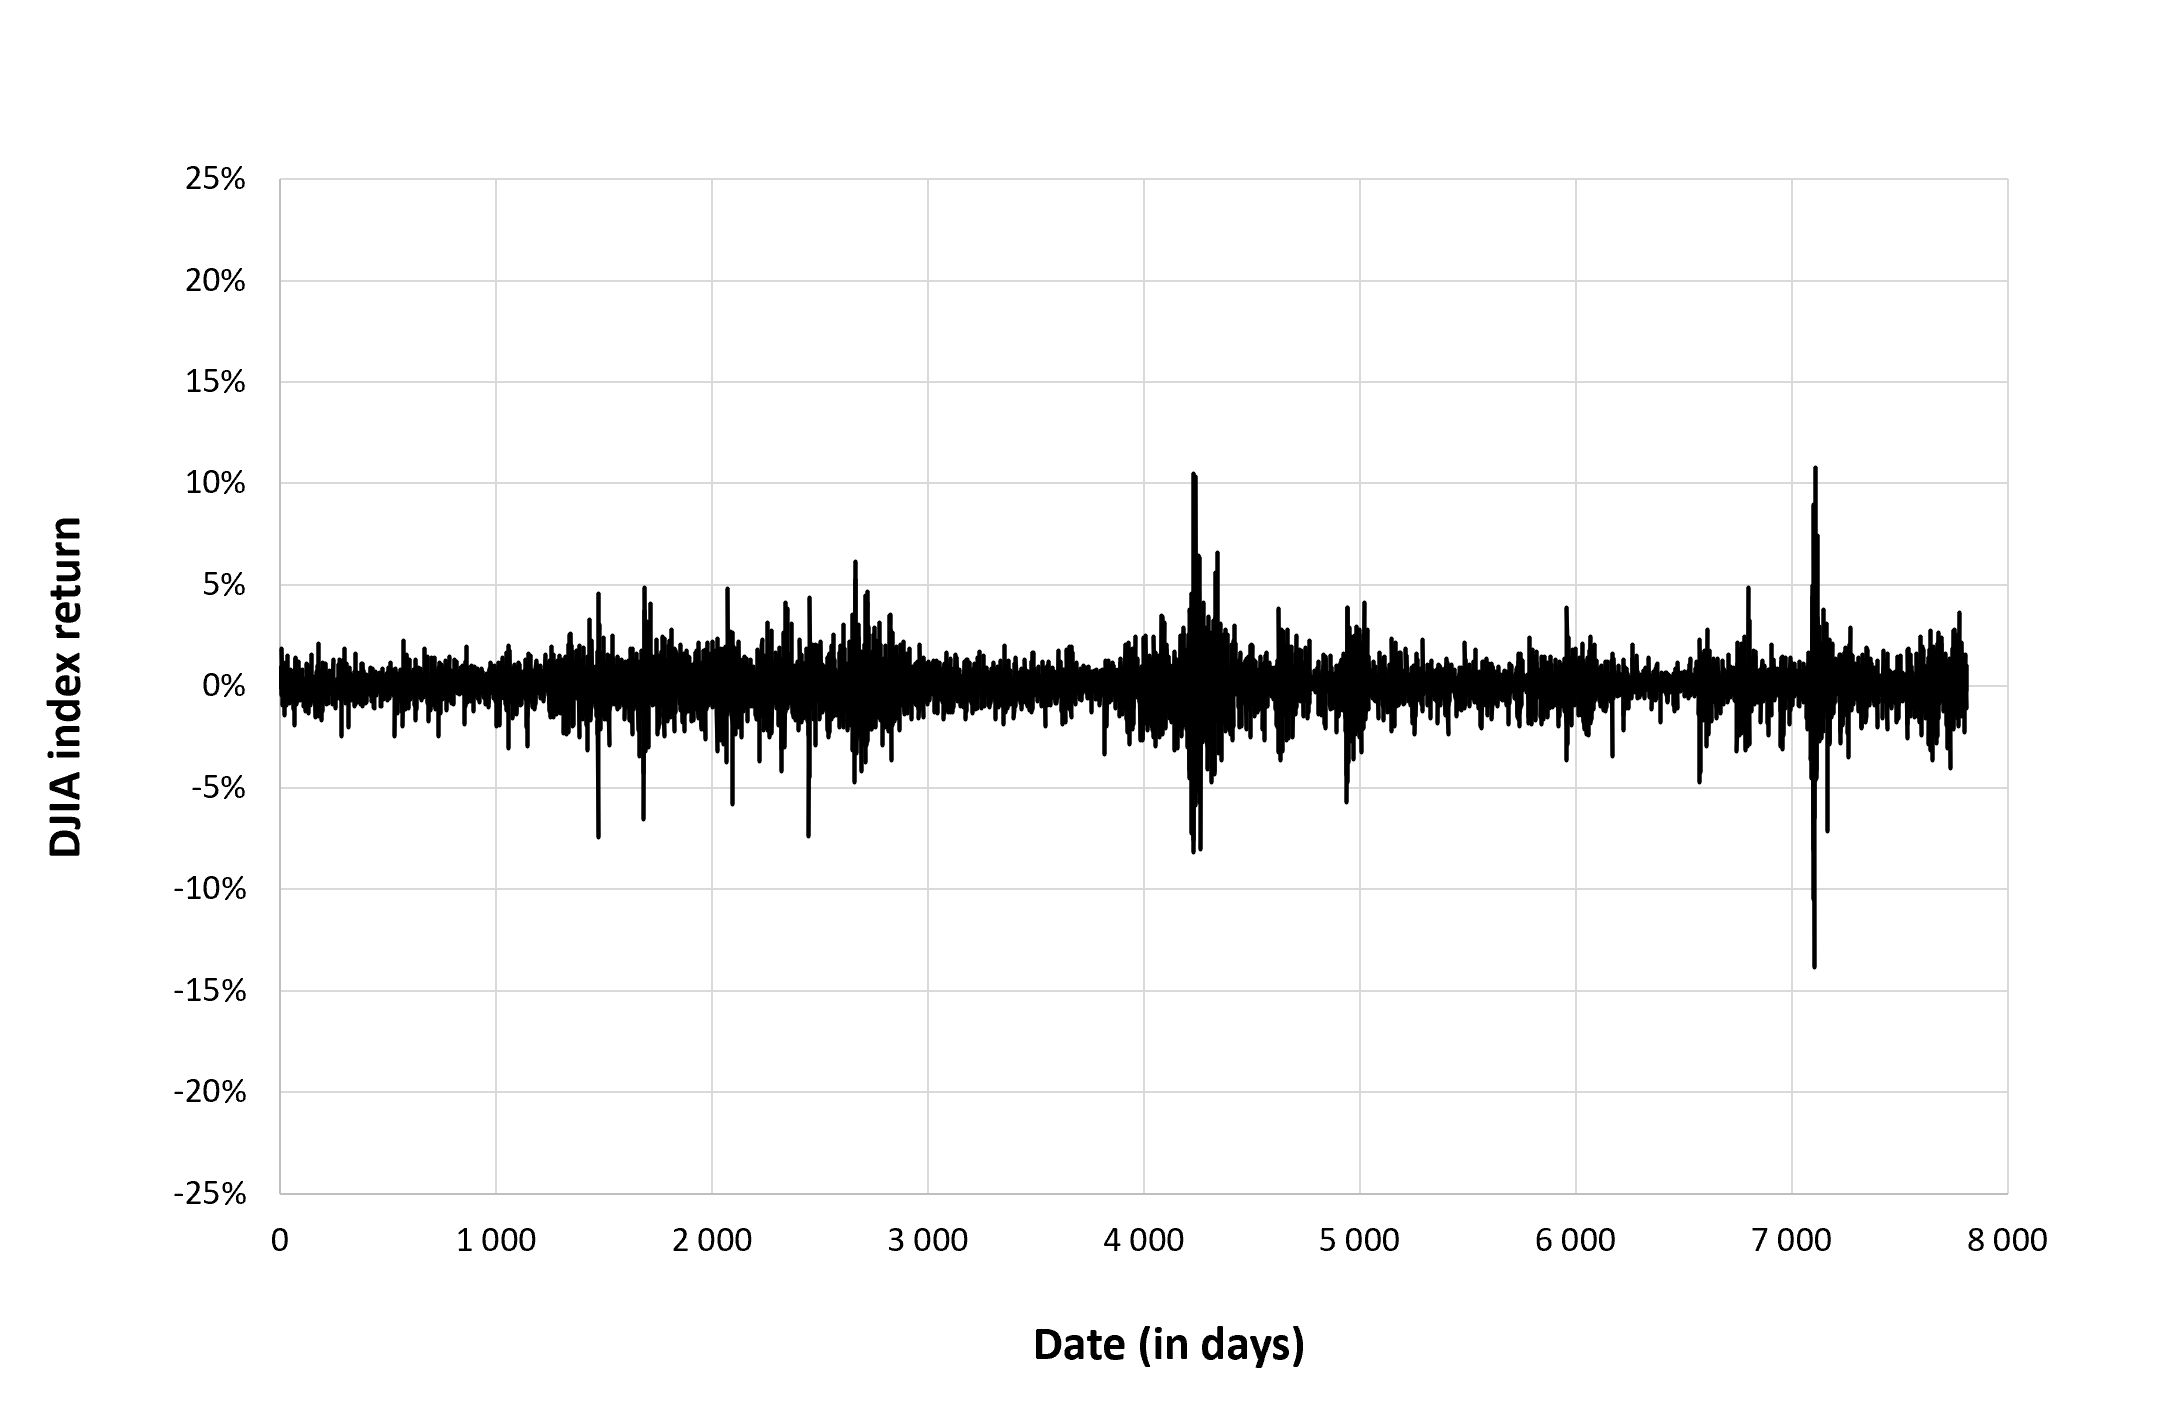
Figure 2 below gives the evolution of the Russell 2000 index returns from September 10, 1987 to December 30, 2022 on a daily basis.
Figure 2. Evolution of the Russell 2000 index returns.
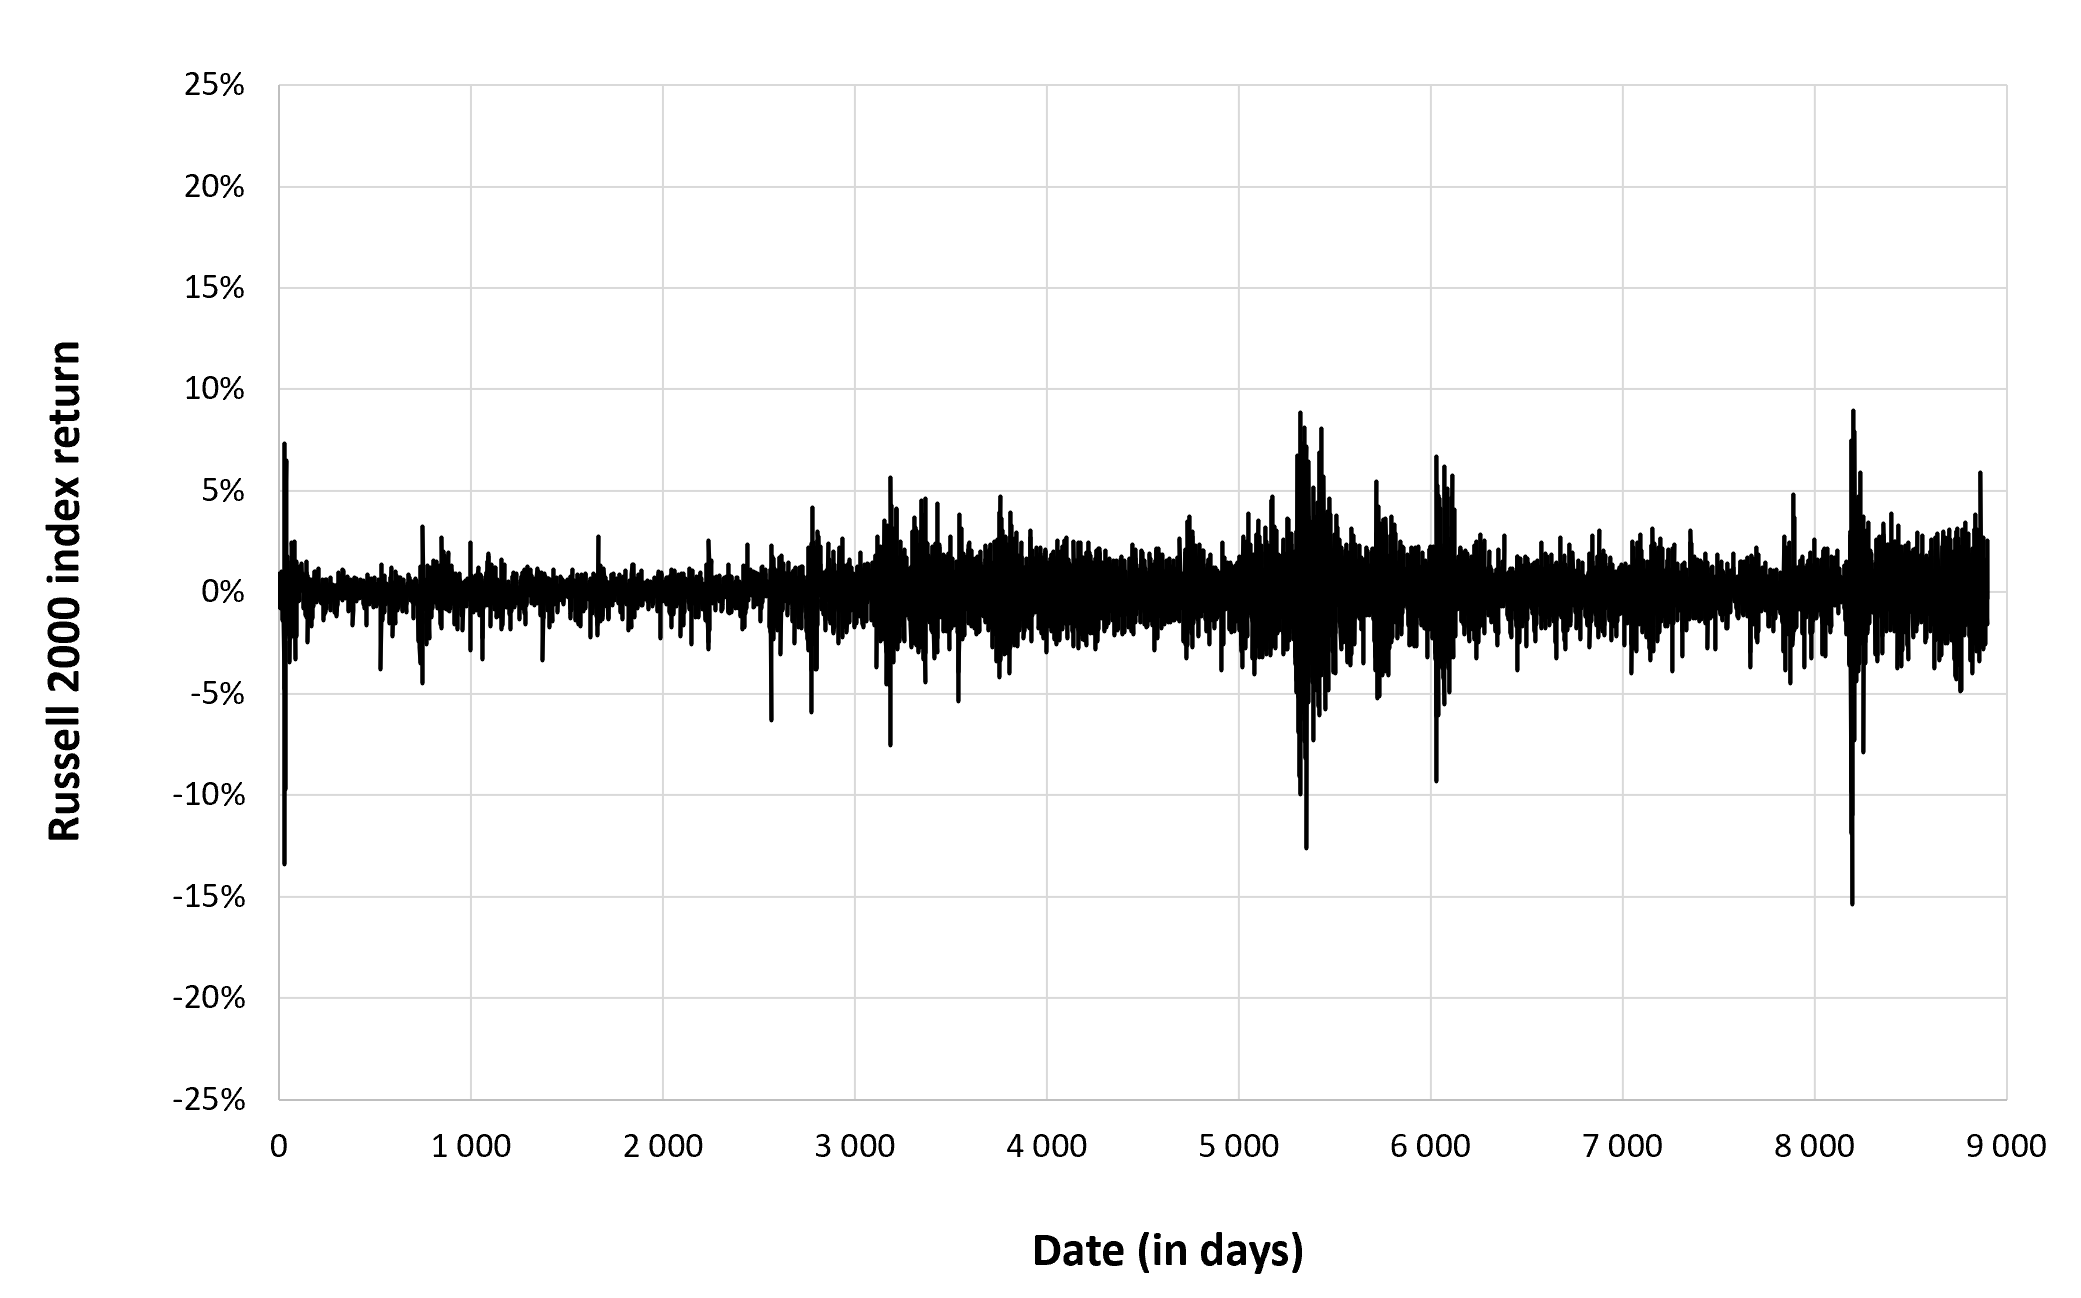
Source: computation by the author (data: Yahoo! Finance website).
Summary statistics for the Russell 2000 index
The R program that you can download above also allows you to compute summary statistics about the returns of the Russell 2000 index.
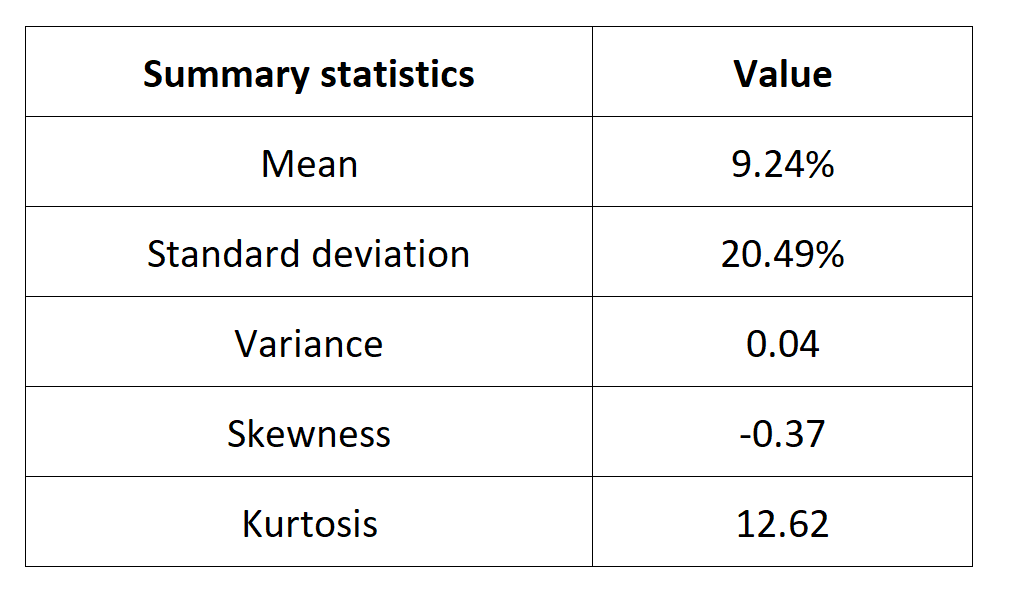
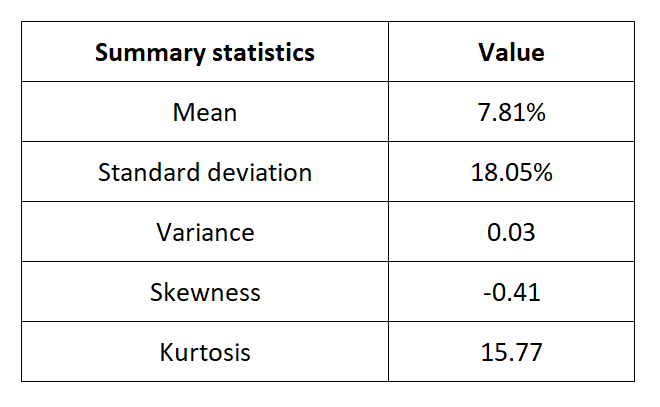
Table 4 below presents the following summary statistics estimated for the Russell 2000 index:
- The mean
- The standard deviation (the squared root of the variance)
- The skewness
- The kurtosis.
The mean, the standard deviation / variance, the skewness, and the kurtosis refer to the first, second, third and fourth moments of statistical distribution of returns respectively.
Table 4. Summary statistics for the Russell 2000 index.
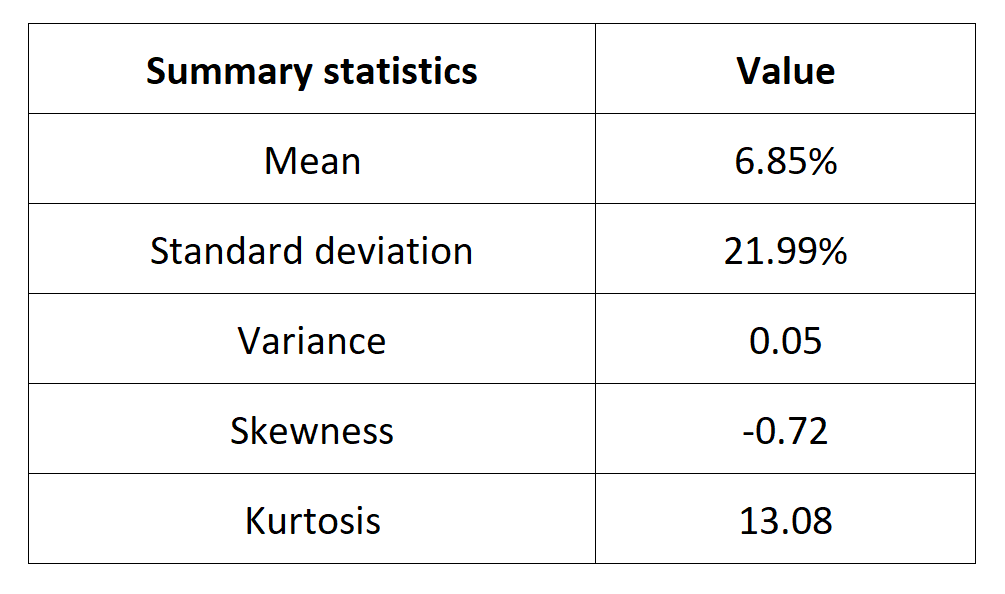
Source: computation by the author (data: Yahoo! Finance website).
Statistical distribution of the Russell 2000 index returns
Historical distribution
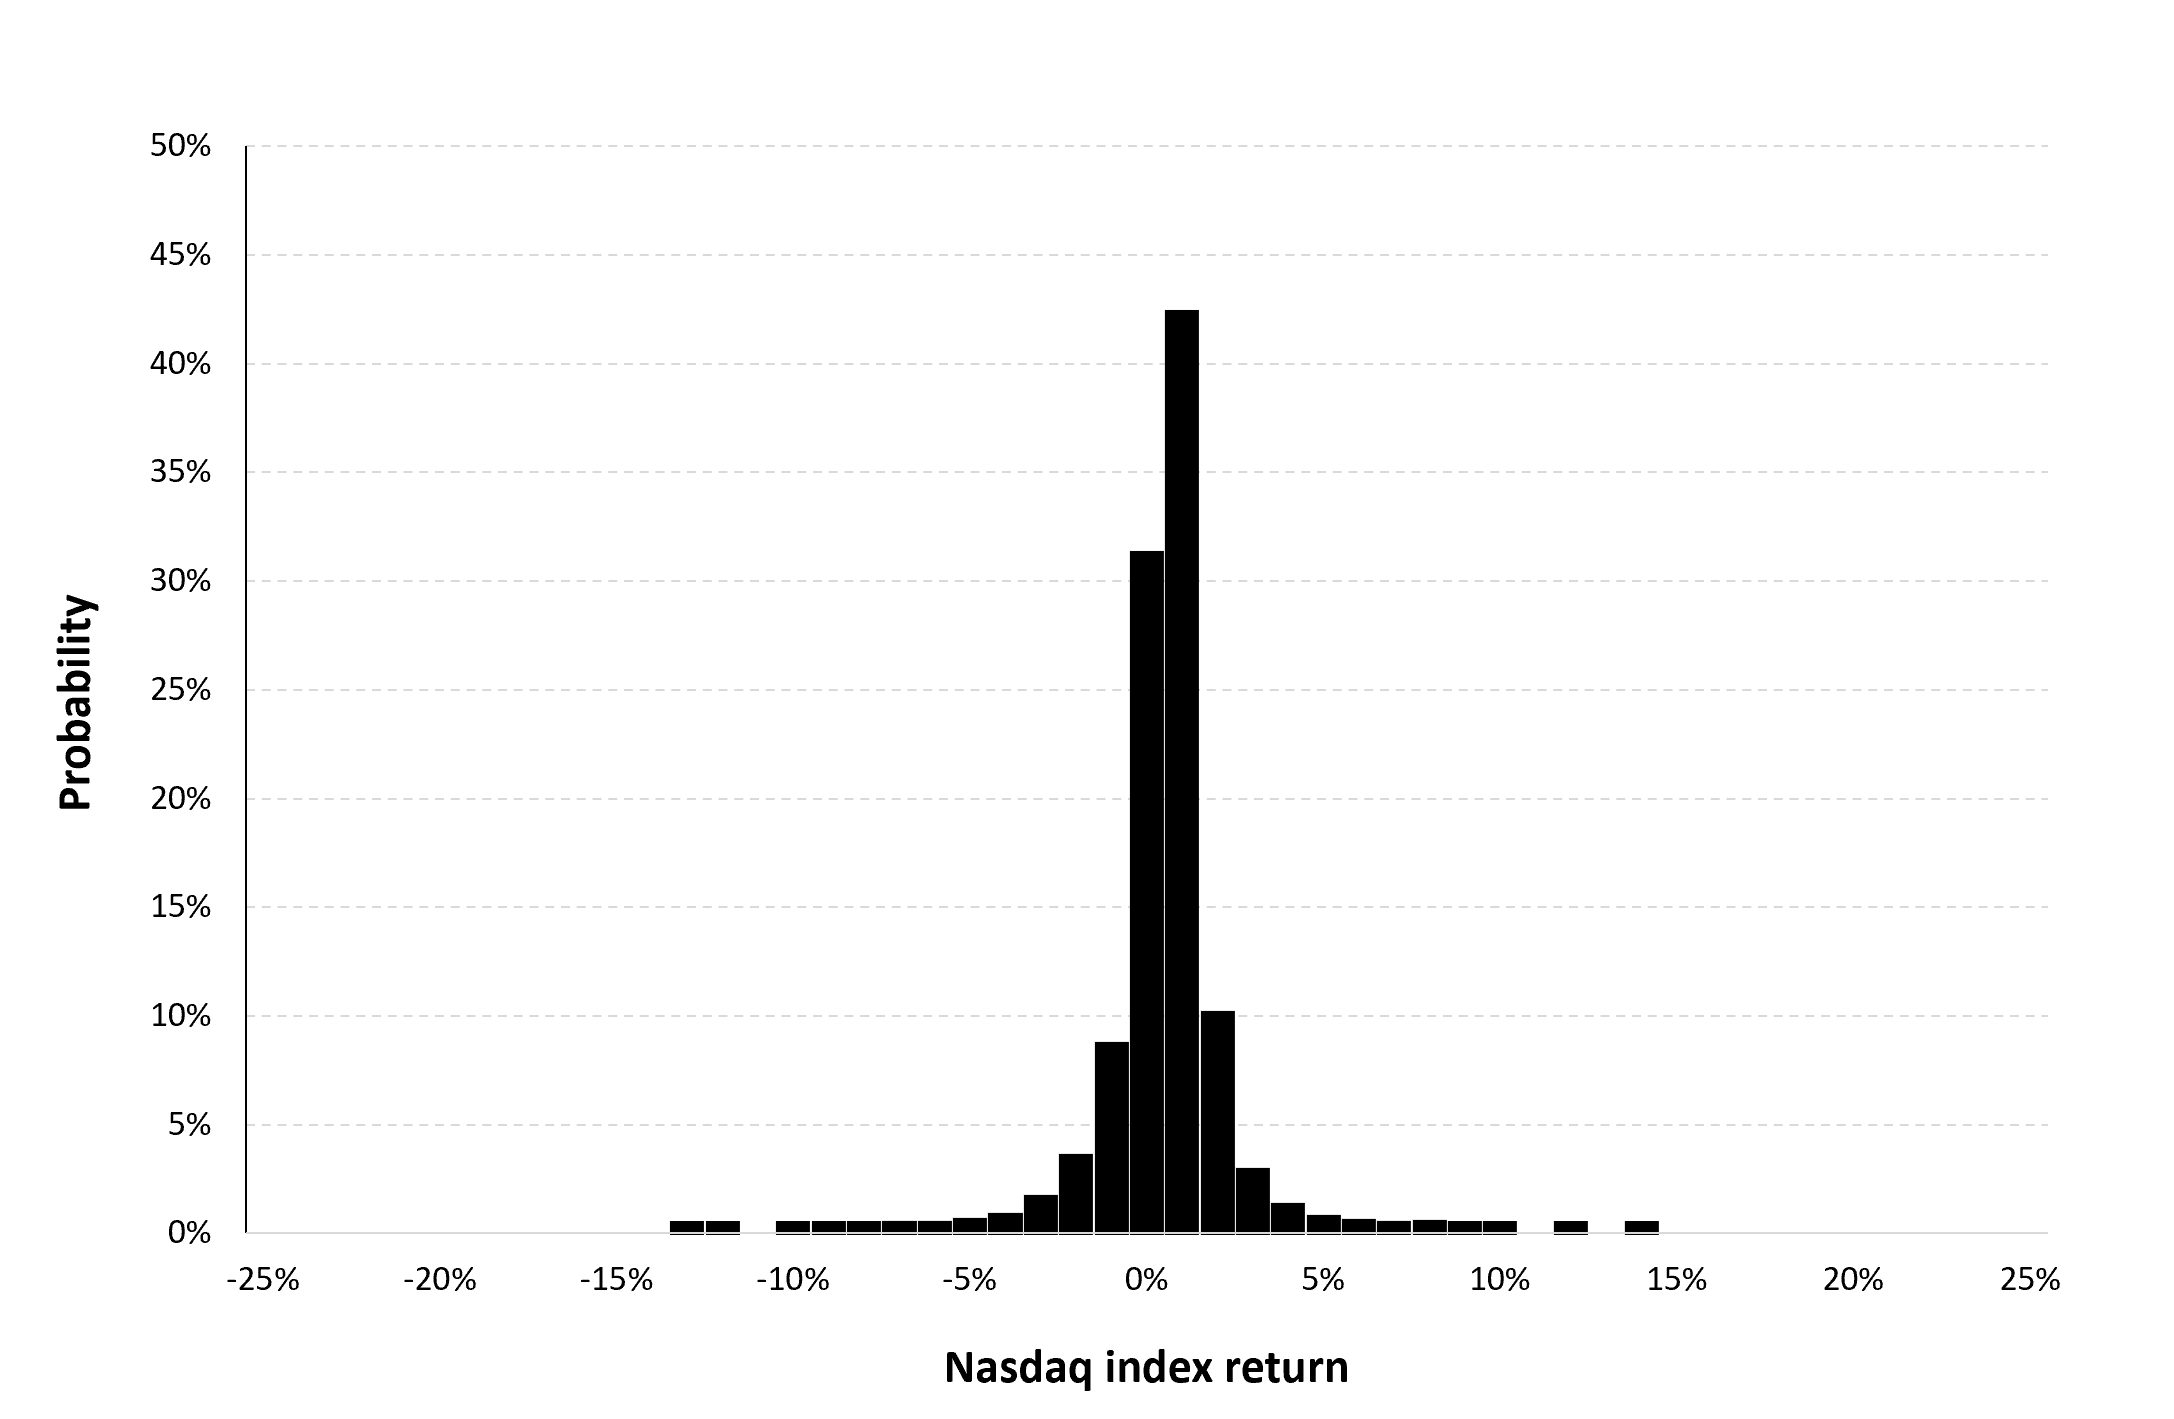
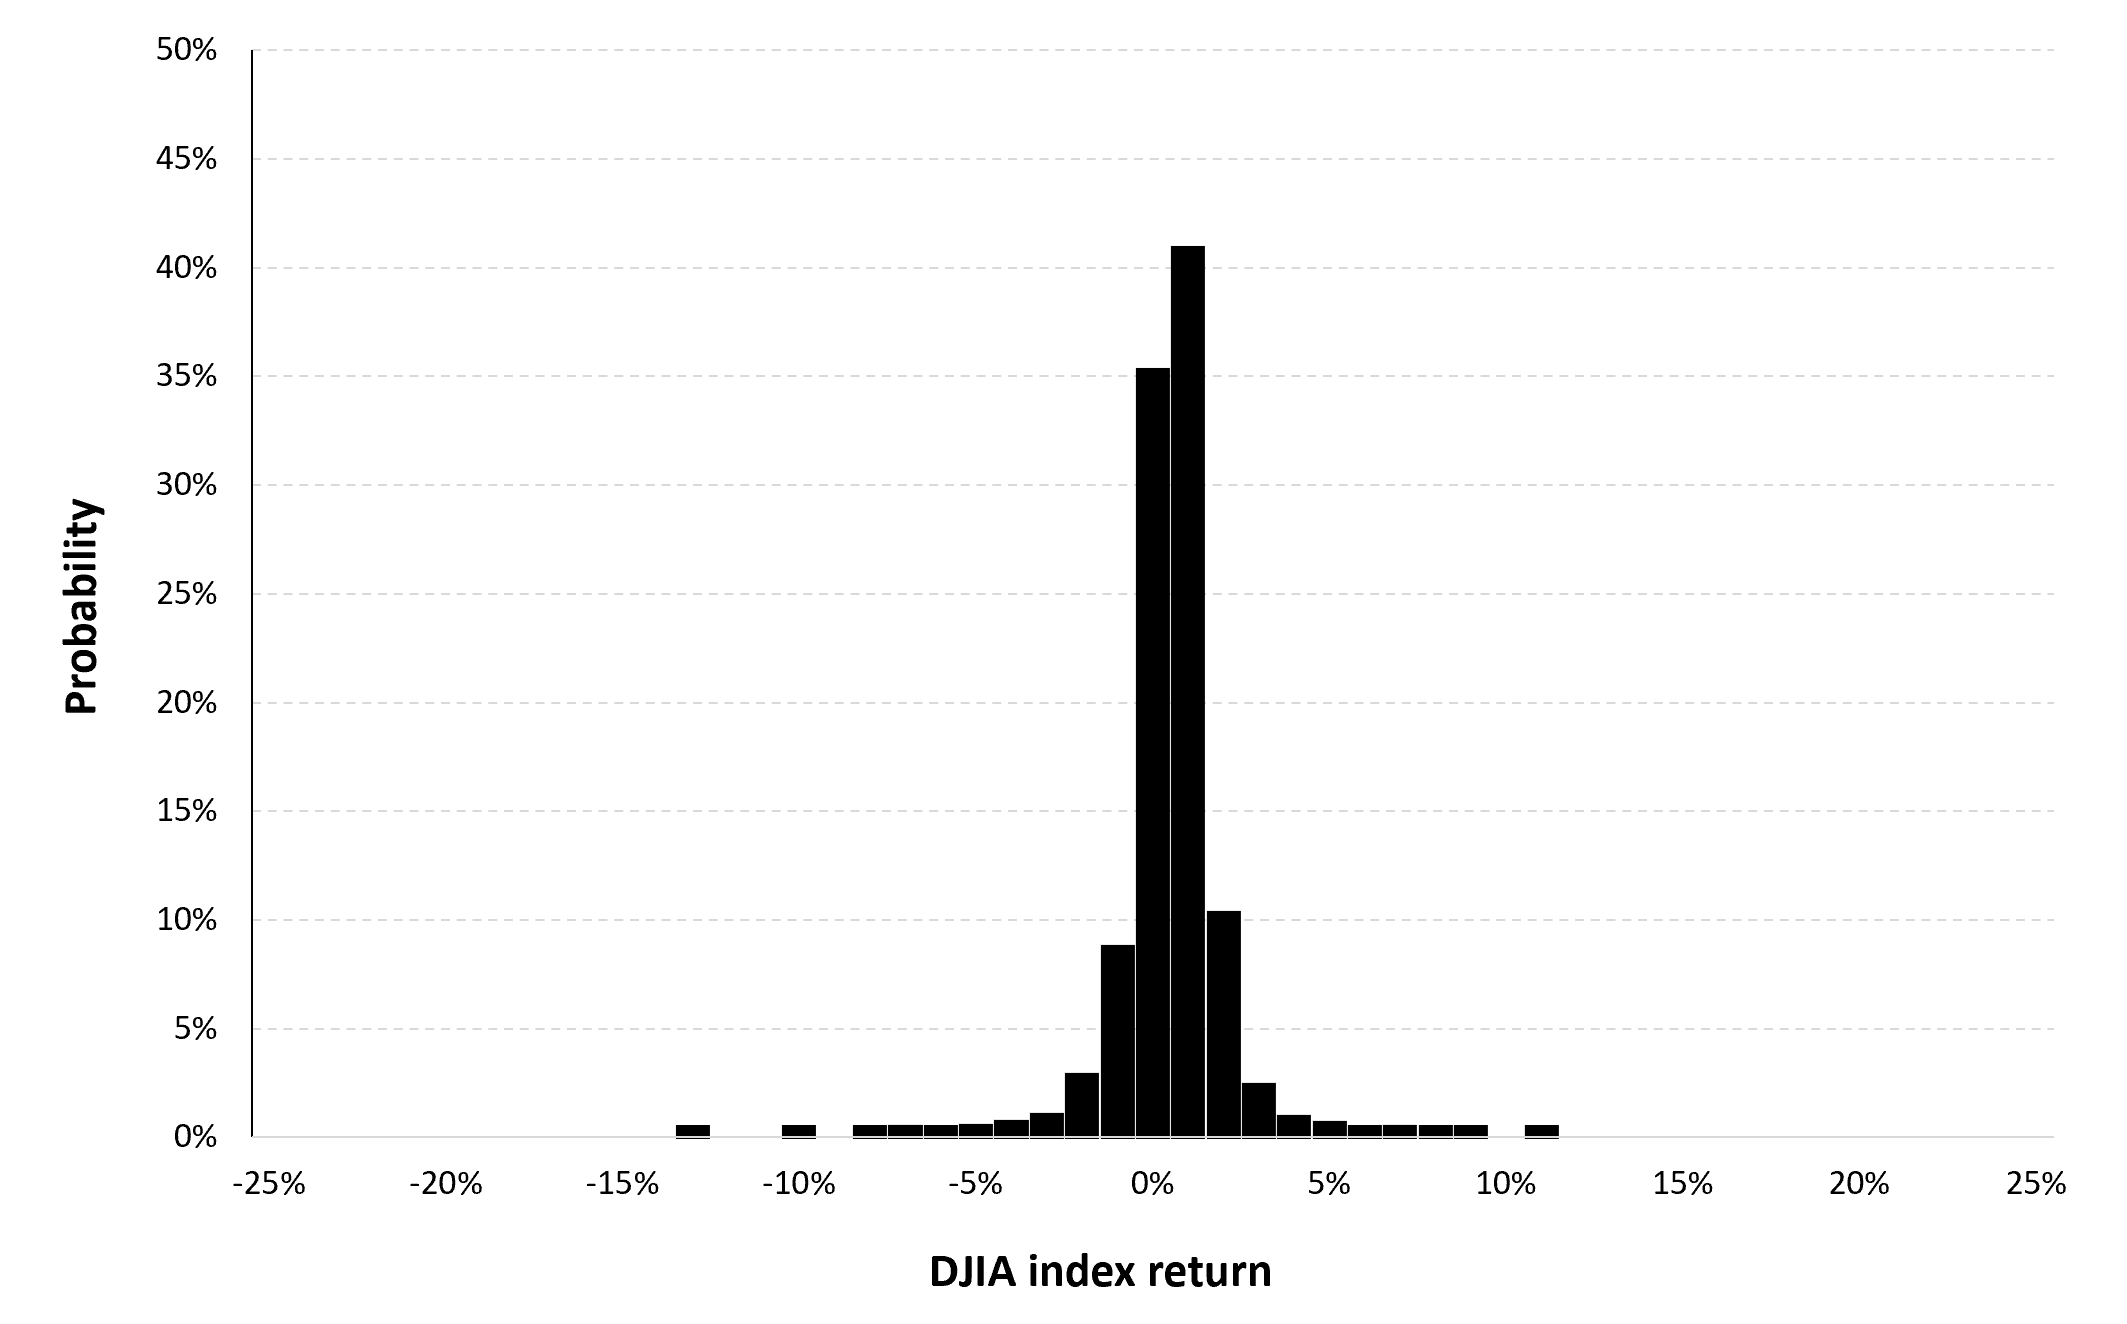
Figure 3 represents the historical distribution of the Russell 2000 index daily returns for the period from September 10, 1987 to December 30, 2022.
Figure 3. Historical distribution of the Russell 2000 index returns.
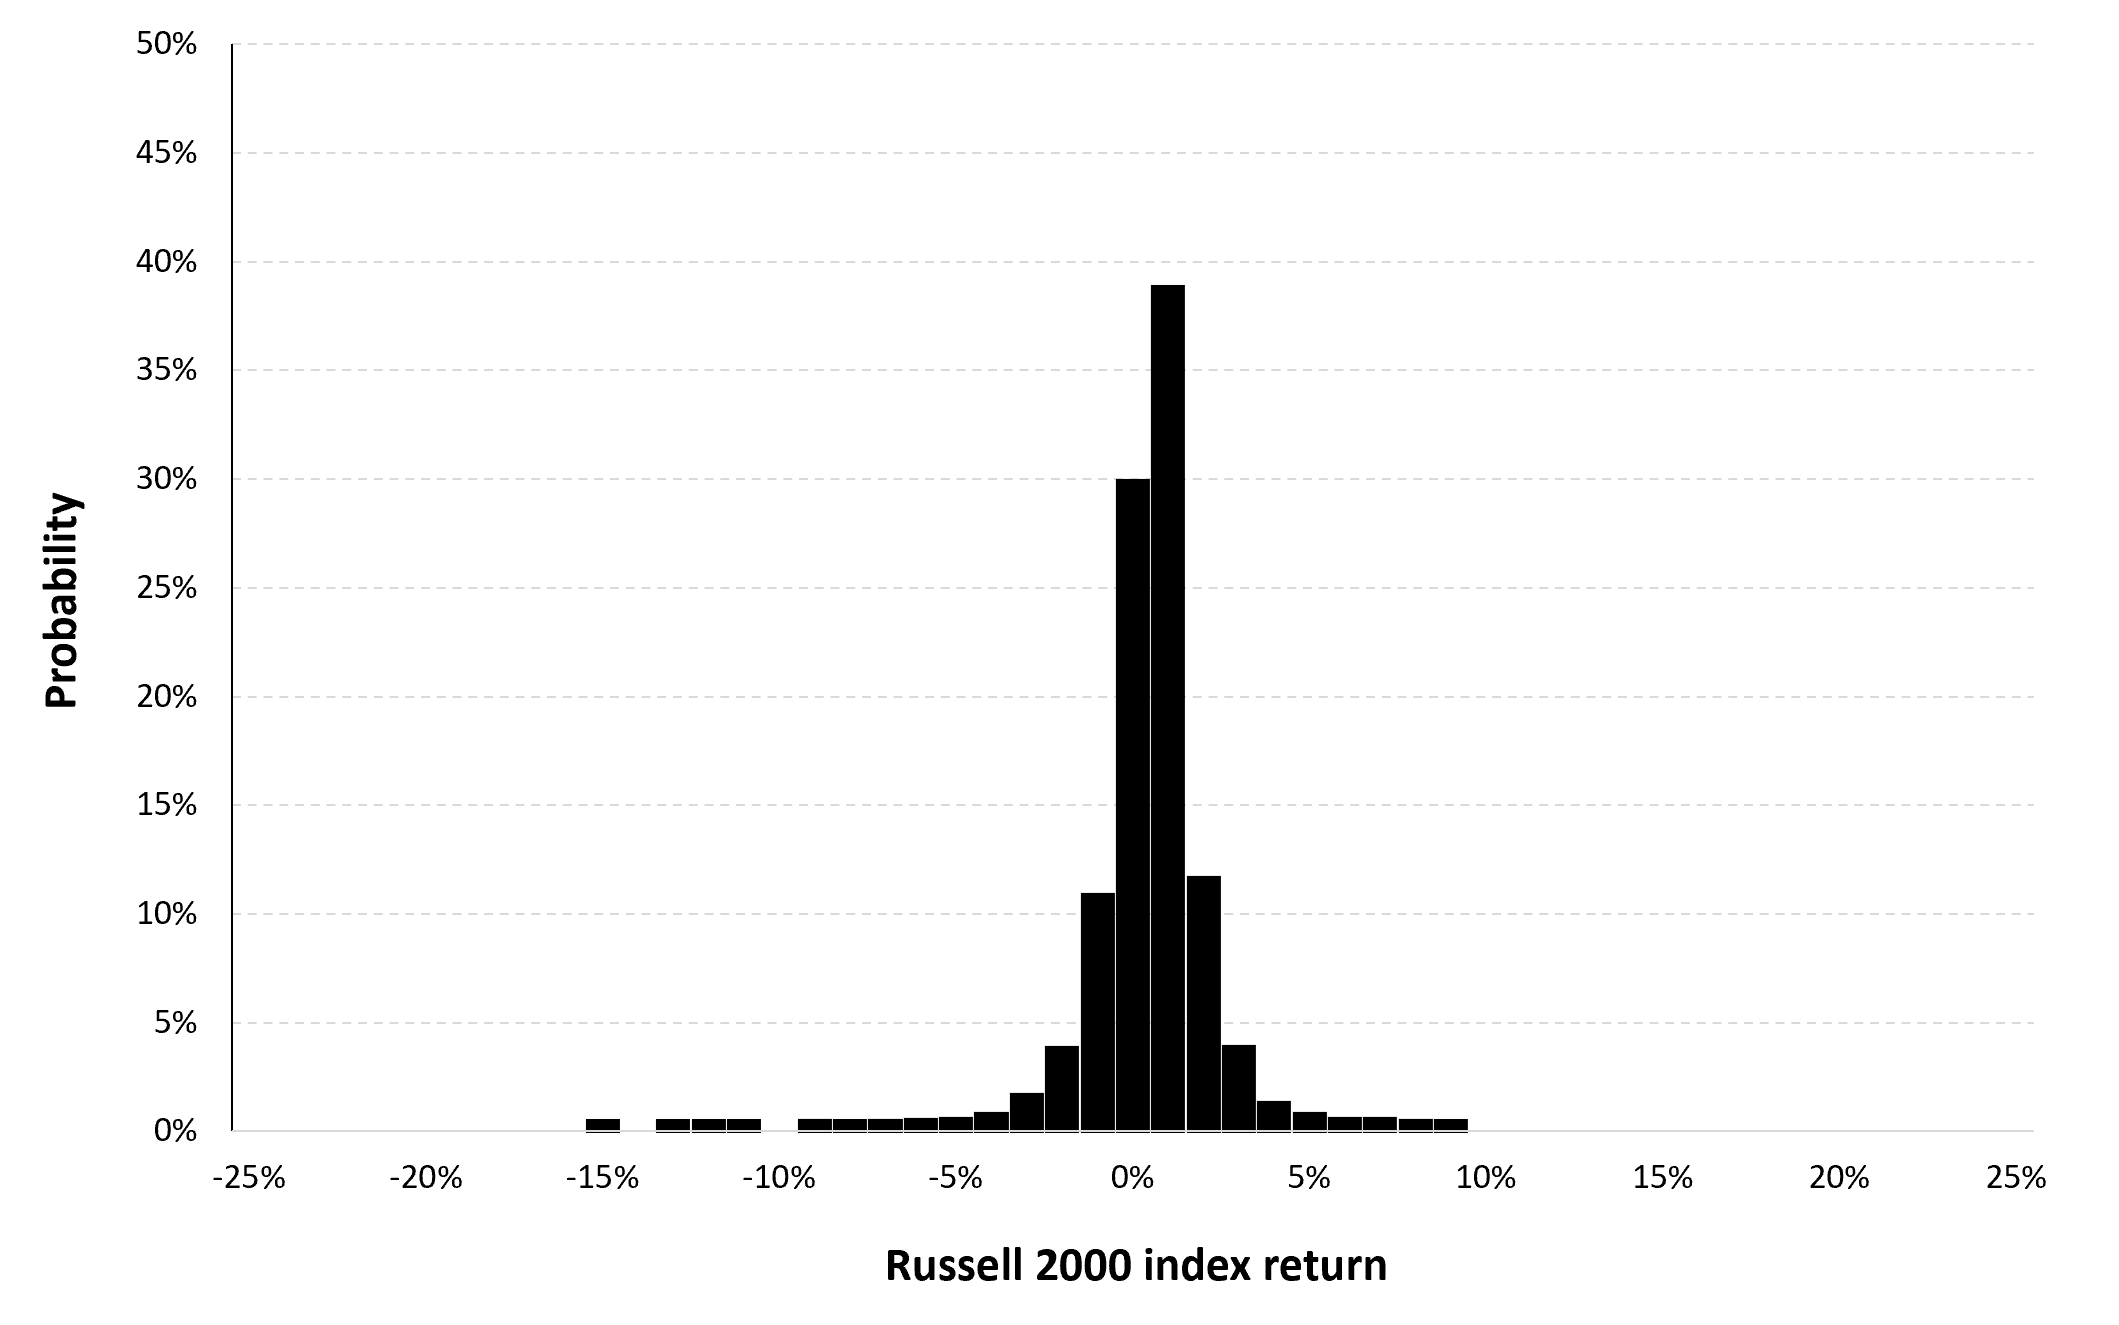
Source: computation by the author (data: Yahoo! Finance website).
Gaussian distribution
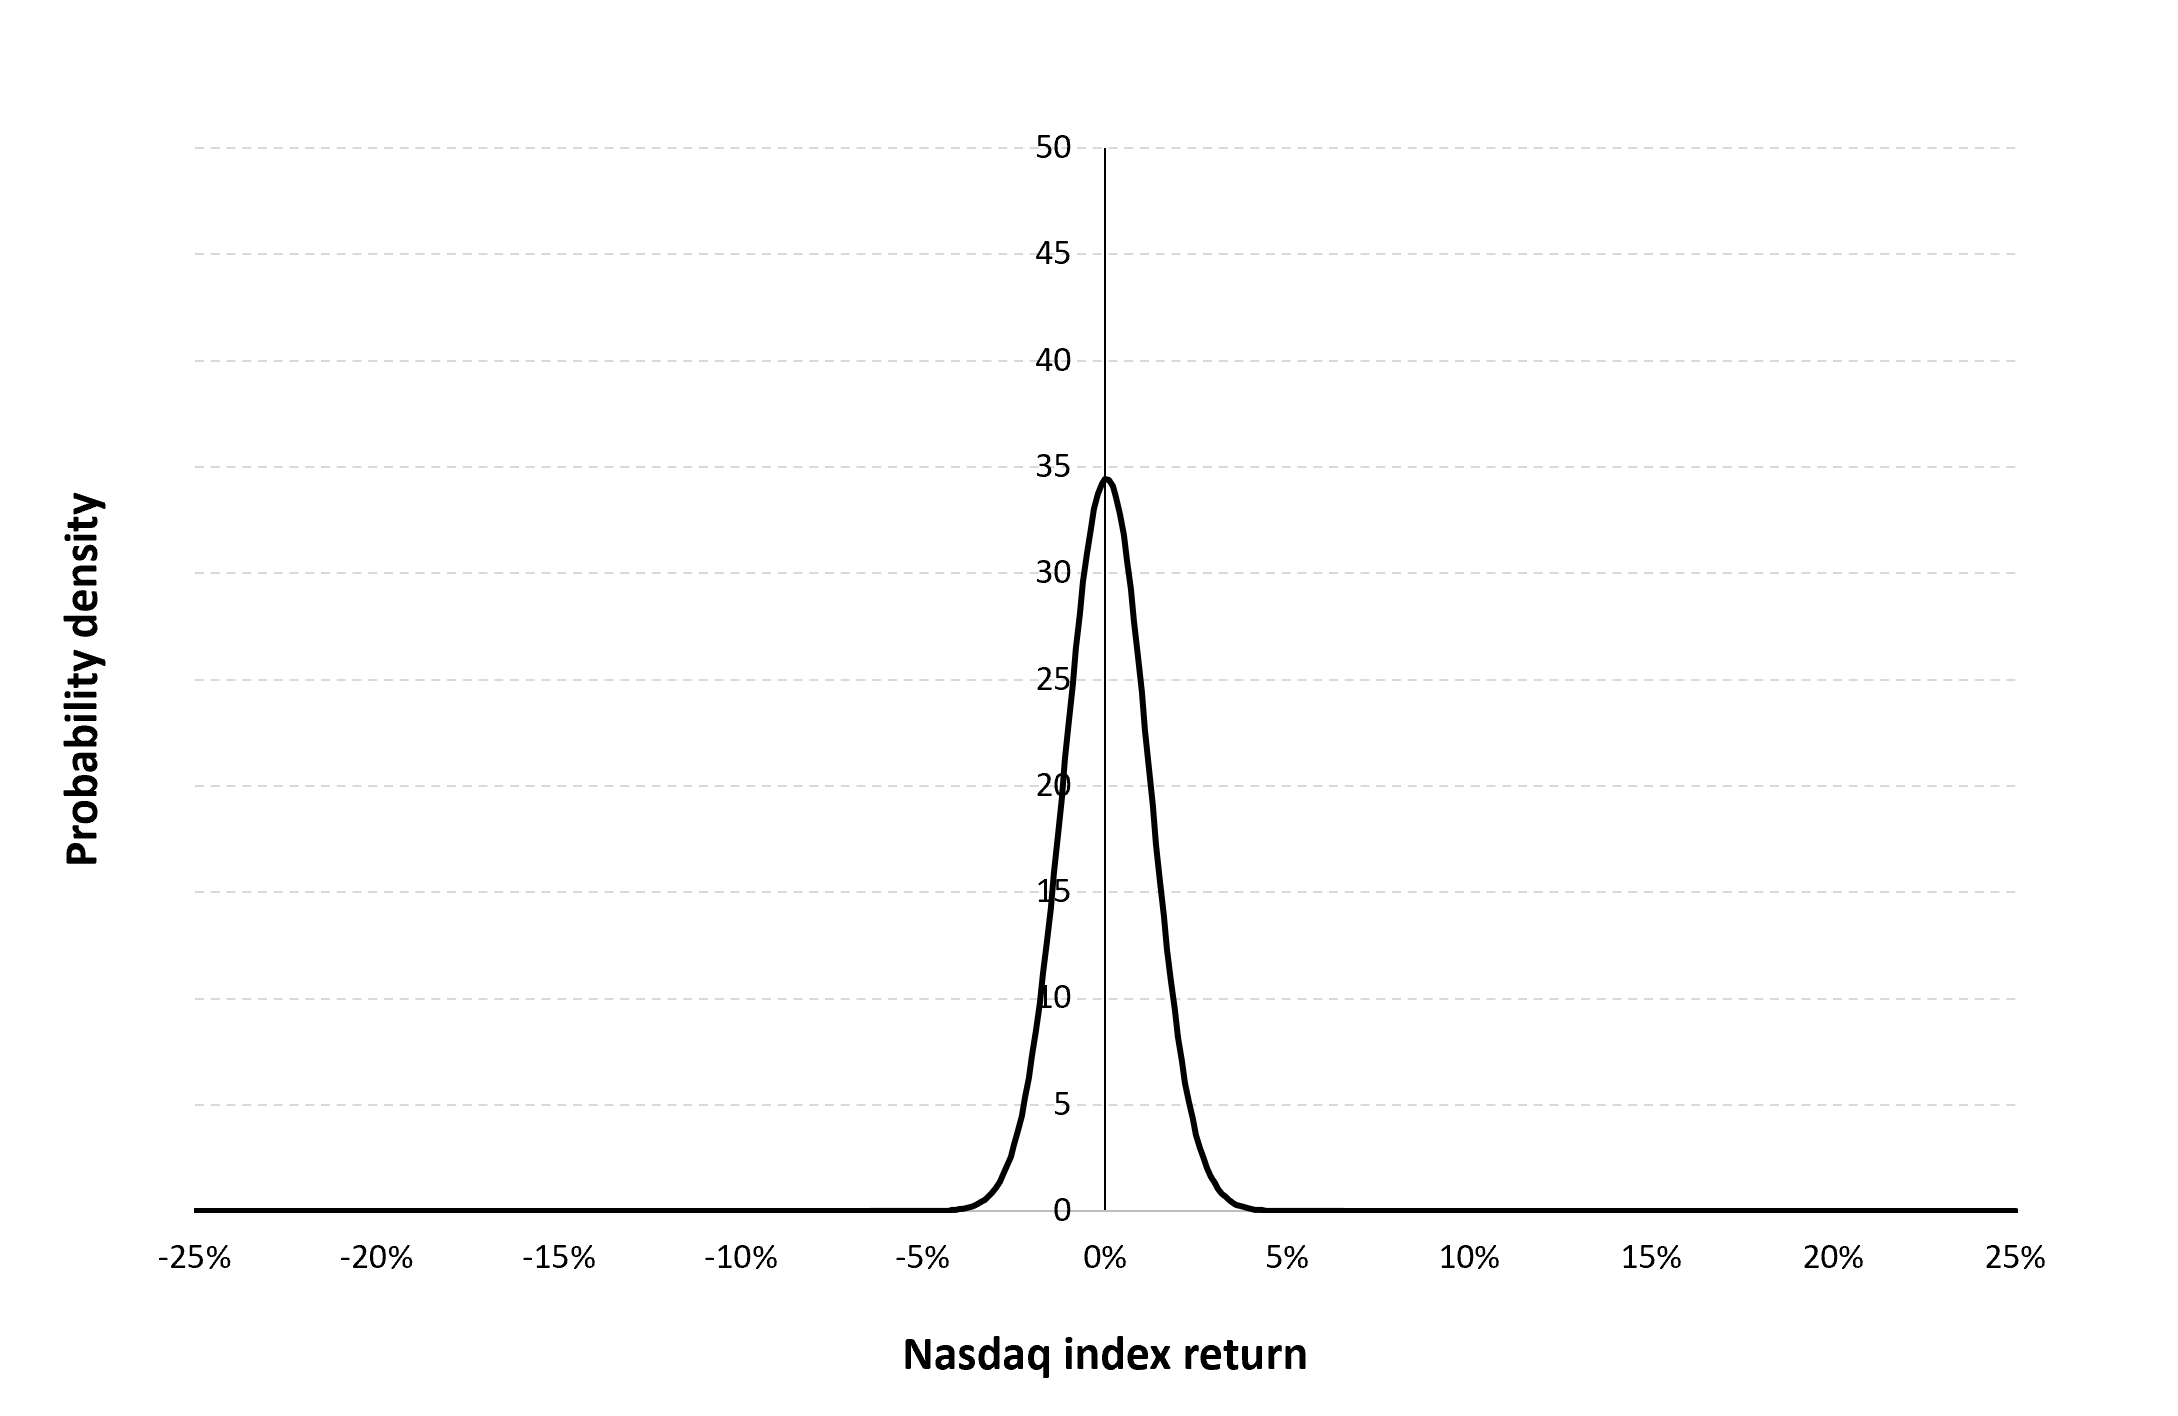
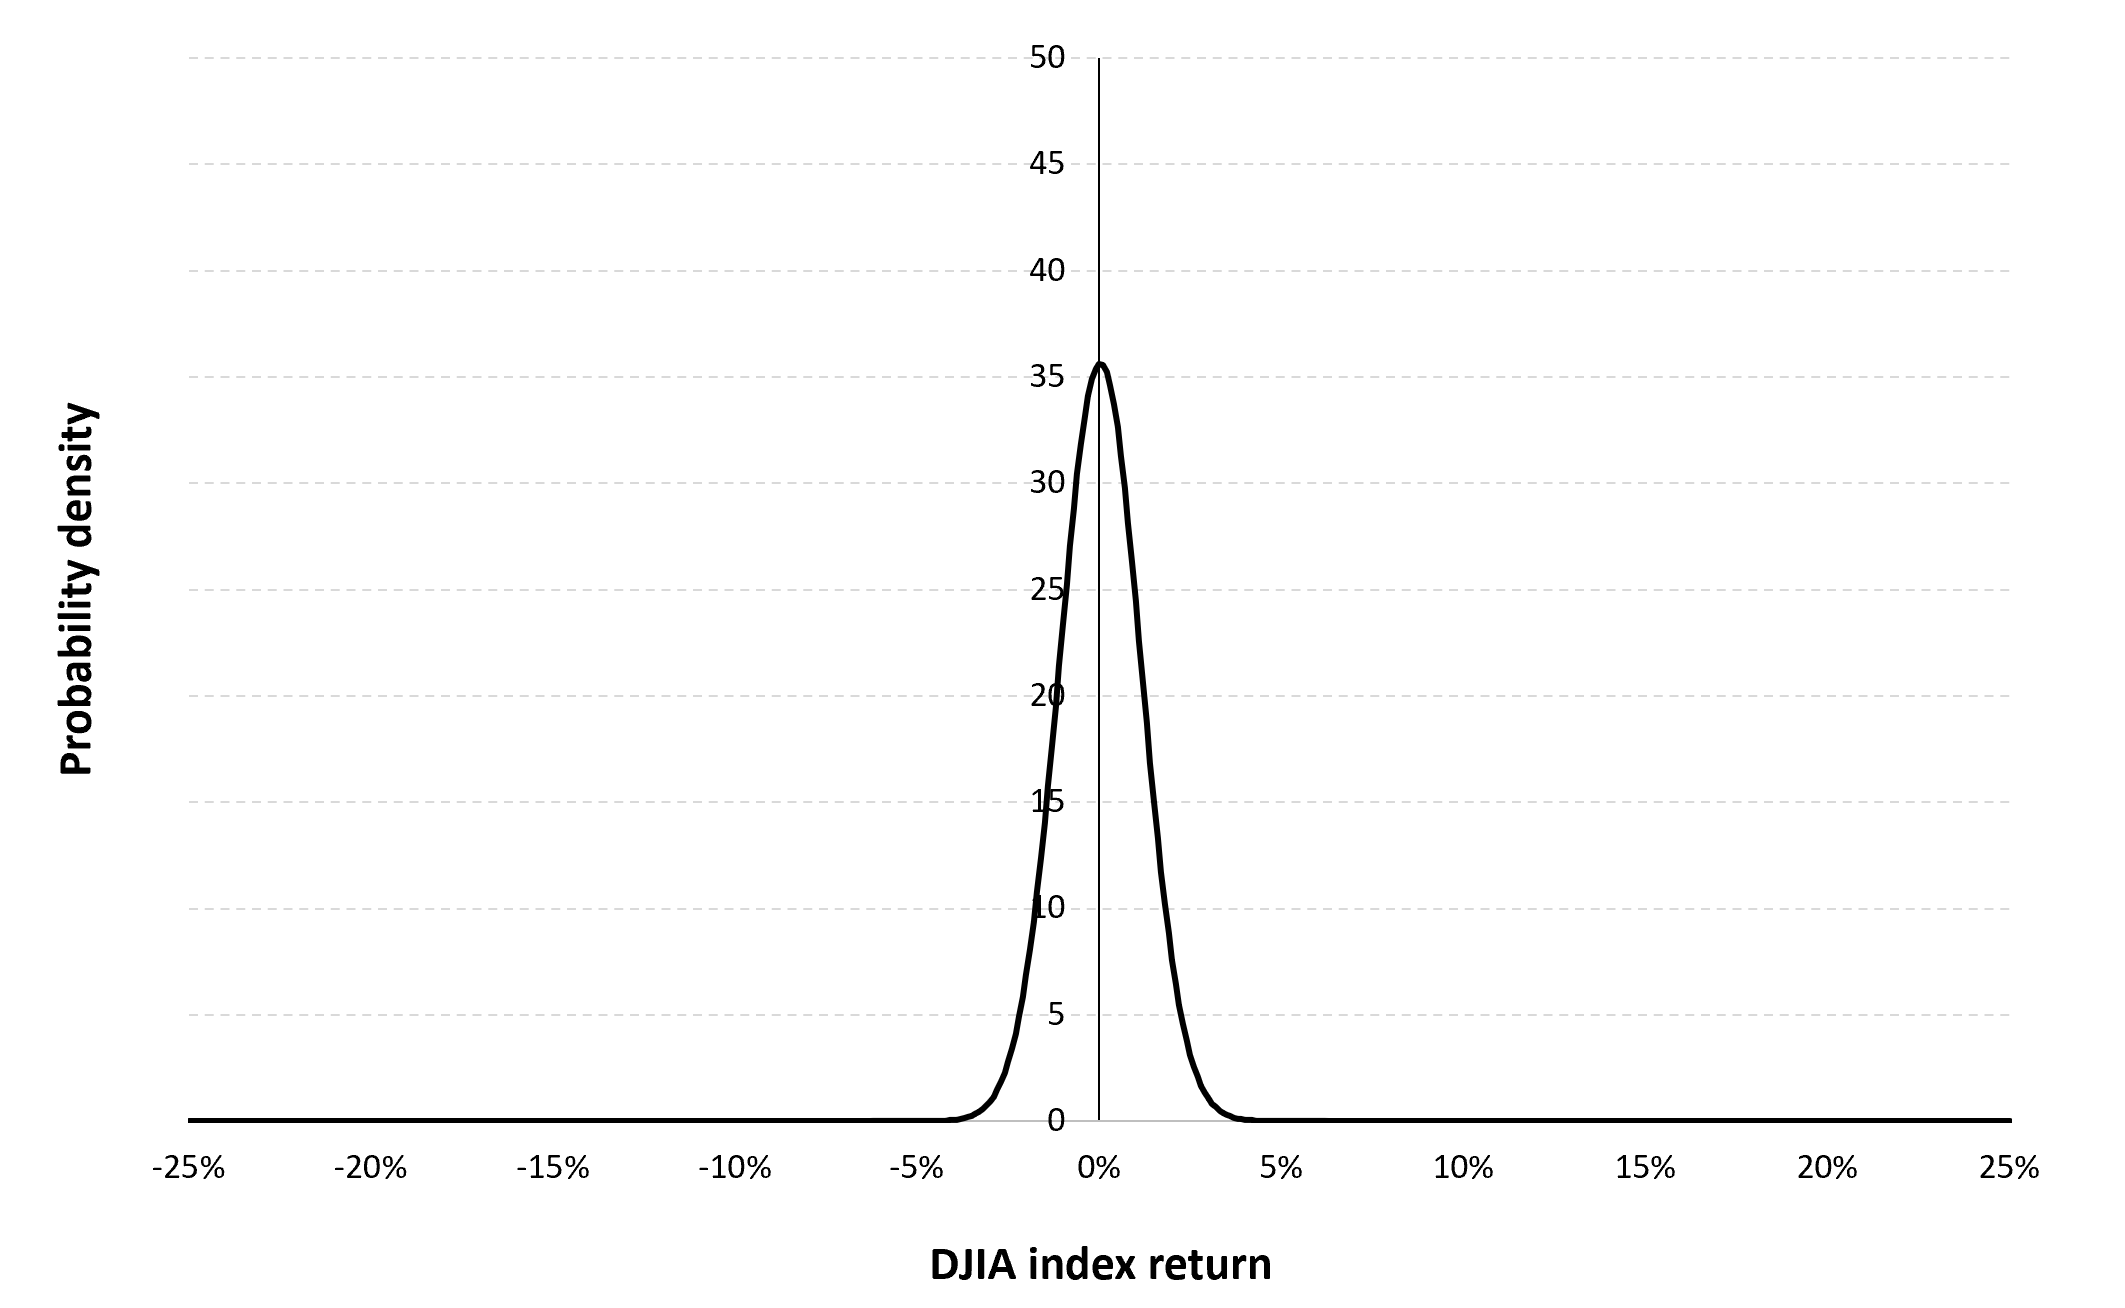
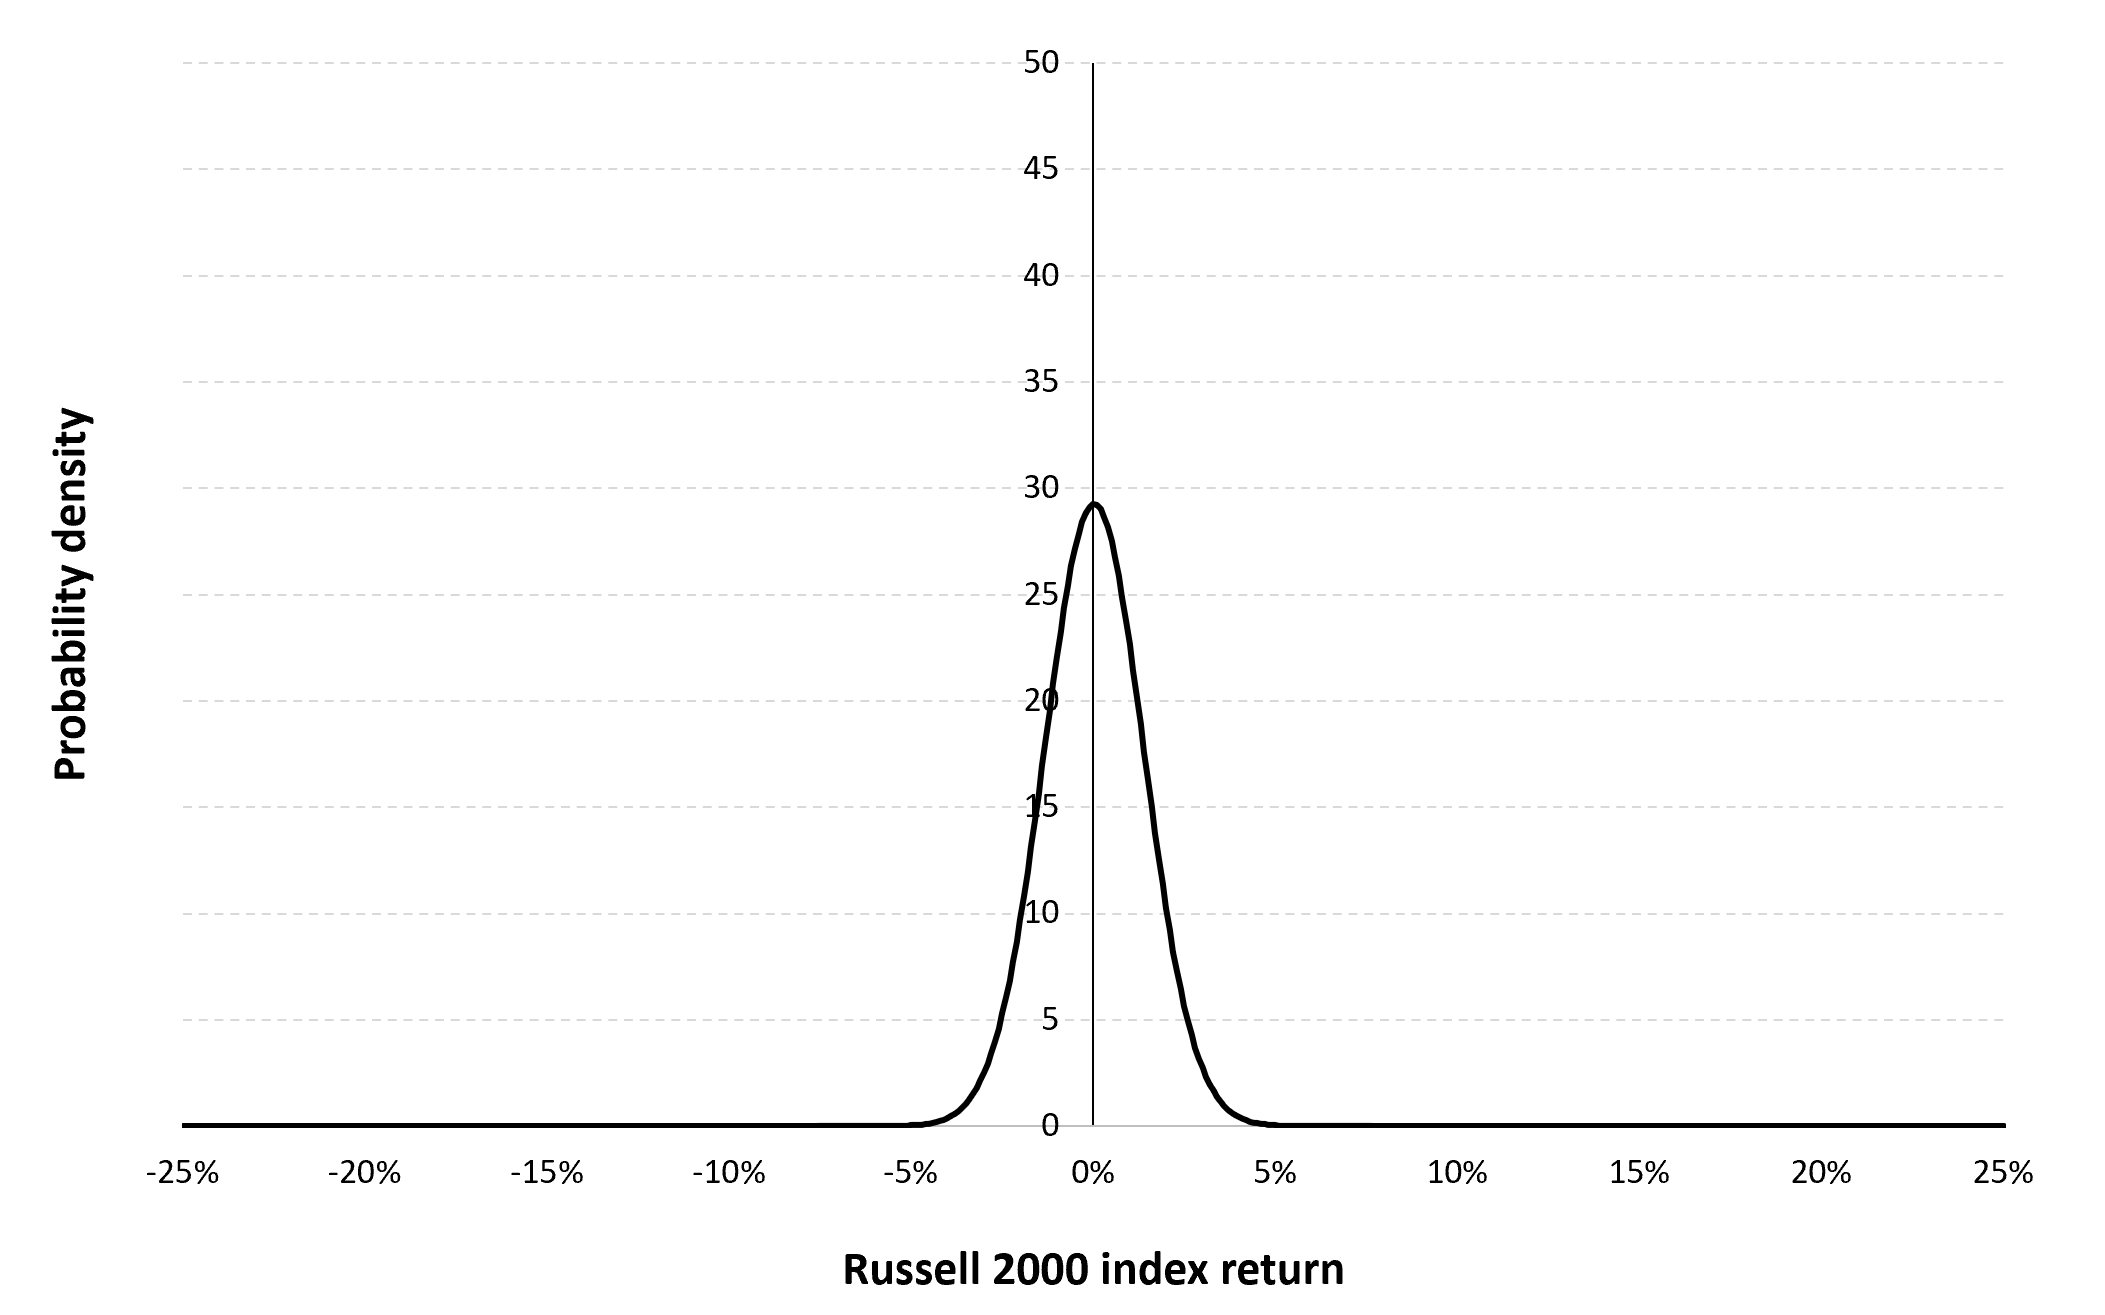
The Gaussian distribution (also called the normal distribution) is a parametric distribution with two parameters: the mean and the standard deviation of returns. We estimated these two parameters over the period from September 10, 1987 to December 30, 2022. The mean of daily returns is equal to 0.02% and the standard deviation of daily returns is equal to 1.20% (or equivalently 5.88% for the annual mean and 19.38% for the annual standard deviation as shown in Table 3 above).
Figure 4 below represents the Gaussian distribution of the Russell 2000 index daily returns with parameters estimated over the period from September 10, 1987 to December 30, 2022.
Figure 4. Gaussian distribution of the Russell 2000 index returns.
Source: computation by the author (data: Yahoo! Finance website).
Risk measures of the Russell 2000 index returns
The R program that you can download above also allows you to compute risk measures about the returns of the Russell 2000 index.
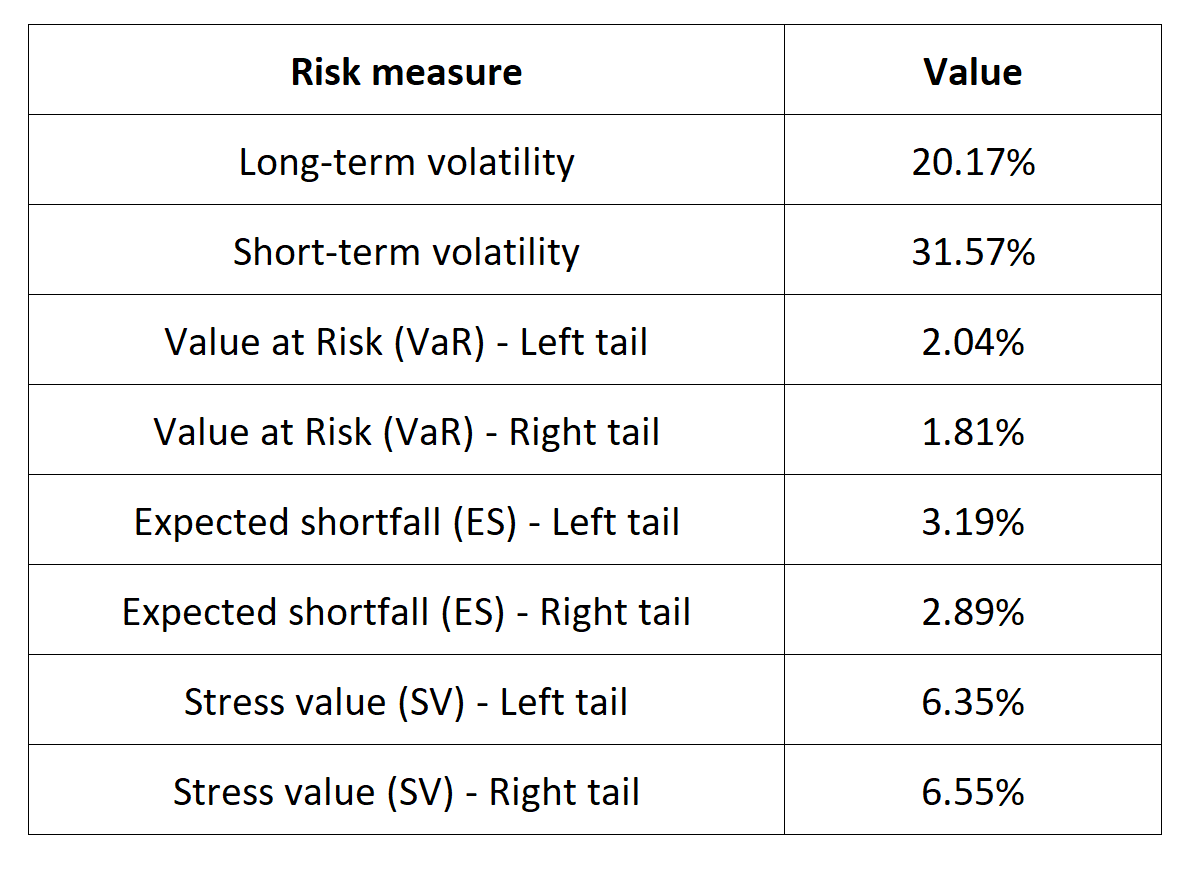
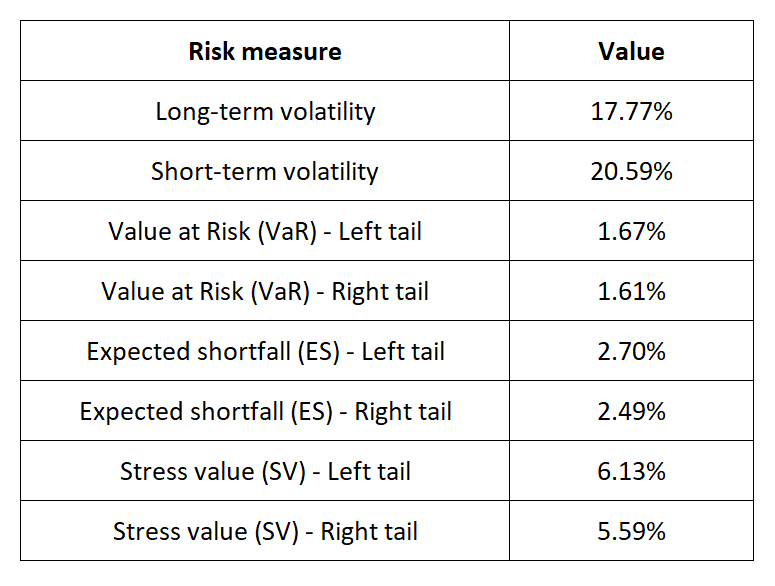
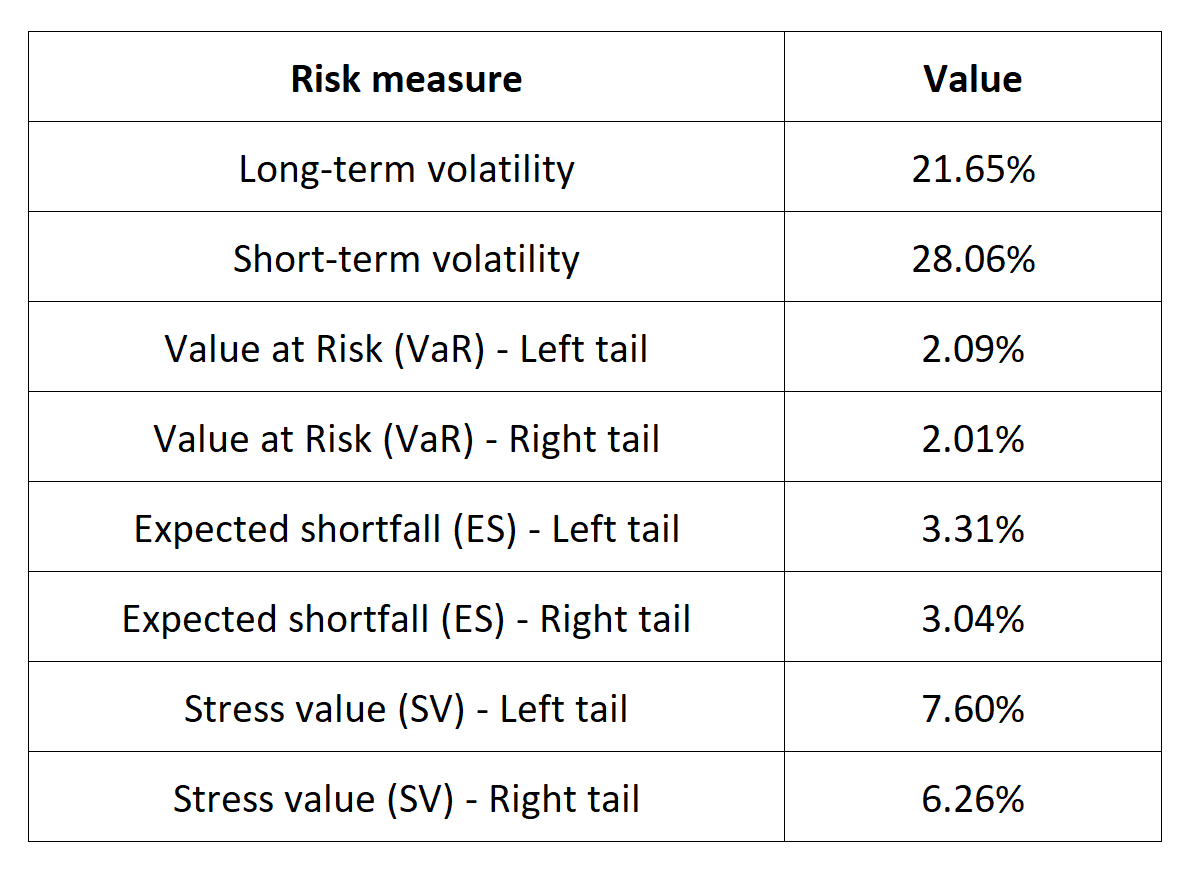
Table 5 below presents the following risk measures estimated for the Russell 2000 index:
- The long-term volatility (the unconditional standard deviation estimated over the entire period)
- The short-term volatility (the standard deviation estimated over the last three months)
- The Value at Risk (VaR) for the left tail (the 5% quantile of the historical distribution)
- The Value at Risk (VaR) for the right tail (the 95% quantile of the historical distribution)
- The Expected Shortfall (ES) for the left tail (the average loss over the 5% quantile of the historical distribution)
- The Expected Shortfall (ES) for the right tail (the average loss over the 95% quantile of the historical distribution)
- The Stress Value (SV) for the left tail (the 1% quantile of the tail distribution estimated with a Generalized Pareto distribution)
- The Stress Value (SV) for the right tail (the 99% quantile of the tail distribution estimated with a Generalized Pareto distribution)
Table 5. Risk measures for the Russell 2000 index.
Source: computation by the author (data: Yahoo! Finance website).
The volatility is a global measure of risk as it considers all the returns. The Value at Risk (VaR), Expected Shortfall (ES) and Stress Value (SV) are local measures of risk as they focus on the tails of the distribution. The study of the left tail is relevant for an investor holding a long position in the Russell 2000index while the study of the right tail is relevant for an investor holding a short position in the Russell 2000 index.
Why should I be interested in this post?
For a number of reasons, management students (as future managers and individual investors) should learn about the Russell 2000 index. The performance of 2000 small-cap American companies is tracked by this stock market index, which is first and foremost well-known and respected. Gaining a deeper understanding of the US small-cap stock market and the businesses that fuel its expansion requires knowledge of the Russell 2000 index. Individual investors can assess the performance of their own investments and those of their organization by comprehending the Russell 2000 index and its components. Last but not least, a lot of businesses base their mutual funds and exchange-traded funds (ETFs) on the Russell 2000 index which can considered as interesting assets to diversify a portfolio.
Related posts on the SimTrade blog
About financial indexes
▶ Nithisha CHALLA Financial indexes
▶ Nithisha CHALLA Calculation of financial indexes
▶ Nithisha CHALLA The business of financial indexes
▶ Nithisha CHALLA Float
About other US financial indexes
▶ Nithisha CHALLA The DJIA index
▶ Nithisha CHALLA The S&P 500 index
▶ Nithisha CHALLA The NASDAQ index
▶ Nithisha CHALLA The Wilshire 5000 index
About portfolio management
▶ Youssef LOURAOUI Portfolio
▶ Jayati WALIA Returns
About statistics
▶ Shengyu ZHENG Moments de la distribution
▶ Shengyu ZHENG Mesures de risques
Useful resources
Wikipedia Russell indexes
Finance Strategists Defining Russell 2000 Index
FTSE Russell The Russell 2000 Index: Small cap index of choice
Motley Fool 10 of the largest Russell 2000 companies
Academic research about risk
Longin F. (2000) From VaR to stress testing: the extreme value approach Journal of Banking and Finance, N°24, pp 1097-1130.
Longin F. (2016) Extreme events in finance: a handbook of extreme value theory and its applications Wiley Editions.
Data
Yahoo! Finance
Yahoo! Finance Data for the Russell 2000 index
About the author
The article was written in April 2023 by Nithisha CHALLA (ESSEC Business School, Grande Ecole Program – Master in Management, 2021-2023).