In this article, Nithisha CHALLA (ESSEC Business School, Grande Ecole Program – Master in Management (MiM), 2021-2024) delves into the essentials of Factiva, its features, and its applications, showcasing why it remains indispensable for professionals and academics alike working in business and finance.
Introduction
In the fast-paced world of business and finance, access to accurate, reliable, and up-to-date information is paramount. Factiva, a subscription-based database owned by Dow Jones & Company, is a cornerstone for researchers, financial analysts, and business professionals seeking high-quality data for decision-making.
The History of Factiva
Factiva was launched in 1999 as a joint venture between Dow Jones & Company and Reuters, two industry titans in financial news and information services. The aim was to create a unified platform catering to the growing need for consolidated global news and business data access. By integrating Dow Jones’s deep archives and Reuters’ real-time data capabilities, Factiva emerged as a pioneering solution for professionals in any sector, especially finance.
Logo of Factiva.
![]()
Source: the company.
Factiva is a premier business intelligence platform offering access to a vast array of global content, including news, company information, market data, and industry insights. It integrates thousands of sources from over 200 countries in more than 30 languages. These sources include major newspapers, trade journals, industry publications, and multimedia content.
In 2006, Dow Jones acquired full ownership of Factiva, streamlining its integration with other Dow Jones products, including The Wall Street Journal. Over the years, Factiva has evolved into a sophisticated tool incorporating artificial intelligence (AI) and machine learning for advanced data analytics, thus staying ahead in a competitive information services market.
Key Features
Certain key features of Factiva make it very useful as a database such as its Extensive Content Coverage, Search and Filter Options, Data Analytics and Visualization, Company Profiles, and Industry Reports.
As an example, the picture below presents the news about Apple in the Factiva Interface.
Factiva Interface
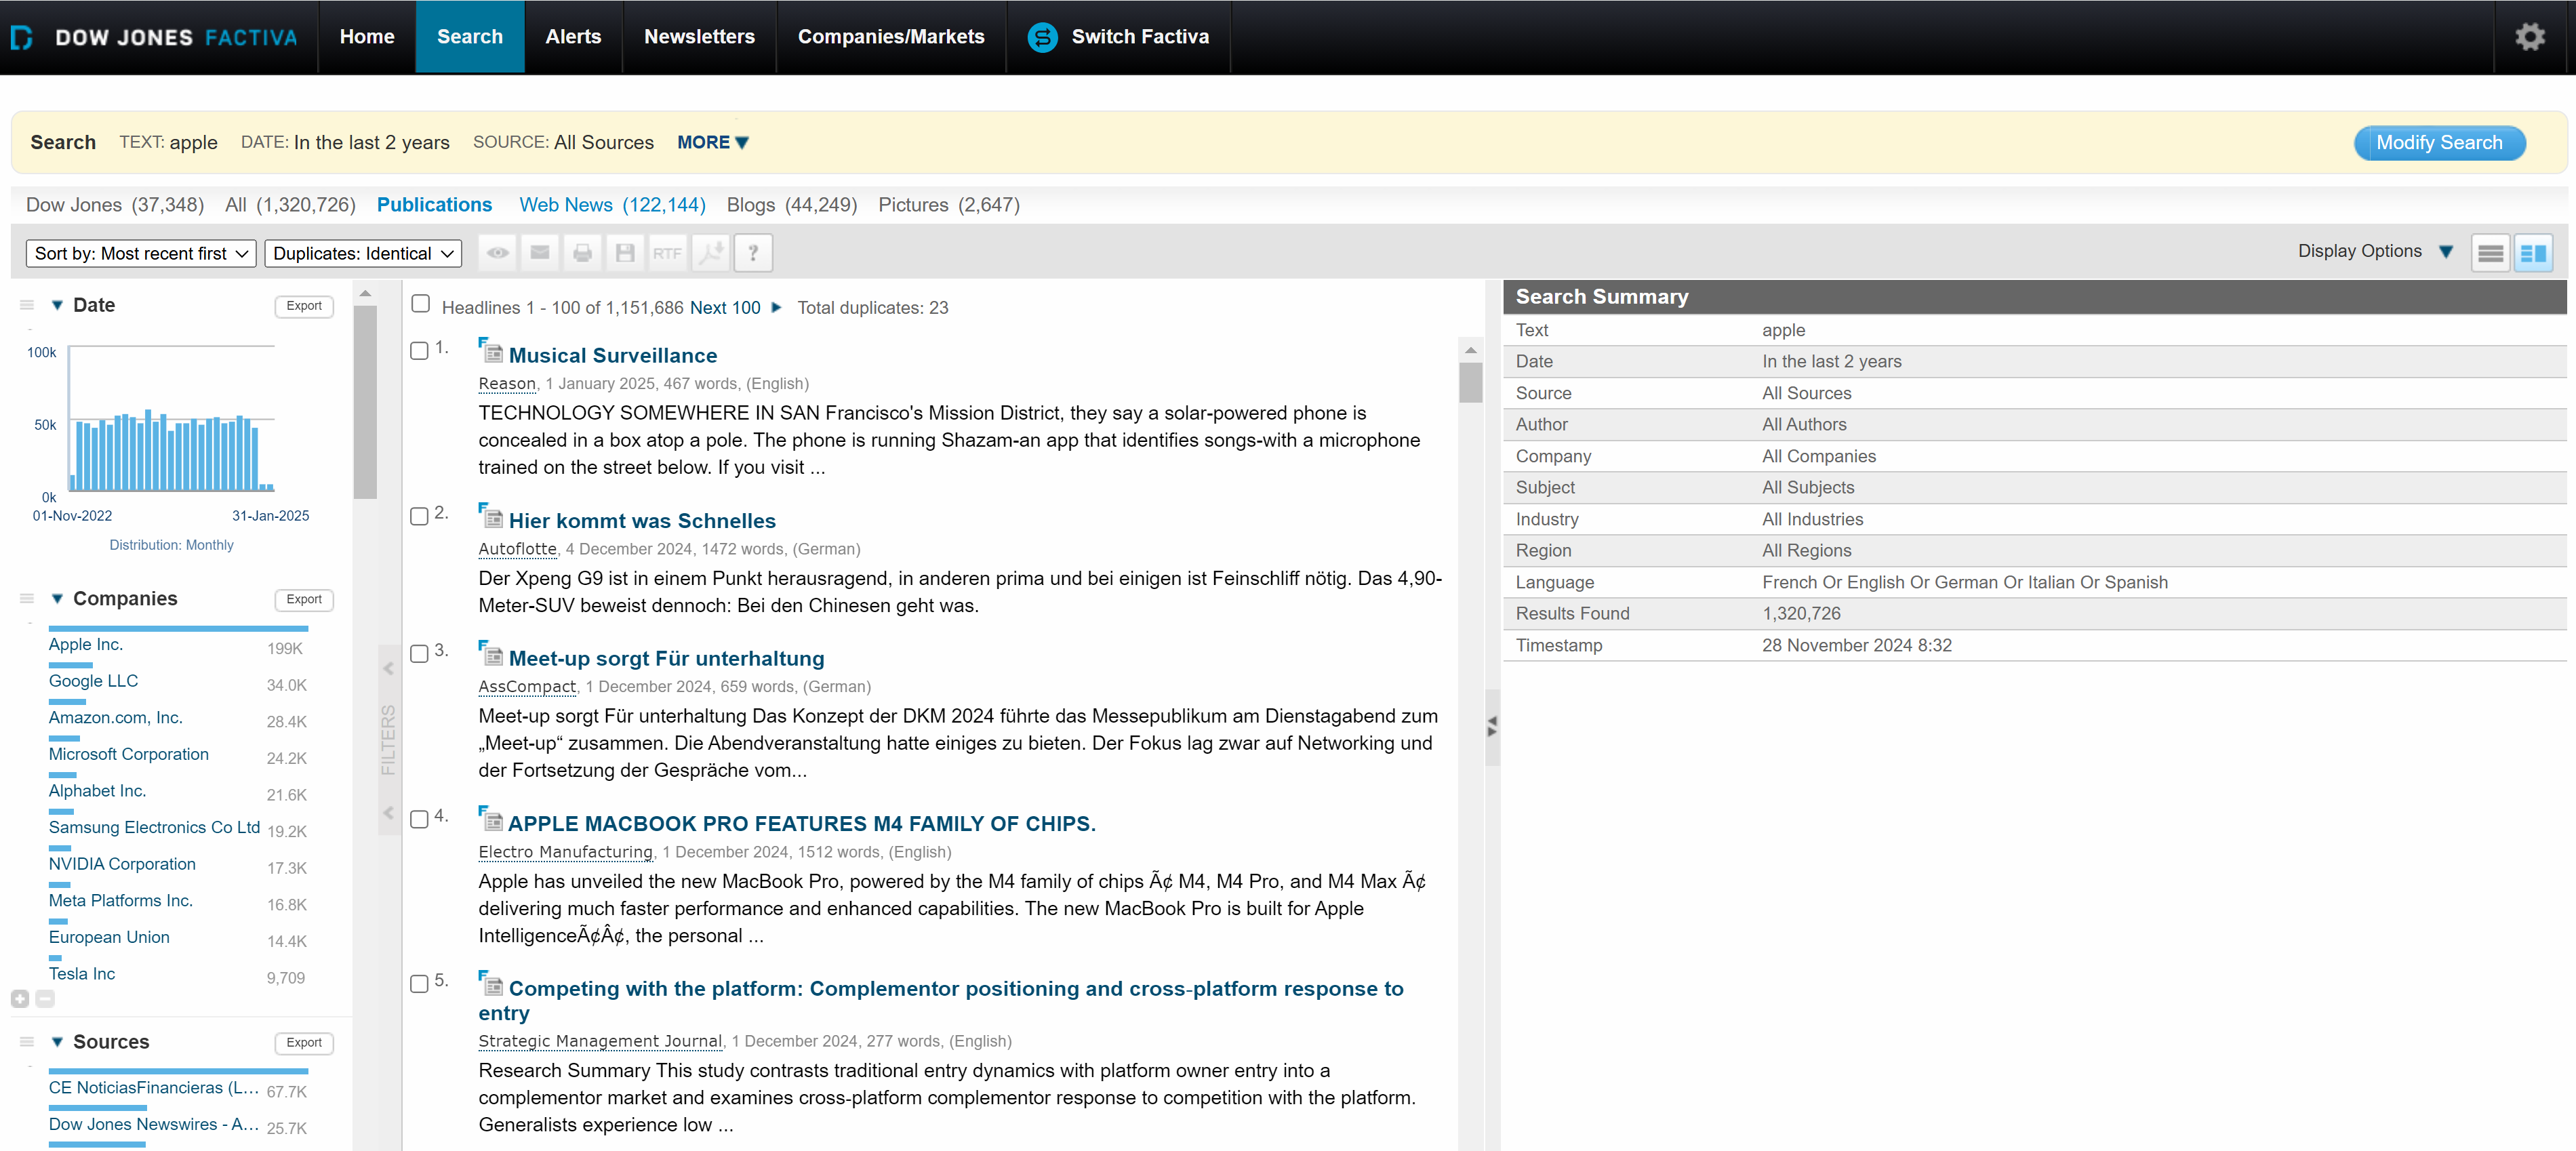
Source: the company.
Extensive Content Coverage
Factiva includes over 33,000 sources, such as The Wall Street Journal, The Financial Times, The New York Times, and Reuters. It features specialized publications in sectors like energy, healthcare, and technology. Archival content dates back decades, enabling trend analysis and historical research.
Search and Filter Options
Advanced search tools allow users to refine searches using keywords, topics, dates, or specific publications. Filters can narrow results by geography, industry, or company size.
Real-Time News
Factiva provides real-time updates on financial markets, economic changes, and global events. Alerts and notifications keep users informed of developments affecting their areas of interest.
Data Analytics and Visualization
Users can extract, analyze, and visualize data to identify patterns and insights. Tools include charts, graphs, and export options for seamless integration with other software.
Company Profiles and Industry Reports
Comprehensive profiles offer financials, competitors, and SWOT (Strengths Weakness Opportunity and Threats) analyses for thousands of companies. Industry reports provide market trends, regulatory updates, and forecasts.
Applications in Finance and Business
There are several applications of Factiva in finance and business such as Investment Research, Risk Management, Academic Research, and Public Relations and Marketing.
- Investment Research: Financial analysts rely on Factiva for market trends, earnings reports, and competitor analysis to guide investment decisions.
- Risk Management: Businesses use Factiva to monitor geopolitical events, economic risks, and compliance-related developments.
- Academic Research: Factiva’s extensive archives are invaluable for finance students and researchers studying historical market behavior or conducting case studies.
- Public Relations and Marketing: PR professionals use Factiva to monitor media coverage, track competitors, and evaluate public sentiment.
Advantages and Limitations of Factiva
Though there are multiple advantages of using this database there are also certain limitations which we have to consider.
Advantages of Factiva
- Global Reach: Access to international publications ensures a well-rounded perspective.
- Customizable Dashboards: Users can tailor the interface to prioritize relevant content.
- Reliable Sources: Factiva aggregates data from reputable and verified sources.
- Ease of Integration: APIs (Application Programming Interface) allow integration with other platforms for streamlined workflows.
Challenges and Limitations
- Cost: Factiva’s subscription model can be expensive for individuals or small businesses. The pricing is on the request basis of the data.
- Complexity: The platform’s depth may require training for optimal use.
- Access Restrictions: Some content may have geographical or licensing restrictions.
Why Factiva Matters in 2024
With the explosion of information and the increasing risk of misinformation, Factiva’s role as a curated, reliable database is more critical than ever. Its ability to distill vast quantities of data into actionable insights makes it a vital tool for navigating the complexities of modern business and finance. Moreover, the integration of advanced technologies such as AI in Factiva enhances predictive analytics, enabling users to anticipate market movements and mitigate risks proactively.
Conclusion
Factiva exemplifies the power of information in driving informed decision-making. Its rich history, innovative features, and significant economic implications underscore its enduring relevance in a data-driven economy. Whether you’re a student aiming to excel in finance or a professional seeking a competitive edge, Factiva equips you with the tools to succeed in a knowledge-driven world.
Why should I be interested in this post?
By embracing Factiva, users, and students mainly gain not just data but the clarity and confidence to act on it effectively, ensuring better outcomes for businesses, academia, and industries at large.
Related posts on the SimTrade blog
▶ Nithisha CHALLA Datastream
▶ Louis DETALLE The importance of data in finance
▶ Nithisha CHALLA CRSP
▶ Nithisha CHALLA Compustat
▶ Nithisha CHALLA Statista
Useful resources
Dow Jones Factiva – Global News Monitoring, Business Intelligence Platform
Dow Jones What is Factiva?
European University Institute (EUI) Factiva news and company database
Wikipedia Factiva
About the author
The article was written in December 2024 by Nithisha CHALLA (ESSEC Business School, Grande Ecole Program – Master in Management (MiM), 2021-2024).