In this article, Anant JAIN (ESSEC Business School, Grande Ecole Program – Master in Management, 2019-2022) talks about the ongoing hyperinflation in Turkey and its ripple effects on European markets.
Introduction
Turkey is facing one of the most severe inflation crises in its modern since 2019. Hyperinflation, marked by an uncontrollable surge in prices, has deeply impacted the Turkish economy and is starting to affect European markets as well. This article delves into the causes behind Turkey’s hyperinflation, its consequences on the Turkish economy, and the broader implications for Europe.
Figure 1. Inflation In Turkey (1960-2024)
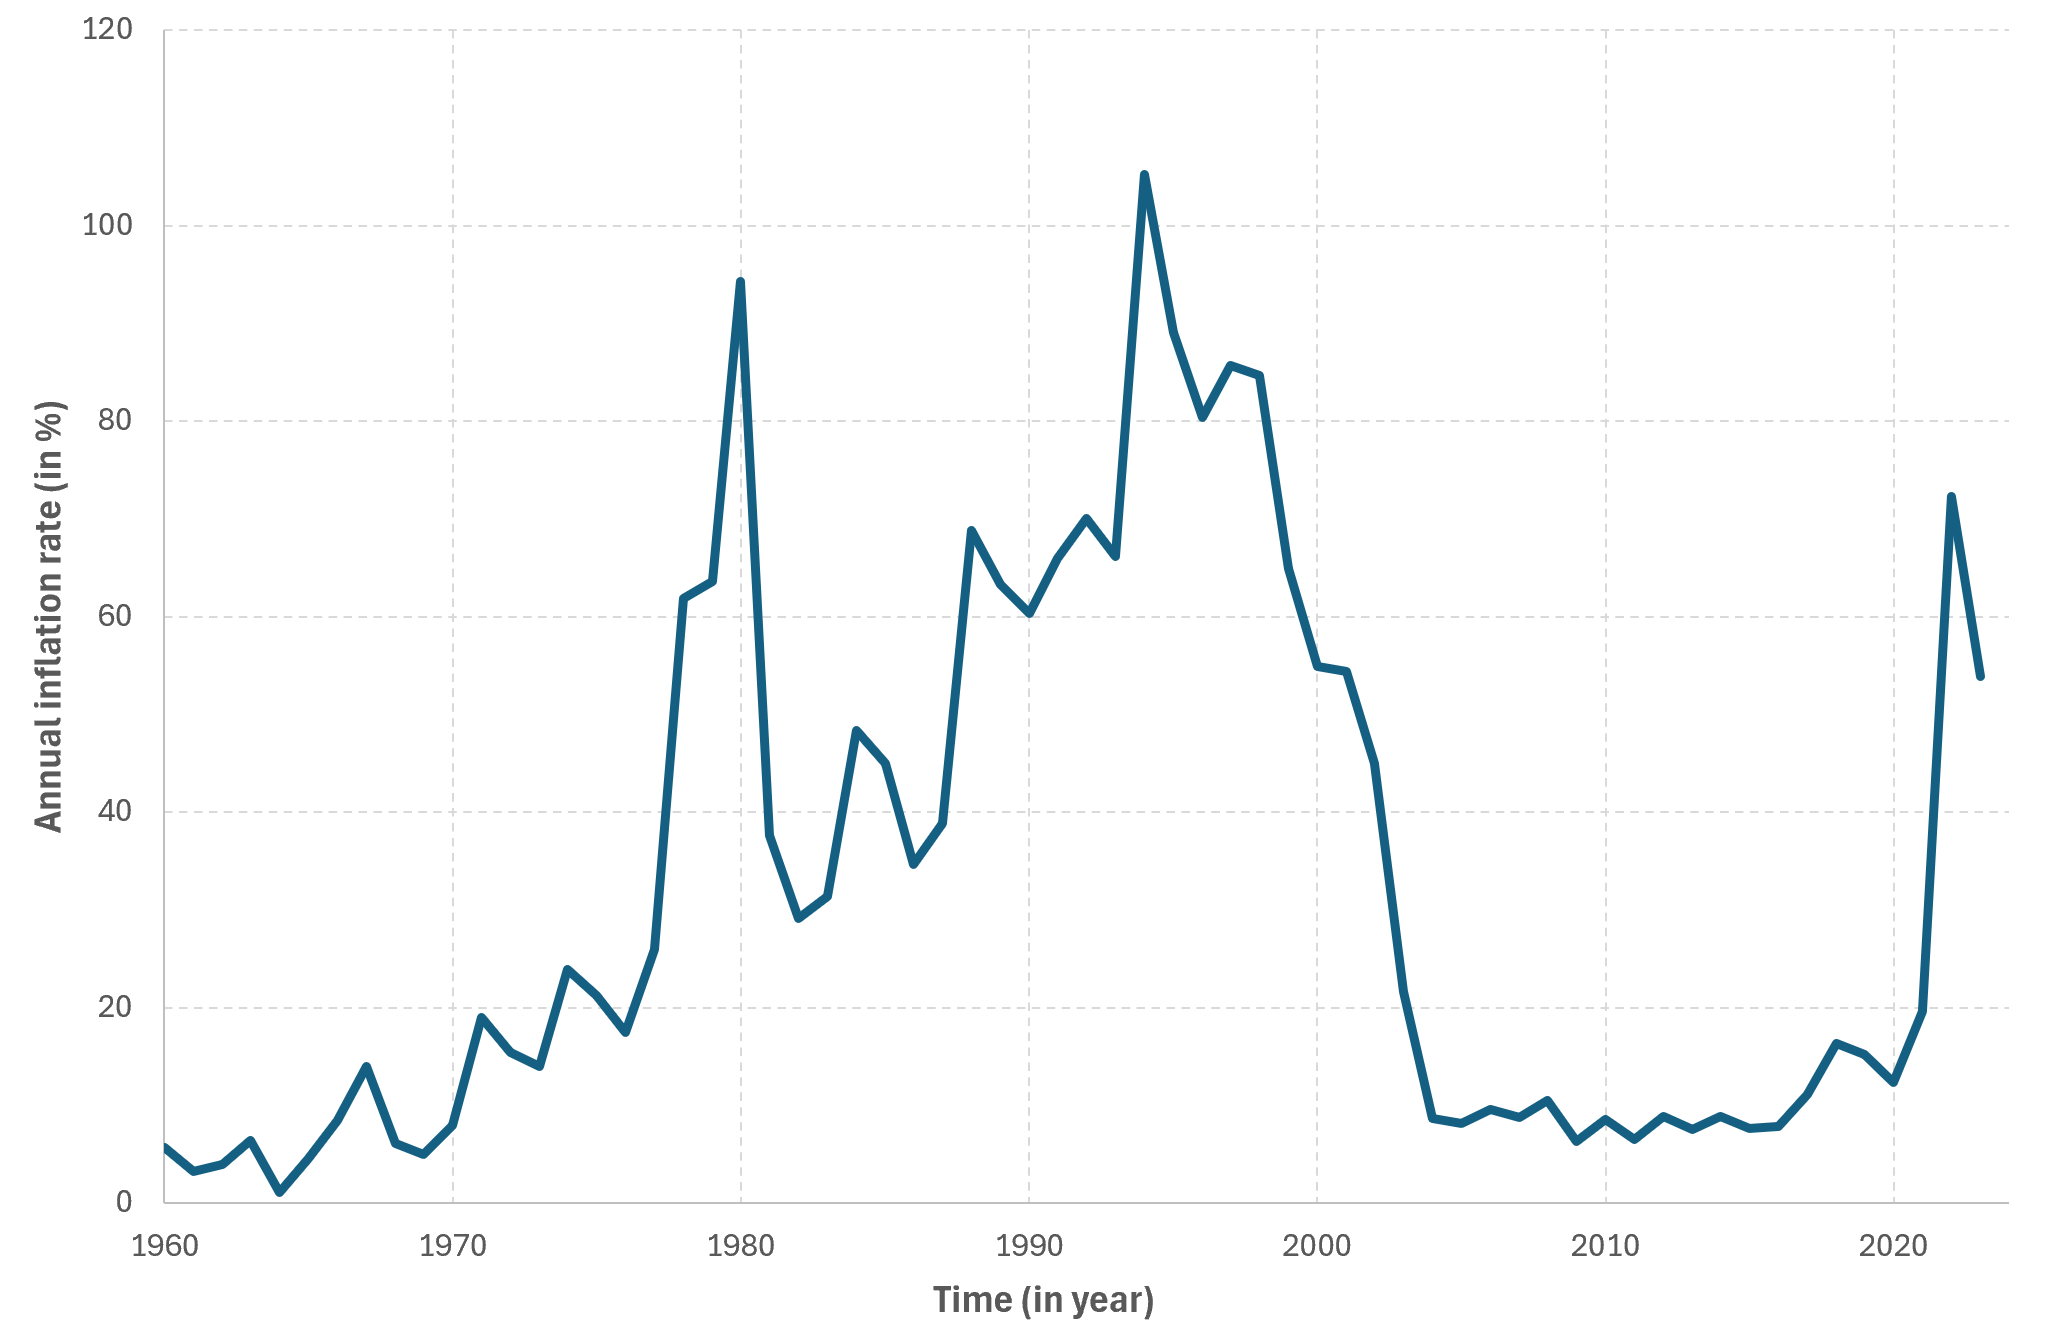
Source: World Bank
You can download the Excel file for the data used for the figure above.
Causes Of Hyperinflation In Turkey
Several factors have contributed to Turkey’s current hyperinflation crisis: monetary policy and Central Bank challenges, depreciation of the Turkish Lira, and political and external pressures.
Monetary Policy and Central Bank Challenges
The Turkish administration, led by President Recep Tayyip Erdoğan, has adopted unconventional monetary policies, including lowering interest rates despite high inflation. Erdoğan’s view that high interest rates lead to inflation contradicts established economic theory, leading to frequent rate cuts.
The Central Bank of Turkey has faced issues with its independence, with frequent changes in leadership and government interference undermining the effectiveness of its monetary policy.
Depreciation Of The Turkish Lira
The Turkish lira has seen a sharp decline in value against major currencies like the U.S. dollar and the euro. This currency depreciation has increased the cost of imports, which drives up prices domestically. Given Turkey’s reliance on imported goods, including energy and raw materials, the weakening lira has significantly contributed to inflation.
Political & External Pressures
Internal political instability and external geopolitical tensions have intensified the economic situation.
- Political events, including the 2018 presidential elections and subsequent local elections in 2019, have created uncertainty in the markets. The government’s actions, such as arrests of opposition figures and crackdowns on dissent, have raised concerns about the rule of law and investor confidence.
- The COVID-19 pandemic and the subsequent recovery have affected global supply chains and commodity prices, putting additional pressure on inflation in Turkey. Rising oil prices, in particular, have hurt Turkey due to its dependence on energy imports.
Global issues, such as rising energy costs and disruptions in supply chains, have also worsened Turkey’s inflation crisis.
Effects On Turkey’s Economy
Hyperinflation has had severe consequences for Turkey: Rising Costs and Living Standards, Devaluation Of Savings & Income, and Challenges For Businesses and Investment.
Rising Costs and Living Standards
The prices of everyday goods and services have soared, placing a heavy burden on Turkish citizens. Essential items like food, fuel, and housing have become increasingly expensive, leading to a marked decline in the quality of life for many people.
Official inflation rates are high, but real rates may be even higher. This has resulted in widespread economic difficulty, with many Turks struggling to afford basic necessities.
Devaluation Of Savings & Income
As the lira depreciates, the value of savings held in lira has diminished. Those on fixed incomes or holding substantial savings in lira are experiencing a severe reduction in their purchasing power.
Wage increases have not matched inflation rates, resulting in a decrease in real wages. This reduction in income has led to lower consumer spending, further hurting economic growth.
Challenges For Businesses and Investment
The hyperinflation crisis has created a turbulent environment for businesses. Rising costs and reduced consumer spending are making it challenging for companies to maintain profitability.
Foreign investors are hesitant to engage with the Turkish market due to concerns about the unstable lira and the government’s economic policies.
Consequences For European Markets
The economic turmoil in Turkey is beginning to influence European markets in several ways: Trade and Supply Chain Interruptions, Financial Market Volatility, and Migration & Social Strain.
Trade and Supply Chain Interruptions
- Impact: Increased costs and disruptions in supply chains are causing delays in production and raising prices for goods in Europe. European companies may either absorb these costs or pass them on to consumers, potentially leading to lower sales and profits.
- Example: European car manufacturers like Volkswagen and Renault are experiencing increased costs and delays because of issues with their Turkish suppliers. For instance, a Turkish automotive parts supplier reported a 30% rise in costs due to the lira’s devaluation, affecting European manufacturers reliant on these components.
Financial Market Volatility
- Impact: Turkey’s financial instability has led to increased volatility in European financial markets. Concerns about potential defaults on Turkish debt may result in tighter credit conditions and impact the profitability of European banks.
- Example: Spanish bank BBVA, which holds a significant investment in Turkey through Garanti BBVA, has been affected by the financial instability in Turkey. The lira’s devaluation and inflation have led to fluctuations in BBVA’s stock price and higher borrowing costs.
Effects On The Euro & Economic Stability
- Impact: The euro’s depreciation in response to Turkey’s crisis could lead to higher import costs for European countries, particularly those that rely on non-Eurozone imports. This might worsen inflationary pressures in Europe and complicate the European Central Bank’s efforts to manage economic growth.
- Example: In late 2022, the euro saw a noticeable decline in value against major currencies, partly due to concerns about the effects of Turkey’s economic situation. As the Turkish lira weakened, European investors and businesses faced greater uncertainty, affecting market sentiment and currency exchange rates.
Migration & Social Strain
- Impact: Increased migration from Turkey could put additional pressure on European social services, such as housing, healthcare, and education. This may heighten political tensions within the EU as member states address how to manage and support the influx of migrants.
- Example: Turkey has been a significant source of migration to Europe, with many people seeking refuge from economic and political instability. The worsening situation in Turkey could lead to more migration to countries like Greece and Italy, which are already dealing with substantial migration challenges.
Conclusion
The hyperinflation crisis in Turkey is a rapidly evolving issue with wide-ranging consequences. While the primary burden falls on the Turkish economy, the repercussions are starting to be felt across Europe. Trade disruptions, financial instability, and potential migration issues are among the challenges that European markets may face due to Turkey’s economic troubles.
The situation underscores the interconnected nature of global economies and the need for Europe to monitor and prepare for potential economic fallout. European policymakers and businesses must stay alert and adaptable in response to the ongoing developments in Turkey.
Addressing Turkey’s hyperinflation will require substantial economic reforms, including restoring central bank independence, stabilizing the currency, and regaining investor confidence. Until these issues are resolved, the economic and social impacts of Turkey’s crisis will continue to challenge both Turkey and Europe.
Related Posts On The SimTrade Blog
▶ Anant JAIN Understanding Hyperinflation
Useful Resources
Data
World Bank Inflation, consumer prices
Economic Analysis
World Bank Turkey Economic Monitor
Financial Times Turkey’s Economic Crisis
BBC News Turkey’s Inflation Crisis
European Central Bank Economic Bulletin
Council on Foreign Relations Turkey’s Economic Struggles
About The Author
The article was written in October 2024 by Anant JAIN (ESSEC Business School, Grande Ecole Program – Master in Management, 2019-2022).
▶ Read all articles by Anant JAIN.