Trading strategies based on market profiles and volume profiles

Trading strategies based on market profiles and volume profiles

Michel Henry VERHASSELT

In this third article on a series on market profiles, Michel Henry VERHASSELT (ESSEC Business School – Master in Finance, 2023-2025) explains trading strategies based on market profiles and volume profiles.

Introduction

We have defined and seen illustrations of all the key concepts related to both market profiles and volume profiles. Let us now look at their practical applications and trading strategies that may be applied.

These techniques apply to both market profiles and volume profiles.

Mean reversion

A mean reversion strategy is a trading approach based on the idea that prices tend to revert to their historical average or mean over time. Traders employing this strategy look for opportunities to enter trades when prices deviate significantly from their historical average, anticipating a return to the mean.

Market profiles naturally fit this kind of strategy, as their whole point is to show where participants have deemed the price to be fair. For example, a trader could consider that when the price is trading below a high-volume area, that area will act as a magnet to pull the price up. The prices in that region were indeed considered fairer, and the current low price would be an anomaly to be corrected by market participants. Therefore, the trader would buy at the current price and sell around the POC or at least within the value area.

Resistance and support

Conversely, a different interpretation within the same framework involves viewing these highly-traded areas as potential resistance or support zones. Support is a crucial level preventing an asset from further decline, often due to an upsurge in buying interest. In contrast, resistance is a pivotal level inhibiting an asset from rising higher, typically caused by intensified selling activity.

For a trader emphasizing resistance and support concepts, consider a rising price nearing a heavily traded zone encountering resistance, similar to reaching a ceiling. The outcome may lead to either a breakout to new highs or a reversal downward. In this context, the value area is not seen as a magnetic force drawing prices toward fair value; instead, it functions as a testing ground. The result hinges on whether the attempt to breach resistance is rejected, leading to a lower price, or successful, resulting in an upward move past this pivotal point. This dynamic interaction adds layers of complexity to mean reversion and support/resistance strategies within the realm of market profiles.

Entries and exits

More generally, traders employ various tools to make well-informed decisions about when to enter or exit market positions. One such powerful tool is the market profile. Even if a trader’s primary strategy relies on other triggers to look at a trade, say for example macro events, they can still leverage market profiles. These profiles help determine optimal entry or exit points, considering factors like obtaining liquidity with minimal market impact and identifying levels for stop losses and target profits based on perceived resistance and support.

Breakouts

As mentioned above, breakout trading is a strategy employed in financial markets where traders capitalize on significant price movements beyond established levels of support or resistance. In a breakout, the price surpasses a predefined range or pattern, triggering potential buying or selling signals. Traders often interpret breakouts as indicators of strong momentum, with the expectation that the price will continue moving in the breakout direction. The aim of breakout trading is to enter positions early in a new trend and ride the momentum for profitable gains.

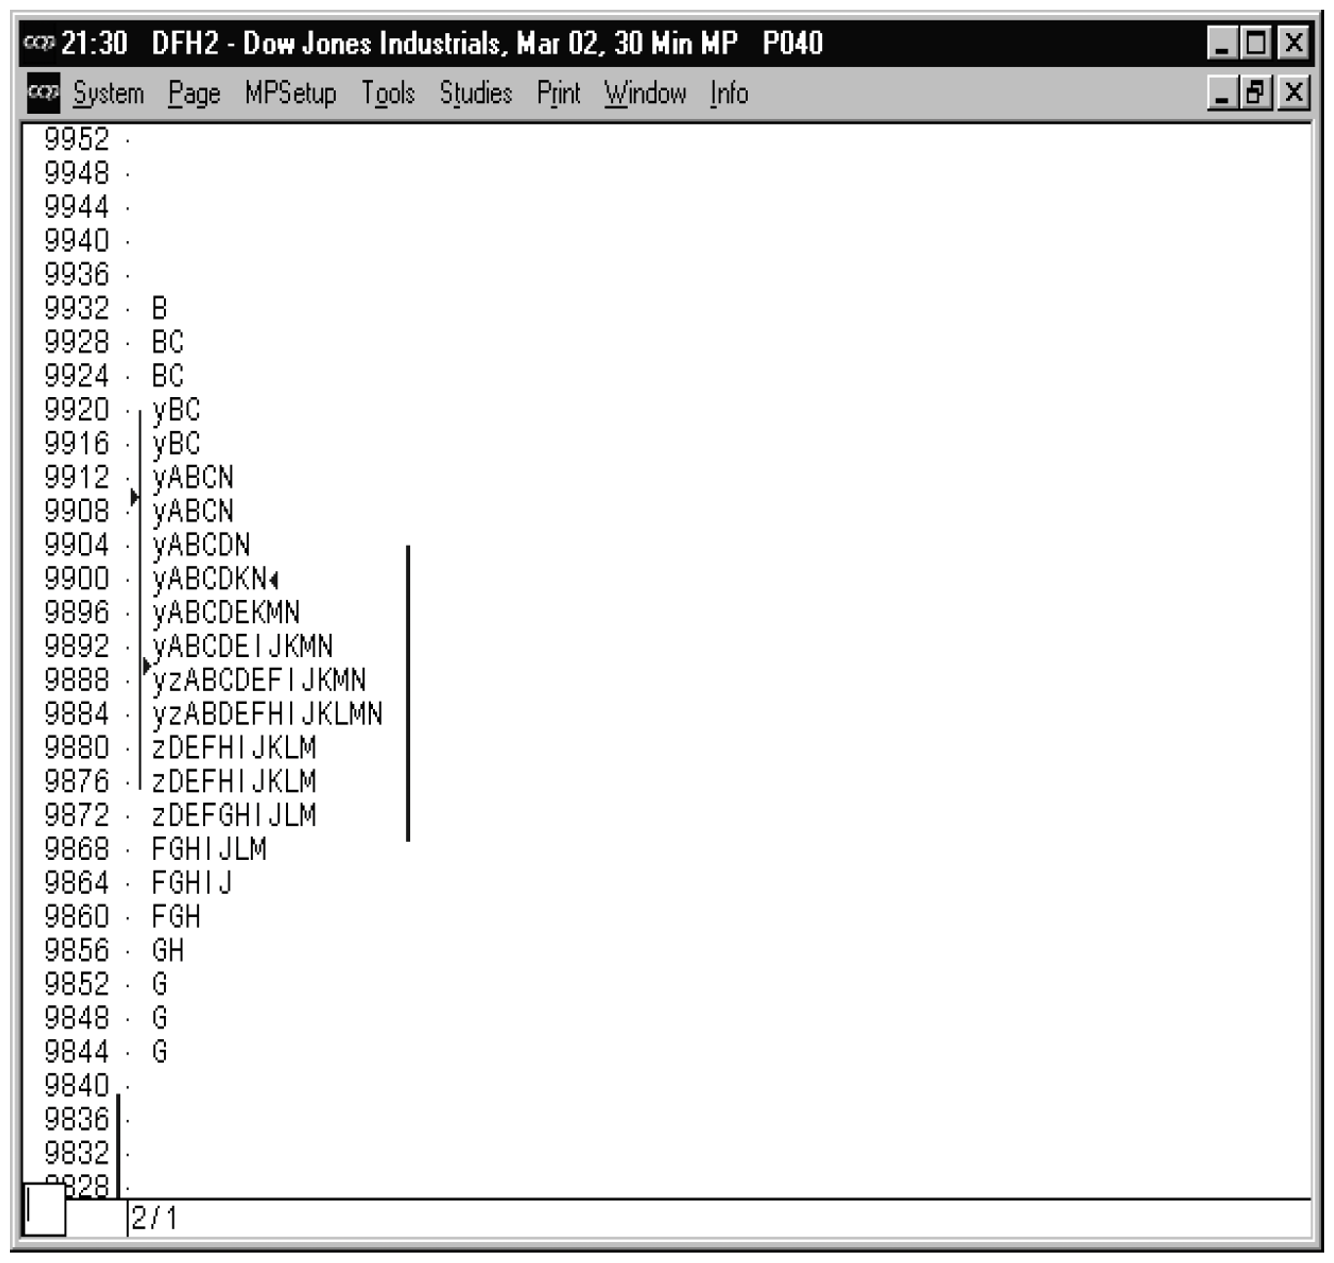
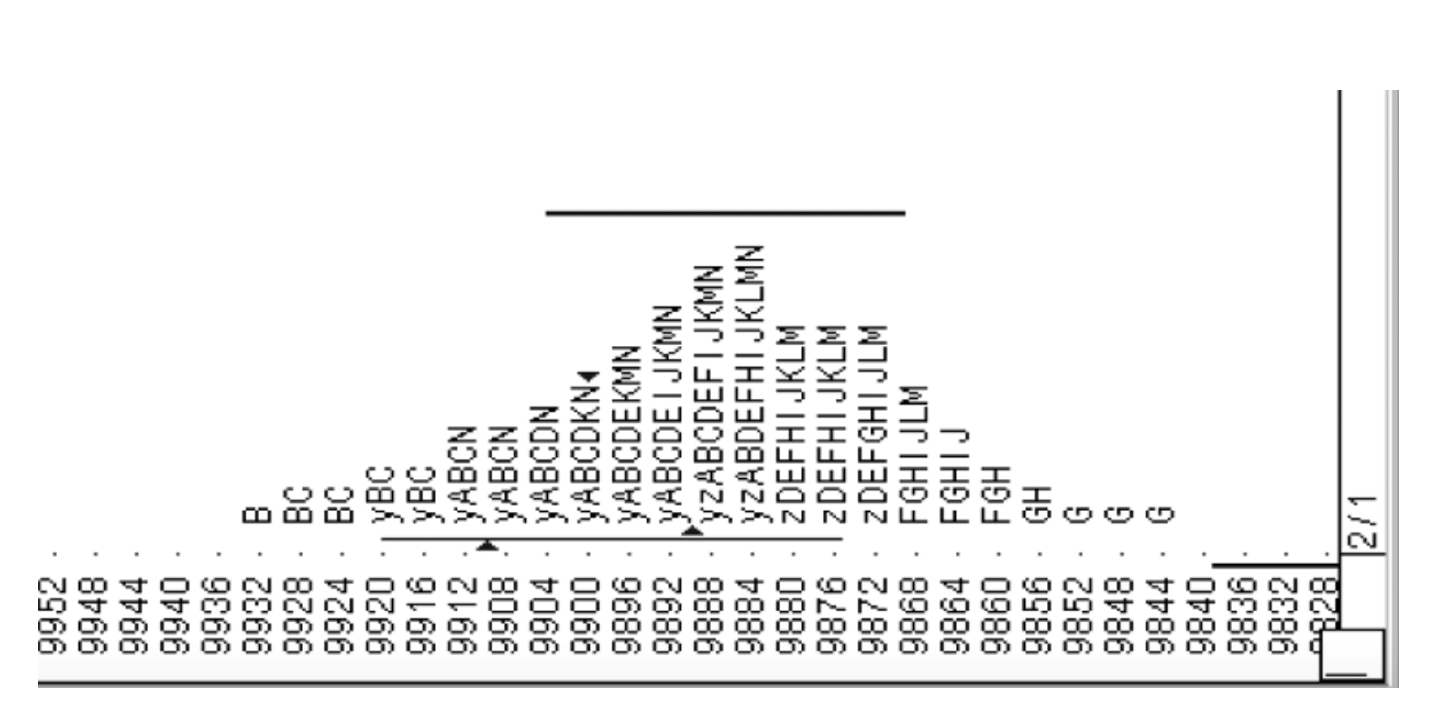
Market profile can help identify breakout opportunities. For example, when a market exhibits confined trading within a narrow range and the profile reveals an accumulation of TPOs (Time Price Opportunities) near the boundaries of this range, a breakout surpassing these levels could indicate a potential trading opportunity.

False breakout strategy

The false breakout trading strategy relies on discerning instances where the price briefly moves beyond a trading range but subsequently retraces, indicating potential weaknesses in the current trend. In a false bullish breakout, signaling buyers’ weakness, traders might opt for short positions. Conversely, in retraced bearish breakouts, suggesting sellers’ uncertainty, opportunities for long positions may emerge. The effectiveness of this strategy lies in recognizing imbalances in supply and demand, a task facilitated by market profiles.

Market profiles offer a nuanced visual representation of price movements over time, highlighting areas of significant trading activity and the distribution of volume at different price levels. This information aids traders in identifying potential entry and exit points more precisely. By integrating market profiles into the false breakout strategy, traders gain insights into the dynamics of supply and demand within specific price ranges. This, in turn, enhances their ability to navigate market sentiment shifts and make informed decisions, contributing to the overall effectiveness of the false breakout trading strategy.

Single prints

The Market Profile Single Print strategy is a dynamic approach leveraging the unique concept of single prints within the Market Profile chart to identify potential breakout opportunities.

The strategy’s foundation lies in identifying single prints—instances where a price level remains untouched throughout the trading session, creating a gap in the Market Profile chart. Price can often revisit these areas to test these inefficiencies. These single prints therefore act as crucial markers, indicating potential areas of support or resistance. The significance of this lies in the ability to pinpoint breakout levels: a break above a single print suggests a bullish breakout, while a break below indicates a bearish breakout.

Crucially, market profiles assist in managing risk effectively by providing a visual representation of potential areas of support or resistance. Continual monitoring of the trade is emphasized, with adjustments made based on evolving market conditions. Trailing stop-loss orders are recommended to protect profits as the trade progresses favorably.

Related posts on the SimTrade blog

   ▶ Michel VERHASSELT Market profiles

   ▶ Michel VERHASSELT Difference between market profiles and volume profiles

   ▶ Theo SCHWERTLE Can technical analysis actually help to make better trading decisions?

   ▶ Theo SCHWERTLE The Psychology of Trading

   ▶ Clara PINTO Strategy and Tactics: From military to trading

Useful resources

Steidlmayer P.J. and S.B. Hawkins (2003) Steidlmayer on Markets: Trading with Market Profile, John Wiley & Sons, Second Edition;

Steidlmayer P.J. and K. Koy (1986) Markets and Market Logic: Trading and Investing with a Sound Understanding and Approach, Porcupine Press.

About the author

The article was written in December 2023 by Michel Henry VERHASSELT (ESSEC Business School – Master in Finance, 2023-2025).

Difference between market profiles and volume profiles

Difference between market profiles and volume profiles

Michel Henry VERHASSELT

In this second article on a series on market profiles, Michel Henry VERHASSELT (ESSEC Business School – Master in Finance, 2023-2025) explains the difference between market profiles and volume profiles.

Comparison

Both Market Profiles and Volume Profiles follow the auction theory of markets. According to this theory, price, time and volume are the three processes through which trading takes place.

More exactly:

  • Price advertises all opportunities. It lets the participants know that they can buy or sell an asset at a given price; it tells them what their opportunities are.
  • Time regulates all opportunities. Indeed, the opportunities given by price are limited in time; they are ephemeral and depend on the liquidity and volatility of an asset, in other words, how much time it takes for the price to change and the opportunity to vanish.
  • Volume measures the success or failure of advertised opportunities. Volume reflects the degree of market participation and validates the relevance of the opportunities presented. If an opportunity is advertised and becomes successful that means many participants agree on the fairness of this opportunity and a relatively significant amount of trading activity (volume) takes place at this price. A price that is not accepted over time is, in fact, rejected: the advertisement has failed.

All traders feel the pressure of time ticking away during a trade. When a trade stalls and doesn’t go as expected, it can create doubts, especially the longer it remains stagnant. The constant tick of the clock forces traders to ponder what might be going wrong. For instance, the late liquidation or short-covering rally in the pit session may be due to day traders running out of time rather than a lack of trading volume. In that sense, volume must take place within a given time range to validate the price advertisement.

Now when it comes to Volume Profiles, the chart shows the distribution of volume at different price levels, kind of like a visual map of where the action is happening. It uses a vertical histogram to make it easy for traders to see where the most trading activity is concentrated. This charting tool is all about giving traders a closer look at how much trading is going on at different price points over time.

Comparing Volume Profile to Market Profile, we find three key areas of differences: analytical focus, representation of data, and time and price dynamics.

Analytical Focus

Volume Profile: As the name suggests, Volume Profile places a paramount emphasis on volume, aiming to dissect the distribution of trading activity at different price levels over a designated timeframe.

Market Profile: In contrast, Market Profile combines time and price to create a graphical representation of market behavior. It divides price movements into designated time segments, typically 30-minute intervals, offering a nuanced perspective on the interplay between time and price.

Representation of Data

Volume Profile: The chart generated by Volume Profile provides a clear visualization of how volume is distributed across various price levels, offering insights into where significant buying or selling activity is concentrated.

Market Profile: While also representing volume, Market Profile charts use letters (TPOs) to signify the time spent at specific price levels, creating a distinctive visual pattern resembling a probability distribution.

Time and Price Dynamics

Volume Profile: Its primary concern is the interrelation of volume and price, with a focus on understanding the significance of different price levels based on the amount of trading activity.

Market Profile: Integrates time as a crucial factor, providing traders with a holistic view of market behavior over specific time intervals. This temporal dimension aids in identifying periods of heightened activity and potential areas of interest.

Let’s now look at Market and Volume profiles graphs.

Illustration

The figure below is taken from Steidlmayer’s main work: “Steidlmayer on Markets, Trading with Market Profile”. Each letter (A, B, C, D, etc.) corresponds to a single timeframe of 30 minutes. The condensed triangle-shaped figure shows where price has moved throughout the entire time period according to the trading activity.

Market profile.
Market profile
Source: Steidlmayer’s book “Steidlmayer on Markets, Trading with Market Profile”.

If we rotate the figure, we get a bell-shaped pattern that looks like a normal distribution.

Market profile (reversed presentation).
Market profile
Source: Steidlmayer’s book “Steidlmayer on Markets, Trading with Market Profile”.

The price distribution in a Market Profile tends to exhibit a bell-shaped pattern due to the nature of market dynamics and participant behavior. In a well-functioning and liquid market, prices are subject to constant fluctuations driven by the interplay of buying and selling activities and the bell-shaped distribution is simply a reflection of the statistical tendency of prices to cluster around a central point. The majority of trading activity should in theory occur around a fair or equilibrium price. As you move away from this central point, the occurrences of extreme price levels decrease, forming the characteristic bell curve. It is a visual representation of the market’s natural inclination to spend more time around prices that are deemed fair.

The figure below represents the volume profiles of the BTC/USDT pair on Binance’s futures market from December 8 until December 15, 2023.

Volume profile.
Volume profile
Source: exocharts.com.

We see the point of control (POC) that corresponds to the most traded price as a red line extending through the volume profile of each day. The value area is marked both by a whiter grey and dotted lines. The current price is a green line on the far left. On the far right, we find the volume profile for the whole timeframe displayed on the screen, with its own value area and point of control.

While the two profiles are very similar, however instead of looking at price and time as in a market profile, the volume profile focuses on volume. First, the volume profile is indifferent to when exactly a given trade took place within the same timeframe, here a day. Second, the volume profile uses true volume data rather than simply whether or not a trade took place. The length of each bar within a volume profile is directly proportionate to the volume of the trades at that price. In contrast, the market profile does not show the size of the trades but simply shows whether or not a price was traded during a 30-minute period, and then aggregates (or “collapses”) the data to form one profile, as we saw in the bell-shaped curve above.

Why should I be interested in this post?

Students of finance interested in financial markets and trading would be the target audience of this post. I believe this technique to be relatively obscure despite its long history. We rarely see asset charts displayed as histograms as an effort to understand market behavior and participant psychology. I believe it is fundamental to consider that the market is made up of human actors, that these actors have their biases on price and value, and in turn that these biases’ success is represented as a function of volume. Even if a student does not subscribe to this understanding of markets, it would broaden his/her perspective and allow him/her to understand trading more generally.

Related posts on the SimTrade blog

   ▶ Michel VERHASSELT Market profiles

   ▶ Michel VERHASSELT Trading strategies based on market profiles and volume profile

   ▶ Theo SCHWERTLE Can technical analysis actually help to make better trading decisions?

   ▶ Theo SCHWERTLE The Psychology of Trading

   ▶ Clara PINTO Strategy and Tactics: From military to trading

Useful resources

Steidlmayer P.J. and S.B. Hawkins (2003) Steidlmayer on Markets: Trading with Market Profile, John Wiley & Sons, Second Edition;

Steidlmayer P.J. and K. Koy (1986) Markets and Market Logic: Trading and Investing with a Sound Understanding and Approach, Porcupine Press.

TPO versus Volume Profiles

Trader Dale Volume Profile vs. Market Profile – What Is The Difference? YouTube video

About the author

The article was written in December 2023 by Michel Henry VERHASSELT (ESSEC Business School – Master in Finance, 2023-2025).

Market profiles

Market profiles

Michel Henry VERHASSELT

In this first article on a series on market profiles, Michel Henry VERHASSELT (ESSEC Business School – Master in Finance, 2023-2025) explains the history behind this concept and defines its central themes.

Introduction

The concept of Market Profiles emerged as a response to the dynamic nature of financial markets, where prices are in constant flux due to the continuous flow of information. Peter Steidlmayer, a trader at the Chicago Board of Trade during the 1960s and 1970s, sought to develop a charting method that could capture the interplay between price and volume, reflecting the idea that, despite the constant price changes, there should be a fair value around which prices revolve at any given time.

In traditional charting methods like bar charts and candle charts, the emphasis is typically on plotting price against time. Steidlmayer, however, wanted to make volume immediately apparent on the chart. This emphasis on volume is crucial because it provides insights into the level of participation and conviction among market participants.

The development of Market Profile was influenced by various theories and disciplines. In particular, it drew inspiration from the concept of value investing articulated by Benjamin Graham and David Dodd, the statistical bell curve, and John Schultz’s work on minimum trend. By combining these influences, Steidlmayer aimed to create a charting technique that would not only reveal price movements but also offer a visual representation of the market’s perception of value.

Market Profile, as a charting technique, differs significantly from traditional methods. Instead of using standard bar charts with prices plotted against time, Market Profile organizes data in a way that reflects the distribution of prices at different levels. Each time period is represented by a separate column, with prices displayed in ascending order on the vertical axis. This organization provides a visual representation of how much time the market spent at different price levels, creating a histogram-like structure.

The resulting chart, with letters (A, B, C, D, etc.) representing Time Price Opportunities (TPO), helps traders identify key areas such as the Value Area (where the majority of trading activity occurred), the Point of Control (the most traded price level), and Single Prints (indicating areas of price discovery). These elements collectively contribute to a comprehensive understanding of market dynamics and help traders make more informed decisions.

Definitions

We define below the key terms to understand Market Profile: Volume, Value Area, and Point of Control.

Volume

Volume in the context of financial markets refers to the number of contracts or shares traded at during a specific time period. Volume is a crucial component in Market Profile analysis because it provides insights into the level of participation and conviction among market participants. High volume at a particular price level suggests a significant level of interest or agreement on the value of the asset at that point.

Volume helps us shape the Time Price Opportunities. A TPO represents a unit of time and price on a Market Profile chart. Each 30-minute period (or another specified time frame) is represented by a letter, forming a vertical histogram on the price axis. TPOs help visualize the distribution of trading activity at different price levels over time. By organizing price data into these time brackets, traders can identify patterns, trends, and areas of importance, contributing to a better understanding of market behavior.

Value Area

The Value Area represents the range of price levels that contain a specific percentage of the total traded volume (usually 70% of the day’s trading activity). Traders also use the Upper Value Area (where 15% of the volume is located above) and the Lower Value Area (where 15% of the volume is below), with the area in between considered the “fair value” zone. It helps traders identify the price levels that are deemed fair by the market. It provides insights into where the majority of trading activity occurred, offering potential support and resistance zones for future price movements.

Point of Control

Within the value area, we find the Point of Control. The Point of Control is the price level at which the most TPOs occurred during a specific time period. It is considered a point of balance and represents the price where the market found the most acceptance. It indicates the price level that had the most trading activity, suggesting a level of equilibrium where buyers and sellers found agreement. Traders often monitor the POC for potential shifts in market sentiment.

By understanding the interplay between these elements, traders can gain valuable insights into market dynamics, identify key support and resistance zones, and make more informed decisions in their trading strategies.

With this background and definitions, we can look further into the practice of market profiles and its closely related concept, volume profiles.

Why should I be interested in this post?

Students of finance interested in financial markets and trading would be the target audience of this post. I believe this technique to be relatively obscure despite its long history. We rarely see asset charts displayed as histograms as an effort to understand market behavior and participant psychology. I believe it is fundamental to consider that the market is made up of human actors, that these actors have their biases on price and value, and in turn that these biases’ success is represented as a function of volume. Even if a student does not subscribe to this understanding of markets, it would broaden his/her perspective and allow him/her to understand trading more generally.

Related posts on the SimTrade blog

   ▶ Michel VERHASSELT Difference between market profiles and volume profiles

   ▶ Michel VERHASSELT Trading strategies based on market profiles and volume profile

   ▶ Theo SCHWERTLE Can technical analysis actually help to make better trading decisions?

   ▶ Theo SCHWERTLE The Psychology of Trading

   ▶ Clara PINTO Strategy and Tactics: From military to trading

Useful resources

Steidlmayer P.J. and S.B. Hawkins (2003) Steidlmayer on Markets: Trading with Market Profile, John Wiley & Sons, Second Edition;

Steidlmayer P.J. and K. Koy (1986) Markets and Market Logic: Trading and Investing with a Sound Understanding and Approach, Porcupine Press.

Letian Wang (2020) Using Python for Market Profiles

About the author

The article was written in December 2023 by Michel Henry VERHASSELT (ESSEC Business School – Master in Finance, 2023-2025).

My experience as Digital Business Developer for Capture Europe

My experience as Digital Business Developer for Capture Europe

Michel Henry VERHASSELT

In this article, Michel Henry VERHASSELT (ESSEC Business School, Master in Finance, 2023-2025) shares his professional experience as Digital Business Developper at Capture Europe.

About the company

Capture Europe provides software solutions and IT services to businesses on an international scale, with a focus on European businesses. Partners of Broadcom and ServiceNow, their areas of expertise are mainly in Project Portfolio Management and Automation. Past clients include major banks, telecommunication companies, etc.

Logo of the company.
Logo of Capture Europe
Source: the company.

My role at Capture Europe

My missions

In my role as a Digital Business Developer at Capture Europe, my primary mission was to coordinate our sales and marketing teams. This multifaceted role demanded a diverse skill set and included various responsibilities. On the sales front, I screened prospects, transforming them into valuable sales-qualified leads. This process involved market and industry research, cold-calling, and reaching out to other potential clients, such as webinar attendees and conference participants.

Once the leads met our predefined criteria and expressed a genuine interest in partnering with Capture Europe, I connected them with the relevant business divisions within our company. This transition from prospect to sales-ready lead was pivotal in driving sales, and it was perhaps what I enjoyed most about the job. I had to learn to be comfortable talking to people in different positions of the corporate hierarchy, to change my style accordingly and make sure they were interested in what I had to say. I also had to learn to deal with rejection and sometimes rudeness. In the end, you get used to it, and you focus on achieving your goals.
On the marketing front, I played a role in bolstering our company’s online presence. This involved curating content for our social media platforms and leading marketing campaigns in collaboration with the rest of the team. I was responsible for developing compelling marketing materials, creating engaging presentations and webinars, and maintaining our extensive CRM database, which housed information on 2,000-3,000 customers.

As part of my administrative duties, I maintained regular communication with our executives, providing them with insightful updates on the performance of both the sales and marketing teams in relation to key performance indicators and our organization’s overarching goals. This holistic experience provided me with insights into the inner workings of our business and, I believe, helped my professional growth in general.

Throughout my tenure at Capture Europe, I consistently exceeded KPI sales targets, driving over €600,000 in revenue through strategic software sales. This experience not only enhanced my sales and marketing skills but also equipped me with a comprehensive understanding of how an enterprise operates.

Required skills and knowledge

A diverse skill set is needed to succeed as Digital Business Developer. Approximately half of my responsibilities revolved around leveraging analytical skills, while the other half emphasized interpersonal and communication abilities.

On the analytical side, a substantial portion of my time was dedicated to database analysis and market research. These tasks demanded a thorough understanding of research tools and data analysis techniques, allowing me to derive meaningful insights from large datasets. Familiarity with Customer Relationship Management (CRM) software was also indispensable, enabling the efficient management of customer data and facilitating data-driven decision-making.

Once I had identified promising prospects, my role transitioned to a more people-centric focus. Building and nurturing business relationships became pivotal. Effective interpersonal skills, coupled with the ability to initiate conversations and guide them towards a successful conclusion, played a vital role in securing sales. These skills were also essential for facilitating smooth collaboration and alignment between the marketing and sales teams, despite differing goals and expectations. It was not uncommon for conflicts to arise, with the teams’ managers occasionally holding conflicting opinions. In such scenarios, I often found myself in a diplomatic role, navigating the fine line between my role as an employee of the Head of Marketing and the imperative to ensure effective cooperation. My background in languages and translation proved invaluable in these situations, as it equipped me with the ability to employ nuanced language to reconcile differences and lead the teams to collectively achieve overarching project success.

What I learned

My tenure as a Digital Business Developer at Capture Europe provided me with insights into the workings of a business, from its microscale operations to the macroscopic strategic planning. Throughout my role, I gained a comprehensive understanding of various facets, including how different branches within the corporate structure collaborate and communicate to achieve common objectives.

On a microscale, I learned the intricacies of identifying potential sales opportunities and managing short-term projects efficiently. These experiences equipped me with practical insights into the day-to-day operations of a business, highlighting the importance of timely execution and attention to detail.

On a macroscale, I had the privilege of observing how executives manage and coordinate teams to achieve long-term organizational goals. This perspective allowed me to comprehend the complexities of aligning individual efforts with the overarching mission of the company.

In terms of interpersonal skills, my role exposed me to the nuances of effective communication, diplomacy, and conflict resolution within a professional setting. I encountered challenging scenarios, learned how to navigate workplace conflicts, and honed my ability to maintain productive relationships, even when dealing with difficult customers. This aspect of my experience underscored the importance of empathy, patience, and adaptability when addressing customer concerns and achieving favourable outcomes.

Lastly, I acquired a range of hard skills, most notably advanced proficiency in Excel. The practical utilization of Excel tools and functions in data analysis and reporting became a crucial component of my daily responsibilities. This experience enhanced my analytical capabilities and has proven to be an asset in various professional contexts.

In essence, my time at Capture Europe provided me with a holistic view of business operations, from the smallest details of day-to-day tasks to the grand strategies of executives. It also honed my people skills and hard skills. These experiences have collectively contributed to my personal and professional growth.

Financial concepts related my internship

Return on Investment

As a Digital Business Developer, understanding ROI is essential. Your role involves identifying sales opportunities, conducting market research, and implementing marketing campaigns. These efforts all incur costs, and it’s crucial to measure the return on these investments. We would continually be measuring our efforts against the overall marketing budget, and gauging how cost-effective our campaigns were. For example, some menial tasks involve a lot of man-hours, like screening thousands of prospects’ backgrounds – would it be smarter for the organization to automate this work ? It is not at all obvious without thorough analysis of the specific costs of both options. It was my suggestion to management, but it was ultimately rejected as too costly.

You need to analyze the effectiveness of marketing campaigns, sales efforts, and the overall impact on the company’s bottom line. Knowledge of ROI enables you to assess whether your strategies are generating profitable outcomes or if adjustments are required.

Customer Lifetime Value

This concept, akin to ROI but with a more personalized focus, comes into play when dealing with numerous potential clients daily. In such a dynamic environment, you must make choices and prioritize certain relationships over others. It’s important to recognize that the most promising business relationships might not yield immediate success. Patience is key, as nurturing long-term client relations can be more valuable. While a single, small to medium-sized contract may not suffice to meet your KPIs or drive significant company growth, establishing trust with a long-term partner can be more advantageous. These enduring partnerships offer the potential for recurring contracts and cross-selling opportunities once clients appreciate the value you bring to their business, making them exceptionally valuable.

Cash-flow analysis

Cash-flow analysis serves as the linchpin that connects both ROI and CLV. To ascertain ROI, you must meticulously track the flow of financial resources. It involves assessing the inflow and outflow of cash within the business, to ensure liquidity and overall financial stability. Similarly, when considering CLV, understanding the organization’s cash flow is vital. It enables you to determine the feasibility of nurturing long-term client relationships, as you can evaluate the available funds to support these efforts over an extended period.

Why should I be interested in this job?

Imagine your finance studies as the “what” of the financial world – understanding numbers, investments, and markets. But a successful finance professional needs the “how” and “why” too. That’s where my experience as a Digital Business Developer comes into play.

You’ll need to grasp how different parts of a company connect and impact each other. My role helped me understand this interconnected web of business operations. You’ll appreciate this holistic perspective when you’re making financial decisions that affect the entire organization.

Moreover, I often needed to take the role of a team leader. Leadership and teamwork are more than buzzwords. Your finance journey won’t be a solo ride; you’ll work in teams with different goals. My time as a coordinator taught me how to lead, resolve conflicts, and unite people towards a common objective. This is the reality of working within a larger structure: managing projects, working with diverse teams, and making things happen together.

Externally, building relationships and securing deals were crucial in my role. These soft skills are a finance must-have too. Whether you’re advising clients in private banking or large institutions and businesses in corporate and commercial banking, it’s all about understanding others’ needs and offering tailored solutions. Your people skills will play a significant role in your future success.

Finally, in terms of hard skills, Digital Business Developers need to wield a variety of tools to garner meaningful business insight and drive sales. In finance, you’ll likewise need to use models and analysis tools for similar goals: to assess the feasibility of your projects, study potential risks, and compare them to the rewards.

In a nutshell, my journey as a Digital Business Developer gives you a sneak peek into the “real world” of a business. It’s like having a backstage pass to understand how businesses run, the art of teamwork, and the tools to navigate the corporate maze. So, when you blend this with your finance studies at ESSEC, you’re not just learning about finance – you’re becoming the kind of finance professional who can thrive in any role in the industry.

Related posts on the SimTrade blog

   ▶ All posts about Professional experiences

   ▶ Louise PIZON My professional experience as a business developer at AJISO

   ▶ Jérémy PAULEN My Marketing Developer Experience

   ▶ Snehasish CHINARA My Experience as an External Junior Consultant with Eurogroup Consulting

Useful resources

Capture Europe

What is Digital Business Development

Marketing Strategies for Financial Services

About the author

The article was written in December 2023 by Michel Henry VERHASSELT (ESSEC Business School – Master in Finance, 2023-2025).

Risk comes from not knowing what you are doing

Risk comes from not knowing what you are doing

Michel Henry VERHASSELT

In this article, Michel Henry VERHASSELT (ESSEC Business School – Master in Finance, 2023-2025) comments on a quote by Warren Buffet about risk.

“Risk comes from not knowing what you are doing”

Analysis of the quote

Warren Buffett’s quote, “Risk comes from not knowing what you are doing,” encapsulates a fundamental principle of investing and decision-making. It underscores the significance of knowledge, research, and informed decision-making in managing risk.

One key aspect of this quote is the idea that risk is not solely a result of the inherent uncertainty in investments or ventures. Rather, risk is often the consequence of making decisions without a comprehensive understanding of the situation. In the world of finance and investing, not knowing the intricacies of an investment or the market can lead to hasty, ill-informed choices that carry a higher level of risk.

Moreover, this quote stresses the importance of education and continuous learning in risk management. To minimize risk, individuals need to invest time and effort in gaining knowledge and expertise within their chosen domain. For investors, this means understanding the companies or assets they invest in, analysing financial statements, and staying informed about market trends.

In a broader context, this quote is not limited to finance; it applies to various aspects of life. In personal life just as in business, forgoing the careful analysis of the potential consequences of one’s actions can lead to very negative outcomes. Decisions made in haste, out of anger, excitement, disappointment, and other strong emotions generally tend to be mistakes. Patience and forethought tend to be rewarded.

In essence, Warren Buffett’s quote reminds us that risk is not an abstract force beyond our control. It is, to a significant extent, a product of our knowledge and decisions. By equipping ourselves with information, staying well-informed, and making deliberate choices, we can effectively manage and mitigate risk in both our financial and personal pursuits.

About the author

Warren Buffett is a renowned American investor and CEO of Berkshire Hathaway, known for his value investing approach and philanthropic efforts. His net worth consistently places him among the world’s wealthiest individuals. However, he is equally renowned for his commitment to philanthropy, pledging the majority of his fortune to charitable causes, primarily through the Bill & Melinda Gates Foundation. Buffett’s influence extends far beyond the financial world, making him a respected figure in both business and philanthropy. His life and career continue to inspire countless investors and entrepreneurs worldwide.

Financial concepts related to the quote

Risk management

Of course, the concept most directly related to the quote is risk management. That is perhaps the most fundamental concept of finance. We are dealing with unknowns, probabilities, and expectations. We must make sure that, through careful analysis, we eliminate as much downside potential as possible: that is the only way to guarantee long-term survival (and a fortiori, long-term success). This goal can only be achieved once a thorough understanding is reached of the assets and markets we invest in, and the people we invest or transact with. Without such an understanding, we create unnecessary risk and that will almost assuredly lead to financial losses sooner or later.

Due diligence

The quote underscores the significance of “knowing what you are doing”. In finance, we call this conducting due diligence. It involves comprehensive research and analysis before making any financial commitment. This includes examining a company’s financials, understanding market dynamics, and evaluating potential investments. Without proper due diligence, individuals may enter financial ventures blindly, exposing themselves to significant risks.

Portfolio diversification

One of the ways in which we mitigate risk is portfolio diversification. When we add assets to our portfolio, we want to reduce or eliminate the risk that comes with exposure to one specific investment, while keeping as much of the return as possible. The concept of beta directly stems from the idea of portfolio diversification. By sticking to a single asset, you are entirely and solely exposed to its volatility; by wholly diversifying your portfolio, you are theoretically reproducing the entire market, making your beta equal to 1, or in other words turning your risk exposure into the market risk. In conclusion, portfolio diversification is a fundamental strategy for risk mitigation in investment, and closely aligns with the quote’s meaning.

My opinion about this quote

In my opinion, Warren Buffett was talking about investing and not trading. However, as my experience and interests are closer to trading than investing, I see it as a useful quote within that context.

Firstly, let’s talk about stop-losses. They’re your safety net. You set them at a certain point where, if the trade goes sour, you bail out. But if you don’t know why you’re placing a stop-loss at a particular level, it’s like playing darts blindfolded. You might hit the target, but it’s mostly luck. Understanding the underlying reasons for your stop-losses is crucial. It’s not just a random number; it’s based on your analysis.

Managing position size is another important element to consider. If you don’t know what you’re doing, you might risk your entire account on a single, promising, trade, much like going all-in on a hand of poker simply because you were dealt a pair of aces. Position sizing is about controlling risk. You need to understand how much you can afford to lose and then adjust your position size accordingly. If you don’t, you’re setting yourself up for potential disaster. It’s important to remember you never know the market, you simply might sometimes guess better than others. Outside of arbitrage or insider trading, certainty does not exist in trading; hence, position size should always be managed intelligently.

Hedging is also related to this quote. A hedge is a plan B. If you are long on a stock, and you are not certain which direction the market will take, you can reduce your risk by creating another position with options or other derivatives. But, if you don’t know how these instruments work or why you’re using them, it’s like having a spare tire but not knowing how to change it. You might end up with two flat tires instead of one.

Lastly, getting an edge on the market. Ultimately this is what every trader claims to be able to do. It boils down, almost entirely, to risk management. You must know your strategy inside out, and you must know exactly what you plan to do if you don’t get this expected edge out of your trade. In this way, over the long run, you can have either a majority of winning trades of equal sizes, or winning trades that outweigh the losing ones in terms of net gain. To have an edge, you need to understand why your approach works, when it might not, and continuously adapt.

In short, in trading and more generally in finance, ignorance isn’t bliss; it’s a one-way ticket to risk.

Why should I be interested in this post?

A finance student should be interested in this post because risk is the single most important concept to understand both in finance and in business. In this post, I believe I have made this concept compelling for students by going beyond theory. My post is also practical. It talks about real-world applications like setting stop-losses, managing position size, and hedging with financial products. These are the tools used daily by finance professionals in capital markets.

Furthermore, finance is all about making sound decisions, and you can’t do that effectively without understanding how to control and mitigate risk. What’s even more interesting is that it clarifies a common misconception. It tells you that gaining an edge in the financial market isn’t about having secret knowledge. It’s understanding your approach and the markets you’re dealing with. Being aware of the importance of risk management is therefore crucial for a wide range of careers and that is why a finance student should take an interest in it.

Related posts on the SimTrade blog

   ▶ All posts about Quotes

   ▶ Federico DE ROSSI The Power of Patience: Warren Buffett’s Advice on Investing in the Stock Market

   ▶ Rayan AKKAWI Warren Buffet and his basket of eggs

   ▶ Jianen HUANG It’s not whether you’re right or wrong

   ▶ Clara PINTO Investment is a flighty bird which needs to be controlled

Useful resources

Are Stop-Losses Necessary?

Diversifying your portfolio with a lower net worth

Sharpe’s classic 1964 article on CAPM

About the author

The article was written in December 2023 by Michel Henry VERHASSELT (ESSEC Business School – Master in Finance, 2023-2025).