Solana: Ascendancy of the High-Speed Blockchain 

 Snehasish CHINARA

In this article, Snehasish CHINARA (ESSEC Business School, Grande Ecole Program – Master in Management, 2022-2024) explains the evolution of high performance blockchain powered cryptocurrency, Solana.

Historical context and background

Solana, a relatively new entrant in the cryptocurrency arena, emerged against the backdrop of an increasingly crowded and competitive landscape in the digital currency space. Founded in 2020 by Anatoly Yakovenko, a former engineer at Qualcomm, Solana sought to address some of the inherent scalability and speed limitations plaguing earlier blockchain platforms like Ethereum. The platform is named after the Solana Beach in California, where Yakovenko often surfed, symbolizing the project’s ambition to ride the waves of innovation and technological advancement.

Unlike many other cryptocurrencies that primarily rely on Proof of Work (PoW) or Proof of Stake (PoS) consensus mechanisms, Solana introduced a novel consensus mechanism known as Proof of History (PoH). This mechanism aims to optimize transaction processing speed by organizing transactions into a series of chronological events, enabling parallel transaction processing, and significantly enhancing scalability. Solana’s emphasis on scalability and throughput has positioned it as a promising platform for decentralized applications (dApps) and decentralized finance (DeFi) projects seeking high-performance blockchain infrastructure. Its innovative approach has garnered attention and support from investors and developers alike, propelling Solana into the spotlight as one of the leading contenders in the cryptocurrency space.

Solana Logo

Source: Google.

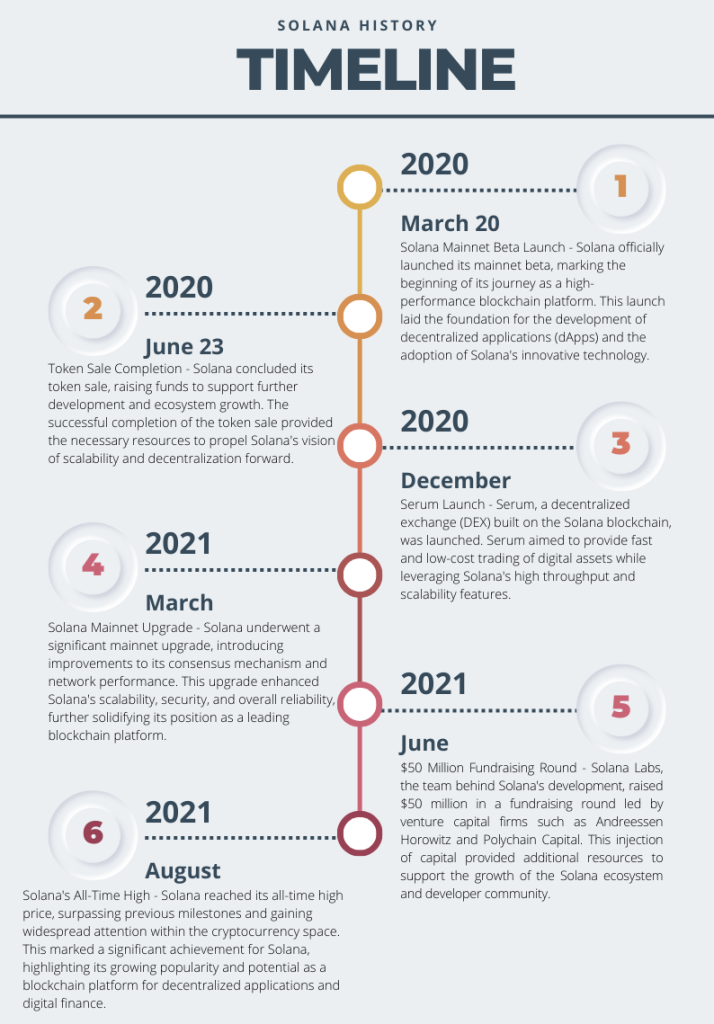
Figure 1. Key Dates in Solana History.

Source: Yahoo! Finance.

Key features

    Scalability

    Solana is designed to be highly scalable, capable of processing thousands of transactions per second. Its unique consensus mechanism, Proof of History (PoH), combined with a network of nodes running parallel processing, enables Solana to handle a high throughput of transactions efficiently.

    Fast Transaction Speeds

    With its focus on scalability, Solana boasts incredibly fast transaction speeds. Transactions can be confirmed in milliseconds, making it suitable for applications requiring rapid transaction processing, such as decentralized finance (DeFi) platforms and high-frequency trading.

    Low Transaction Costs

    Solana aims to keep transaction costs low, even during periods of high network activity. Its efficient use of resources and high throughput allow for cost-effective transactions, making it accessible to users and developers alike.

    Proof of History (PoH)

    Solana’s unique consensus mechanism, PoH, serves as a historical record for the ordering and time-stamping of transactions. By leveraging PoH, Solana achieves high throughput without sacrificing decentralization or security.

    Support for Smart Contracts

    Solana is compatible with smart contracts, allowing developers to build decentralized applications (dApps) and execute programmable transactions on the blockchain. It supports smart contract languages like Rust and Solidity, enabling a wide range of developers to build on the platform.

    Ecosystem and Development Tools

    Solana boasts a growing ecosystem of projects and development tools to support developers in building decentralized applications. Its developer-friendly environment includes tools such as Solana Studio, a web-based IDE for building and deploying smart contracts, and libraries for interacting with the Solana blockchain.

    Interoperability

    Solana is designed to be interoperable with other blockchains and protocols, facilitating seamless communication and asset transfer between different networks. This interoperability opens up possibilities for cross-chain decentralized applications and enhances the overall utility of the Solana ecosystem.

Use cases

    Non-Fungible Tokens (NFTs)

    Solana provides an efficient infrastructure for minting, trading, and storing NFTs. Artists, creators, and collectors are utilizing Solana-based marketplaces like Solanart to buy and sell digital collectibles, artwork, and virtual assets. Solana’s high throughput enables seamless NFT transactions, while its low fees make it appealing for creators seeking an alternative to Ethereum’s congested network.

    Gaming and Virtual Worlds

    Solana’s high-performance blockchain is well-suited for gaming applications and virtual worlds that require fast transaction processing and scalability. Game developers are leveraging Solana’s infrastructure to create blockchain-based games, in-game assets, and decentralized gaming platforms. Projects like Star Atlas, a space-themed massively multiplayer online game (MMO) built on Solana, demonstrate the platform’s potential to disrupt the gaming industry.

    Decentralized Autonomous Organizations (DAOs)

    Solana provides a robust framework for building decentralized autonomous organizations (DAOs) that enable community governance and decision-making. DAOs on Solana leverage smart contracts to automate voting mechanisms, distribute governance tokens, and execute proposals transparently and efficiently. These DAOs empower communities to collectively manage and govern decentralized protocols, platforms, and resources.

    Tokenization of Real-World Assets

    Solana facilitates the tokenization of real-world assets such as real estate, stocks, and commodities, enabling fractional ownership and increased liquidity. Projects are exploring Solana’s blockchain to tokenize and trade various asset classes, unlocking new investment opportunities and reducing barriers to entry for traditional markets.

Technology and underlying blockchain

At the core of Solana’s architecture is the Proof of History (PoH) consensus mechanism, which orders transactions before they are processed into blocks. This deterministic sequencing allows for parallel transaction processing and enhances overall network efficiency. Additionally, Solana utilizes a Byzantine Fault Tolerance (BFT) consensus algorithm called Tower BFT, which further ensures network security and integrity.

Solana’s blockchain implements a novel data structure known as the “Solana Architecture,” which includes a combination of a single global state, a high-speed networking stack, and a high-performance virtual machine (VM). This architecture enables Solana to achieve impressive transaction throughput, with the capability to process thousands of transactions per second (TPS) and sub-second transaction finality. Furthermore, Solana leverages a unique mechanism called “Turbine” to optimize block propagation and reduce network latency, enhancing the overall scalability and performance of the platform.

The Solana ecosystem also features a built-in decentralized exchange (DEX), supporting seamless token swaps and liquidity provision directly on-chain. Smart contracts on Solana are executed using a high-performance VM called Sealevel, which is designed to efficiently process complex computations while maintaining low transaction costs. Overall, Solana’s technology stack, comprising innovative consensus mechanisms, advanced data structures, and optimized networking protocols, positions it as a leading blockchain platform capable of supporting a wide range of decentralized applications (dApps) and use cases at scale.

Supply of coins

Solana (SOL) operates on a fixed supply model, with a maximum supply of 489,026,837 SOL tokens. Unlike traditional fiat currencies, Solana’s tokenomics are governed by the principles of cryptocurrency protocols. The initial distribution of SOL tokens occurred through a combination of token sales, strategic partnerships, ecosystem incentives, and network validators’ rewards. Notably, Solana employs a deflationary economic model, wherein a portion of transaction fees is burned, reducing the overall token supply over time. This deflationary mechanism is designed to counterbalance any potential inflationary pressures as the network expands, ensuring the long-term sustainability and scarcity of SOL tokens. Additionally, SOL tokens are used to facilitate various functions within the Solana ecosystem, including transaction fees, staking rewards, governance participation, and decentralized application interactions. As Solana continues to grow and gain adoption, the controlled and predictable token supply dynamics play a crucial role in maintaining the network’s integrity and value proposition.

Historical data for Solana

How to get the data?

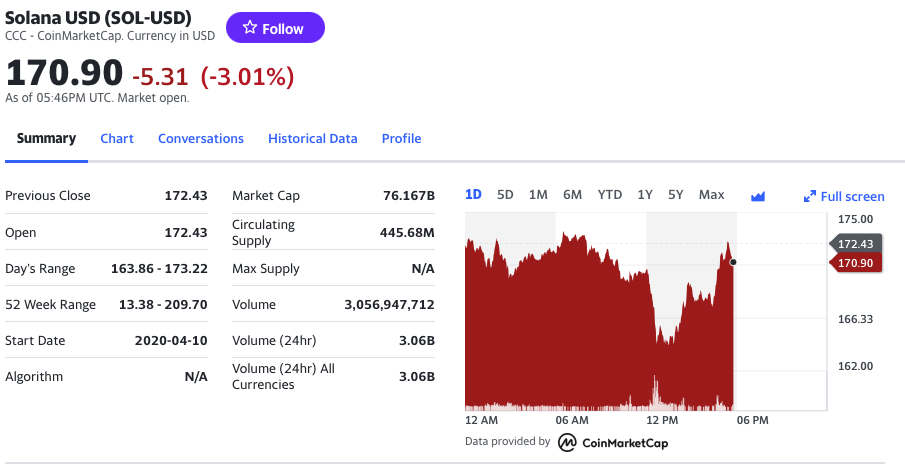
The Solana (SOL) is a popular cryptocurrency on the market, and historical data for the Solana such as prices and volume traded can be easily downloaded from the internet sources such as Yahoo! Finance, Blockchain.com & CoinMarketCap. For example, you can download data for Solana on Yahoo! Finance (the Yahoo! code for Solana is SOL-USD).

Figure 2. Solana data

Source: Yahoo! Finance.

Historical data for the Solana market prices

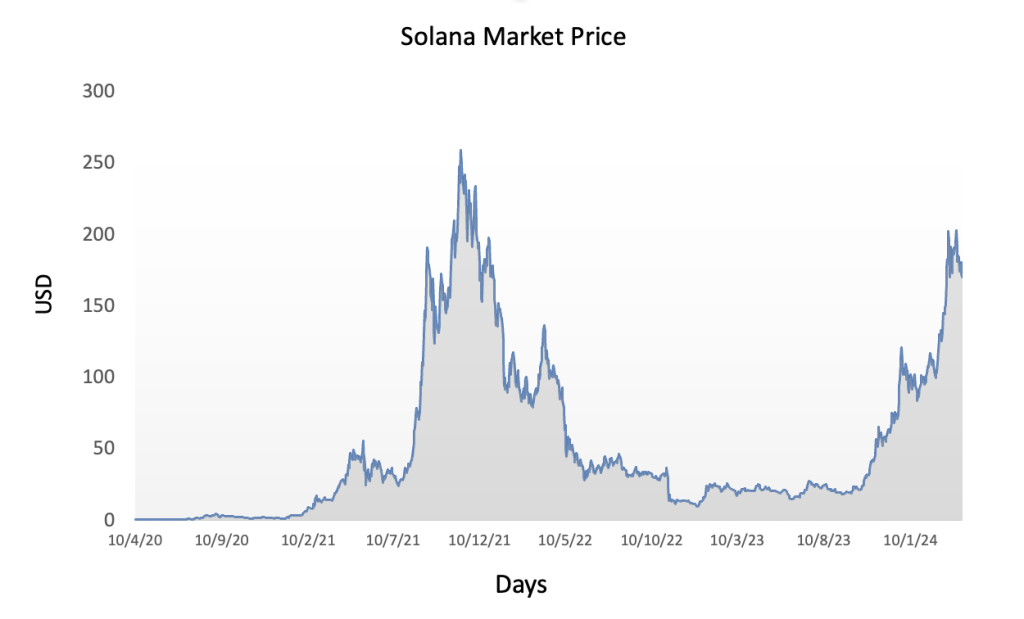
The historical data for Solana market prices demonstrates a dynamic evolution marked by significant fluctuations and notable trends since its inception. Initially, SOL experienced modest trading activity and price levels, but as Solana gained recognition for its innovative blockchain architecture and scalability features, its market value began to ascend. Early adopters and investors drove demand for SOL tokens, leading to periods of rapid appreciation interspersed with corrections and consolidation phases. Milestones such as protocol upgrades, partnerships, and successful dApp launches often coincided with significant price movements. Moreover, broader market trends and sentiment towards cryptocurrencies influenced SOL’s price dynamics, contributing to both bullish and bearish cycles over time. Overall, SOL’s price trajectory reflects Solana’s journey from its early stages to becoming a prominent player in the blockchain space, highlighting its potential to revolutionize decentralized applications and digital finance despite the inherent volatility of the cryptocurrency market.

Figure 3 below represents the evolution of the price of Solana (SOL) in US dollar over the period April 2020 – December 2023. The price corresponds to the “closing” price (observed at 10:00 PM CET at the end of the month).

Figure 3. Evolution of the Solana (SOL) price

Source: Yahoo! Finance.

R program

The R program below written by Shengyu ZHENG allows you to download the data from Yahoo! Finance website and to compute summary statistics and risk measures about the Solana (SOL).

Download R file

The R program that you can download above allows you to download the data for the Solana (SOL) from the Yahoo! Finance website. The database starts on April, 2020.

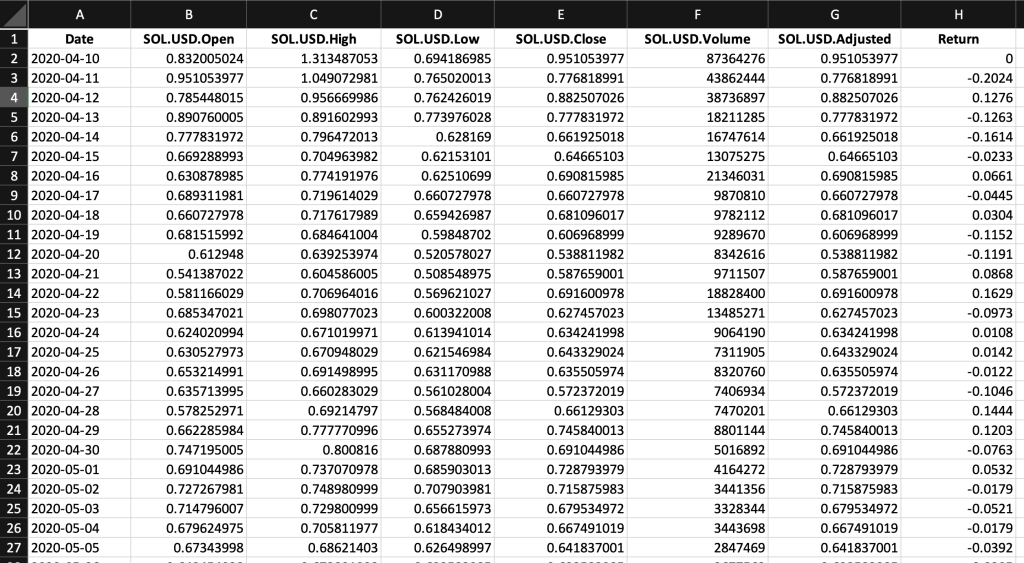
Table 1 below represents the top of the data file for the Solana (SOL) downloaded from the Yahoo! Finance website with the R program.

Table 1. Top of the data file for the Solana (SOL)

Source: computation by the author (data: Yahoo! Finance website).

Python code

You can download the Python code used to download the data from Yahoo! Finance.

Download the Python code for USD Coin data

Python script to download Solana (SOL) historical data and save it to an Excel sheet::

import yfinance as yf

import pandas as pd

# Define the ticker symbol for Solana Coin

SOL_ticker = “SOL-USD”

# Define the date range for historical data

start_date = “2020-01-01”

end_date = “2022-01-01”

# Download historical data using yfinance

SOL_data = yf.download(SOL_ticker, start=start_date, end=end_date)

# Create a Pandas DataFrame from the downloaded data

doge_df = pd.DataFrame(SOL_data)

# Define the Excel file path

excel_file_path = “SOL_historical_data.xlsx”

# Save the data to an Excel sheet

SOL_df.to_excel(excel_file_path, sheet_name=”SOL_historical_data”)

print(f”Data saved to {excel_file_path}”)

# Make sure you have the required libraries installed and adjust the “start_date” and “end_date” variables to the desired date range for the historical data you want to download.

Evolution of the Solana (SOL)

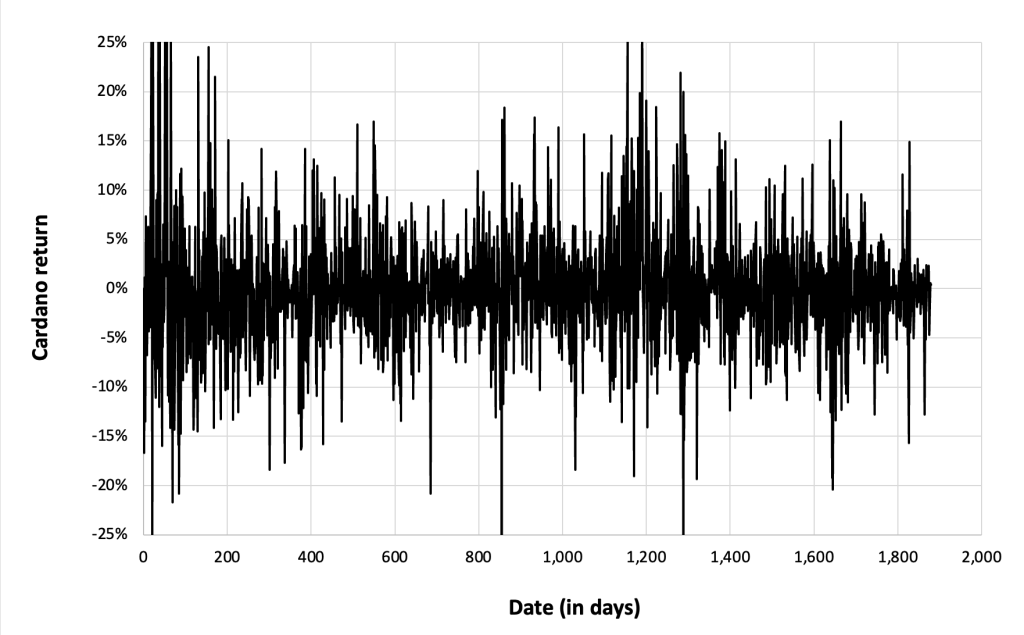
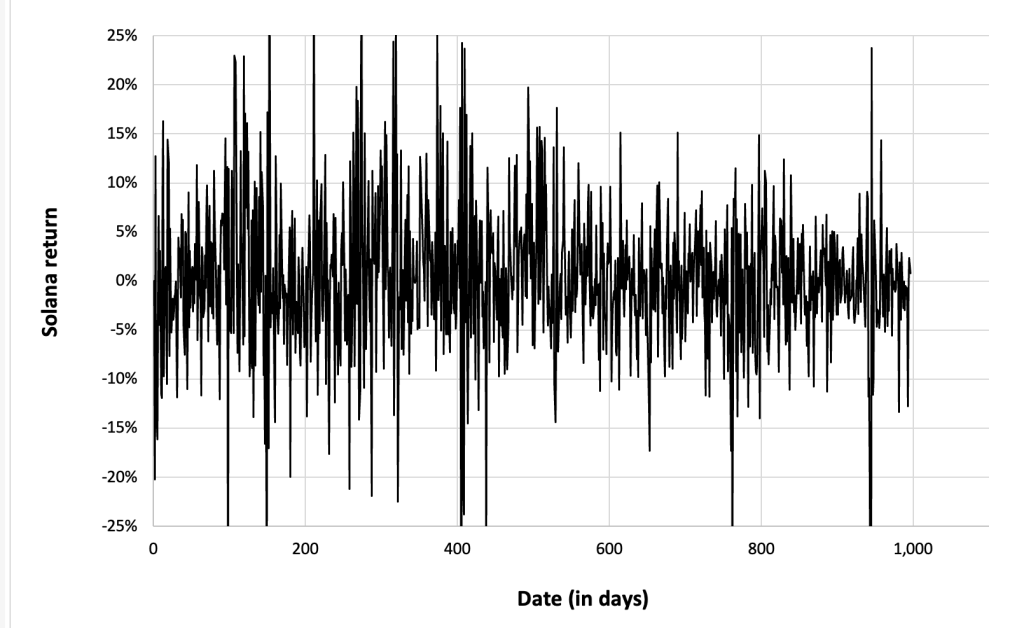
Figure 4 below gives the evolution of the Solana (SOL) returns from April, 2020 to December 31, 2023 on a daily basis.

Figure 4. Evolution of the Solana (SOL) returns.

Source: computation by the author (data: Yahoo! Finance website).

Summary statistics for the Solana (SOL)

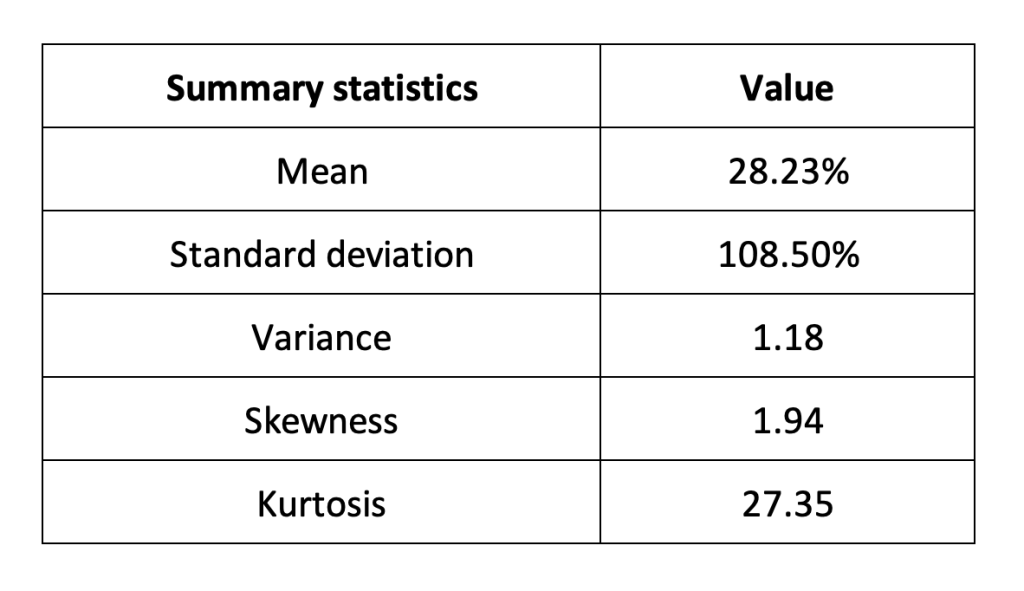
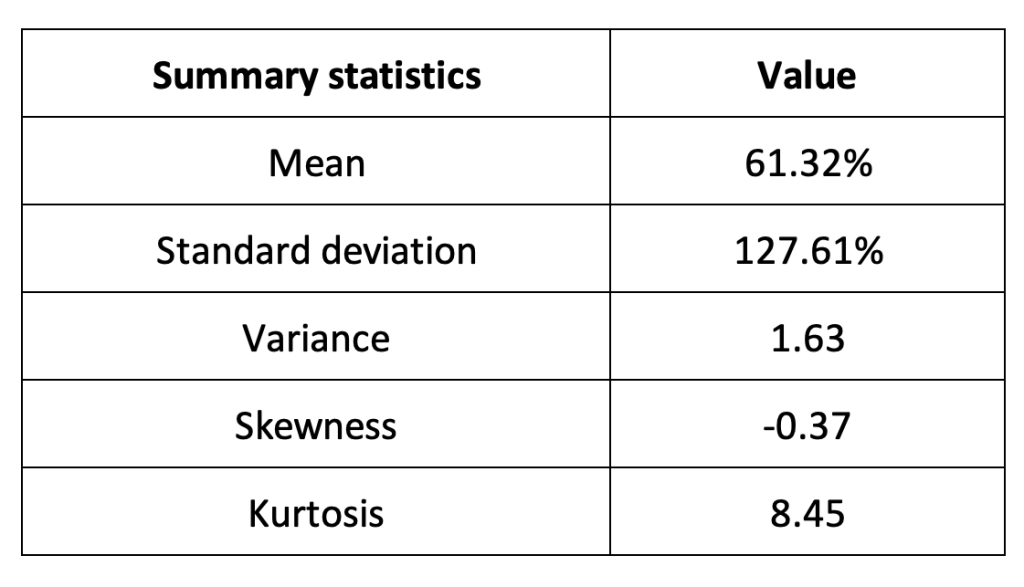
The R program that you can download above also allows you to compute summary statistics about the returns of the Solana (SOL). Table 2 below presents the following summary statistics estimated for the Solana (SOL):

  • The mean
  • The standard deviation (the squared root of the variance)
  • The skewness
  • The kurtosis.

The mean, the standard deviation / variance, the skewness, and the kurtosis refer to the first, second, third and fourth moments of statistical distribution of returns respectively.

Table 2. Summary statistics for Solana (SOL).

Source: computation by the author (data: Yahoo! Finance website).

Statistical distribution of the Solana (SOL) returns

Historical distribution

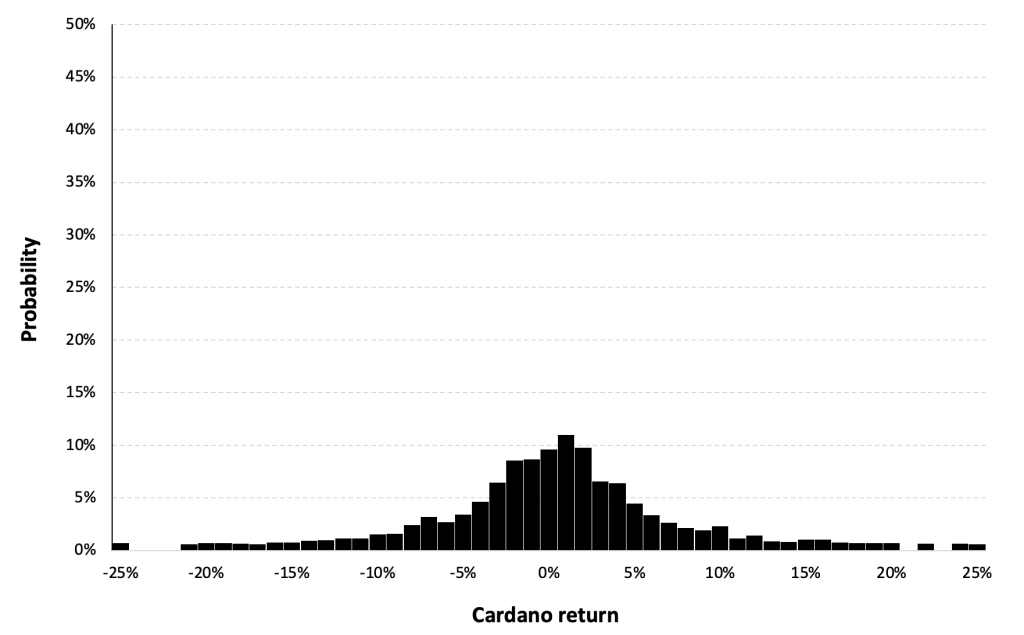
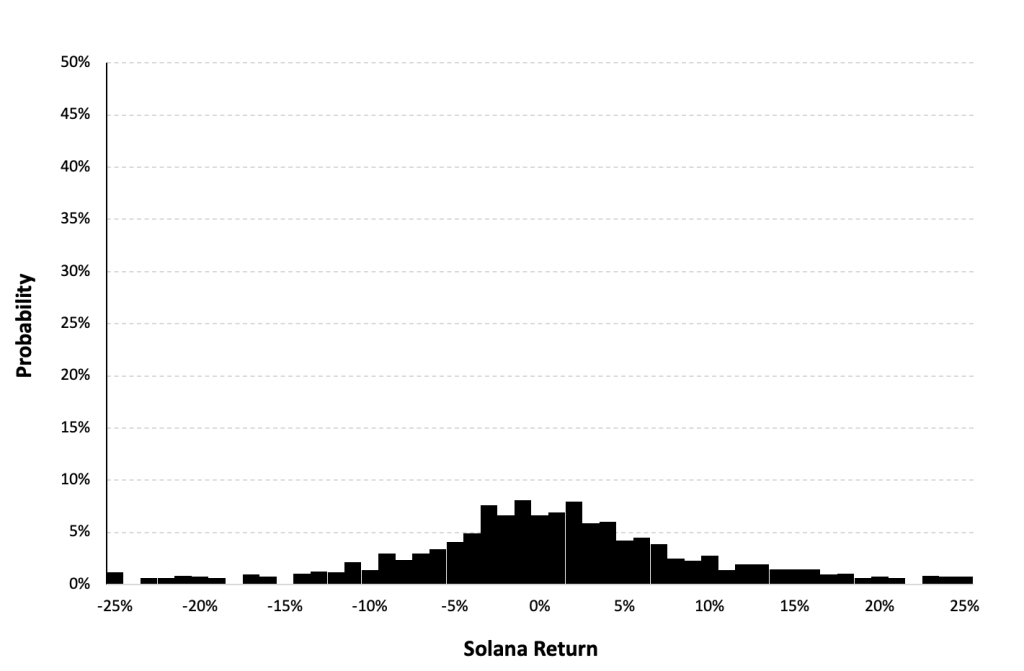
Figure 5 represents the historical distribution of the Solana (SOL) daily returns for the period from April, 2020 to December 31, 2023.

Figure 5. Historical Solana (SOL) distribution of the returns.

Source: computation by the author (data: Yahoo! Finance website).

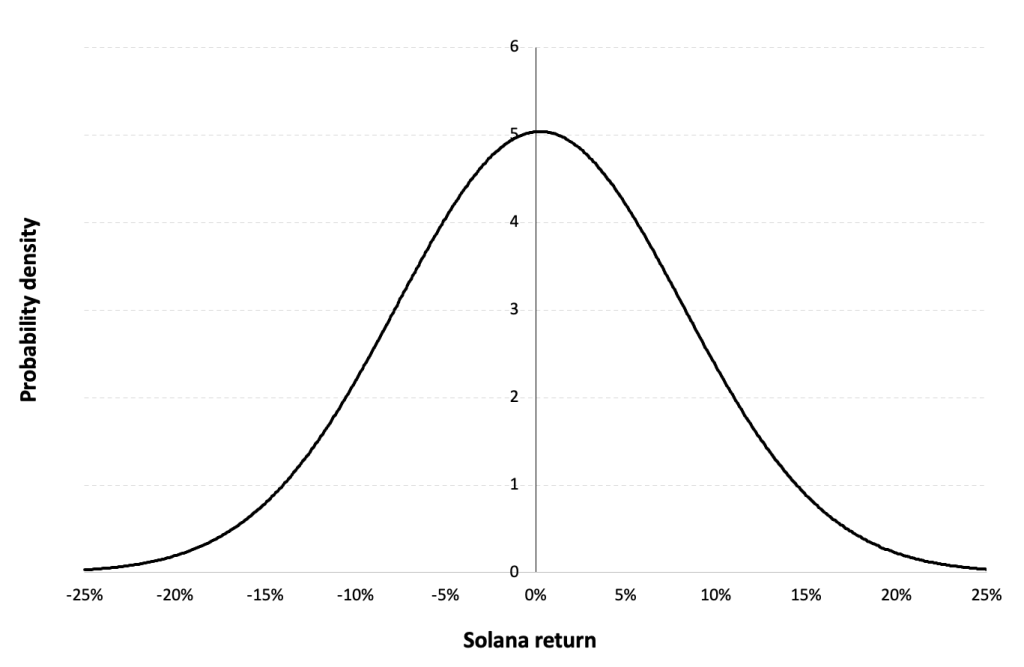
Gaussian distribution

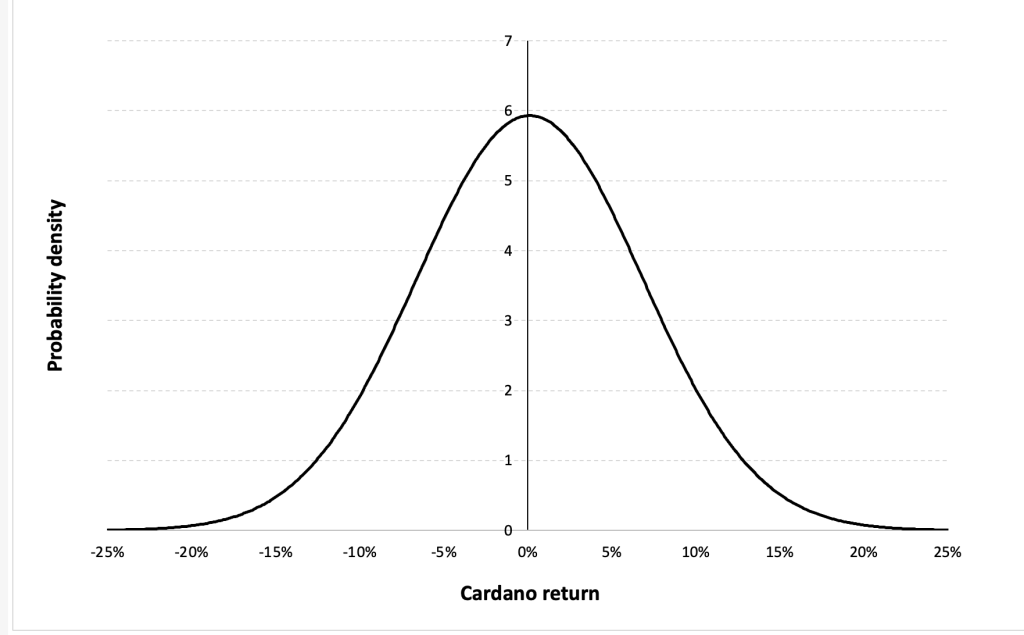
The Gaussian distribution (also called the normal distribution) is a parametric distribution with two parameters: the mean and the standard deviation of returns. We estimated these two parameters over the period from April, 2020 to December 31, 2023.

Figure 6 below represents the Gaussian distribution of the Solana (SOL) daily returns with parameters estimated over the period from April, 2020 to December, 2023.

Figure 6. Gaussian distribution of the Solana (SOL) returns.

Source: computation by the author (data: Yahoo! Finance website).

Risk measures of the Solana (SOL) returns

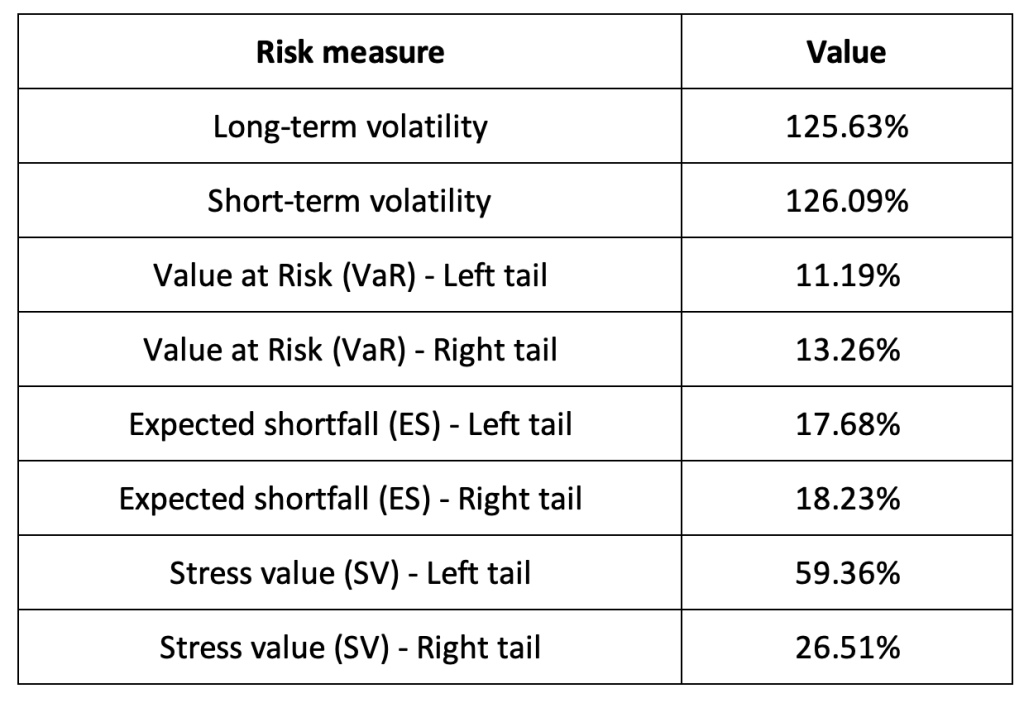
The R program that you can download above also allows you to compute risk measures about the returns of the Solana (SOL).

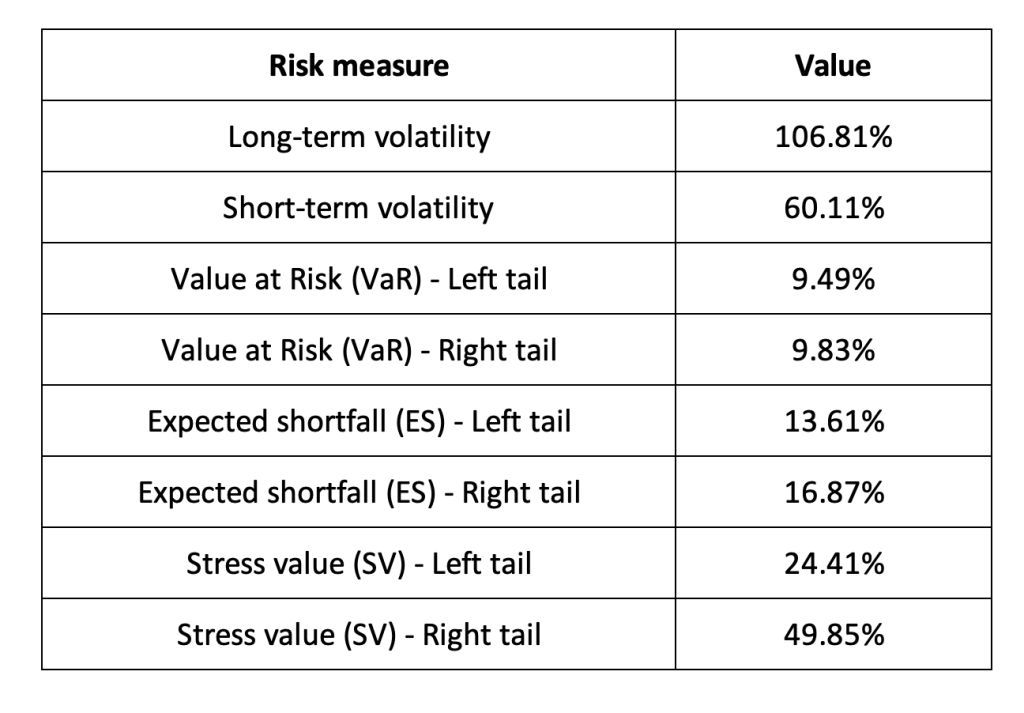
Table 3 below presents the following risk measures estimated for the Solana (SOL):

  • The long-term volatility (the unconditional standard deviation estimated over the entire period)
  • The short-term volatility (the standard deviation estimated over the last three months)
  • The Value at Risk (VaR) for the left tail (the 5% quantile of the historical distribution)
  • The Value at Risk (VaR) for the right tail (the 95% quantile of the historical distribution)
  • The Expected Shortfall (ES) for the left tail (the average loss over the 5% quantile of the historical distribution)
  • The Expected Shortfall (ES) for the right tail (the average loss over the 95% quantile of the historical distribution)
  • The Stress Value (SV) for the left tail (the 1% quantile of the tail distribution estimated with a Generalized Pareto distribution)
  • The Stress Value (SV) for the right tail (the 99% quantile of the tail distribution estimated with a Generalized Pareto distribution)

Table 3. Risk measures for the Solana (SOL).

Source: computation by the author (data: Yahoo! Finance website).

The volatility is a global measure of risk as it considers all the returns. The Value at Risk (VaR), Expected Shortfall (ES) and Stress Value (SV) are local measures of risk as they focus on the tails of the distribution. The study of the left tail is relevant for an investor holding a long position in the Solana (SOL) while the study of the right tail is relevant for an investor holding a short position in the Solana (SOL).

Why should I be interested in this post?

This blog offers an engaging exploration into a cryptocurrency that transcends traditional finance, appealing to a wide audience due to its cultural relevance, investment potential, and vibrant community. Solana’s reputation for high performance in blockchain technology, boasting the capability to process thousands of transactions per second, makes it an appealing option for developers and users seeking efficient transaction processing. Moreover, staying updated on Solana can offer insights into the growth of its ecosystem, including the development of decentralized applications (dApps) and strategic partnerships. For investors, Solana’s increasing popularity and ecosystem growth may signal investment opportunities, making it worthwhile to track news and discussions surrounding the platform. Additionally, Solana’s innovative technical advancements in scalability, consensus mechanisms, and developer tools are of interest to those intrigued by blockchain technology. Engaging with the Solana community provides opportunities for networking and gaining valuable insights into this rapidly expanding ecosystem.

Related posts on the SimTrade blog

About cryptocurrencies

   ▶ Snehasish CHINARA Bitcoin: the mother of all cryptocurrencies

   ▶ Snehasish CHINARA How to get crypto data

   ▶ Alexandre VERLET Cryptocurrencies

About statistics

   ▶ Shengyu ZHENG Moments de la distribution

   ▶ Shengyu ZHENG Mesures de risques

   ▶ Jayati WALIA Returns

Useful resources

Academic research about risk

Longin F. (2000) From VaR to stress testing: the extreme value approach Journal of Banking and Finance, N°24, pp 1097-1130.

Longin F. (2016) Extreme events in finance: a handbook of extreme value theory and its applications Wiley Editions.

Data

Yahoo! Finance

Yahoo! Finance Historical data for Solana

CoinMarketCap Historical data for Solana

About the author

The article was written in April 2024 by Snehasish CHINARA (ESSEC Business School, Grande Ecole Program – Master in Management, 2022-2024).

Doge Coin: Unraveling the Phenomenon of the Internet’s Favourite Cryptocurrency

In this article, Snehasish CHINARA (ESSEC Business School, Grande Ecole Program – Master in Management, 2022-2024) explains the evolution of the most popular memecoin, Dogecoin.

 Snehasish CHINARA

Historical context and background

Dogecoin, a cryptocurrency that started as a joke, quickly evolved into a significant player in the world of digital assets. Created in December 2013 by software engineers Billy Markus and Jackson Palmer, Dogecoin was initially intended to satirize the hype surrounding cryptocurrencies at the time. The coin’s logo features the Shiba Inu dog from the “Doge” meme, which was immensely popular on the internet during that period. Despite its humorous origins, Dogecoin gained traction due to its welcoming and inclusive community, as well as its low transaction fees and fast confirmation times.

The early days of Dogecoin saw rapid adoption and a vibrant online community rallying around the coin. It gained attention for its philanthropic efforts, including fundraising campaigns to sponsor charity events and support causes such as building water wells in developing countries and sponsoring Olympic athletes. These initiatives helped distinguish Dogecoin from other cryptocurrencies and fostered a sense of community among its users.

Over time, Dogecoin’s popularity continued to grow, fueled in part by endorsements from notable figures such as Elon Musk, who frequently tweeted about the coin, further amplifying its visibility. Despite facing occasional security issues and challenges, Dogecoin has persevered, becoming one of the most recognized and traded cryptocurrencies in the market. Its unique blend of humor, community spirit, and accessibility has endeared it to a wide range of users, making it a significant player in the ever-expanding crypto landscape.

Doge Coin Logo

Source: Yahoo! Finance.

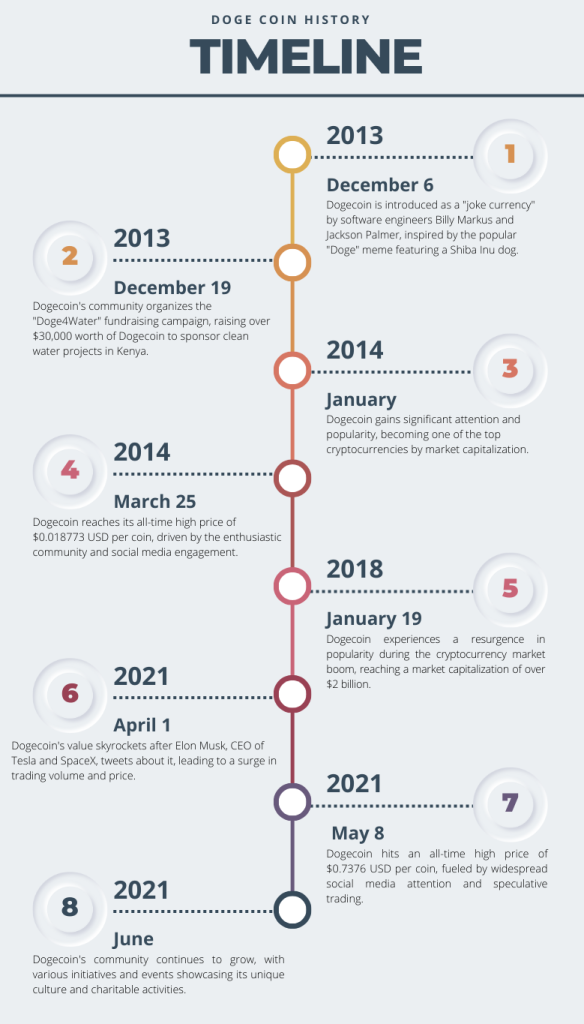
Figure 1. Key Dates in Doge Coin History

Source: Yahoo! Finance .

Key features

    Decentralization

    Like most cryptocurrencies, Dogecoin operates on a decentralized network, meaning it is not controlled by any single entity or organization. Transactions are recorded on a public ledger known as the blockchain, which is maintained by a network of nodes.

    Scrypt Algorithm

    Dogecoin uses the Scrypt algorithm for its proof-of-work consensus mechanism, which is less energy-intensive compared to Bitcoin’s SHA-256 algorithm. This allows for greater accessibility to mining for individuals with standard computer hardware.

    Fast Transactions

    Dogecoin boasts relatively fast transaction times, with blocks being mined approximately every minute. This makes it suitable for quick and efficient transfers of value.

    Low Transaction Fees

    Transaction fees on the Dogecoin network are typically minimal, making it cost-effective for transferring even small amounts of value.

    Meme Culture

    Dogecoin’s branding and marketing heavily leverage internet meme culture, particularly the “Doge” meme featuring the Shiba Inu dog. This playful and approachable branding sets Dogecoin apart from other cryptocurrencies and contributes to its widespread appeal.

Use cases

    Tipping

    Dogecoin gained popularity early on for its use as a tipping currency on social media platforms like Reddit and Twitter. Users can easily send small amounts of Dogecoin to content creators or other users as a form of appreciation.

    Charitable Donations

    The Dogecoin community has a history of supporting charitable causes and disaster relief efforts. Dogecoin has been used to raise funds for various initiatives, including sponsoring athletes, funding clean water projects, and aiding during natural disasters.

    E-commerce

    Some online merchants and retailers accept Dogecoin as a form of payment for goods and services. This includes businesses ranging from small independent shops to larger e-commerce platforms.

    Micropayments

    Dogecoin’s low transaction fees and fast confirmation times make it suitable for micropayments, allowing users to easily transfer small amounts of value online.

    Community Engagement

    Dogecoin continues to serve as a vehicle for community engagement and participation. Its lighthearted and inclusive nature fosters a sense of camaraderie among its users, who often come together for events, fundraisers, and online discussions.

    Experimental Projects

    Developers and enthusiasts sometimes use Dogecoin for experimental projects or to explore new applications of blockchain technology. These projects can range from art and gaming to decentralized finance (DeFi) experiments.

Technology and underlying blockchain

Dogecoin operates on a blockchain-based technology similar to Bitcoin and many other cryptocurrencies. It employs a decentralized peer-to-peer network that relies on nodes spread across the globe to validate and record transactions. Dogecoin’s blockchain uses the Scrypt hashing algorithm, which was initially designed to facilitate quicker confirmation times compared to Bitcoin’s SHA-256 algorithm. This choice of algorithm allows for a more accessible mining process, enabling individuals with standard computer hardware to participate in securing the network and earning rewards. Transactions on the Dogecoin network are grouped into blocks, which are then added to the blockchain through a process known as mining. Miners compete to solve complex mathematical puzzles, and the first miner to solve a puzzle validates the transactions in a block and adds it to the blockchain. Dogecoin’s block time is approximately one minute, resulting in faster transaction confirmations compared to Bitcoin’s ten-minute block time. Additionally, Dogecoin originally had a limitless supply, with a fixed reward of 10,000 DOGE per block; however, this changed in 2014 to an inflationary model, where a fixed number of coins are added to the supply each year. This combination of technology and economic design contributes to Dogecoin’s unique characteristics and its appeal within the cryptocurrency ecosystem.

Supply of coins

Dogecoin’s supply dynamics are distinctive within the cryptocurrency landscape. Initially launched with no hard cap on its total supply, Dogecoin features an inflationary issuance model designed to maintain a steady influx of coins into the market. Unlike Bitcoin’s fixed supply of 21 million coins, Dogecoin’s issuance rate started at 5 billion coins per year and gradually decreases over time. This inflationary nature ensures a continuous supply of Dogecoin, theoretically allowing for ongoing miner rewards and a sustained incentive for network participation. However, it’s worth noting that while the supply of Dogecoin is technically infinite, the rate of new coin creation diminishes over time, resulting in a decreasing inflation rate and a more stable supply trajectory. This unique supply mechanism distinguishes Dogecoin from many other cryptocurrencies and can influence its long-term economic dynamics and utility as a medium of exchange or store of value.

Historical data for Doge Coin

How to get the data?

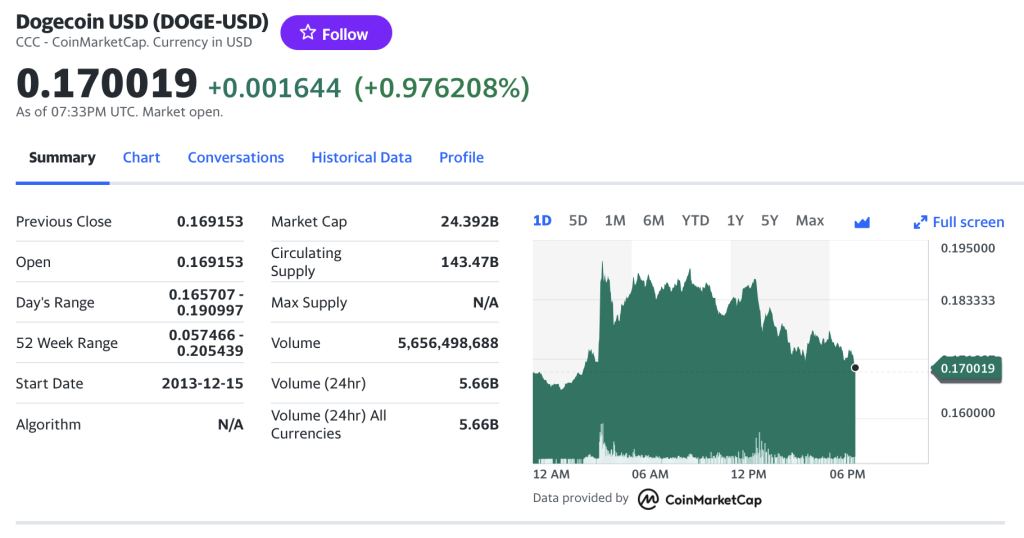
The Doge Coin is popular cryptocurrency on the market, and historical data for the Doge Coin such as prices and volume traded can be easily downloaded from the internet sources such as Yahoo! Finance, Blockchain.com & CoinMarketCap. For example, you can download data for Doge Coin on Yahoo! Finance (the Yahoo! code for Doge Coin is Doge-USD).

Figure 2. Doge Coin data

Source: Yahoo! Finance.

Historical data for the Doge Coin market prices

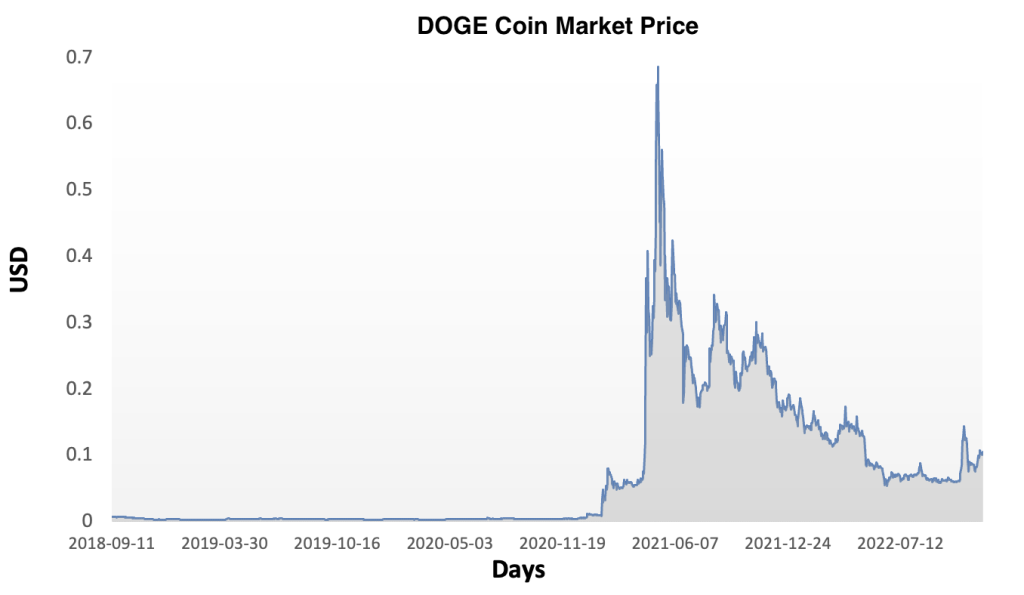
Since its inception in 2013, Dogecoin has experienced notable price fluctuations, driven by a combination of factors including market speculation, community engagement, and broader trends in the digital asset space. Initially launched as a joke currency, Dogecoin’s price remained relatively stable for several years, trading at fractions of a cent. However, its price surged dramatically in early 2021, fueled by social media hype and celebrity endorsements, reaching all-time highs of over 70 cents per coin. This unprecedented rally brought Dogecoin into the spotlight, attracting widespread attention from investors and media outlets. Despite subsequent price corrections, Dogecoin has maintained a prominent position in the cryptocurrency market, with its price influenced by various factors including Elon Musk’s tweets, meme culture, and broader market sentiment. Overall, the historical price evolution of Dogecoin exemplifies the volatile and dynamic nature of the cryptocurrency market, highlighting the interplay between community enthusiasm, market speculation, and broader industry trends.

Figure 3 below represents the evolution of the price of Doge Coin in US dollar over the period November 2018 – December 2022. The price corresponds to the “closing” price (observed at 10:00 PM CET at the end of the month).

Figure 3. Evolution of the Doge Coin price

Source: Yahoo! Finance.

R program

The R program below written by Shengyu ZHENG allows you to download the data from Yahoo! Finance website and to compute summary statistics and risk measures about the Doge Coin.

Download R file

Data file

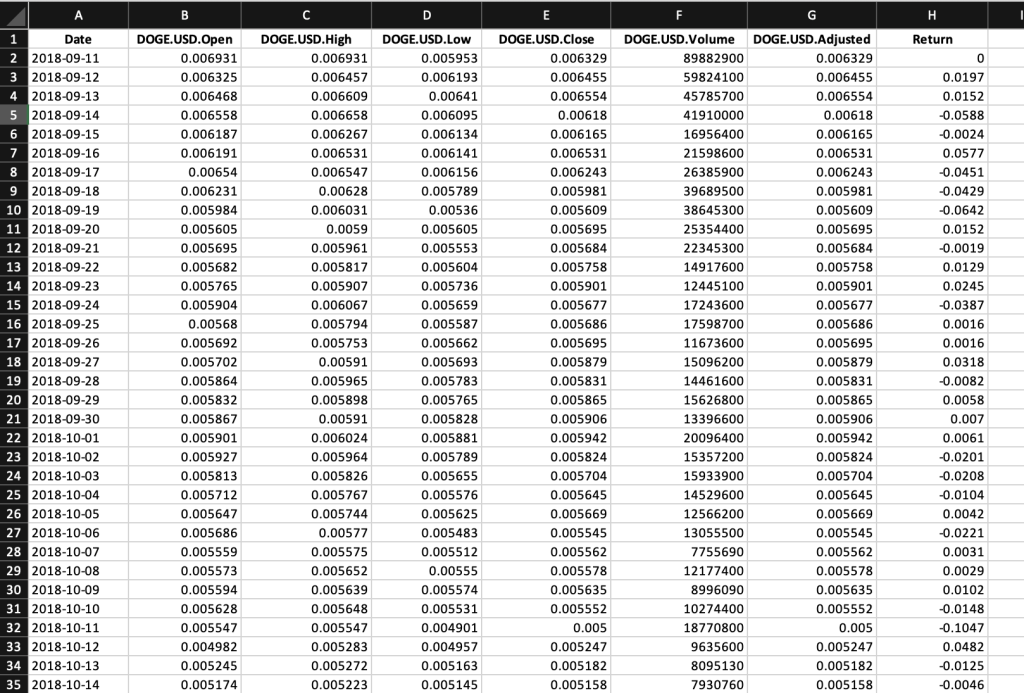
The R program that you can download above allows you to download the data for the Doge Coin from the Yahoo! Finance website. The database starts on October, 2018.

Table 1 below represents the top of the data file for the Doge Coin downloaded from the Yahoo! Finance website with the R program.

Table 1. Top of the data file for the DOGE Coin

Source: computation by the author (data: Yahoo! Finance website).

Python code

You can download the Python code used to download the data from Yahoo! Finance.

Download the Python code for USD Coin data

Python script to download Doge historical data and save it to an Excel sheet::

import yfinance as yf

import pandas as pd

# Define the ticker symbol for Doge Coin

doge_ticker = “DOGE-USD”

# Define the date range for historical data

start_date = “2020-01-01”

end_date = “2022-01-01”

# Download historical data using yfinance

doge_data = yf.download(doge_ticker, start=start_date, end=end_date)

# Create a Pandas DataFrame from the downloaded data

doge_df = pd.DataFrame(doge_data)

# Define the Excel file path

excel_file_path = “DOGE_historical_data.xlsx”

# Save the data to an Excel sheet

doge_df.to_excel(excel_file_path, sheet_name=”DOGE_historical_data”)

print(f”Data saved to {excel_file_path}”)

# Make sure you have the required libraries installed and adjust the “start_date” and “end_date” variables to the desired date range for the historical data you want to download

Evolution of the Doge Coin

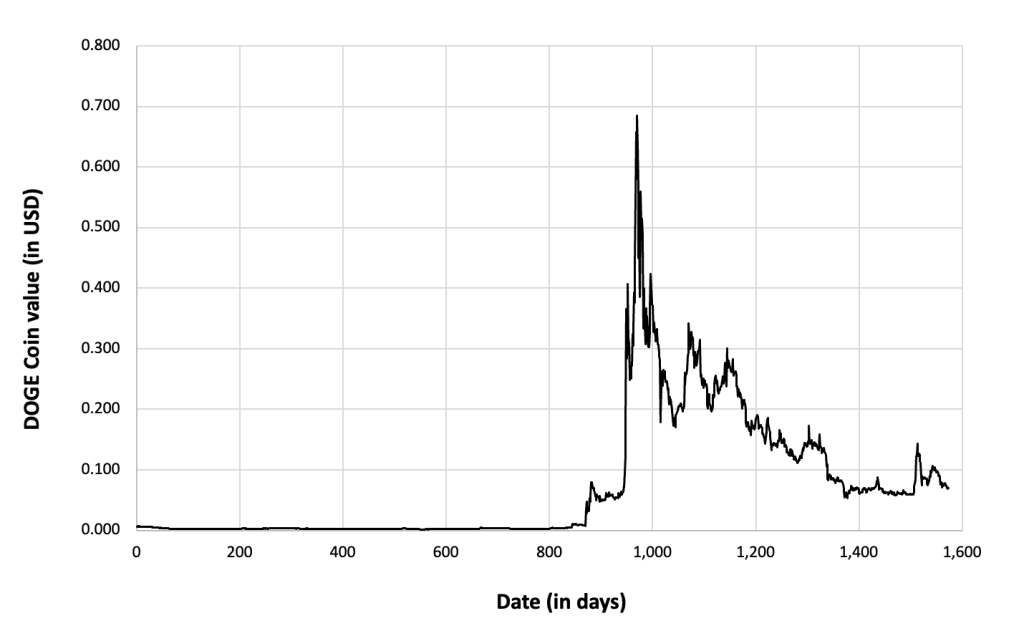
Figure 4 below gives the evolution of the Doge Coin on a daily basis.

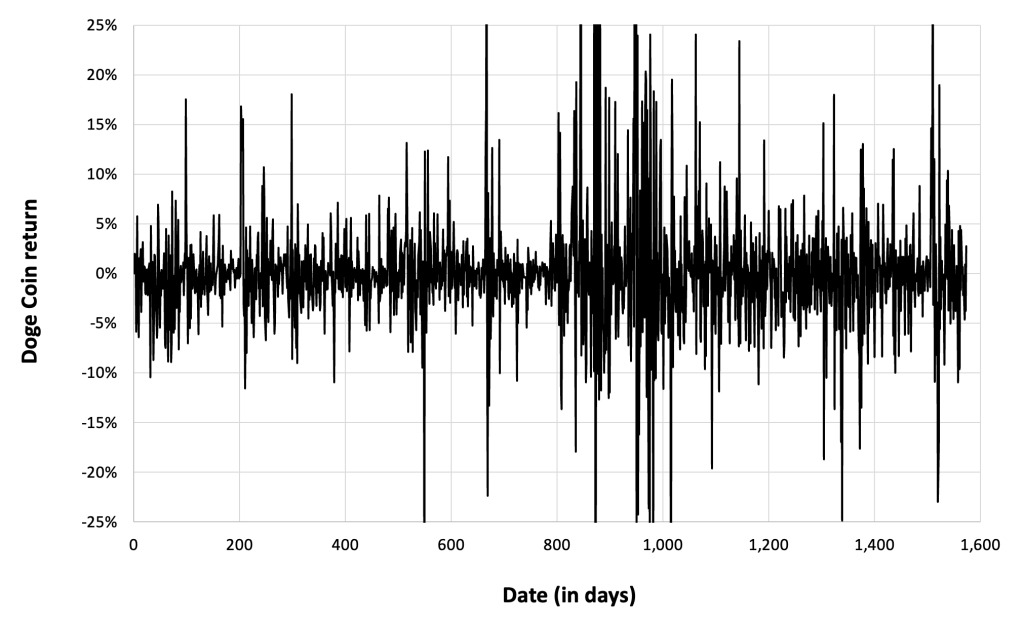
Figure 4. Evolution of the DOGE Coin Figure 5 below gives the evolution of the Doge Coin returns from November, 2018 to December 31, 2022 on a daily basis.

Figure 5. Evolution of the Doge Coin returns.

Source: computation by the author (data: Yahoo! Finance website).

Summary statistics for the Doge Coin

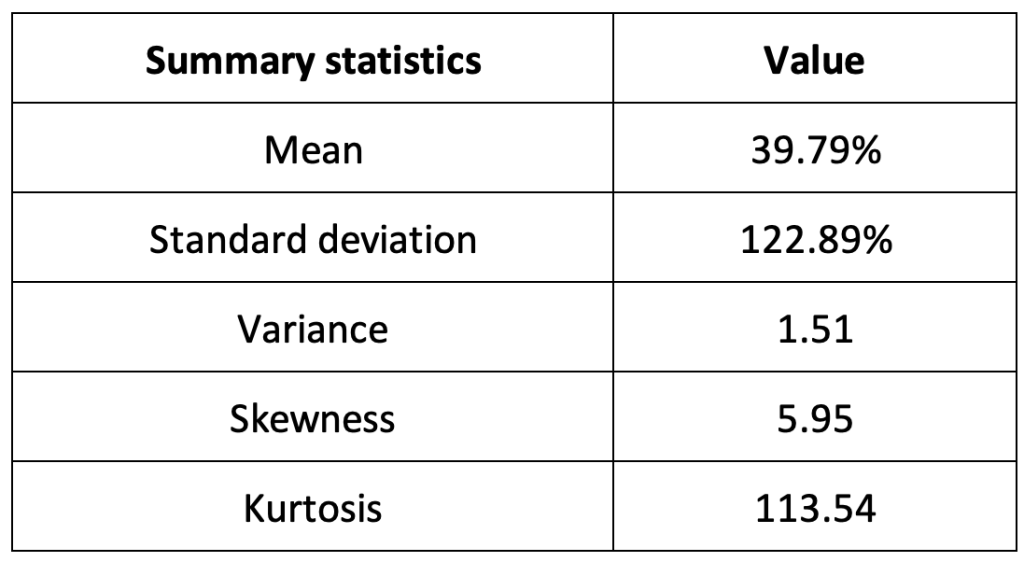
The R program that you can download above also allows you to compute summary statistics about the returns of the Doge Coin. Table 2 below presents the following summary statistics estimated for the Doge Coin:

  • The mean
  • The standard deviation (the squared root of the variance)
  • The skewness
  • The kurtosis.

The mean, the standard deviation / variance, the skewness, and the kurtosis refer to the first, second, third and fourth moments of statistical distribution of returns respectively.

Table 2. Summary statistics for Doge Coin.

Source: computation by the author (data: Yahoo! Finance website).

Statistical distribution of the Doge Coin returns

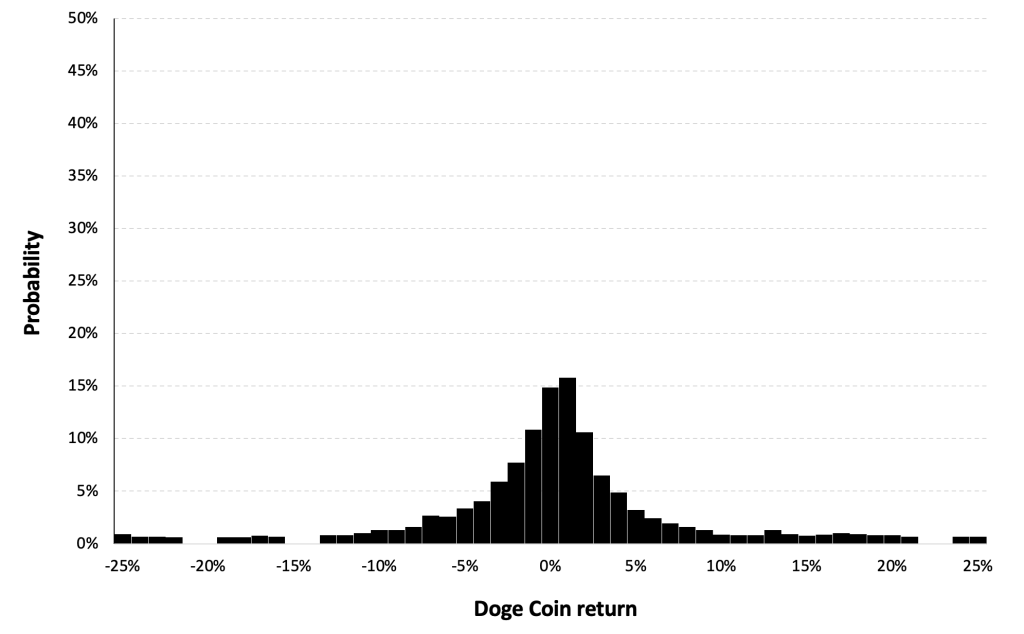
Figure 6 represents the historical distribution of the Doge Coin daily returns for the period from November, 2018 to December 31, 2022.

Figure 6. Historical Doge Coin distribution of the returns.

Source: computation by the author (data: Yahoo! Finance website).

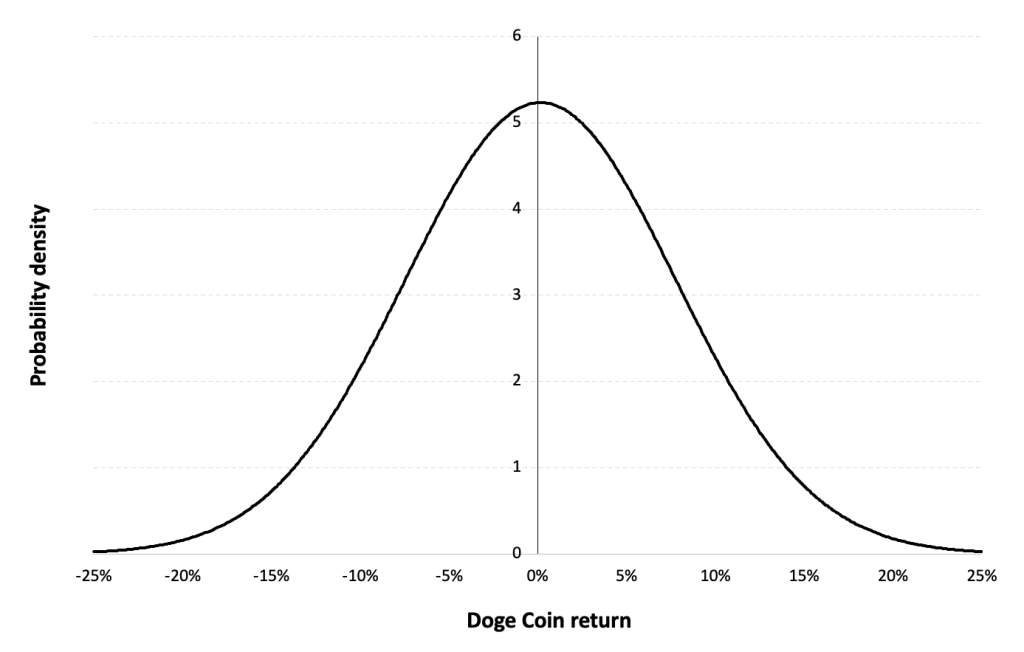
Gaussian distribution

The Gaussian distribution (also called the normal distribution) is a parametric distribution with two parameters: the mean and the standard deviation of returns. We estimated these two parameters over the period from October, 2018 to December 31, 2022. Figure 7 below represents the Gaussian distribution of the Ethereum daily returns with parameters estimated over the period from October, 2018 to December, 2022.

Figure 9. Gaussian distribution of the Doge Coin returns.

Source: computation by the author (data: Yahoo! Finance website).

Risk measures of the Doge Coin returns

The R program that you can download above also allows you to compute risk measures about the returns of the Doge Coin.

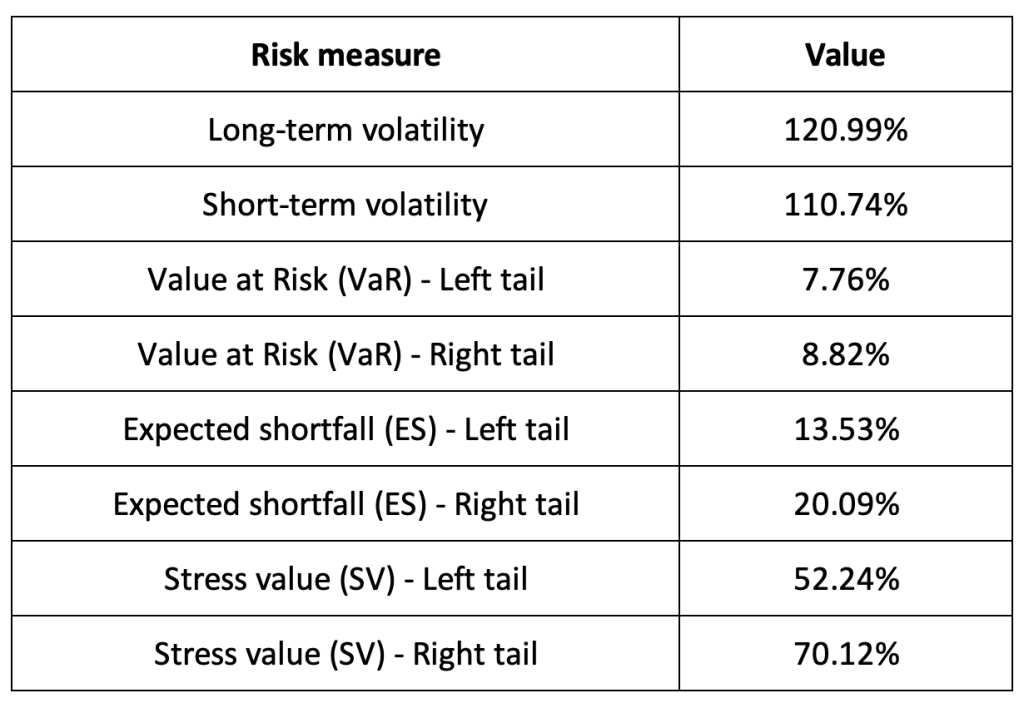
Table 3 below presents the following risk measures estimated for the Doge Coin:

  • The long-term volatility (the unconditional standard deviation estimated over the entire period)
  • The short-term volatility (the standard deviation estimated over the last three months)
  • The Value at Risk (VaR) for the left tail (the 5% quantile of the historical distribution)
  • The Value at Risk (VaR) for the right tail (the 95% quantile of the historical distribution)
  • The Expected Shortfall (ES) for the left tail (the average loss over the 5% quantile of the historical distribution)
  • The Expected Shortfall (ES) for the right tail (the average loss over the 95% quantile of the historical distribution)
  • The Stress Value (SV) for the left tail (the 1% quantile of the tail distribution estimated with a Generalized Pareto distribution)
  • The Stress Value (SV) for the right tail (the 99% quantile of the tail distribution estimated with a Generalized Pareto distribution)

Table 3. Risk measures for the Doge Coin.

Source: computation by the author (data: Yahoo! Finance website).

The volatility is a global measure of risk as it considers all the returns. The Value at Risk (VaR), Expected Shortfall (ES) and Stress Value (SV) are local measures of risk as they focus on the tails of the distribution. The study of the left tail is relevant for an investor holding a long position in the XRP while the study of the right tail is relevant for an investor holding a short position in the Doge Coin.

Why should I be interested in this post?

This blog offers an engaging exploration into a cryptocurrency that transcends traditional finance, appealing to a wide audience due to its cultural relevance, investment potential, and vibrant community. From its origins as a meme coin to its remarkable price movements, understanding Dogecoin’s dynamics provides valuable insights into both the cryptocurrency market and internet culture. Delving into its technological underpinnings, community engagement, and market trends offers a concise yet comprehensive overview of Dogecoin’s significance in the evolving landscape of digital currencies.

Related posts on the SimTrade blog

About cryptocurrencies

   ▶ Snehasish CHINARA Bitcoin: the mother of all cryptocurrencies

   ▶ Snehasish CHINARA How to get crypto data

   ▶ Alexandre VERLET Cryptocurrencies

   ▶ Youssef EL QAMCAOUI Decentralised Financing

   ▶ Hugo MEYER The regulation of cryptocurrencies: what are we talking about?

About statistics

   ▶ Shengyu ZHENG Moments de la distribution

   ▶ Shengyu ZHENG Mesures de risques

   ▶ Jayati WALIA Returns

Useful resources

Academic research about risk

Longin F. (2000) From VaR to stress testing: the extreme value approach Journal of Banking and Finance, N°24, pp 1097-1130.

Longin F. (2016) Extreme events in finance: a handbook of extreme value theory and its applications Wiley Editions.

Data

Yahoo! Finance

Yahoo! Finance Historical data for Doge Coin

CoinMarketCap Historical data for Doge Coin

About the author

The article was written in March 2024 by Snehasish CHINARA (ESSEC Business School, Grande Ecole Program – Master in Management, 2022-2024).

USD Coin: Deep Dive into the Role of Stablecoins in Modern Finance

 Snehasish CHINARA

In this article, Snehasish CHINARA (ESSEC Business School, Grande Ecole Program – Master in Management, 2022-2024) explains the stable coin USD Coin.

Historical context and background

USD Coin (USDC) is a type of cryptocurrency known as a stablecoin, designed to maintain a stable value relative to the US dollar (USD). It was launched in September 2018 by Centre Consortium, a collaboration between cryptocurrency exchange Coinbase and blockchain technology company Circle. The primary goal of USDC is to provide a digital asset that can be easily transferred between users and used for transactions, while minimizing the volatility typically associated with other cryptocurrencies like Bitcoin or Ethereum.

The need for stablecoins like USDC arose due to the inherent volatility of many cryptocurrencies. While Bitcoin and other digital assets have gained significant attention and adoption, their prices can fluctuate dramatically over short periods, which can make them less practical for everyday transactions and financial contracts. Stablecoins like USDC offer a solution to this problem by pegging their value to a stable asset, such as the US dollar, thereby providing stability and predictability for users.

USDC operates on the Ethereum blockchain as an ERC-20 token, making it compatible with a wide range of decentralized applications (dApps) and enabling seamless integration with the broader cryptocurrency ecosystem. This infrastructure allows users to easily send and receive USDC tokens across various platforms and services, including exchanges, wallets, and payment processors.

Since its launch, USDC has seen significant growth in adoption and usage. It has become one of the most widely used stablecoins in the cryptocurrency market, with billions of dollars worth of USDC tokens in circulation. Its stability and liquidity have made it a popular choice for traders, investors, and businesses looking to transact in digital assets without exposure to the volatility of other cryptocurrencies.

USD Coin Logo

Source: Yahoo! Finance.

Figure 1. Key Dates in USDC History

Source: Yahoo! Finance.

Key features

Stability

USD Coin is a stablecoin, meaning it is pegged to the value of the US dollar on a 1:1 basis. This stability is maintained through regular audits and backing by reserves of US dollars held in custody by regulated financial institutions.

Transparency

USDC operates on blockchain technology, providing transparency and immutability of transactions. Every USDC token is backed by an equivalent number of US dollars held in reserve, which is regularly audited and transparently reported to ensure trust among users.

Speed and Efficiency

Transactions involving USDC can be executed quickly and efficiently on blockchain networks, enabling near-instantaneous settlement compared to traditional banking systems, which may take days for cross-border transactions.

Global Accessibility

USDC enables borderless transactions, allowing users to send and receive payments globally without the need for intermediaries such as banks. This accessibility empowers individuals and businesses, particularly in regions with limited access to traditional financial services.

Interoperability

USDC is compatible with various blockchain platforms and protocols, including Ethereum, Algorand, and Solana, among others. This interoperability facilitates its integration into a wide range of decentralized applications (DApps) and decentralized finance (DeFi) ecosystems.

Use cases

Remittances and Cross-Border Payments:

USDC provides a cost-effective and efficient solution for remittance payments and cross-border transactions, enabling individuals and businesses to transfer value across borders quickly and securely without the need for traditional banking intermediaries.

Stable Value Storage

Due to its stable value pegged to the US dollar, USDC serves as a reliable store of value and a hedge against volatility in the cryptocurrency market. Users can hold USDC as a stable asset to preserve purchasing power and mitigate the risks associated with price fluctuations in other cryptocurrencies.

Decentralized Finance (DeFi) Applications

USDC is widely used as a liquidity provider and collateral asset in various DeFi protocols and applications such as decentralized exchanges (DEXs), lending platforms, yield farming, and liquidity pools. Users can leverage USDC to earn interest, borrow assets, or participate in yield farming strategies within the DeFi ecosystem.

Commerce and Payments

Merchants and businesses can accept USDC as a form of payment for goods and services, leveraging its fast transaction settlement times and low transaction fees compared to traditional payment methods. Integrating USDC payments can streamline cross-border commerce and reduce friction associated with fiat currency conversions.

Financial Inclusion

USDC plays a crucial role in expanding financial inclusion by providing access to digital financial services for individuals and communities underserved by traditional banking infrastructure. By utilizing blockchain technology and stablecoins like USDC, individuals without access to traditional banking services can participate in the global economy and access a wide range of financial products and services.

Technology and underlying blockchain

USD Coin (USDC) operates on a blockchain-based infrastructure, primarily leveraging the Ethereum blockchain as its foundation. Utilizing Ethereum’s smart contract functionality, USDC tokens are issued, transferred, and redeemed in a transparent and trustless manner. The ERC-20 standard, a set of rules and protocols defining interactions between tokens on the Ethereum network, governs the behavior of USDC tokens, ensuring compatibility with a wide range of wallets, exchanges, and decentralized applications (DApps). Moreover, USDC employs a consortium model for governance and operation, with regulated financial institutions serving as members responsible for the issuance, custody, and redemption of USDC tokens. These institutions adhere to strict regulatory compliance measures and conduct regular audits to verify that each USDC token is fully backed by an equivalent reserve of US dollars held in custody. This combination of blockchain technology, smart contracts, and regulatory oversight ensures the integrity, transparency, and stability of USD Coin, making it a trusted and widely adopted stablecoin within the cryptocurrency ecosystem.

ERC-20 Standard of Ethereum for USD Coin

The ERC-20 standard, short for Ethereum Request for Comment 20, is a widely adopted technical specification governing the creation and implementation of fungible tokens on the Ethereum blockchain. Introduced by Fabian Vogelsteller and Vitalik Buterin in 2015, ERC-20 defines a set of rules and functions that enable seamless interoperability between different tokens, ensuring compatibility with various decentralized applications (DApps) and wallets. Tokens adhering to the ERC-20 standard are characterized by a consistent set of methods, including transfer, balance inquiry, and approval mechanisms, facilitating easy integration and widespread adoption across the Ethereum ecosystem. This standardization has played a pivotal role in the proliferation of tokenization, empowering developers to create diverse tokenized assets, conduct crowdfunding campaigns through Initial Coin Offerings (ICOs), and establish decentralized exchanges (DEXs) where ERC-20 tokens are traded autonomously. Additionally, ERC-20 compliance enhances security and interoperability, fostering trust and usability within the Ethereum network.

Supply of coins

The supply dynamics of USD Coin (USDC) are governed by its underlying smart contract protocol and the management of its issuer, Centre Consortium, a collaboration between Circle and Coinbase. USDC operates on a principle of full backing, where each USDC token issued is backed by an equivalent number of US dollars held in reserve. This backing ensures a 1:1 peg to the US dollar, maintaining its stability. The issuance and redemption of USDC are facilitated through regulated financial institutions that hold the corresponding fiat reserves. Moreover, USDC’s supply is transparently audited on a regular basis, with attestations provided by reputable auditing firms to verify the adequacy of reserves. Through these mechanisms, the supply of USDC remains elastic, expanding or contracting based on market demand while preserving its stability and trustworthiness as a stablecoin in the digital asset ecosystem.

Historical data for USDC

How to get the data?

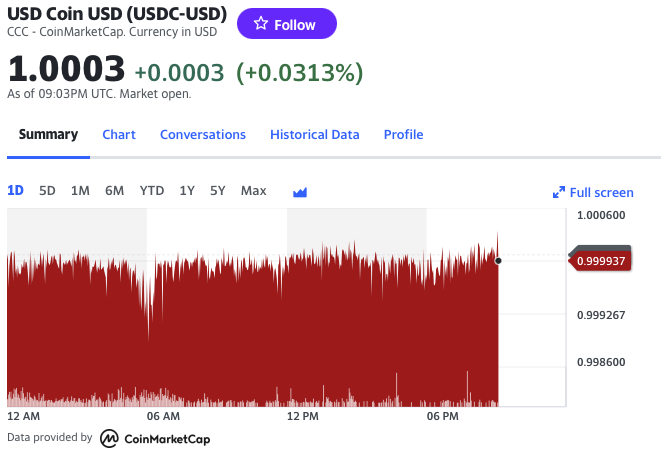
The USDC is popular cryptocurrency on the market, and historical data for the USDC such as prices and volume traded can be easily downloaded from the internet sources such as Yahoo! Finance, Blockchain.com & CoinMarketCap. For example, you can download data for USDC on Yahoo! Finance (the Yahoo! code for USD Coin is USDC-USD).

Figure 2. USD Coin data

Source: Yahoo! Finance.

Historical data for the USD Coin market prices

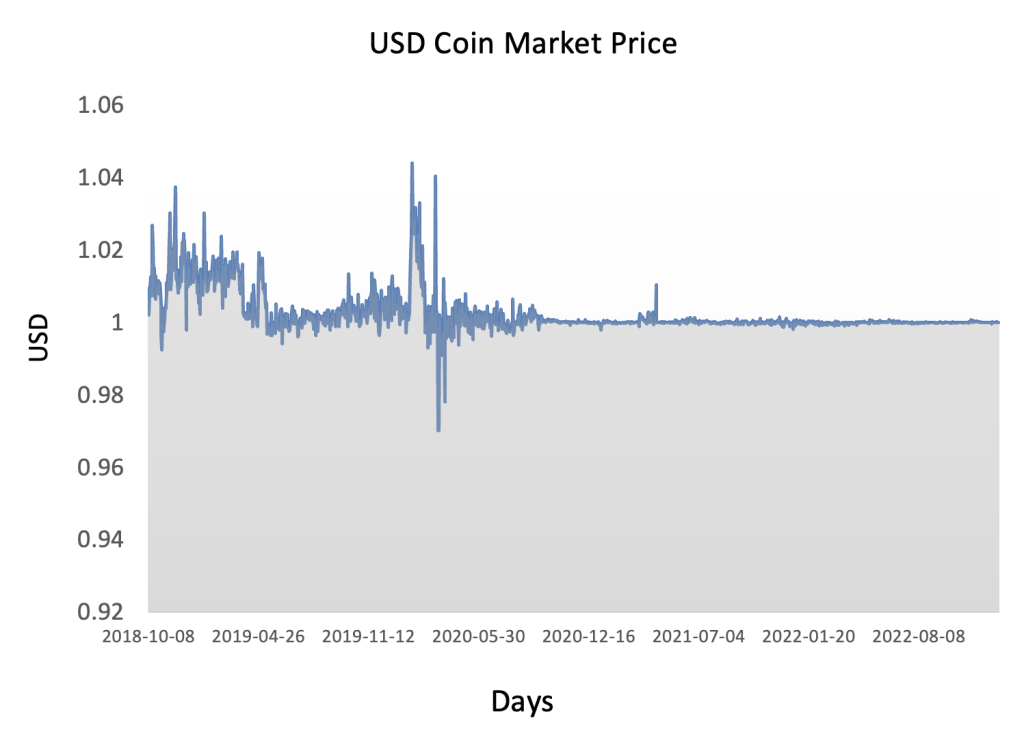
The historical market price of USD Coin (USDC) has remained relatively stable, as its primary function is to maintain a value pegged to the US dollar at a 1:1 ratio. Since its inception, USDC has consistently traded around the $1 mark, with minor fluctuations typically attributed to market dynamics and liquidity conditions. Investors and traders often utilize USDC as a safe haven asset or a means of temporarily exiting volatile cryptocurrency markets, contributing to its stability. This stability has made USDC a preferred choice for individuals and institutions seeking to hedge against cryptocurrency volatility or facilitate seamless transitions between digital and fiat currencies. Additionally, the transparent backing of USDC by reserves of US dollars held in custody by regulated financial institutions further enhances market confidence and contributes to its stable market price over time.The historical market price of USD Coin (USDC) has remained relatively stable, as its primary function is to maintain a value pegged to the US dollar at a 1:1 ratio. Since its inception, USDC has consistently traded around the $1 mark, with minor fluctuations typically attributed to market dynamics and liquidity conditions. Investors and traders often utilize USDC as a safe haven asset or a means of temporarily exiting volatile cryptocurrency markets, contributing to its stability. This stability has made USDC a preferred choice for individuals and institutions seeking to hedge against cryptocurrency volatility or facilitate seamless transitions between digital and fiat currencies. Additionally, the transparent backing of USDC by reserves of US dollars held in custody by regulated financial institutions further enhances market confidence and contributes to its stable market price over time.

Figure 3 below represents the evolution of the price of USD Coin in US dollar over the period Oct 2018 – Dec 2022. The price corresponds to the “closing” price (observed at 10:00 PM CET at the end of the month).

Figure 3. Evolution of the USD Coin price

Source: Yahoo! Finance.

R program

The R program below written by Shengyu ZHENG allows you to download the data from Yahoo! Finance website and to compute summary statistics and risk measures about the USD Coin.

Download R file

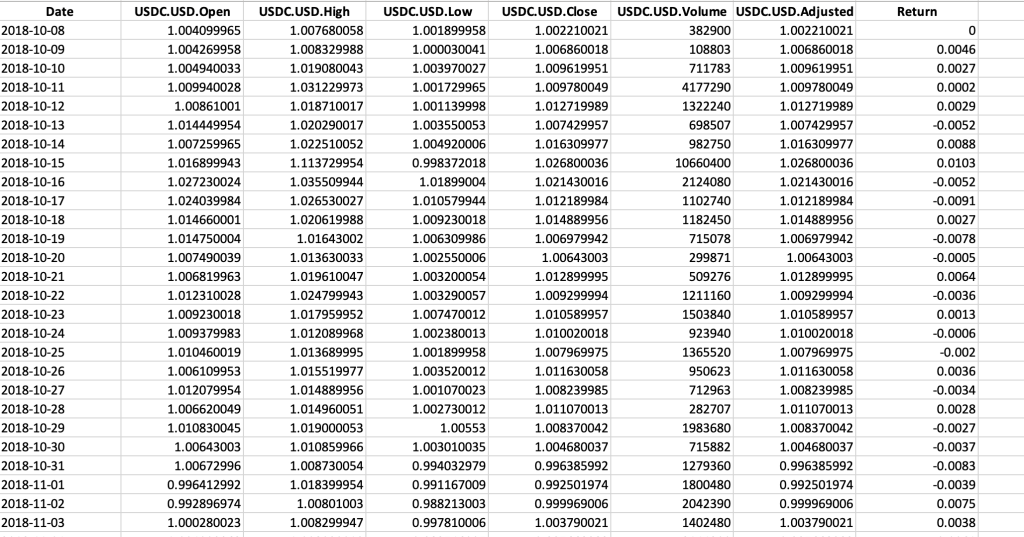
Data file

The R program that you can download above allows you to download the data for the USD Coin from the Yahoo! Finance website. The database starts on Oct, 2018. Table 1 below represents the top of the data file for the USD Coin downloaded from the Yahoo! Finance website with the R program.

Table 1. Top of the data file for the USD Coin

Source: computation by the author (data: Yahoo! Finance website).

Python code

You can download the Python code used to download the data from Yahoo! Finance.

Download the Python code for USD Coin data

Python script to download USD Coin historical data and save it to an Excel sheet::

import yfinance as yf

import pandas as pd

# Define the ticker symbol for USD Coin

usdc_ticker = “USDC-USD”

# Define the date range for historical data

start_date = “2020-01-01”

end_date = “2022-01-01”

# Download historical data using yfinance

usdc_data = yf.download(usdc_ticker, start=start_date, end=end_date)

# Create a Pandas DataFrame from the downloaded data

usdc_df = pd.DataFrame(usdc_data)

# Define the Excel file path

excel_file_path = “USDC_historical_data.xlsx”

# Save the data to an Excel sheet

usdc_df.to_excel(excel_file_path, sheet_name=”USDC Historical Data”)

print(f”Data saved to {excel_file_path}”)

# Make sure you have the required libraries installed and adjust the “start_date” and “end_date” variables to the desired date range for the historical data you want to download.

Evolution of the USD Coin

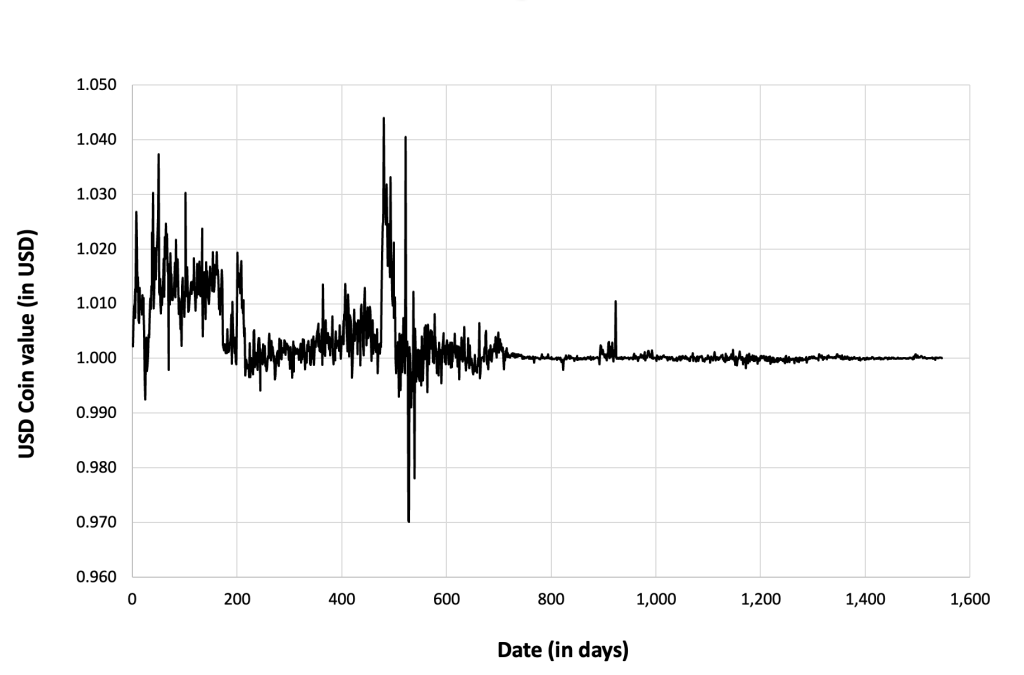
Figure 4 below gives the evolution of the USDC on a daily basis.

Figure 4. Evolution of the USD Coin.

Source: computation by the author (data: Yahoo! Finance website).

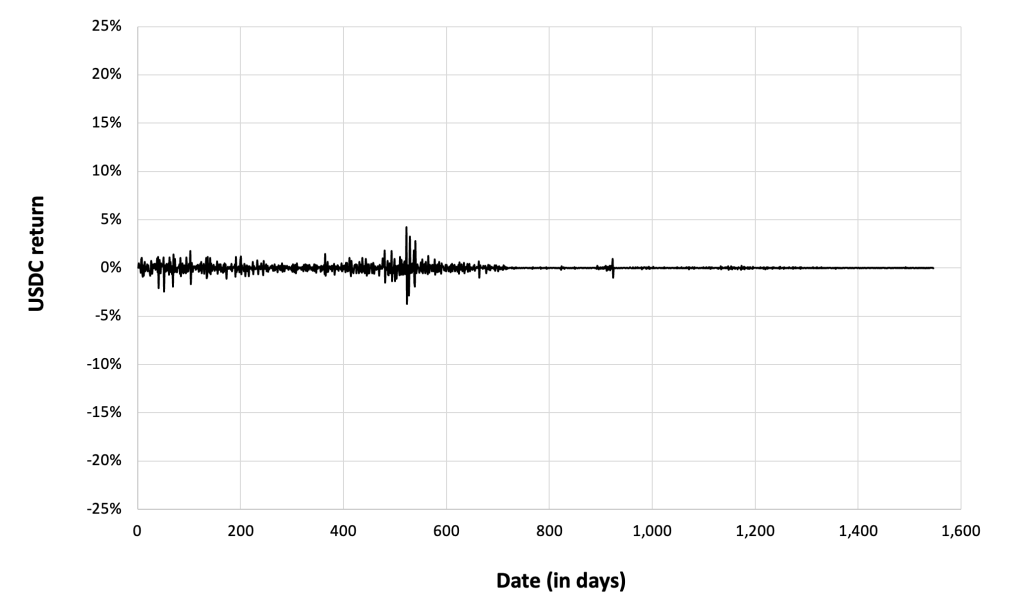
Figure 5 below gives the evolution of the USD Coin returns from Oct, 2018 to December 31, 2022 on a daily basis.

Figure 5. Evolution of the USD Coin returns

Source: computation by the author (data: Yahoo! Finance website).

Summary statistics for the USD Coin

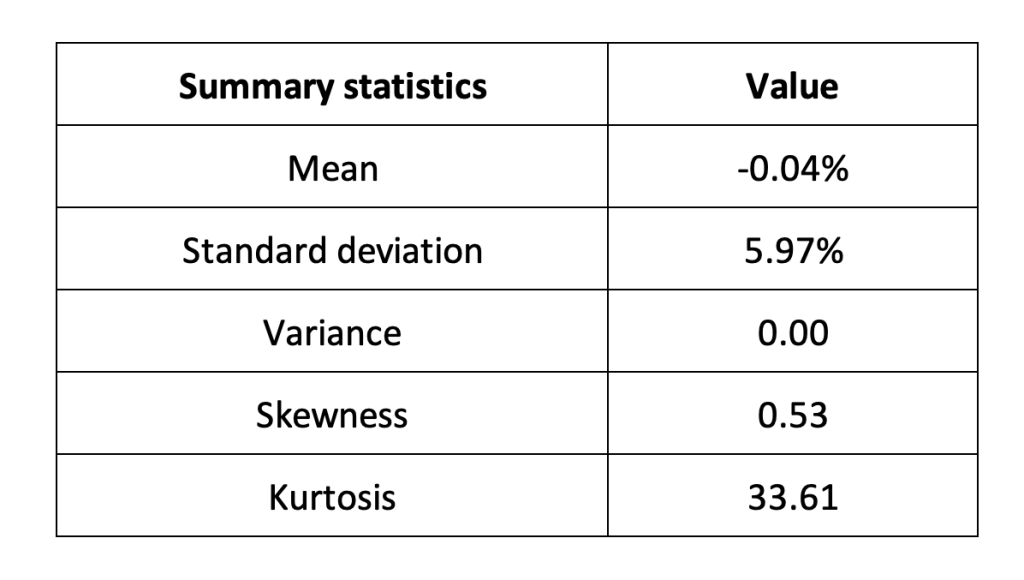
The R program that you can download above also allows you to compute summary statistics about the returns of the USD Coin. Table 2 below presents the following summary statistics estimated for the USD Coin:

  • The mean
  • The standard deviation (the squared root of the variance)
  • The skewness
  • The kurtosis.

The mean, the standard deviation / variance, the skewness, and the kurtosis refer to the first, second, third and fourth moments of statistical distribution of returns respectively.

Table 2. Summary statistics for USDC.

Source: computation by the author (data: Yahoo! Finance website).

Statistical distribution of the USD Coin returns

Historical distribution

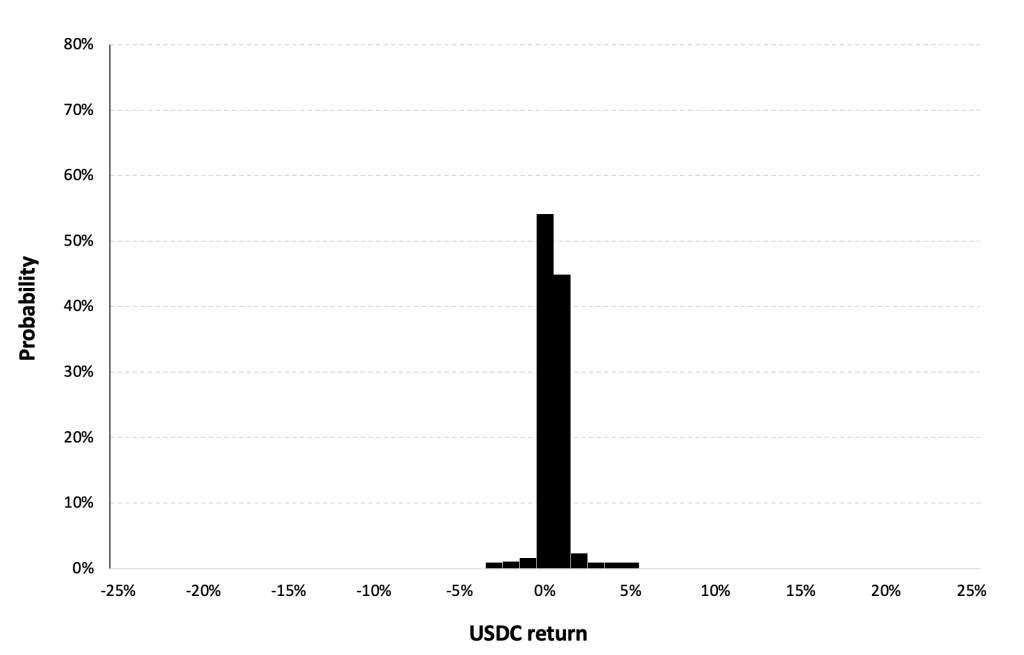
Figure 6 represents the historical distribution of the USD Coin daily returns for the period from Oct, 2018 to December 31, 2022.

Figure 6. Historical USDC distribution of the returns.

Source: computation by the author (data: Yahoo! Finance website).

Gaussian distribution

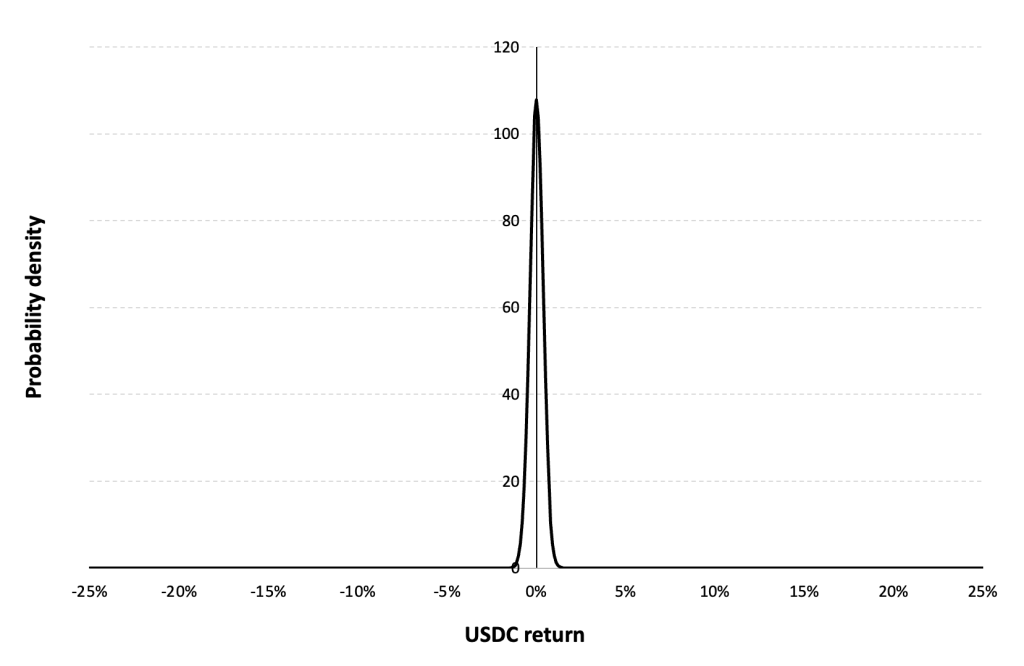
The Gaussian distribution (also called the normal distribution) is a parametric distribution with two parameters: the mean and the standard deviation of returns. We estimated these two parameters over the period from October, 2018 to December 31, 2022.

Figure 7 below represents the Gaussian distribution of the USD Coin daily returns with parameters estimated over the period from October, 2018 to December, 2022.

Figure 7. Gaussian distribution of the USDC returns.

Source: computation by the author (data: Yahoo! Finance website).

Risk measures of the USD Coin returns

The R program that you can download above also allows you to compute risk measures about the returns of the USD Coin.

Table 3 below presents the following risk measures estimated for the USD Coin:

  • The long-term volatility (the unconditional standard deviation estimated over the entire period)
  • The short-term volatility (the standard deviation estimated over the last three months)
  • The Value at Risk (VaR) for the left tail (the 5% quantile of the historical distribution)
  • The Value at Risk (VaR) for the right tail (the 95% quantile of the historical distribution)
  • The Expected Shortfall (ES) for the left tail (the average loss over the 5% quantile of the historical distribution)
  • The Expected Shortfall (ES) for the right tail (the average loss over the 95% quantile of the historical distribution)
  • The Stress Value (SV) for the left tail (the 1% quantile of the tail distribution estimated with a Generalized Pareto distribution)
  • The Stress Value (SV) for the right tail (the 99% quantile of the tail distribution estimated with a Generalized Pareto distribution)

Table 3. Risk measures for the USDC.

Source: computation by the author (data: Yahoo! Finance website).

The volatility is a global measure of risk as it considers all the returns. The Value at Risk (VaR), Expected Shortfall (ES) and Stress Value (SV) are local measures of risk as they focus on the tails of the distribution. The study of the left tail is relevant for an investor holding a long position in the XRP while the study of the right tail is relevant for an investor holding a short position in the XRP.

Why should I be interested in this post?

The post offers an opportunity for both newcomers and seasoned cryptocurrency enthusiasts to delve into the concept of stablecoins, gaining insights into how digital assets maintain stability amidst market volatility. Furthermore, the post highlights USDC’s role in fostering financial inclusion by enabling borderless transactions, appealing to readers passionate about democratizing finance. Additionally, exploring USDC’s significance in the burgeoning realm of decentralized finance (DeFi) could intrigue those interested in innovative financial technologies and investment opportunities. Examining USDC’s historical performance and market dynamics can offer valuable insights for investors and traders, while shedding light on its compliance measures and regulatory landscape can address concerns regarding legal risks, contributing to readers’ understanding and confidence in this digital asset.

Related posts on the SimTrade blog

About cryptocurrencies

   ▶ Snehasish CHINARA Bitcoin: the mother of all cryptocurrencies

   ▶ Snehasish CHINARA How to get crypto data

   ▶ Alexandre VERLET Cryptocurrencies

   ▶ Youssef EL QAMCAOUI Decentralised Financing

   ▶ Hugo MEYER The regulation of cryptocurrencies: what are we talking about?

About statistics

   ▶ Shengyu ZHENG Moments de la distribution

   ▶ Shengyu ZHENG Mesures de risques

   ▶ Jayati WALIA Returns

Useful resources

Academic research about risk

Longin F. (2000) From VaR to stress testing: the extreme value approach Journal of Banking and Finance, N°24, pp 1097-1130.

Longin F. (2016) Extreme events in finance: a handbook of extreme value theory and its applications Wiley Editions.

Data

Yahoo! Finance

Yahoo! Finance Historical data for USDC

CoinMarketCap Historical data for USDC

About the author

The article was written in March 2024 by Snehasish CHINARA (ESSEC Business School, Grande Ecole Program – Master in Management, 2022-2024).

Tether: Unraveling the Impact of the Stablecoin on Modern Finance

 Snehasish CHINARA

In this article, Snehasish CHINARA (ESSEC Business School, Grande Ecole Program – Master in Management, 2022-2024) explains the cryptocurrency Tether.

Historical context and background

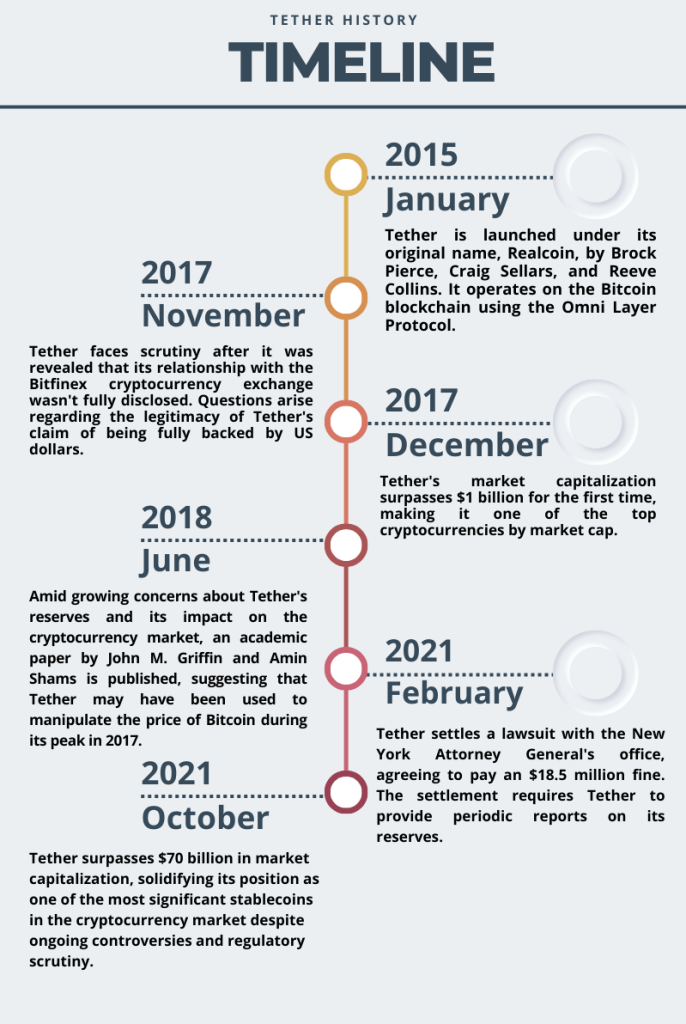
Tether (USDT) emerged in July 2014 as a groundbreaking cryptocurrency designed to bridge the gap between traditional fiat currencies and the digital realm. Conceived by Brock Pierce, Craig Sellars, and Reeve Collins, Tether aimed to offer a stable alternative to the price volatility commonly associated with other cryptocurrencies like Bitcoin. Functioning as a stablecoin, Tether is pegged to the value of a fiat currency, primarily the US Dollar, maintaining a 1:1 ratio. This pegging mechanism provides a degree of price stability, making Tether an attractive option for traders and investors seeking to mitigate the risks inherent in the crypto market. Since its inception, Tether has grown to become one of the most widely used cryptocurrencies, playing a pivotal role in facilitating liquidity and serving as a gateway for funds within the broader digital asset ecosystem. Despite its popularity, Tether has faced scrutiny regarding its transparency and reserve backing, adding layers of complexity to its intriguing history within the crypto landscape.

Tether Logo

Source: Yahoo! Finance

Figure 1. Key Dates in Tether History

Source: Yahoo! Finance

Key features

  • Stability: Tether is designed to maintain a 1:1 peg with a fiat currency, typically the US Dollar. This pegging mechanism provides stability in value, reducing the volatility commonly associated with other cryptocurrencies.
  • Widespread Adoption: Tether is widely adopted across various cryptocurrency exchanges and platforms. Its broad acceptance makes it a popular choice for traders and investors.
  • Liquidity Provider: Tether serves as a crucial source of liquidity within the cryptocurrency market. Traders often use USDT as a safe haven during times of market turbulence.
  • Fast Transactions: Tether transactions are conducted on blockchain networks like Ethereum and Tron, enabling fast and efficient cross-border transactions compared to traditional banking systems.
  • Global Accessibility: Tether provides a borderless financial solution, allowing users to send and receive funds globally without the need for traditional banking intermediaries.
  • Smart Contract Compatibility: Tether is compatible with blockchain-based smart contracts, enabling developers to integrate it into decentralized applications (DApps) for various financial services.

Use cases

  • Trading Pairs: Tether is extensively used as a trading pair on cryptocurrency exchanges. It allows traders to quickly move in and out of positions while avoiding the market volatility associated with other digital assets.
  • Hedging: Investors often use Tether as a hedging tool to safeguard their portfolios against market fluctuations. By converting their holdings to USDT during uncertain times, investors can protect their capital.
  • Remittances: Tether facilitates cross-border remittances, offering a faster and potentially more cost-effective alternative to traditional money transfer services.
  • Stable Value Storage: Tether serves as a stable store of value, allowing users to preserve their wealth in a cryptocurrency that is less prone to price fluctuations compared to other volatile digital assets.
  • Decentralized Finance (DeFi): Tether is a common stablecoin used in decentralized finance protocols for lending, borrowing, and yield farming activities within the growing DeFi ecosystem.
  • Tokenized Assets: Tether is utilized to represent traditional assets in tokenized form on blockchain platforms, enabling fractional ownership and increased liquidity for real-world assets.

Controversy

While Tether has gained popularity for its stability and utility, it has also faced criticism and regulatory scrutiny, particularly regarding its reserve backing and transparency. The paper “Is Bitcoin Really Untethered?”, analyses Tether’s controversies revealing that the significant growth of Tether, the largest pegged cryptocurrency, may not solely be driven by organic investor demand but also by a scheme to artificially inflate cryptocurrency prices. By analyzing the blockchains of Bitcoin and Tether, the researchers found evidence suggesting that a major player on Bitfinex utilizes Tether to purchase large amounts of Bitcoin during price downturns, effectively supporting Bitcoin prices. This intervention is particularly pronounced near round-number price thresholds, indicating a strategic approach to price support. The data also suggests that Tether issuance correlates with a month-end need for dollar reserves, implying partial reserve backing. Overall, these findings lend support to the hypothesis that Tether’s growth is supply-driven and potentially manipulative.

Furthermore, the paper highlights the broader implications of these findings, suggesting that price manipulation in cryptocurrencies can have significant distortive effects beyond standard supply-and-demand dynamics. It highlights the need for external surveillance, monitoring, and regulatory frameworks in the cryptocurrency space, challenging the notion that innovative technologies alone can bypass the need for traditional oversight. The conclusion suggests that while cryptocurrencies offer new possibilities for financial innovation, they are not immune to the risks associated with dubious activities and speculative bubbles, which could ultimately lead to further price distortions and negative impacts on the market.

Technology and underlying blockchain

Tether (USDT), a the stablecoin, utilizes blockchain technology across various networks to provide a digital asset pegged to traditional fiat currencies. The Ethereum-based ERC-20 version is the most prevalent, benefiting from Ethereum’s widespread adoption and smart contract capabilities, making it a cornerstone for decentralized exchanges and DeFi applications. Tether also operates on the Tron blockchain (TRC-20), offering faster transactions and reduced fees, particularly appealing for high-frequency trading. Acknowledging the demand for scalability and cost-effectiveness, Tether has expanded to alternative blockchains like Binance Smart Chain and Solana. These adaptations highlight Tether’s commitment to meeting diverse market needs. Managed by Tether Limited, the stablecoin asserts stability through regular audits and claims of holding equivalent fiat reserves, although controversies have arisen regarding transparency. The dynamic interplay of Tether across various blockchains underscores its pivotal role in the evolving landscape of digital finance.

Supply of coins

The market supply of Tether (USDT), a leading stablecoin, plays a crucial role in the broader cryptocurrency ecosystem. Tether’s supply dynamics are intrinsically linked to its unique issuance mechanism. Tether Limited, the company behind USDT, mints new tokens by receiving equivalent amounts of fiat currency, primarily the US Dollar, in its reserves. This issuance process is supposed to ensure a 1:1 peg between USDT and the underlying fiat currency, promoting price stability.

The market supply of Tether expands as demand for the stablecoin increases. Traders and investors often turn to USDT as a safe haven during times of high volatility, effectively increasing the circulating supply. This heightened demand results in additional Tether being issued to maintain the peg, thus influencing the overall supply in the market.

Monitoring Tether’s supply is of particular interest due to its significant impact on liquidity within the cryptocurrency space. An influx of USDT into the market provides traders with a reliable means to navigate price fluctuations without fully exiting the crypto market, enhancing liquidity and potentially mitigating market volatility.

Historical data for Tether

How to get the data?

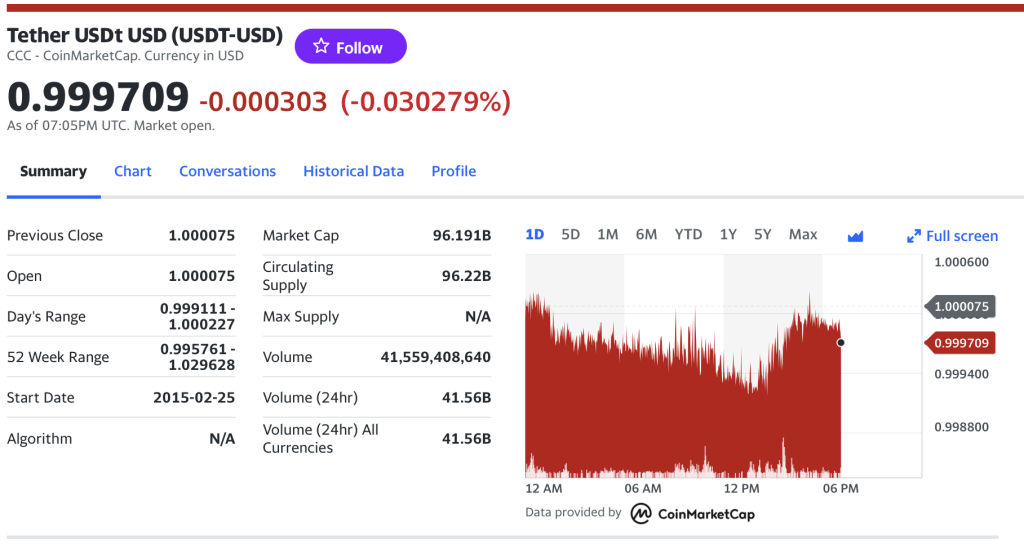
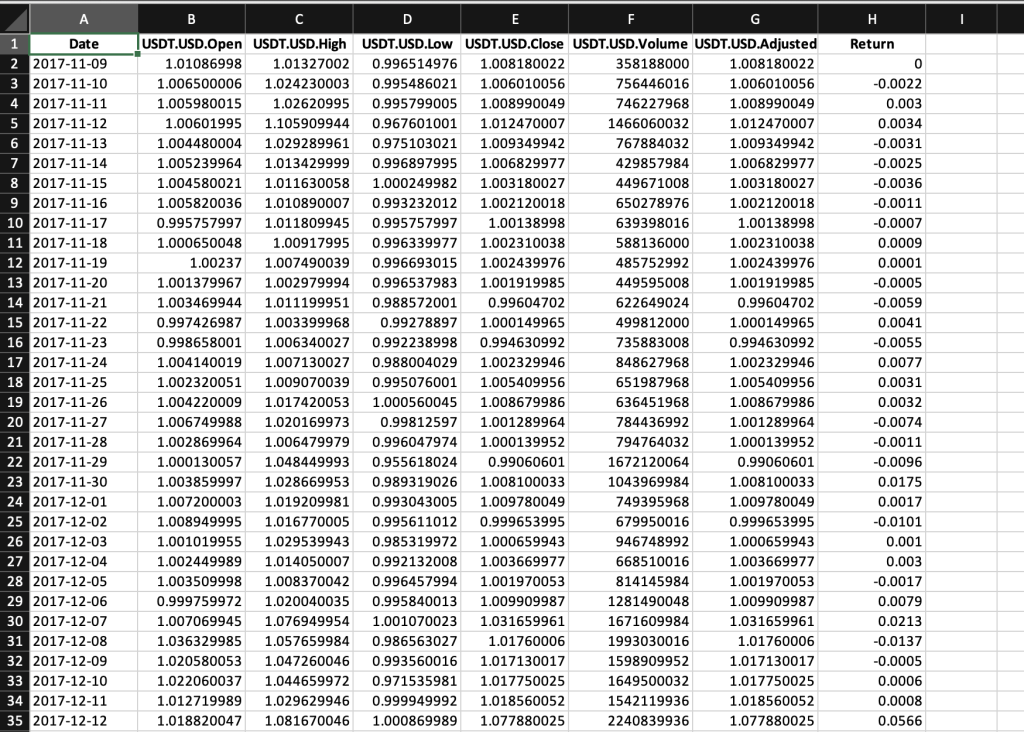
The Tether is popular cryptocurrency on the market, and historical data for the Tether such as prices and volume traded can be easily downloaded from the internet sources such as Yahoo! Finance, Blockchain.com & CoinMarketCap. For example, you can download data for Tether on Yahoo! Finance (the Yahoo! code for Tether is USDT-USD).

Figure 1. Tether data

Source: Yahoo! Finance.

Historical data for the Tether market prices

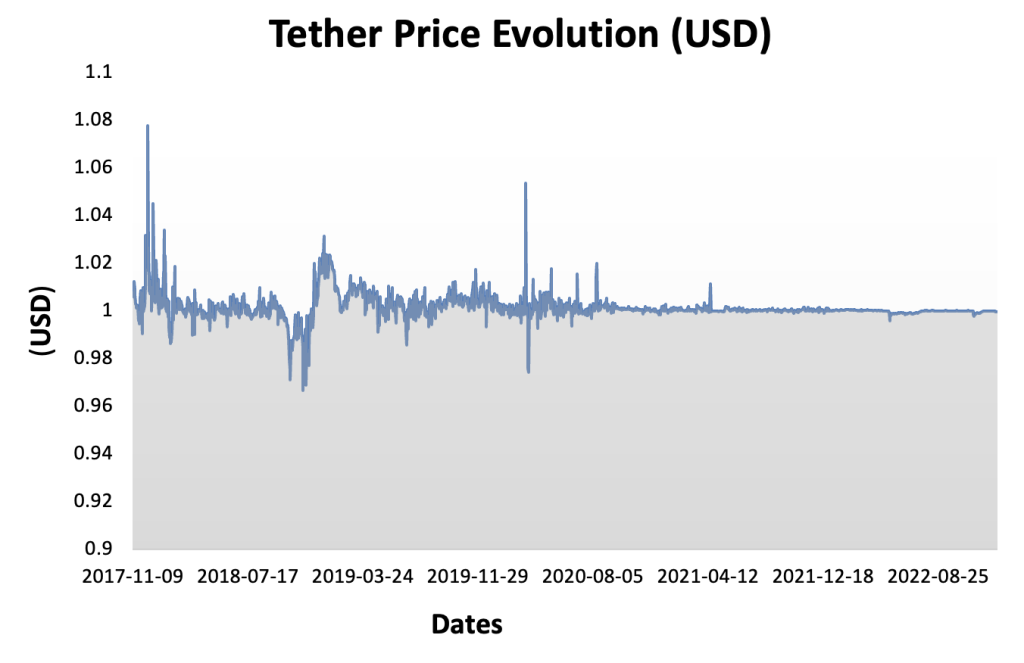
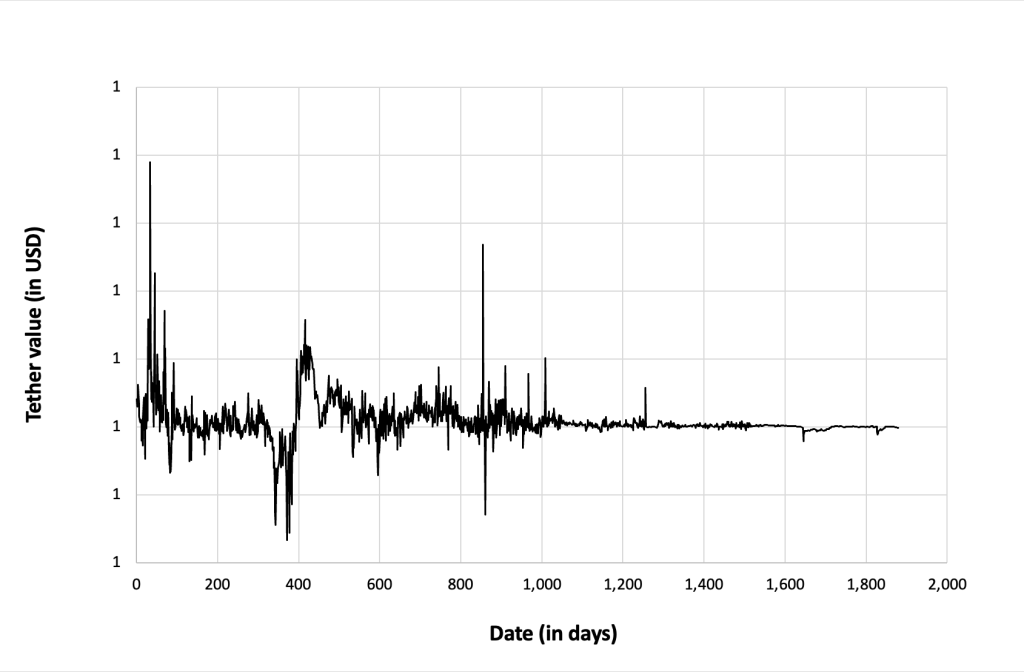
Exploring the historical market price of Tether (USDT) unveils a wealth of insights into the cryptocurrency’s role and its impact on the broader market. The stability of Tether, designed to maintain a 1:1 peg with traditional fiat currencies, is reflected in its price history. Observing deviations from this peg over time provides a gauge of Tether’s effectiveness as a stablecoin. Moreover, fluctuations in Tether’s historical price serve as a barometer for market sentiment, indicating periods of increased demand for stability during cryptocurrency market volatility. Tether’s price movements also offer a lens into liquidity trends, showcasing its role in various financial activities within the crypto ecosystem. Crucially, analyzing Tether’s historical price can illuminate market responses to controversies, regulatory developments, and its correlation with other major cryptocurrencies. Understanding these dynamics is essential for investors and traders seeking to navigate the intricate landscape of digital assets and stablecoins.

Figure 2 below represents the evolution of the price of Tether in US dollar over the period Nov 2017 – Dec 2023. The price corresponds to the “closing” price (observed at 10:00 PM CET at the end of the month).

Figure 2. Evolution of the Tether price

Source: Yahoo! Finance.

R program

The R program below written by Shengyu ZHENG allows you to download the data from Yahoo! Finance website and to compute summary statistics and risk measures about the Ethereum.

Download R file

Data file

The R program that you can download above allows you to download the data for the Ethereum from the Yahoo! Finance website. The database starts on December, 2017.

Table 1 below represents the top of the data file for the Ethereum downloaded from the Yahoo! Finance website with the R program.

Table 1. Top of the data file for the Tether

Source: computation by the author (data: Yahoo! Finance website).

Python code

You can download the Python code used to download the data from Yahoo! Finance.

Download the Excel file with Tether data

Python script to download Ethereum historical data and save it to an Excel sheet::

import yfinance as yf

import pandas as pd

# Define the ticker symbol for Tether

eth_ticker = “USDT-USD”

# Define the date range for historical data

start_date = “2020-01-01”

end_date = “2022-01-01”

# Download historical data using yfinance

usdt_data = yf.download(eth_ticker, start=start_date, end=end_date)

# Create a Pandas DataFrame from the downloaded data

usdt_df = pd.DataFrame(usdt_data)

# Define the Excel file path

excel_file_path = “tether_historical_data.xlsx”

# Save the data to an Excel sheet

usdt_df.to_excel(excel_file_path, sheet_name=”USDT Historical Data”)

print(f”Data saved to {excel_file_path}”)

# Make sure you have the required libraries installed and adjust the “start_date” and “end_date” variables to the desired date range for the historical data you want to download.

Evolution of the Tether

Figure 3 below gives the evolution of the Tether on a daily basis.

Figure 3. Evolution of the Tether.

Source: computation by the author (data: Yahoo! Finance website).

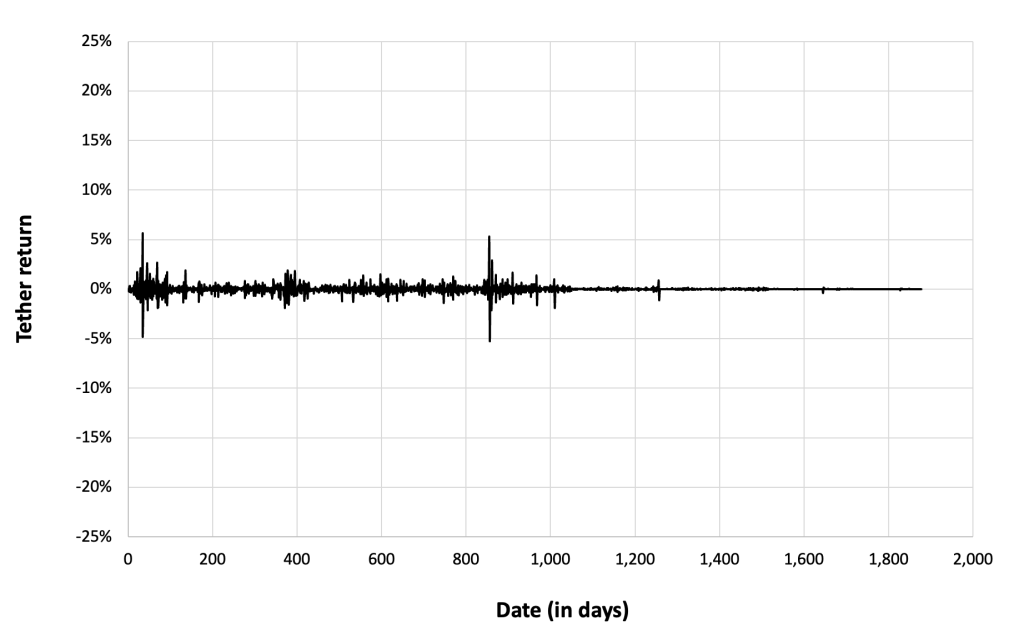
Figure 4 below gives the evolution of the Tether returns from November 09, 2017 to December 31, 2022 on a daily basis.

Figure 4. Evolution of the Tether returns.

Source: computation by the author (data: Yahoo! Finance website).

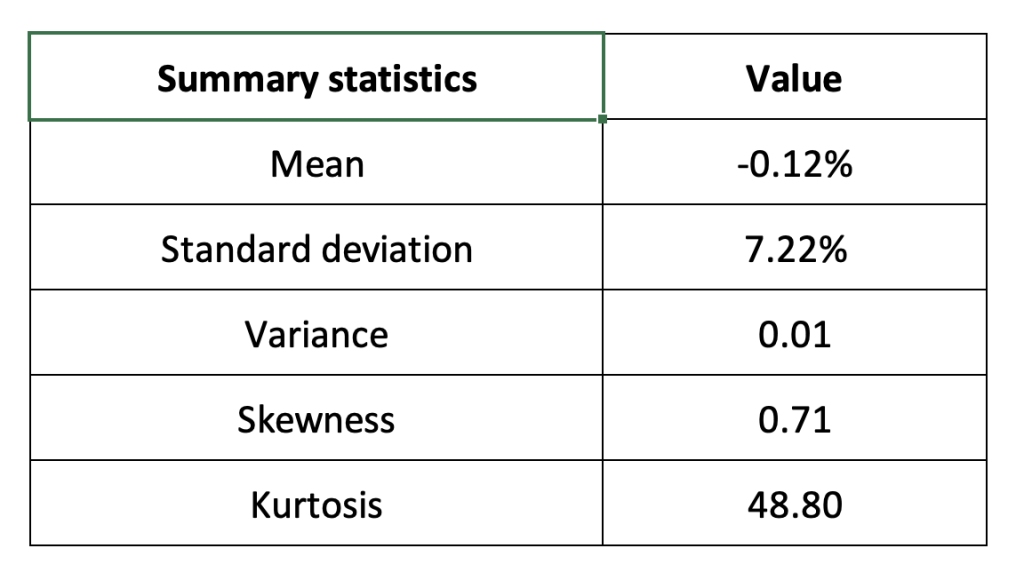
Summary statistics for the Ethereum

The R program that you can download above also allows you to compute summary statistics about the returns of the Tether.

Table 4 below presents the following summary statistics estimated for the Ethereum:

  • The mean
  • The standard deviation (the squared root of the variance)
  • The skewness
  • The kurtosis.

The mean, the standard deviation / variance, the skewness, and the kurtosis refer to the first, second, third and fourth moments of statistical distribution of returns respectively.

Table 2. Summary statistics for Tether.

Source: computation by the author (data: Yahoo! Finance website).

Statistical distribution of the Tether returns

Historical distribution

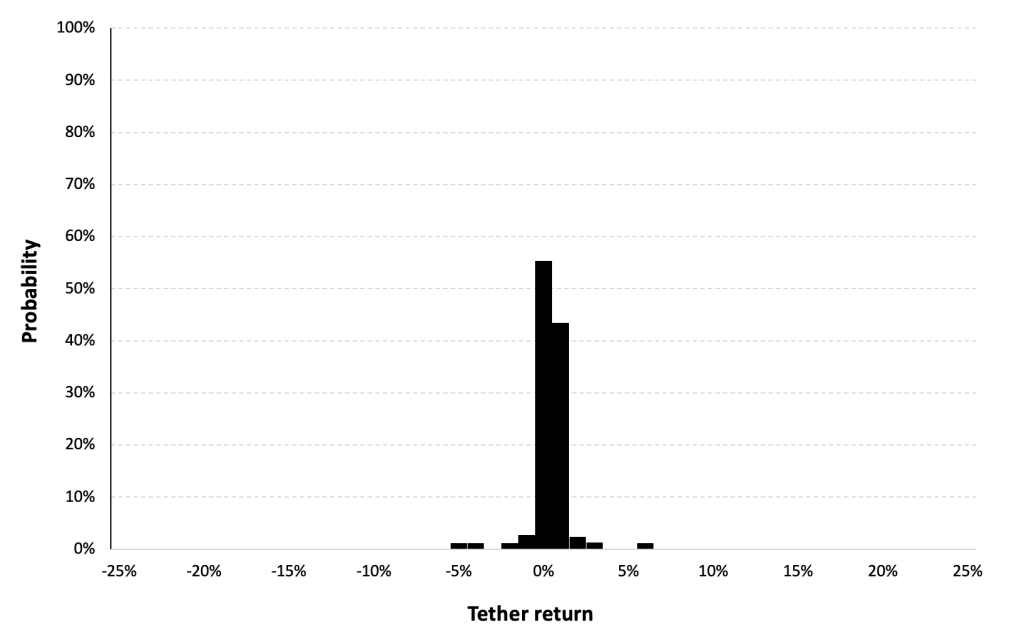
Figure 5 represents the historical distribution of the Tether daily returns for the period from November 09, 2017 to December 31, 2022.

Figure 5. Historical Tether distribution of the returns.

Source: computation by the author (data: Yahoo! Finance website).

Gaussian distribution

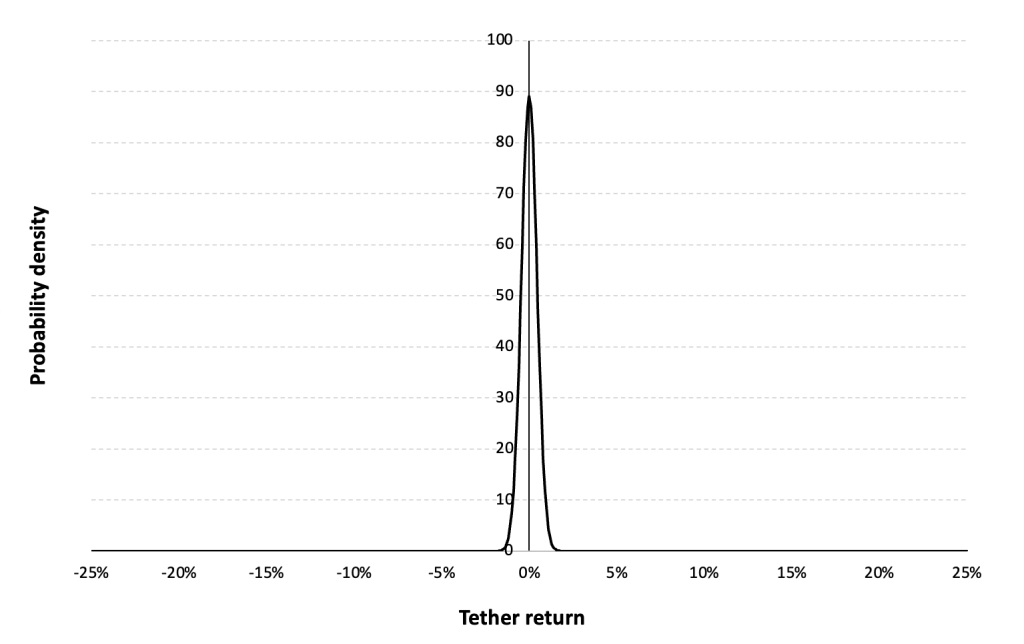
The Gaussian distribution (also called the normal distribution) is a parametric distribution with two parameters: the mean and the standard deviation of returns. We estimated these two parameters over the period from November 09, 2017 to December 31, 2022.

Figure 6 below represents the Gaussian distribution of the Tether daily returns with parameters estimated over the period from November 09, 2017 to December 31, 2022.

Figure 6. Gaussian distribution of the Tether returns.

Source: computation by the author (data: Yahoo! Finance website).

Risk measures of the Tether returns

The R program that you can download above also allows you to compute risk measures about the returns of the tether.

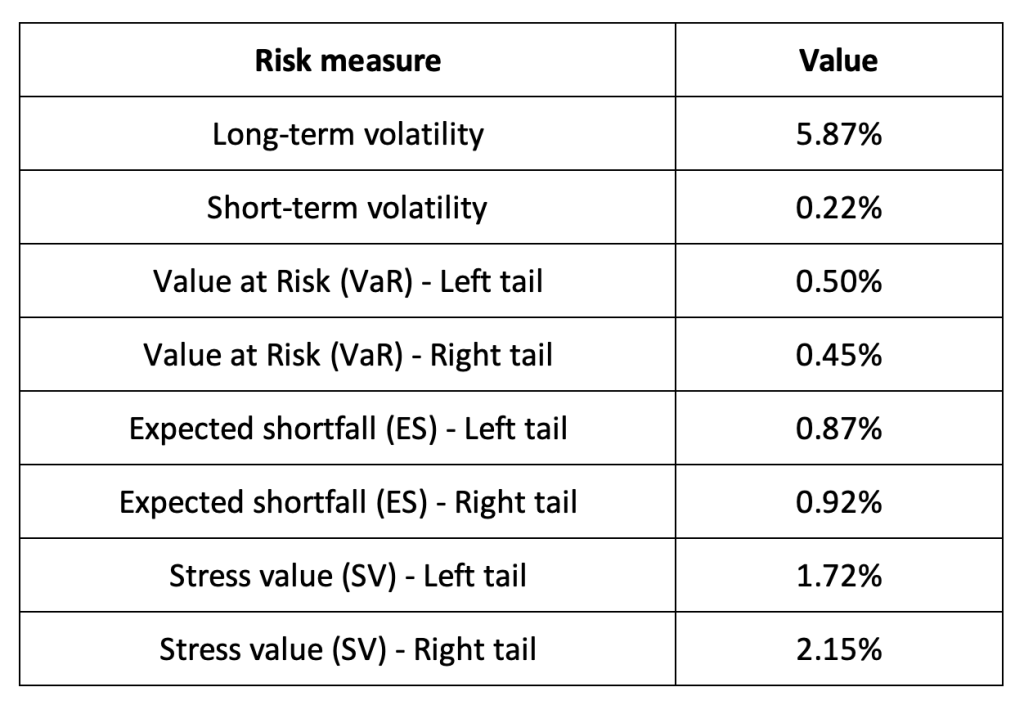
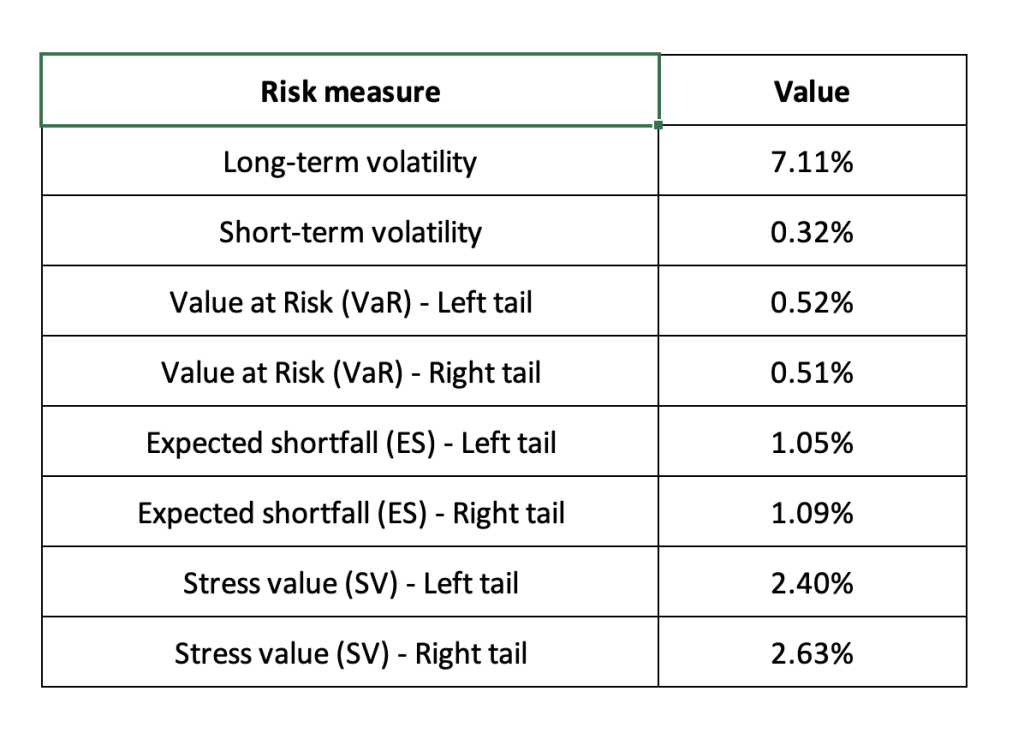
Table 3 below presents the following risk measures estimated for the Ethereum:

  • The long-term volatility (the unconditional standard deviation estimated over the entire period)
  • The short-term volatility (the standard deviation estimated over the last three months)
  • The Value at Risk (VaR) for the left tail (the 5% quantile of the historical distribution)
  • The Value at Risk (VaR) for the right tail (the 95% quantile of the historical distribution)
  • The Expected Shortfall (ES) for the left tail (the average loss over the 5% quantile of the historical distribution)
  • The Expected Shortfall (ES) for the right tail (the average loss over the 95% quantile of the historical distribution)
  • The Stress Value (SV) for the left tail (the 1% quantile of the tail distribution estimated with a Generalized Pareto distribution)
  • The Stress Value (SV) for the right tail (the 99% quantile of the tail distribution estimated with a Generalized Pareto distribution)

Table 5. Risk measures for the Tether.

Source: computation by the author (data: Yahoo! Finance website).

The volatility is a global measure of risk as it considers all the returns. The Value at Risk (VaR), Expected Shortfall (ES) and Stress Value (SV) are local measures of risk as they focus on the tails of the distribution. The study of the left tail is relevant for an investor holding a long position in the XRP while the study of the right tail is relevant for an investor holding a short position in the XRP.

Why should I be interested in this post?

Tether is a compelling subject for students, especially those in finance, economics, business, and technology. Ripple’s focus on revolutionizing cross-border transactions and its unique blockchain technology offer insights into innovations in financial technology. Exploring Tether provides a deeper understanding of blockchain, cryptocurrency markets, stable coins, regulatory challenges, and the practical applications of decentralized systems. Students can gain valuable knowledge about market dynamics, investment opportunities, and the intersection of technology and finance by delving into the complexities of Tether and its impact on the financial industry.

Related posts on the SimTrade blog

About cryptocurrencies

   ▶ Snehasish CHINARA Bitcoin: the mother of all cryptocurrencies

   ▶ Snehasish CHINARA How to get crypto data

   ▶ Alexandre VERLET Cryptocurrencies

   ▶ Youssef EL QAMCAOUIDecentralised Financing

   ▶ Hugo MEYERThe regulation of cryptocurrencies: what are we talking about?

   ▶ JOHN M. GRIFFIN, AMIN SHAMS Is Bitcoin Really Untethered?

About statistics

   ▶ Shengyu ZHENG Moments de la distribution

   ▶ Shengyu ZHENG Mesures de risques

   ▶ Jayati WALIA Returns

Useful resources

Academic research about risk

Longin F. (2000) From VaR to stress testing: the extreme value approach Journal of Banking and Finance, N°24, pp 1097-1130.

Longin F. (2016) Extreme events in finance: a handbook of extreme value theory and its applications Wiley Editions.

Data

Yahoo! Finance

Yahoo! Finance Historical data for Tether

CoinMarketCap Historical data for Tether

About the author

The article was written in January 2024 by Snehasish CHINARA (ESSEC Business School, Grande Ecole Program – Master in Management, 2022-2024).

Ethereum – Unleashing Blockchain Innovation

Ethereum – Unleashing Blockchain Innovation

 Snehasish CHINARA

In this article, Snehasish CHINARA (ESSEC Business School, Grande Ecole Program – Master in Management, 2022-2024) explains Bitcoin which is considered as the mother of all cryptocurrencies.

Historical context and background

Ethereum is a groundbreaking blockchain platform that emerged in the wake of Bitcoin’s success in 2015. While Bitcoin introduced and popularized the blockchain concept, Ethereum has leveraged this technology more effectively than any other digital currency. Promoters of new projects tend to rely on Ethereum’s tools rather than embark on the lengthy and expensive process of developing a new blockchain. Ethereum was conceived by a young Canadian programmer, Vitalik Buterin, who saw limitations in Bitcoin’s functionality and envisioned a decentralized platform capable of executing smart contracts. Buterin’s idea gained traction in the cryptocurrency community, and he, along with a team of developers, published the Ethereum whitepaper in late 2013. The platform’s official development began in 2014, with a crowdfunding campaign that raised over $18 million in Bitcoin, making it one of the most successful initial coin offerings (ICOs) of its time. Ethereum’s genesis block was mined on July 30, 2015, marking the official launch of the network.

Ethereum’s innovative concept of smart contracts and decentralized applications (DApps) quickly garnered attention within the blockchain and cryptocurrency space. The platform introduced a Turing-complete programming language, enabling developers to create a wide array of decentralized applications. Ethereum’s native cryptocurrency, Ether (ETH), serves as both a digital currency and a utility token within the ecosystem. Over the years, Ethereum has undergone several network upgrades to improve scalability and security, most notably the transition from a proof-of-work (PoW) to a proof-of-stake (PoS) consensus mechanism with the Ethereum 2.0 upgrade. This transition aims to address the network’s scalability issues and reduce its energy consumption, positioning Ethereum as a sustainable and versatile blockchain platform for the future. Today, Ethereum continues to play a pivotal role in the blockchain and decentralized finance (DeFi) space, powering a vast array of projects, including NFT platforms, decentralized exchanges, and decentralized applications that have reshaped the way we think about finance and technology.

Ethereum Logo
Ethereum Logo
Source: Yahoo! Finance .

Figure 1. Key Dates in Ethereum History
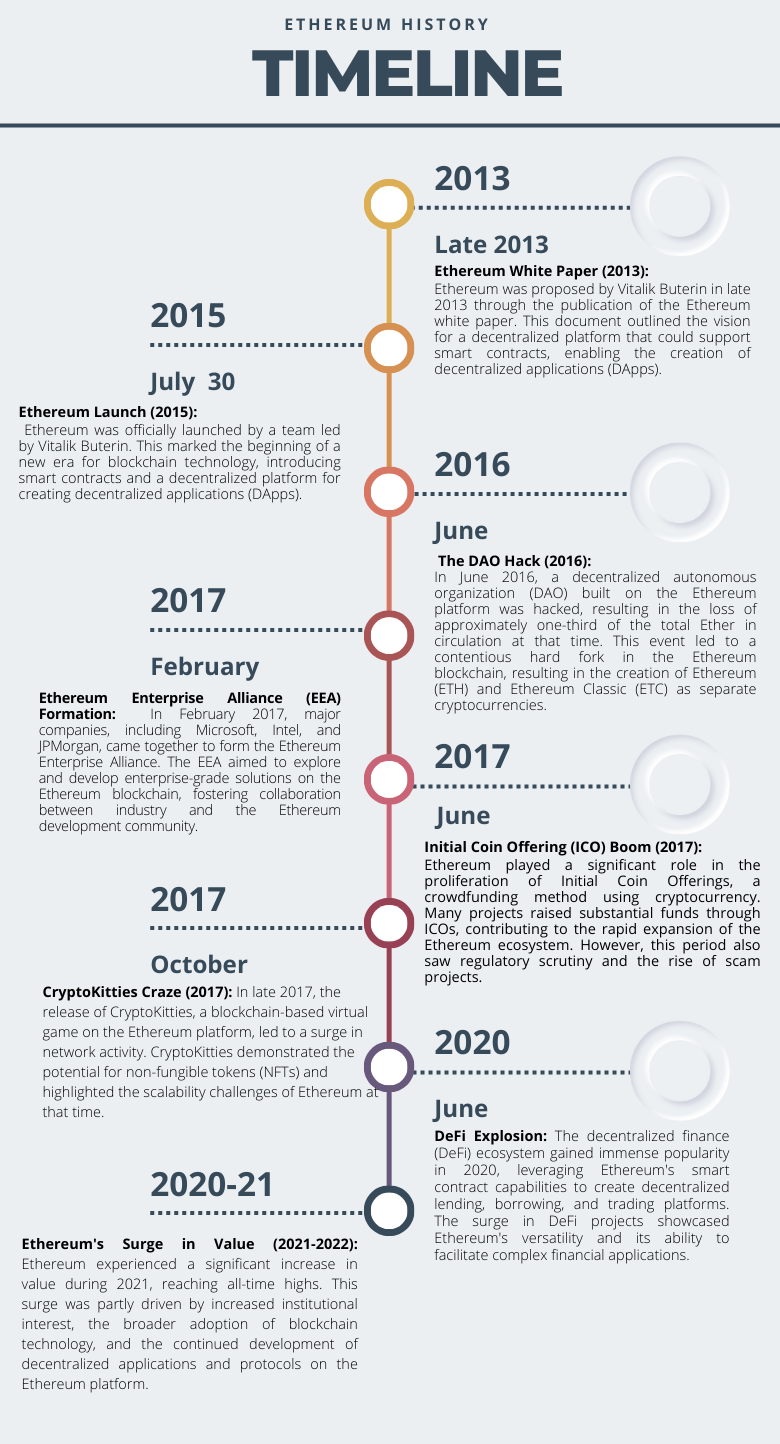
 Key Dates in Ethereum History
Source: Yahoo! Finance .

Key Features of Ethereum

Smart Contracts

Ethereum is renowned for its pioneering smart contract functionality. Smart contracts are self-executing agreements with predefined rules and conditions, enabling automated and trustless transactions. This feature has broad applications in various industries, including finance, supply chain management, and legal services.

Decentralization

Ethereum operates on a decentralized network of nodes, making it resistant to censorship and single points of failure. This decentralization ensures the security and integrity of the blockchain, with no single entity having control over the network.

Ether (ETH)

Ethereum’s native cryptocurrency, Ether, serves as both a digital currency and a utility token. It’s used to pay for transaction fees, secure the network through staking in Ethereum 2.0, and as a medium of exchange within the ecosystem.

Interoperability

Ethereum is designed to interact with other blockchains and networks, fostering compatibility and collaboration across the blockchain ecosystem. Projects like Polkadot and Cosmos aim to enhance this interoperability.

EVM (Ethereum Virtual Machine)

The Ethereum Virtual Machine is a runtime environment for executing smart contracts. It’s a critical component that ensures the same execution of smart contracts across all Ethereum nodes, making Ethereum’s ecosystem reliable and consistent.

EIPs (Ethereum Improvement Proposals)

Ethereum has a robust governance model for protocol upgrades and improvements, with EIPs serving as the mechanism for proposing and implementing changes. This allows for community-driven innovation and adaptation.

Use Cases of Ethereum

Decentralized Finance (DeFi)

Ethereum is at the heart of the DeFi movement, offering lending, borrowing, trading, and yield farming services through DApps like Compound, Aave, and Uniswap. DeFi has disrupted traditional finance, providing open and inclusive access to financial services.

Non-Fungible Tokens (NFTs)

Ethereum’s ERC-721 and ERC-1155 token standards have fueled the NFT boom. NFTs enable the ownership and trade of unique digital assets, from art and music to virtual real estate and collectibles, all recorded on the blockchain.

Supply Chain Management

Ethereum’s transparent and tamper-proof ledger is used to track and verify the authenticity and provenance of products. This enhances supply chain efficiency and trust, reducing fraud and counterfeiting.

Gaming and Virtual Worlds

Ethereum is the platform of choice for blockchain-based gaming and virtual reality experiences. DApps like Decentraland and Axie Infinity allow users to trade in-game assets and participate in virtual economies.

Tokenization of Assets

Real-world assets, such as real estate, stocks, and commodities, can be tokenized on the Ethereum blockchain, making them more accessible for investment and trading.

Identity Verification

Ethereum can be used to secure and manage digital identities, enhancing privacy and reducing the risk of identity theft.

Social Impact

Ethereum is leveraged for social impact projects, including humanitarian aid distribution, voting systems, and tracking philanthropic donations, ensuring transparency and accountability.

Content Distribution

Ethereum-based projects are exploring decentralized content platforms, enabling creators to have more control over their intellectual property and revenue.

Ethereum’s versatility and ongoing development make it a crucial platform for a wide range of applications, from financial innovation to social change and beyond, driving the evolution of the blockchain and cryptocurrency space.

Technology and underlying blockchain

Ethereum’s underlying technology is rooted in blockchain, a distributed ledger system known for its security, transparency, and decentralization. Ethereum, like Bitcoin, employs a blockchain to record and verify transactions, but it offers a distinct set of features and capabilities that set it apart. At the core of Ethereum’s technology is the Ethereum Virtual Machine (EVM), a decentralized computing environment that executes smart contracts. Smart contracts are self-executing agreements with predefined rules and conditions that automate processes without the need for intermediaries.

Ethereum uses a consensus mechanism known as Proof of Stake (PoS), which is a significant departure from Bitcoin’s Proof of Work (PoW). PoS allows network participants, known as validators, to create new blocks and secure the network by locking up a certain amount of Ether as collateral. This approach is more energy-efficient and scalable compared to PoW, addressing some of the limitations that Bitcoin faces. Ethereum’s blockchain is a public and permissionless network, meaning that anyone can participate, transact, and develop decentralized applications (DApps) on the platform without needing approval.

The Ethereum ecosystem also employs a variety of token standards, with ERC-20 and ERC-721 being the most well-known. ERC-20 tokens are fungible and often used for cryptocurrencies, while ERC-721 tokens are non-fungible and have powered the explosion of NFTs (Non-Fungible Tokens). These standards have facilitated the creation and interoperability of a vast array of digital assets and DApps on the platform. Ethereum’s robust governance model, through Ethereum Improvement Proposals (EIPs), allows the community to suggest and implement changes, ensuring that the platform remains adaptable and responsive to evolving needs and challenges. Ethereum’s groundbreaking technology and active development community have positioned it as a leader in the blockchain space, with far-reaching implications for industries beyond just cryptocurrencies.

Supply of coins

Ethereum initially used a proof-of-work (PoW) consensus algorithm for coin mining, similar to Bitcoin. The process involved miners solving complex mathematical puzzles to validate transactions and add new blocks to the blockchain. Miners competed to solve these puzzles, and the first one to succeed was rewarded with newly minted Ethereum coins (ETH). This process was resource-intensive and required significant computational power.

However, Ethereum has been undergoing a transition to a proof-of-stake (PoS) consensus mechanism as part of its Ethereum 2.0 upgrade. The PoS model doesn’t rely on miners solving computational puzzles but instead relies on validators who lock up a certain amount of cryptocurrency as collateral to propose and validate new blocks. Validators are chosen to create new blocks based on the amount of cryptocurrency they hold and are willing to “stake” as collateral.

This transition to PoS is occurring in multiple phases. The Beacon Chain, which is the PoS blockchain that runs parallel to the existing PoW chain, was launched in December 2020. The full transition to Ethereum 2.0, including the complete shift to PoS, is expected to occur in multiple subsequent phases.

As of Q1 2023, there are approximately 121,826,163.06 Ethereum (ETH) coins in circulation, a key distinction from Bitcoin, which has a capped supply of 21 million. Ethereum, created by Vitalik Buterin, was designed without a specific supply limit, allowing for an unlimited number of coins if mining continues. Despite this, there is a cap of 18 million ETH coins that can be mined annually, equating to around 2 ETH per block. Ethereum Classic (ETC), a separate blockchain resulting from a community dispute, also exists with 135.3 billion coins. The Ethereum blockchain’s size was 175 GB in 2021, considerably smaller than Bitcoin’s 412 GB. Approximately 5750 Ethereum blocks are mined daily, with mining difficulty increasing and around 2,151 active nodes globally, primarily in the USA. Ethereum’s potential to become deflationary is acknowledged, contingent on mining costs exceeding rewards, as stated in a GitHub disclaimer.

Figure 2. Number of Ethereum Transaction per Day
Number of bitcoins in circulation
Source: BitInfoCharts (Ethereum Transactions historical chart).

Historical data for Ethereum

How to get the data?

The Ethereum is the most popular cryptocurrency on the market, and historical data for the Ethereum such as prices and volume traded can be easily downloaded from the internet sources such as Yahoo! Finance, Blockchain.com & CoinMarketCap. For example, you can download data for Ethereum on Yahoo! Finance (the Yahoo! code for Ethereum is ETH-USD).

Figure 4. Ethereum data
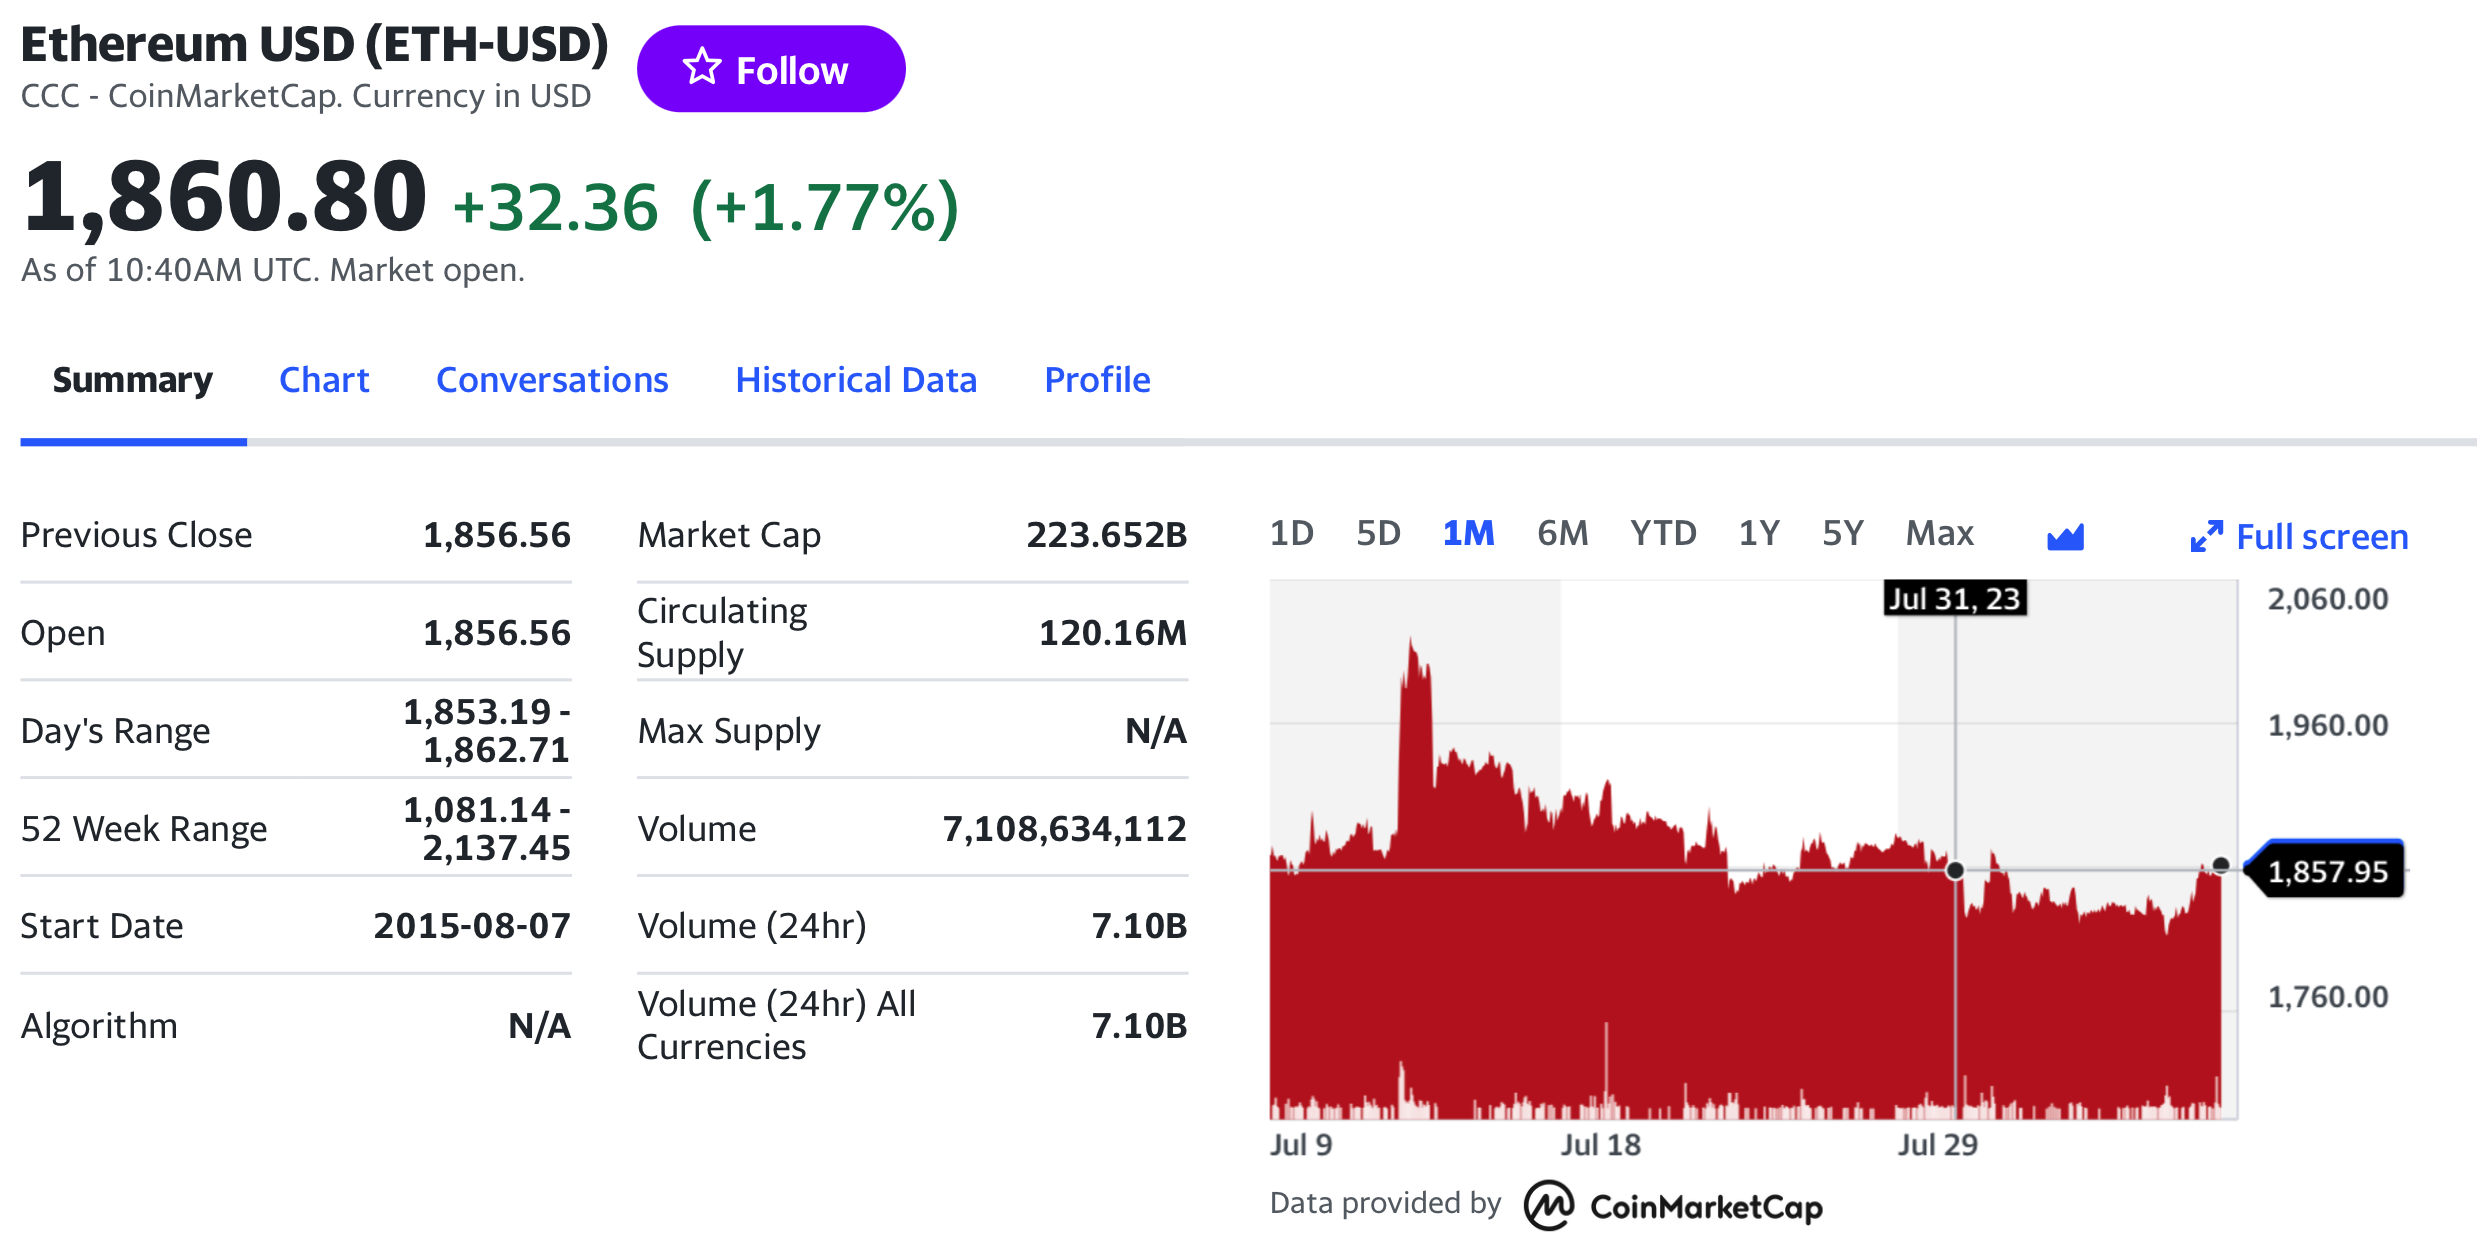
 Ethereum data
Source: Yahoo! Finance.

Historical data for the Ethereum market prices

Historical data on the price of Ethereum holds paramount significance in understanding the cryptocurrency’s market trends, investor behavior, and overall performance over time. Analyzing historical price data allows investors, analysts, and researchers to identify patterns, cycles, and potential indicators that may influence future price movements. It provides valuable insights into market sentiment, periods of volatility, and the impact of significant events or developments within the Ethereum ecosystem. Traders use historical data to formulate strategies, assess risk, and make informed decisions. Furthermore, the data aids in evaluating the success of protocol upgrades, regulatory changes, and shifts in broader economic conditions, offering a comprehensive view of Ethereum’s evolution. The historical price data of Ethereum serves as a crucial tool for market participants seeking to navigate the dynamic and sometimes unpredictable nature of the cryptocurrency market.

With the number of coins in circulation, the information on the price of coins for a given currency is also important to compute Ethereum’s market capitalization.

Figure 5 below represents the evolution of the price of Ethereum in US dollar over the period Nov 2017 – Dec 2023. The price corresponds to the “closing” price (observed at 10:00 PM CET at the end of the month).

Figure 5. Evolution of the Ethereum price
Source: Yahoo! Finance.

R program

The R program below written by Shengyu ZHENG allows you to download the data from Yahoo! Finance website and to compute summary statistics and risk measures about the Ethereum.

Download R file

Data file

The R program that you can download above allows you to download the data for the Ethereum from the Yahoo! Finance website. The database starts on December, 2017.

Table 3 below represents the top of the data file for the Ethereum downloaded from the Yahoo! Finance website with the R program.

Table 3. Top of the data file for the Ethereum.
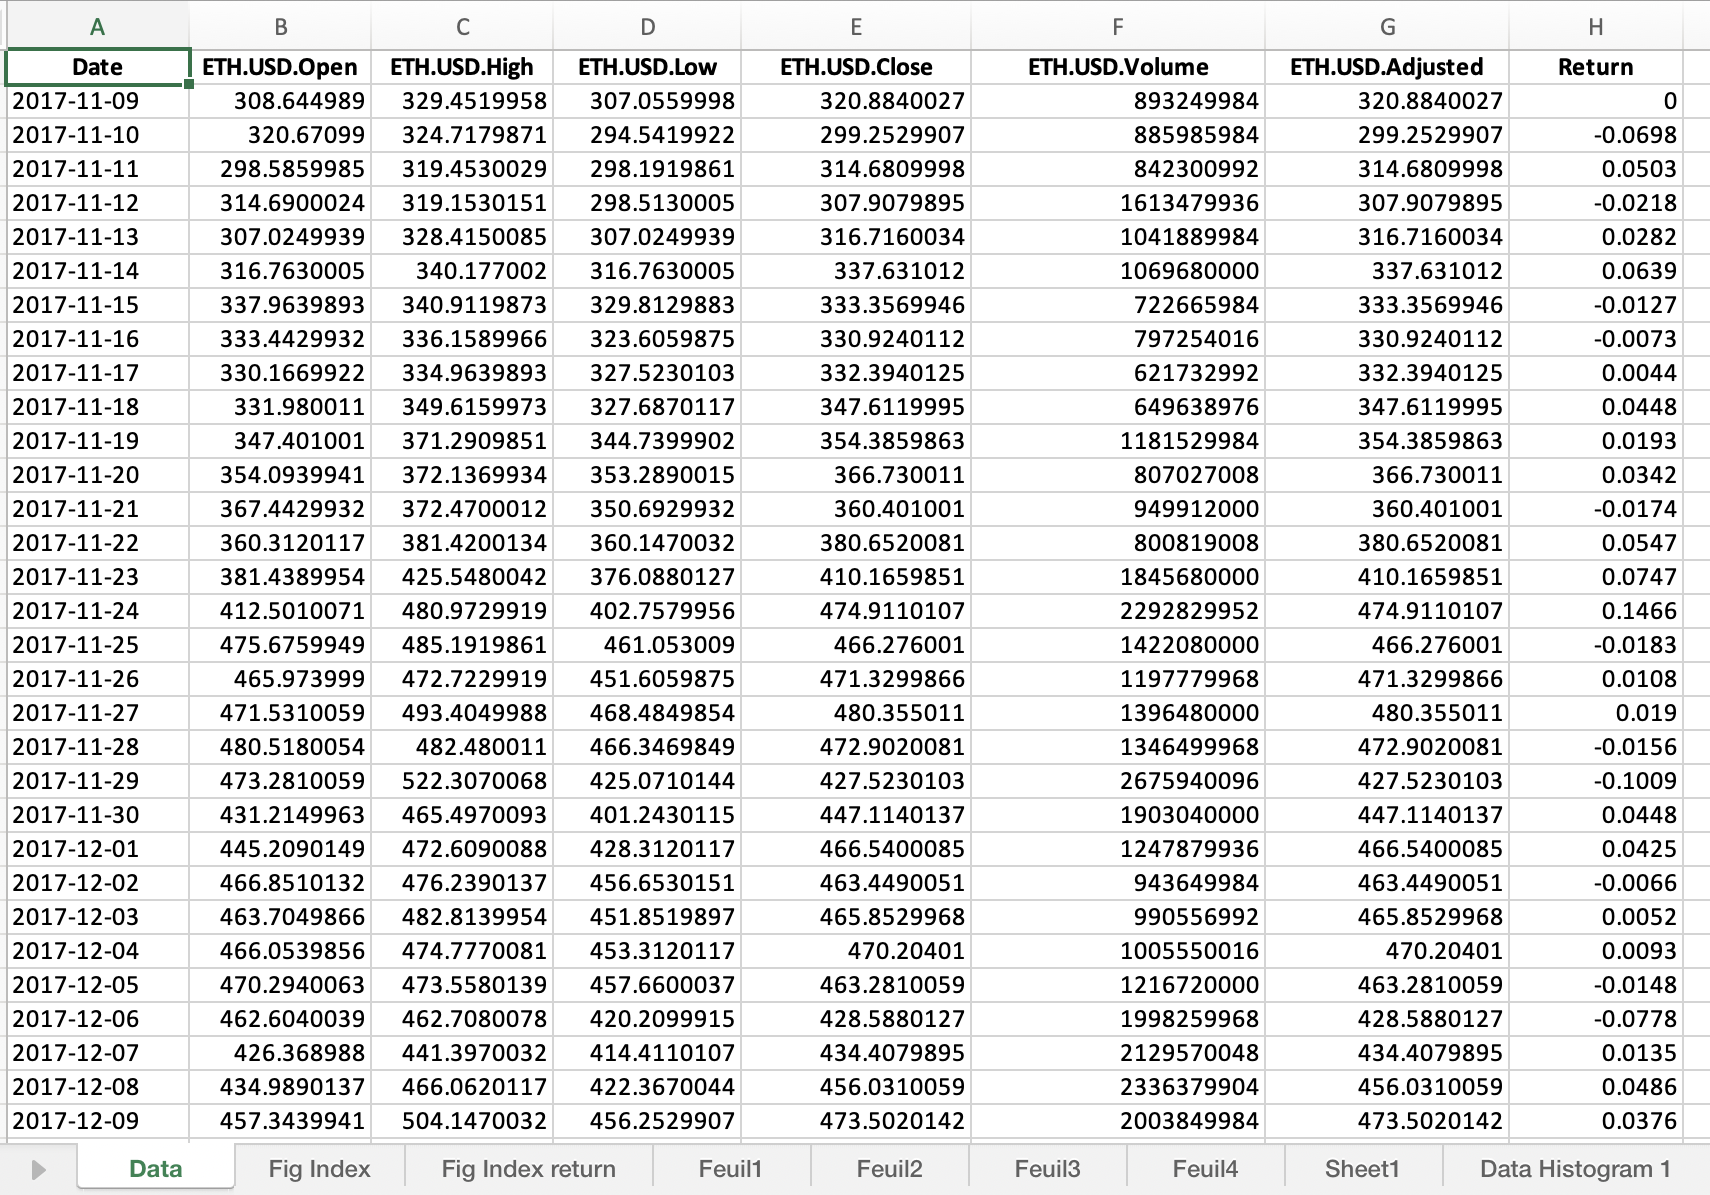
Top of the file for the Ethereum data
Source: computation by the author (data: Yahoo! Finance website).

Python code

You can download the Python code used to download the data from Yahoo! Finance.

Download the Excel file with Ethereum data

Python script to download Ethereum historical data and save it to an Excel sheet::

import yfinance as yf
import pandas as pd

# Define the ticker symbol for Ethereum
eth_ticker = “ETH-USD”

# Define the date range for historical data
start_date = “2020-01-01”
end_date = “2022-01-01”

# Download historical data using yfinance
eth_data = yf.download(eth_ticker, start=start_date, end=end_date)

# Create a Pandas DataFrame from the downloaded data
eth_df = pd.DataFrame(eth_data)

# Define the Excel file path
excel_file_path = “ethereum_historical_data.xlsx”

# Save the data to an Excel sheet
eth_df.to_excel(excel_file_path, sheet_name=”ETH Historical Data”)

print(f”Data saved to {excel_file_path}”)

# Make sure you have the required libraries installed and adjust the “start_date” and “end_date” variables to the desired date range for the historical data you want to download.

Evolution of the Ethereum

Figure 6 below gives the evolution of the Ethereum on a daily basis.

Source: computation by the author (data: Yahoo! Finance website).

Figure 6. Evolution of the Ethereum.
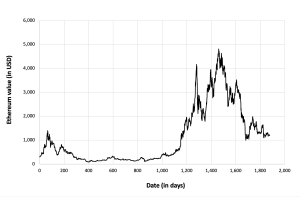
Source: computation by the author (data: Yahoo! Finance website).

Figure 2 below gives the evolution of the Ethereum returns from November 09, 2017 to December 31, 2022 on a daily basis.

Figure 7. Evolution of the Ethereum returns.
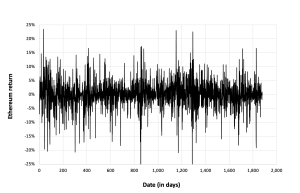
Source: computation by the author (data: Yahoo! Finance website).

Summary statistics for the Ethereum

The R program that you can download above also allows you to compute summary statistics about the returns of the Ethereum.

Table 4 below presents the following summary statistics estimated for the Ethereum:

  • The mean
  • The standard deviation (the squared root of the variance)
  • The skewness
  • The kurtosis.

The mean, the standard deviation / variance, the skewness, and the kurtosis refer to the first, second, third and fourth moments of statistical distribution of returns respectively.

Table 4. Summary statistics for the Ethereum.
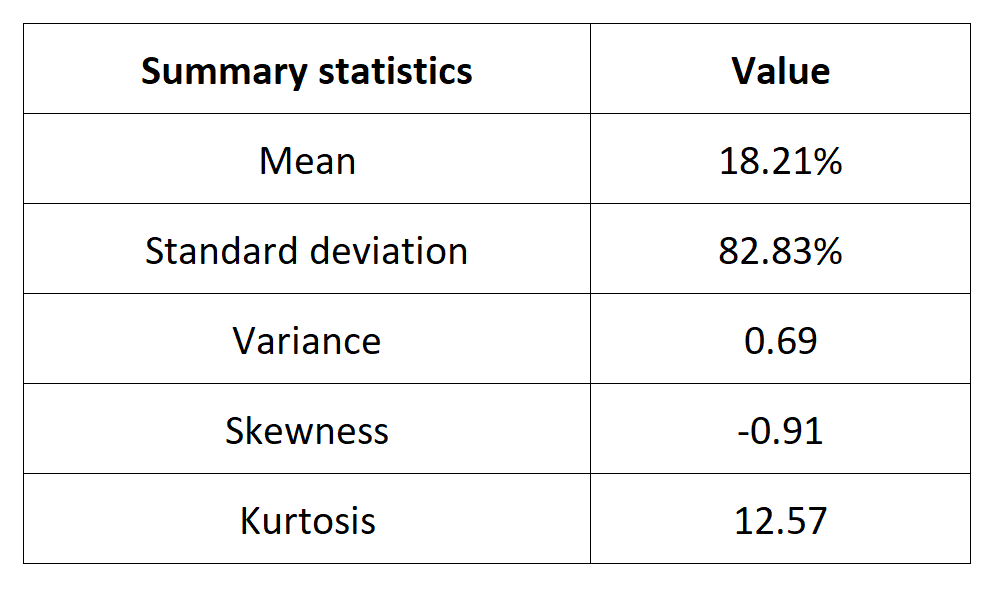
Summary statistics for the Ethereum
Source: computation by the author (data: Yahoo! Finance website).

Statistical distribution of the Ethereum returns

Historical distribution

Figure 8 represents the historical distribution of the Ethereum daily returns for the period from November 09, 2017 to December 31, 2022.

Figure 8. Historical Ethereum distribution of the returns.
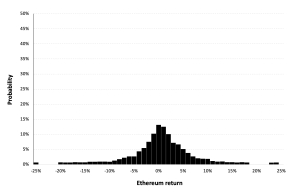
Source: computation by the author (data: Yahoo! Finance website).

Gaussian distribution

The Gaussian distribution (also called the normal distribution) is a parametric distribution with two parameters: the mean and the standard deviation of returns. We estimated these two parameters over the period from November 09, 2017 to December 31, 2022. The annualized mean of daily returns is equal to 30.81% and the annualized standard deviation of daily returns is equal to 62.33%.

Figure 9 below represents the Gaussian distribution of the Ethereum daily returns with parameters estimated over the period from November 09, 2017 to December 31, 2022.

Figure 9. Gaussian distribution of the Ethereum returns.
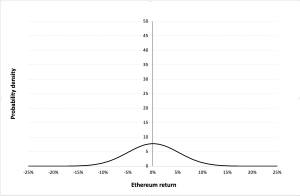
Source: computation by the author (data: Yahoo! Finance website).

Risk measures of the Ethereum returns

The R program that you can download above also allows you to compute risk measures about the returns of the Ethereum.

Table 5 below presents the following risk measures estimated for the Ethereum:

  • The long-term volatility (the unconditional standard deviation estimated over the entire period)
  • The short-term volatility (the standard deviation estimated over the last three months)
  • The Value at Risk (VaR) for the left tail (the 5% quantile of the historical distribution)
  • The Value at Risk (VaR) for the right tail (the 95% quantile of the historical distribution)
  • The Expected Shortfall (ES) for the left tail (the average loss over the 5% quantile of the historical distribution)
  • The Expected Shortfall (ES) for the right tail (the average loss over the 95% quantile of the historical distribution)
  • The Stress Value (SV) for the left tail (the 1% quantile of the tail distribution estimated with a Generalized Pareto distribution)
  • The Stress Value (SV) for the right tail (the 99% quantile of the tail distribution estimated with a Generalized Pareto distribution)

Table 5. Risk measures for the Ethereum.
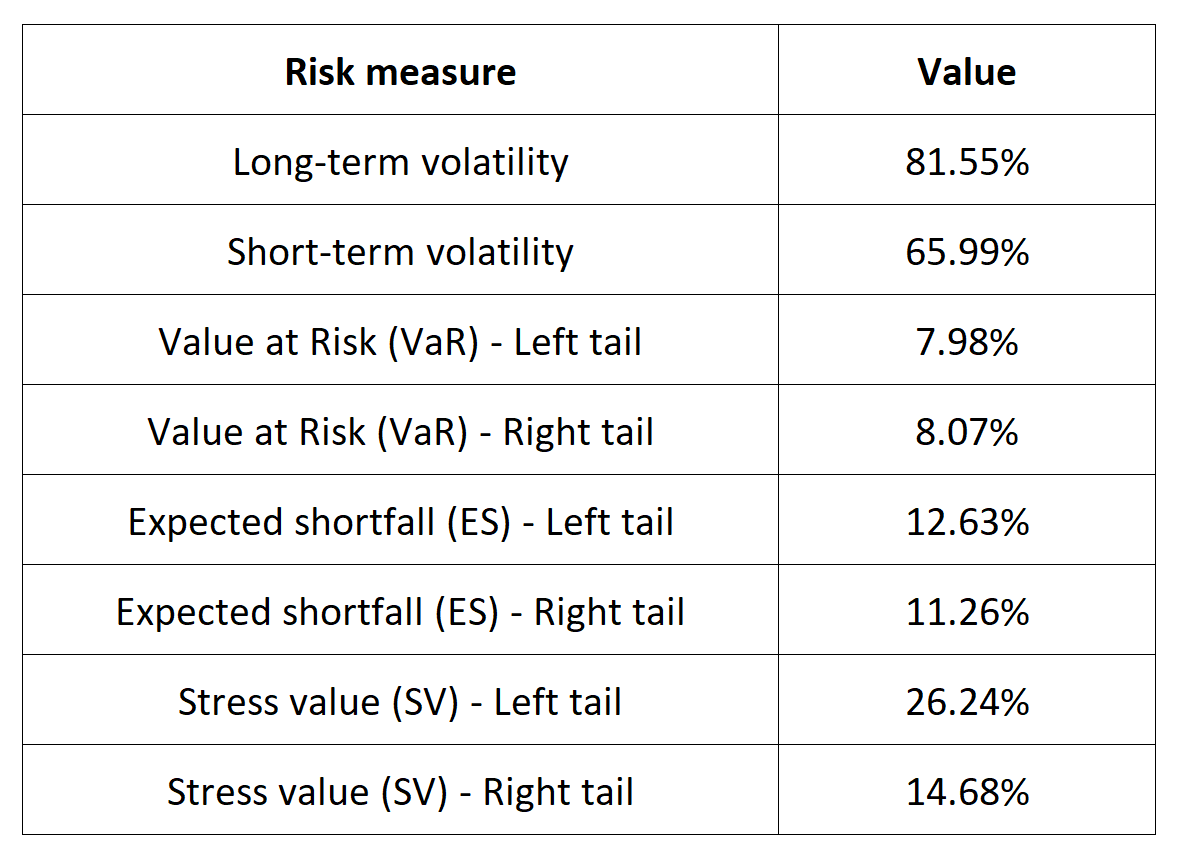
Risk measures for the Ethereum
Source: computation by the author (data: Yahoo! Finance website).

The volatility is a global measure of risk as it considers all the returns. The Value at Risk (VaR), Expected Shortfall (ES) and Stress Value (SV) are local measures of risk as they focus on the tails of the distribution. The study of the left tail is relevant for an investor holding a long position in the Ethereum while the study of the right tail is relevant for an investor holding a short position in the Ethereum.
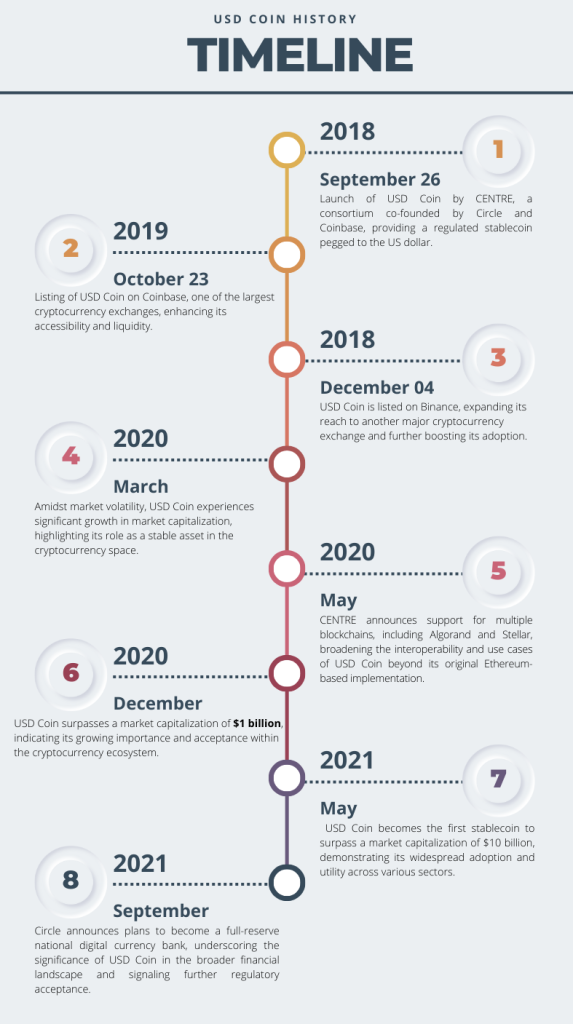
Why should I be interested in this post?

Ethereum, the pioneering blockchain platform, is an essential topic for management students due to its potential to transform industries, create innovative business opportunities, and disrupt traditional financial systems. Understanding Ethereum’s smart contracts, DeFi ecosystem, NFT market, and global impact can provide students with a competitive edge in a rapidly evolving business landscape, enabling them to navigate emerging trends, make informed investment decisions, and explore entrepreneurship in the digital economy.

Related posts on the SimTrade blog

About cryptocurrencies

▶ Snehasish CHINARA Bitcoin: the mother of all cryptocurrencies

▶ Snehasish CHINARA How to get crypto data

▶ Alexandre VERLET Cryptocurrencies

▶ Youssef EL QAMCAOUI Decentralised Financing

▶ Hugo MEYER The regulation of cryptocurrencies: what are we talking about?

About statistics

▶ Shengyu ZHENG Moments de la distribution

▶ Shengyu ZHENG Mesures de risques

▶ Jayati WALIA Returns

Useful resources

Academic research about risk

Longin F. (2000) From VaR to stress testing: the extreme value approach Journal of Banking and Finance, N°24, pp 1097-1130.

Longin F. (2016) Extreme events in finance: a handbook of extreme value theory and its applications Wiley Editions.

Data

Yahoo! Finance

Yahoo! Finance Historical data for Ethereum

CoinMarketCap Historical data for Ethereum

About the author

The article was written in December 2023 by Snehasish CHINARA (ESSEC Business School, Grande Ecole Program – Master in Management, 2022-2024).