Derivatives Market

In this article, Jayati WALIA (ESSEC Business School, Grande Ecole Program – Master in Management, 2019-2022) presents an overview of derivatives market.
Introduction
A financial market refers to a marketplace where various kinds of financial securities such as stocks, bonds, commodities, etc. are traded. The term ‘market’ can also refer to exchanges that are legal organizations that facilitate the trade of financial securities between buyers and sellers. In any case, these markets are categorized based of the type of financial securities that are traded through them. One such financial market is the Derivatives Market.
Derivatives market thus refers to the financial marketplace where derivative instruments such as futures, forwards and options contracts are traded between counterparties.
It was during the 1980s and 1990s that the financial markets saw a major growth in the trade of derivatives. A derivative is a financial instrument whose value is derived from the value of an underlying asset such as stocks, bonds, currencies, commodities, interest rates and/or different market indices. These underlying assets have fluctuating prices and returns, and derivatives provides a means to investors to reduce the risk exposure and leverage profits on these assets. Thus, derivatives are an essential class of financial instruments and central to the modern financial markets providing not just economic benefits but also resilience against risks. The most common derivatives include futures, forwards, options and swap contracts.
As per the European Securities and Markets Authority (ESMA), derivatives market has grown impressively (around 24 percent per year in the last decade) into a truly global market with over €680 trillion of notional amount outstanding. The interest rate derivatives (IRDs) accounted for 82% of the total notional amount outstanding followed by currency derivatives at 11%.
Main types of derivative contracts
Derivatives derive their value from an underlying asset, or simply an ‘underlying’. There is a wide range of financial instruments that can be an underlying for a derivative such as equities or equity index, fixed-income instruments, foreign currencies, commodities, and even other securities. And thus, depending on the underlying, derivative contracts can derive their values from corresponding equity prices, interest rates, foreign exchange rates, prices of commodities and probable credit events. The most common types of derivative contracts are elucidated below:
Forwards and Futures
Forward and futures contracts share a similar feature: they are an agreement between two parties to buy or sell a specified quantity of an underlying asset at a specified price (or ‘exercise price’) on a predetermined date in the future (or ‘expiration date’). While forwards are customized contracts i.e., they can be tailor-made according to the asset being traded, expiry date and price, and traded Over-the-Counter (OTC), futures are standardized contracts traded on centralized exchanges. The party that buys the underlying is said to be taking a long position while the party that sells the asset takes a short position and both parties are obligated to fulfil their part of the contract.
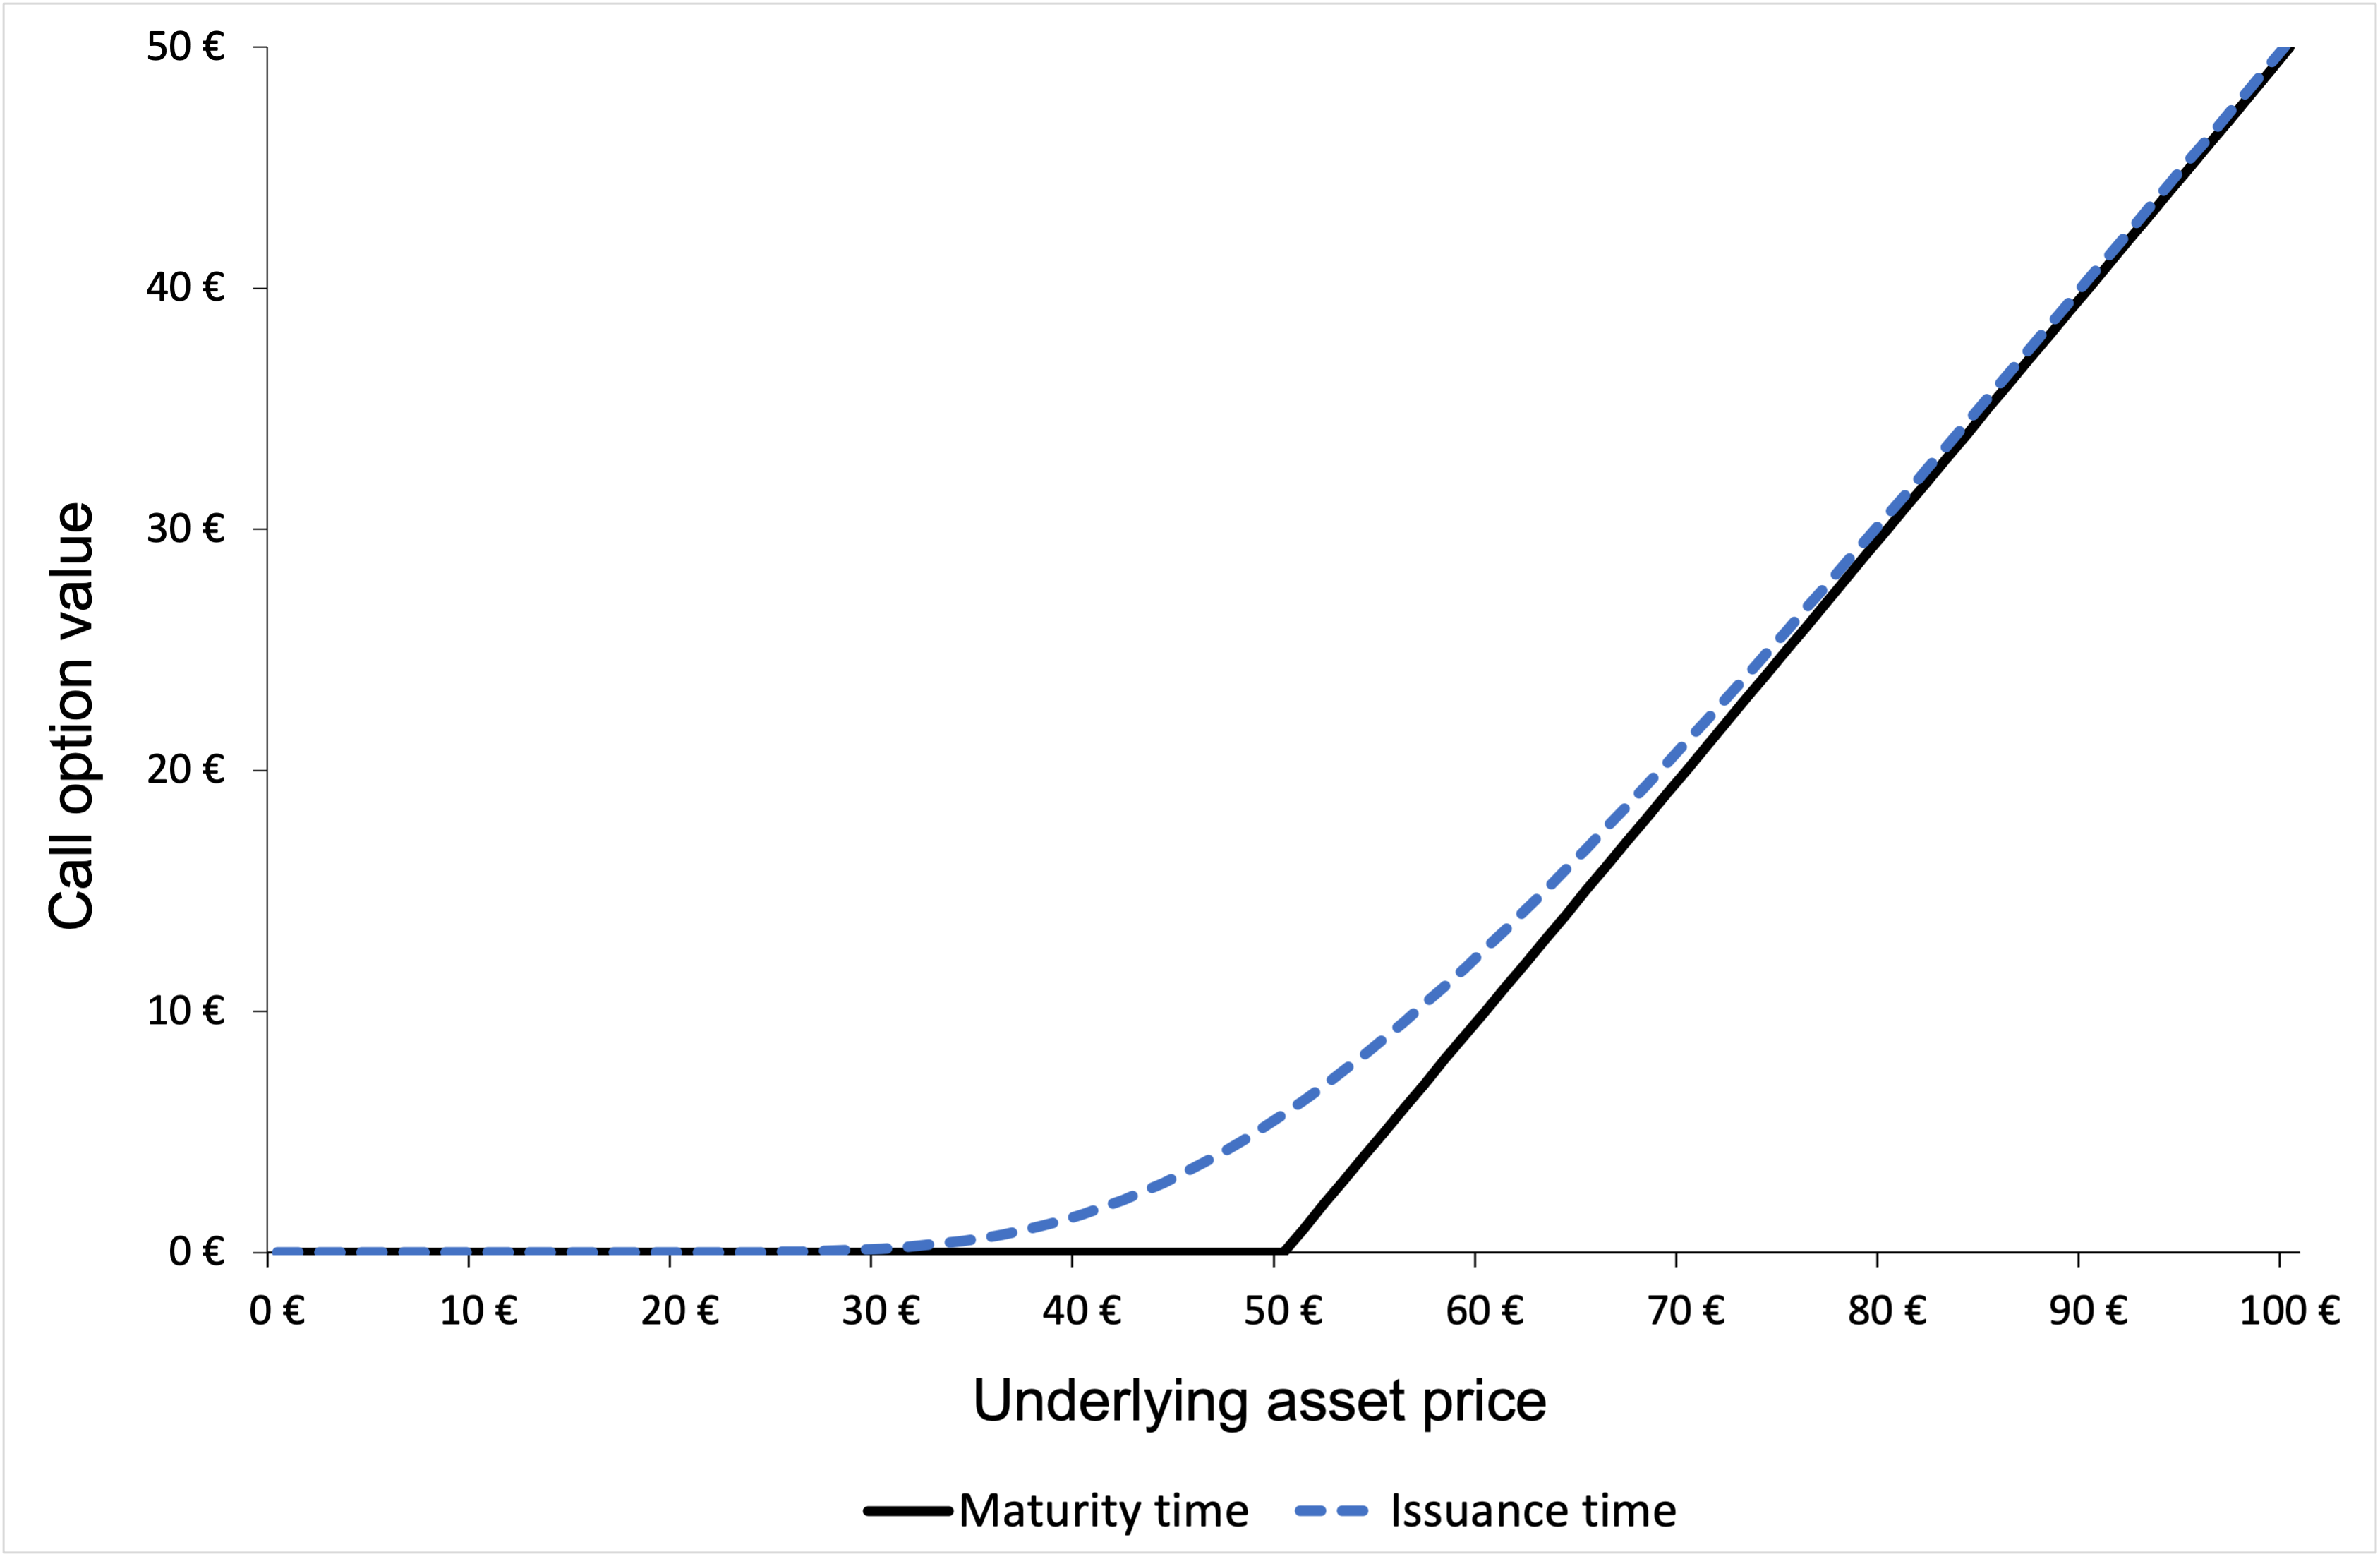
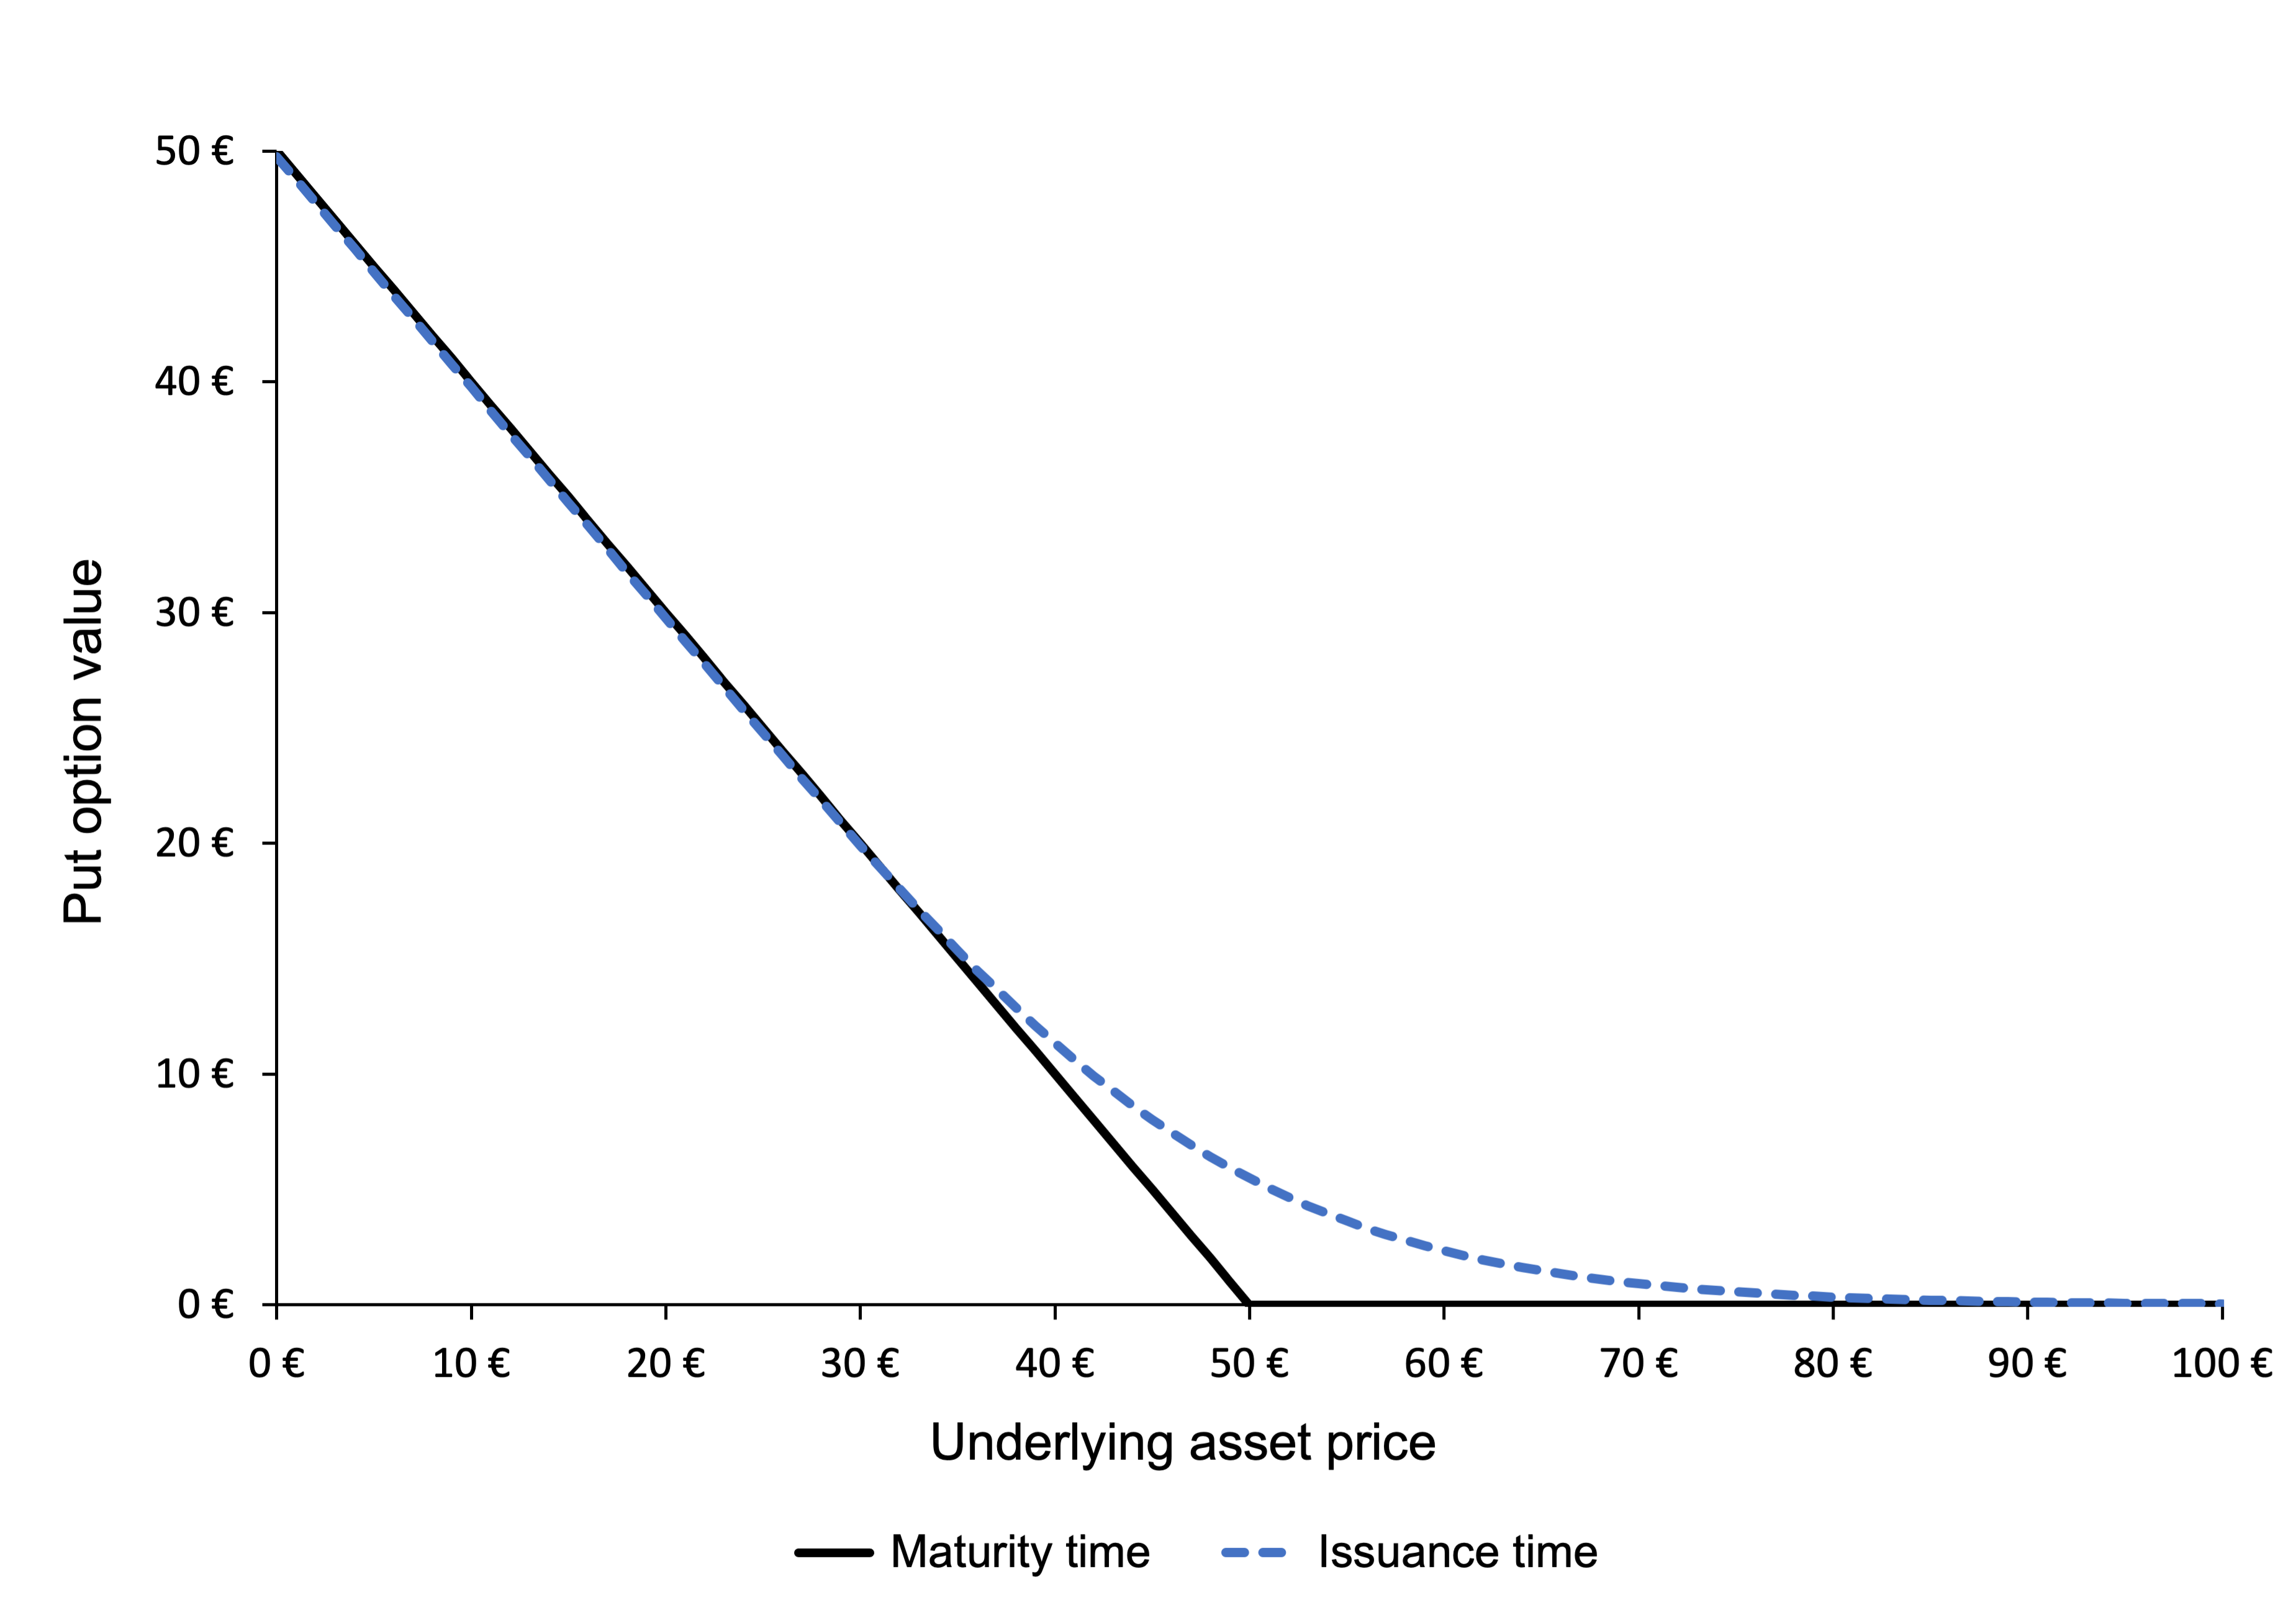
Options
An option contract is a financial derivative that gives its holder the right (but not the obligation) to trade an underlying asset at a price set in advance irrespective of the market price at maturity. When an option is bought, its holder pays a fixed amount to the option writer as cost for this flexibility of trading that the option provides, known as the premium. Options can be of the types: call (right to buy) or put (right to sell).
Swaps
Swaps are agreements between two counterparties to exchange a series of cash payments for a stated period of time. The periodic payments charged can be based on fixed or floating interest rates, depending on contract terms decided by the counterparties. The calculation of these payments is based on an agreed-upon amount, called the notional principal amount (or just notional).
Exchange-traded vs Over-the-counter Derivatives Market
Exchange-traded derivatives markets
Exchange-traded derivatives markets are standardized markets for derivatives trading and follows rules set by the exchange. For instance, the exchange sets the expiry date of the derivatives, the lot-size, underlying securities on which derivatives can be created, settlement process etc. The exchange also performs the clearing and settlement of trades and provide credit guarantee by acting as a counterparty for every trade of derivatives. Thus, exchanges provide a transparent and systematic course of action for any derivatives trade.
Over-the-counter markets
Over-the-counter (also known as “OTC”) derivatives markets on the other hand, provide a lesser degree of regulations. They were almost entirely unregulated before the financial crisis of 2007-2008 (also a time when derivatives markets were criticized, and the blame was placed on Credit Default Swaps). OTCs are customized markets and run by dealers who hedge risks by indulging in derivatives trading.
Types of market participants
The participants in the derivative markets can be categorized into different groups namely,
Hedgers
Hedging is a risk-neutralizing strategy when an investor seeks to protect a current or anticipated position in the market by limiting their risk exposure. They can do so by taking up an offset or counter position through derivative contracts. Parties such as individuals or companies who perform hedging are called Hedgers. The hedger thus aims to eliminate volatility against fluctuating prices of underlying securities and protect herself/himself from any downsides.
Speculators
Speculation is a very common technique used by traders and investors in the derivatives market. It is based on when traders have a strong viewpoint regarding the market behavior of any underlying security and though it is risky, if the viewpoint is correct, the speculation may reward with attractive payoffs. Thus, speculators use derivative contracts with a view to make profit from the subsequent price movements. They do not have any risk to hedge, in fact, they operate at a relatively high-risk level in anticipation of profits and provide liquidity in the market.
Arbitrageurs
Arbitrage is a strategy in which the participant (or arbitrageur) aims to make profits from the price differences which arise in the investments made in the financial markets as a result of mispricing. Arbitrageurs aim to earn low risk profits by taking two different positions in the same or different contracts (across different time periods) or on different exchanges to in-cash on price discrepancies or market inefficiencies.
Margin Traders
Margin is essentially the collateral amount deposited by an investor investing in a financial instrument to the counterparty in order to cover for the credit risk associated with the investment. In margin trading, the trader or investor is not required to pay the total value of your position upfront. Instead, they only need pay the margin amount which may vary and are usually fixed by the stock exchanges considering factors like volatility. Thus, margin traders buy and sell securities over a single session and square off their position on the same day, making a quick payoff if their speculations are right.
Criticism of derivatives
While derivatives provide numerous benefits and have significantly impacted modern finance and markets, they pose many risks too. In a 2002 letter to Berkshire Hathaway shareholders, Warren Buffet even described derivatives as “financial weapons of mass destruction”.
Derivatives are more highly leveraged due to relatively relaxed regulations surrounding them, and where one may need to put up half the money or more with buying other securities, derivatives traders can get by with just putting up a few percentage points of the total value of a derivatives contract as a margin. If the price of the underlying asset keeps falling, covering the margin account can lead to enormous losses. Derivatives are thus often criticized as they may allow investors to obtain unsustainable positions that elevates systematic risk so much that it can be equated to legalized gambling. Derivatives are also exposed to counterparty credit risk wherein there is scope of default on the contract by any of the parties involved in the contract. The risk becomes even greater while trading on OTC markets which are less regulated.
Derivatives have been associated with a number of high-profile credit events over the past two decades. For instance, in the early 1990s, Procter and Gamble Corporation lost more than $100 million in transactions in equity swaps. In 1995, Barings collapsed when one of its traders lost $1.4 billion (more than twice its then capital) in trading equity index derivatives.
The amounts involved with derivatives-related corporate financial distresses in the 2000s increased even more. Two such events were the bankruptcy of Enron Corporation in 2001 and the near collapse of AIG in 2008. The point of commonality among these events was the role of OTC derivative trades. Being an AAA-rated company, AIG was being exempted from posting collateral on most of its derivatives trading in 2008. In addition, AIG was unique among CDS market participants and acted almost exclusively as credit protection seller. When the global financial crisis reached its peak in late 2008, AIG’s CDS portfolios recorded substantial mark-to-market losses. Consequently, the company was asked to post $40 billion worth of collateral and the US government had to introduce a $150 billion financial package to prevent AIG, once the world’s largest insurer by market value, from filing for bankruptcy.
Conclusion
Derivatives were essentially created in response to some fundamental changes in the global financial system. If correctly handled, they help improve the resilience of the system, hedge market risks and bring economic benefits to the users. Thus, they are expected to grow further with financial globalization. However, past credit events have exposed many weaknesses in the organization of their trading. The aim is to minimize the risks associated with such trades while enjoying the benefits they bring to the financial system. An important challenge is to design new rules and regulations to mitigate the risks and to promote transparency by improving the quality and quantity of statistics on derivatives markets.
Related posts on the SimTrade blog
▶ Alexandre VERLET Understanding financial derivatives: options
▶ Jayati WALIA Plain Vanilla Options
▶ Alexandre VERLET Understanding financial derivatives: forwards
▶ Alexandre VERLET Understanding financial derivatives: futures
▶ Alexandre VERLET Understanding financial derivatives: swaps
Useful resources
Role of Derivatives in the 2008 Financial Crisis
ESMA Annual Statistical Report 2020
About the author
The article was written in August 2021 by Jayati WALIA (ESSEC Business School, Grande Ecole Program – Master in Management, 2019-2022).