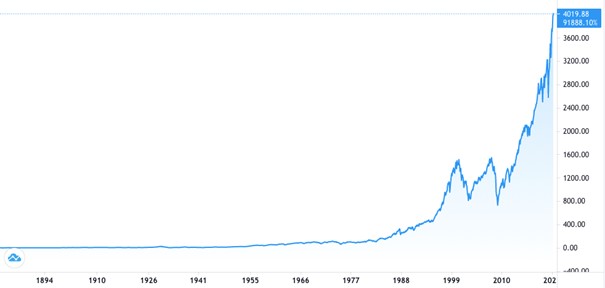
Cash flow statement

Cash flow statement

Bijal Gandhi

In this article, Bijal GANDHI (ESSEC Business School, Grande Ecole Program – Master in Management, 2019-2022) explains the meaning of cash flow statement.

This read will help you understand in detail the meaning, structure, components of cash flow statement along with relevant examples.

Cash Flow statement

The cash flow statement is one of the three most important financial statements which acts as a bridge between the balance sheet and the income statement. It is a summary of all the cash and cash equivalents that have entered or left the company in the previous years. It helps to understand how well a company manages its cash position. In many countries, it is a mandatory part of the financial statements for large firms.

Structure of Cash Flow statement

The cash flow statement is divided into three of the following major activity categories: operating activities, investing activities and financing activities.

Cash from operating activities

The operating activities includes all the sources and uses of cash related to the production, sale and delivery of the company’s products and services. Few examples of the operating activities include,

• Sale of goods & services
• Payments to suppliers
• Advertisements and marketing expenses
• Rent and salary expenses
• Interest payments
• Tax payments

Cash from investing activities

As the name suggests, investing activities includes all those sources and use of cash from a company’s investments, assets, and equipment. A few examples of investing activities include,

  • Purchase and sale of an asset
  • Loans to suppliers
  • Loans received from customers
  • Expenses related to mergers and acquisitions

Cash from financing activities

Financing activities are those that include all the sources and use of cash from investors. All the inflow and outflow of cash such as,

  • Capital raised through sale of stock
  • Dividends paid
  • Interest paid to bondholders
  • Net borrowings
  • Repurchase of company’s stock

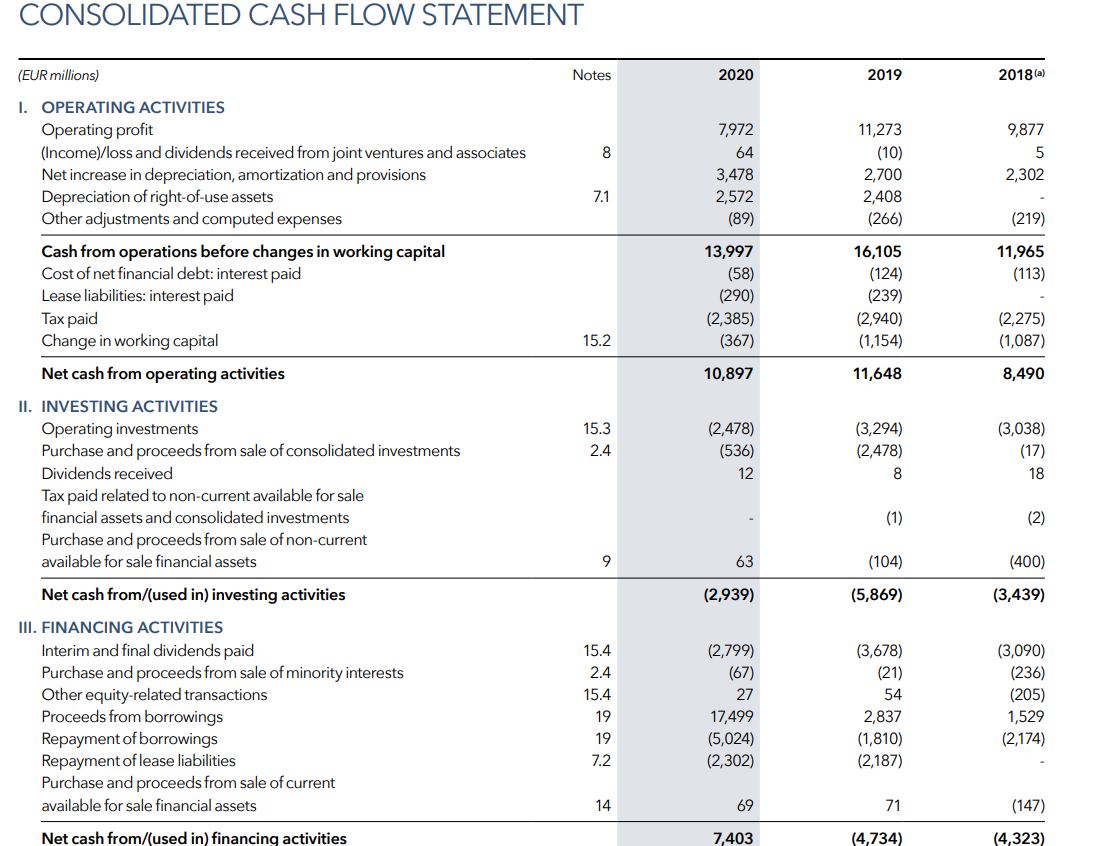
LVMH Example: Cash Flow Statement

Here, we again take the example of LVMH. The French multinational company LVMH Moët Hennessy Louis Vuitton was founded in 1987. The company headquartered in Paris specializes in luxury goods and stands at a valuation of $329 billion (market capitalization in June 2021). It is a consortium of 75 brands controlled under around 60 subsidies. Here, you can find a snapshot of LVMH Cash flow statement for three years: 2018, 2019 and 2020.

Importance and use of cash flow statement

The cash flow statement is a very important indicator of the financial health of a company. This is because a company might make enough profits but might run out of cash to be able to operate. Also, it indicates the company’s abilities to meet its interest obligations and dividend payments if any. Basically, it provides a true picture of a company’s liquidity and financial flexibility. Therefore, a cash flow statement used in conjunction with the income statement and the balance sheet helps provide a holistic view of a company’s strength and weaknesses. The cash flow statement is therefore of great use to the following stakeholders:

  • Potential and current debtholders (creditors and bondholders)
  • Potential and current shareholders
  • Management team and company’s directors

Related posts on the SimTrade blog

   ▶ Bijal GANDHI Income statement

   ▶ Bijal GANDHI Revenue

   ▶ Bijal GANDHI Cost of goods sold

About the author

Article written in July 2021 by Bijal GANDHI (ESSEC Business School, Grande Ecole Program – Master in Management, 2019-2022).

Operating vs Non-Operating Revenue

Operating vs Non-Operating Revenue

Bijal GANDHI

In this article, Bijal GANDHI (ESSEC Business School, Master in Management, 2019-2022) explains the difference between operating and non-operating revenue.

This read will help you understand in detail various terminologies related to revenue and income statement.

What is operating revenue?

The revenue generated from the primary or core activities of a company is referred to as operating revenue. It is important to differentiate between operating and non-operating revenue to gain insights into the efficiency of a firm’s core operations.

For example, the revenue generated from the total sale of iPhones worldwide is an operating revenue for Apple, whereas the revenue generated from sale of old office furniture would be a non-operating revenue.

What is non-operating revenue?

Non-Operating revenue refers to the revenue generated from operations that are not part of a company’s core business. The items in this section are generally unique in nature and therefore they do not show a true picture of the efficiency of a company’s core business. It is rather attributable to a company’s managerial and financial decisions.

For example, research grants obtained by universities are non-operating revenues as they are not generated from the core business (tuition fees).

How are revenue recorded in the income statement?

We know from the income statement that the COGS is deducted from revenue to derive the gross profit. The operating expenses are further deducted from the gross profit to attain the operating profit. The non-operating revenues and expenses are then combined and deducted from the operating profit to derive the net profit.

LVMH example

Let us once take the example of Moët Hennessy Louis Vuitton (LVMH). The French multinational company LVMH was founded in 1987. The company headquartered in Paris specializes in luxury goods and stands at a valuation (market capitalization in June 2021) of $329 billion. It is a consortium of 75 brands controlled under around 60 subsidiaries. Here, you can find a snapshot of LVMH Income statement for three years: 2018, 2019 and 2020.


LVMH financial statements

Here, you can see that the highlighted part; “other financial income and expenses” are combined to derive the net profit before taxes

Related posts on the SimTrade blog

   ▶ Bijal GANDHI Income statement

   ▶ Bijal GANDHI Revenue

   ▶ Bijal GANDHI Cost of goods sold

   ▶ Bijal GANDHI Operating profit

About the author

Article written in August 2021 by Bijal GANDHI (ESSEC Business School, Master in Management, 2019-2022).

Gains vs Revenue & Losses vs Expenses

Gains vs Revenue & Losses vs Expenses

Bijal GANDHI

In this article, Bijal GANDHI (ESSEC Business School, Grande Ecole Program – Master in Management, 2019-2022) explains the difference between gains and revenue, and losses and expenses.

This read is for the students who wish to have a clear and theoretical understanding of the basic terms used in accounting and finance.

Revenue

We know from revenue, that it is referred to the money brought into a company from the sale of either goods, services, or both. Revenue is synonymous to sales and top line. This is because it first line on the income statement and it is a good indicator of a business’s performance. Revenue consists of two components, the price and the number of products/services sold. It is then calculated in the following manner:

Gains

Gains refers to the income generated through non-primary operations of the company. Any positive monetary value (profit) generated from secondary sources is a capital gain. For example, profit from the sale of real estate is to be treated as capital gain. Other such examples include the following,
• Profit from sale of equity holdings in any company
• Profit on investment in mutual fund
• Profit from winning a lawsuit.
• Profit from disposing an asset.

Gains can be from short-term holdings or long-term holdings. Short term could be defined as one to two years depending on accounting standards and type of financial instrument. It is important to take this in consideration while investing as both have different taxation guidelines.

Expenses

Expenses refers to the cost of operations incurred by a company. The basic goal of any company is to keep the expenses in check to ensure maximum profits. Expenses are broadly defined under the following two categories,
• Operating Expenses: The costs related to the main activities of the company such as cost of goods sold, salary, rent, legal, advertisement, etc.
• Non-Operating Expenses: These are the expenses that are not directly related to the core operations of a business. For example, profit from the sale of real estate would be a non-operating expense for a company who does not regularly deal in real estate. Similarly, the expenses such as interest payments on debt is also a non-operating expense since it does not arise from the company’s core business.

Losses

A loss in accounting terms refers to the money lost through non-primary operations of the company. Any negative monetary value (loss) incurred due to secondary sources is recorded as a capital loss. For example, the loss on an investment in equity shares of another company is a capital loss.
Like gains, it is important to identify whether a loss is from a short-term holding or a long-term holding. This is because in taxation, gains can be offset against corresponding losses.

Related posts on the SimTrade blog

   ▶ Bijal GANDHI Income statement

   ▶ Bijal GANDHI Revenue

   ▶ Bijal GANDHI Cost of goods sold

   ▶ Bijal GANDHI Operating profit

About the author

Article written in July 2021 by Bijal GANDHI (ESSEC Business School, Grande Ecole Program – Master in Management, 2019-2022).

Operating Profit

Operating Profit

Bijal GANDHI

In this article, Bijal GANDHI (ESSEC Business School, Grande Ecole Program – Master in Management, 2019-2022) explains the concept of Operating profit.

This read will help you understand in detail the meaning, components and formula for calculating operating profit along with relevant examples.

Operating Profit

Operating profit refers to the profit obtained from business operations before the deduction of interest and taxes. Operating profit is a good representation of the company’s profits as all the core expenses are taken into consideration except interest and tax. It is synonymously used with “EBIT” (Earnings before interest and taxes) and “operating income”. Although, EBIT may sometimes include non-operating revenue.

Components and Formula

Operating profit is equal to:

Operating revenue – COGS – Operating expenses – Depreciation –Amortization

  • Gross profit: We know from the blog on revenue, gross profit equals revenue less COGS (cost of goods sold). Therefore, operating profit is often simplified as, Gross Profit – Operating expenses – Depreciation – Amortization.
  • Operating expenses refers to the expenses that a business undertakes during its normal operations such as rent, electricity, salary, etc. These expenses are generally divided into broad categories in the income statement to make it concise. For example, in the LVMH example below, the operating expenses are divided into three broad categories like marketing and sales, general and administrative and other such costs.
  • Depreciation refers to the value of the assets that have been used up every year. It is a method to allocate the cost of a physical asset over its useful life.
  • Amortization refers to the accounting method of spreading the cost of an intangible asset over its useful life.

Example: LVMH

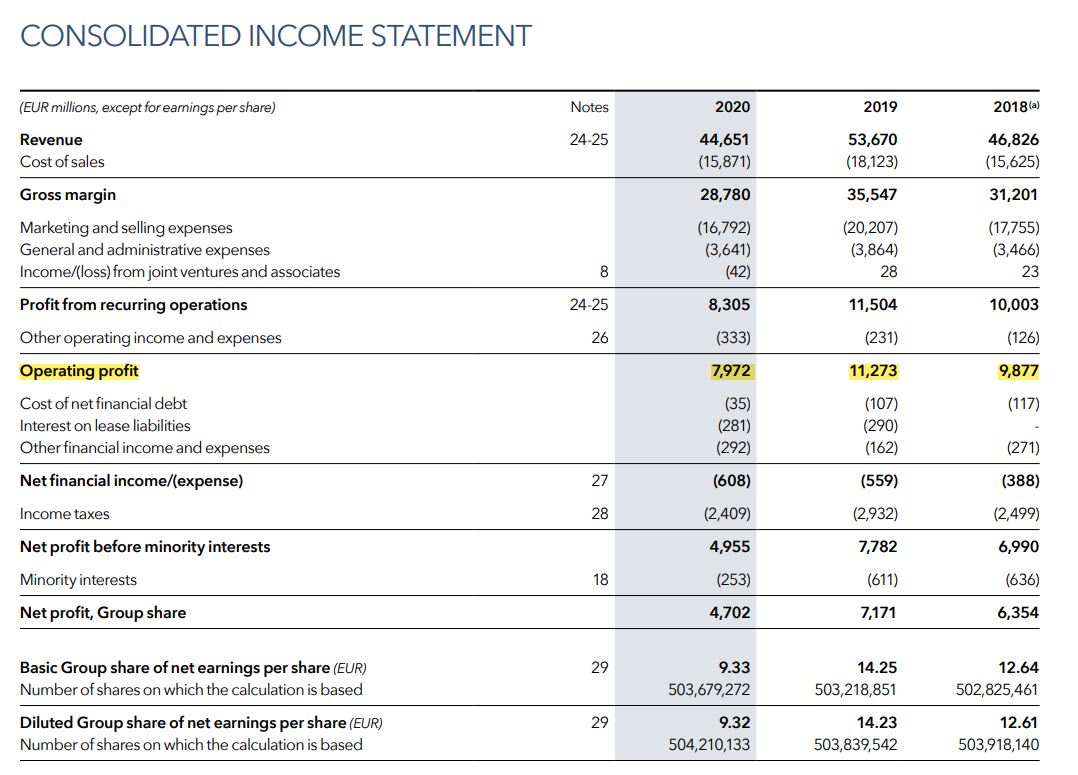
Let us once take the example of LVMH. The French multinational company LVMH Moët Hennessy Louis Vuitton was founded in 1987. The company headquartered in Paris specializes in luxury goods and stands at a valuation (market capitalization in June 2021) of $329 billion. It is a consortium of 75 brands controlled under around 60 subsidiaries. Here, you can find a snapshot of LVMH Income statement for three years: 2018, 2019 and 2020.

Bijal Gandhi

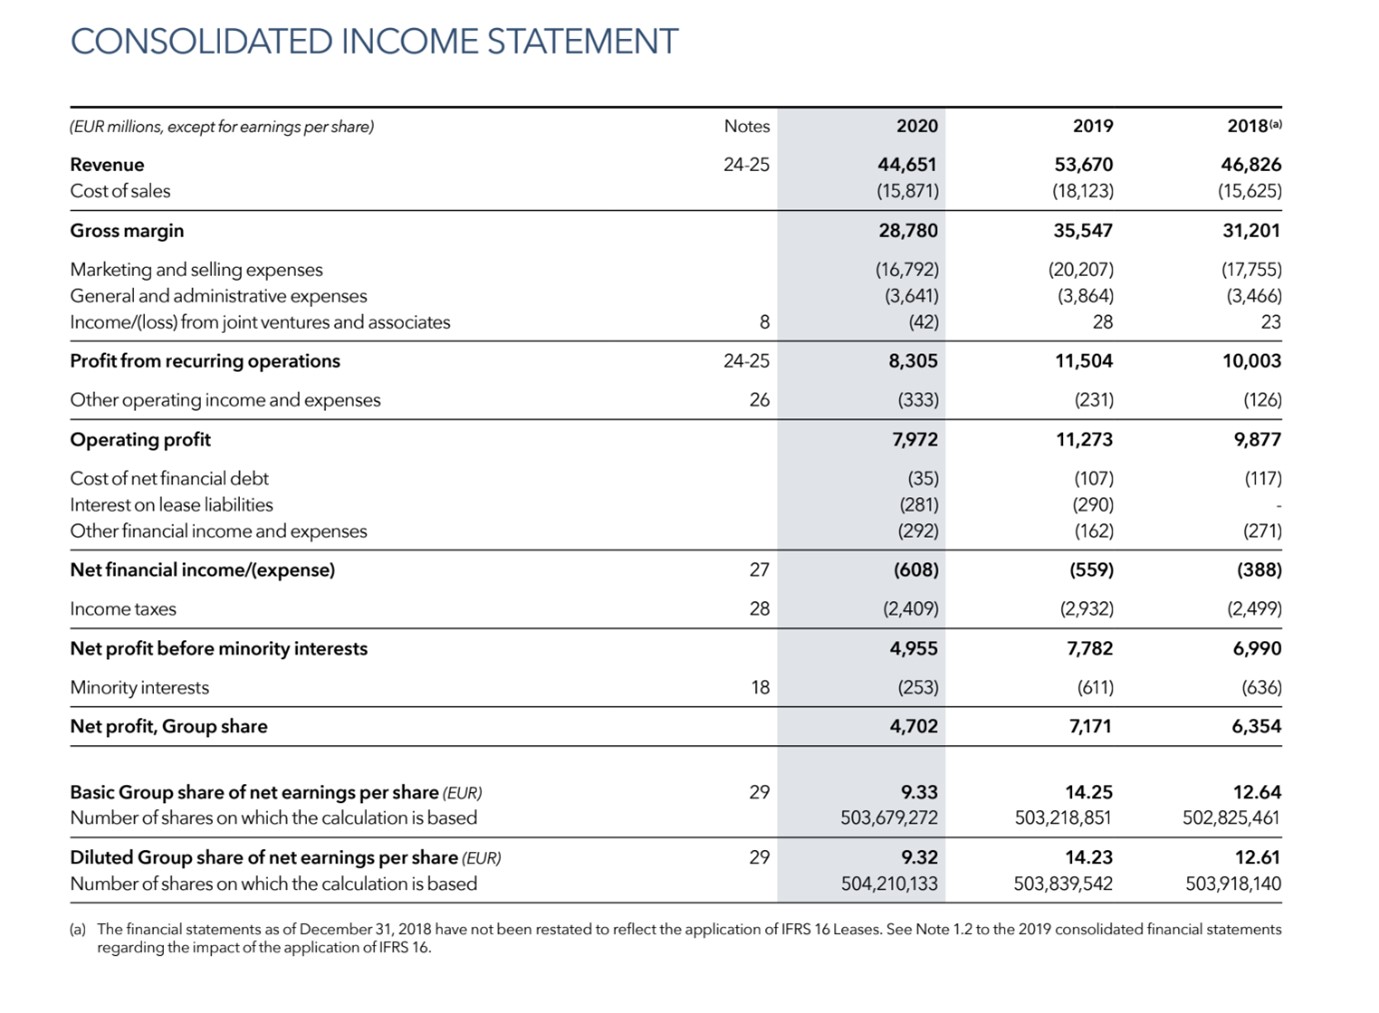
The operating profit for the year 2020 is 7,972 million euros. This means that from a revenue of 44,651 million euros in 2020, the company is now left with 7,972 million euros after deducting all expenses except interest and tax.

Operating profit vs Net profit

Net profit refers to the amount that a company is left with after deducting all expenses including interest and tax. For example, in the snapshot above, net profit is 4,702 million euros as compared to the operating profit of 7,972 million euros. This means that the total interest and tax expenses amounted to 7,972 less 4,702 million euros. Net profit which is also referred to as “bottom line” gives us a picture of the overall performance of the company and its management.

Exclusions from operating profit

There are several exclusions from operating profit because operating profit is calculated with the purpose of understanding the performance of a company’s core business only.

The revenue from the sale of an asset is not part of the operating profit. Similarly, investment income, interest income and debt interest expenses are not part of the company’s core business and therefore excluded from the calculation of operating profit.

Related posts on the SimTrade blog

   ▶ Bijal GANDHI Income statement

   ▶ Bijal GANDHI Revenue

   ▶ Bijal GANDHI Cost of goods sold

About the author

Article written in July 2021 by Bijal GANDHI (ESSEC Business School, Grande Ecole Program – Master in Management, 2019-2022).

Depreciation

Depreciation

Bijal GANDHI

In this article, Bijal GANDHI (ESSEC Business School, Master in Management, 2019-2022) explains briefly the meaning of Depreciation.

This reading will help you understand the concept of depreciation, its main components and types with examples.

What is depreciation?

Depreciation is the accounting technique of dividing the total cost of a physical asset over its useful life period. The amount allocated is the value of the asset used up in that particular financial year. Depreciation is used by companies to spread the cost of an asset over time. This method eliminates the cost burden in one particular year. If not for depreciation, the company’s profits would seriously be affected in the year of purchase.

Depreciation for long-term assets may also be practiced by companies for tax benefits in a particular year. The reduction in taxable income can be achieved through tax deduction for the cost of an asset. Note that there are standard rules regarding the accounting practices of depreciation and firms cannot do what they want.

Types of depreciable assets

The guidelines for the types of assets to be depreciated is set by Internal revenue service (IRS) in the U.S. The following criteria are to be met with,
• The asset should be owned by the company.
• The asset should be used in the business to generate income.
• The life of the asset is determinable and is more than a year.

The most common examples of depreciable assets include plant and machinery, equipment, furniture, computers, software, land and vehicles.

Components of a depreciation schedule

A depreciation schedule is a detailed document that comprises of the information pertaining to depreciation for each asset owned by the company. It generally includes the following,
• Description and purchase price of asset
• Date of purchase and expected useful life.
• Depreciation method and salvage value.

Depreciation types with examples

Depreciation can be carried in several ways. The company can use any one of the four depreciation methods highlighted by Generally accepted accounting principles (GAAP) guidelines. GAAP is the set of rules and guidelines that are to be adhered to by accountants. The four methods for depreciation include the following,

Straight-line depreciation

Straight-line is one of the simplest methods of depreciation. In this method, the value of the asset is split evenly over the useful life of the asset. The value of the asset is calculated by subtracting the salvage value (scrap value) from the original cost incurred to purchase the asset. For example, if an equipment is bought for 10,000 euros, with a useful life of 10 years and a salvage value of 1,000 euros, the depreciation is computed as follows:

Depreciation per year= (asset cost – salvage value) / useful life
= (10,000-1,000) / 10
= 900 euros per year.
Therefore, 900 euros will be written off each year for 10 years.

Declining balance depreciation

The declining balance method of depreciation is an accelerated version of the straight-line method. Instead of an equal amount of depreciation for each year of useful life, unequal amounts depending upon the use are written off. In this method, more of the assets value is depreciated in the initial years than afterwards. This method is practiced by businesses who wish to recover maximum value upfront. For example, the equipment bought for 10,000 euros with a useful life of 10 years and salvage value of 1,000 will be depreciated by 20% each year,

For first year, the depreciable amount will be (9,000*20%) = 1,800 euros
For second year, the depreciable amount will be ((9,000-1,800) *20%) = 1,440 euros and so on.

Sum-of-the-years’ digits depreciation

This method serves a similar purpose as the declining balance method. It allows to depreciate more in the initial years as compared to the later years. It is a bit more even in terms of distribution per year as compared to the declining balance method.

The formula is as follows,
 (Remaining life in years / SYD) x (asset cost – salvage value)
Where, SYD is the sum of the years of the asset’s useful life. SYD for an asset with a useful life of 4 years is equal to 11, which we get from (1 + 2 + 3 + 4).

Units of Production Depreciation

A simple way to depreciate would be to quantify an asset’s use every year. For example, an equipment can be depreciated in proportion to the units produced. This is exactly what the units of production method of depreciation works.

The formula is as follows,
Depreciation: (asset cost – salvage value) / units produced in useful life.
The number will vary each year, depending upon the use of the asset.

Related posts on the SimTrade blog

   ▶ Income statement

   ▶ Revenue

   ▶ Cost of goods sold

About the author

Article written in May 2021 by Bijal GANDHI (ESSEC Business School, Master in Management, 2019-2022).

Revenue

Revenue

Bijal Gandhi

In this article, Bijal GANDHI (ESSEC Business School, Grande Ecole Program – Master in Management, 2019-2022) delves deeper into the accounting concept of revenue.

This read will help you understand in detail the meaning, types and calculation of revenue  along with relevant examples.

What is revenue?

Revenue is referred to the money brought into a company from the sale of either goods, services, or both. Revenue is synonymous to sales and top line. This is because it first line on the income statement and it is a good indicator of a business’s performance. Revenue consists of two components, the price and the number of products/services sold. It is then calculated in the following manner:

Bijal Gandhi

Gross revenue vs net revenue

Gross revenue is simply the income generated from a sale without consideration for any expenses that might have occurred. Net revenue is the income after subtracting all the cost of goods sold and other expenses related to running the business.

For example, if Alpha sells 2,000 toy cars at $100 each, its gross revenue for the month would be $200,000. If the cost of producing each car was $25, their net revenue would be 2,000 x ($100 – $25) toy cars or $150,000.

Revenue example: LVMH

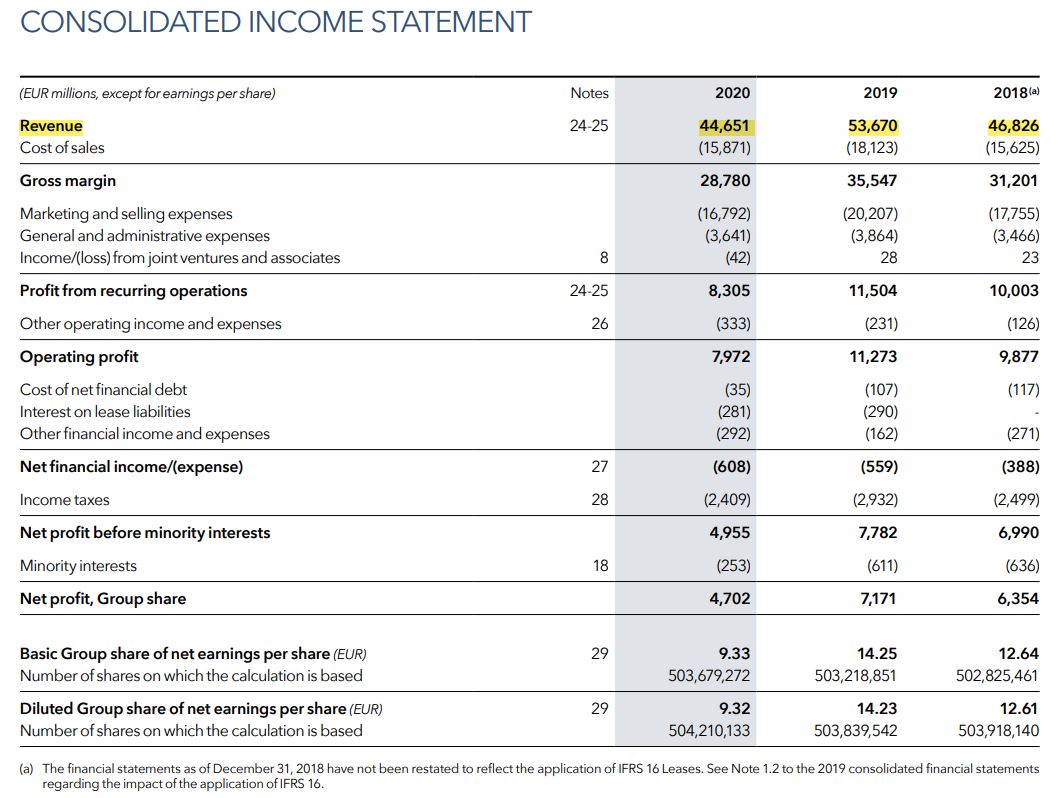
Let us once again take the example of LVMH. The French multinational company LVMH Moët Hennessy Louis Vuitton was founded in 1987. The company headquartered in Paris specializes in luxury goods and stands at a valuation of $329 billion. It is a consortium of 75 brands controlled under around 60 subsidiaries. Here, you can find a snapshot of LVMH Income statement for three years: 2018, 2019 and 2020.

Bijal Gandhi

Here, the revenue, also known as top line, is 44,651 million euros for the year 2020. The revenue is the sum of income generated from all divisions. In the snapshot below, the revenue is a consolidation of income generated by several brands that sell wines, spirits, fashion, leather goods, perfumes, etc.

Accrued vs deferred revenue

Accrued revenue refers to the revenue earned by a company for which the goods are delivered but the payment is yet to be received. In this type of accounting, the revenue is recorded irrespective of whether the cash is received or not.

Deferred revenue refers to the revenue for which the customer has already made the payment, but the company is yet to deliver the goods. Here, in accounting the company will record the cash payment but that the revenue is unearned, but it will not recognize the revenue on the income statement.

How do revenue & earnings differ?

Revenue refers to the income generated by a company before deducting expenses, while earnings refer to the profit earned by the company after deducting the expenses, interest, and taxes from revenue.

Earnings is synonymous to net income or the bottom line. Along with revenue, it is also a very important indicator of a company’s performance.

How do revenue & cash flows differ?

Cash flow refers to the total amount of cash that moves into or out of the company. While revenue is the indicator of a company’s overall effectiveness, the cash flow is an indicator of liquidity.

Related posts on the SimTrade blog

   ▶ Bijal GANDHI Income statement

   ▶ Bijal GANDHI Cost of goods sold

About the author

Article written in May 2021 by Bijal GANDHI (ESSEC Business School, Grande Ecole Program – Master in Management, 2019-2022).

Cost of goods sold

Cost of goods sold

Bijal GANDHI

In this article, Bijal GANDHI (ESSEC Business School, Grande Ecole Program – Master in Management, 2019-2022) explains Cost of goods sold.

This read will help you understand in detail the meaning and components of cost of goods sold along with relevant examples.

Introduction

Cost of goods sold (COGS) refers the sum of all costs directly related to the production of the goods. It is fundamentally very similar to cost of sales and hence synonymously used. Some examples of items that make up COGS include,

  • Cost of raw materials
  • Direct labor costs
  • Heat and electricity charges
  • Overheads

Components and Formula

The COGS is calculated using the following formula,

COGS = (Beginning Inventory + Purchases) – Ending Inventory

• Beginning Inventory is the total value of the inventory left over or not sold from the previous year.

• Cost of goods is the sum of all costs directly related to the production of the goods or the purchase value of the same (in case of retailer or distributor)

• Ending inventory is the total value of the remaining inventory that was not sold till the end of the financial year. This number is carried forward to next year.

Example: LVMH

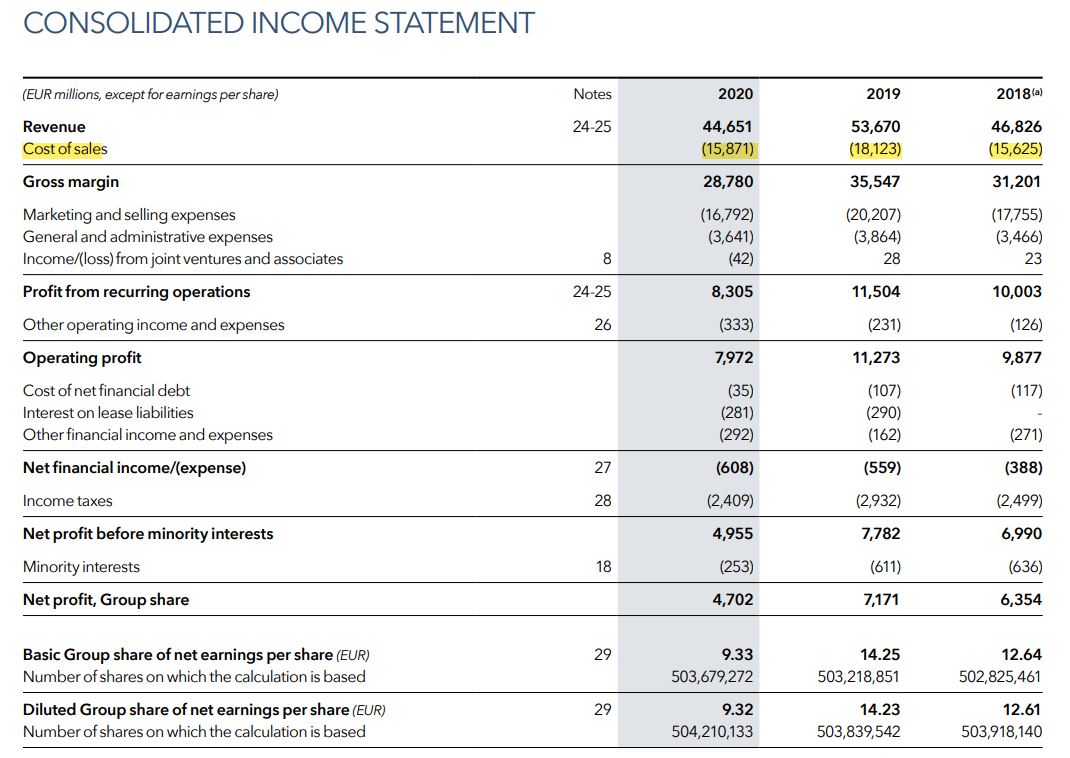
Let us once again take the example of LVMH. The French multinational company LVMH Moët Hennessy Louis Vuitton was founded in 1987. The company headquartered in Paris specializes in luxury goods and stands at a valuation of $329 billion. It is a consortium of 75 brands controlled under around 60 subsidiaries. Here, you can find a snapshot: 2018, 2019 and 2020.

Bijal Gandhi

In the income statement, COGS is placed just below revenue (Link to the blog) to easily compare the numbers and derive the gross margin. For example, in the snapshot of LVMH income statement below, the cost of sales for the year 2020 is 15,871 million euros for the revenue of 44,651 million euros resulting in a gross margin of 28,780 million euros.

Direct costs vs indirect costs

Direct cost refers to the costs that are directly associated with the production of goods and services. They are generally variable in nature as they fluctuate depending upon the production. Some examples of direct costs include, raw materials, direct labour, manufacturing supplies, fuel, power, wages, etc. Most importantly, direct costs are the ones that can be directly assigned to the product or service.

Indirect costs are those which cannot be assigned to one specific product or service. These costs are those that apply to more than one business activity. For example, rent, employee salary, utility and administrative expenses, overheads, etc. These costs may be fixed or variable in nature.

COGS vs operating costs

Operating costs are expenses that are not directly related to the production of goods or services. The operating expenses are a separate line item in the income statement, and they include indirect costs like salaries, marketing, rent, utilities, legal and admin costs, etc.

It is important to classify the costs correctly as either COGS or operating. This will help managers differentiate well between the two and effectively build a budget for the same.

Related posts on the SimTrade blog

   ▶ Bijal GANDHI Income statement

   ▶ Bijal GANDHI Revenue

About the author

Article written in May 2021 by Bijal GANDHI (ESSEC Business School, Grande Ecole Program – Master in Management, 2019-2022).

Earnings per share

Earnings per share

Bijal GANDHI

In this article, Bijal GANDHI (ESSEC Business School, Grande Ecole Program – Master in Management, 2019-2022) explains the meaning and calculation of Earnings per Share.

This reading will help you understand the earnings per share in detail with relevant examples.

Introduction

The earnings per share (EPS) indicates the total amount of money that the company earns for each share of its total stock. A high EPS is a good indication as investors will be willing to pay more for each share owing to higher profits and vice versa. There are several methods to derive EPS.

Calculation of EPS

One direct way to calculate EPS is by simply dividing the net income by the number of common stocks that are outstanding for that period of the earnings. To understand the calculation for net income, refer to our blog on Income statement.

A refined way to calculate the EPS would be to adjust both the numerator and denominator. For the numerator, the net income should be adjusted for any dividends paid for preferred shares. For the denominator, a weighted average number of common shares should be taken since the number of outstanding shares tend to vary over time.

Bijal Gandhi

EPS example

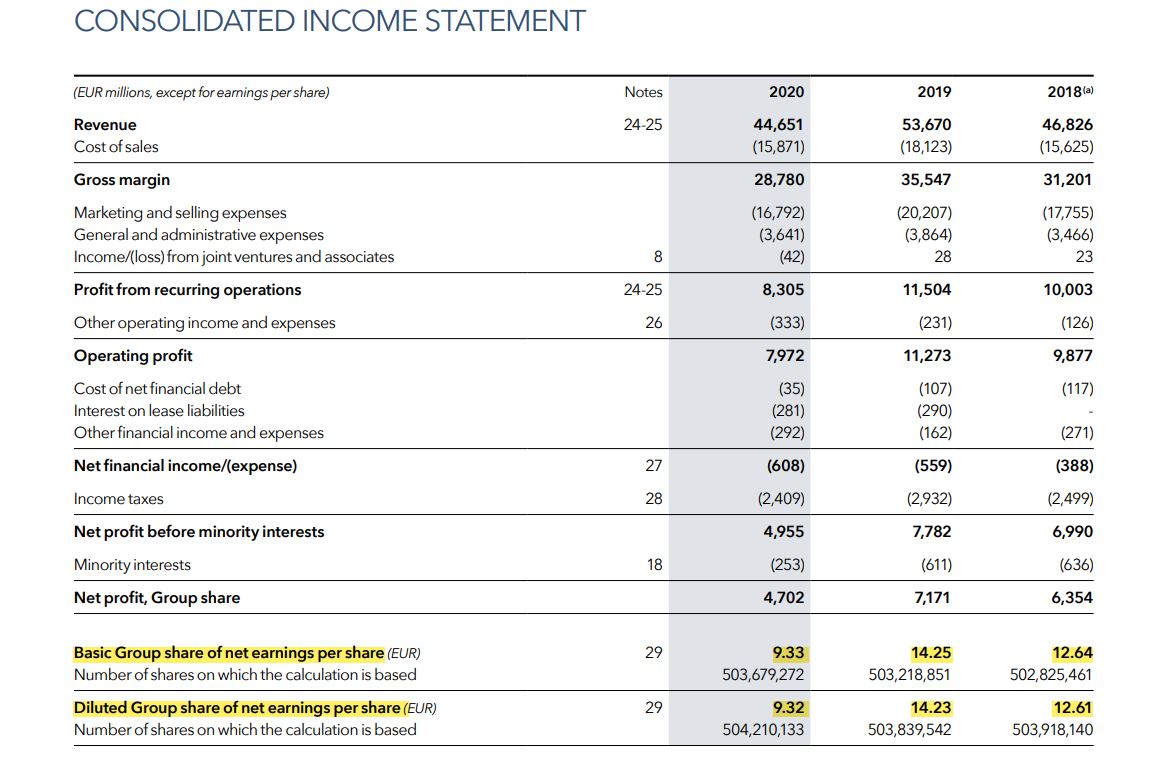
Here, we again take the example of LVMH. The French multinational company LVMH Moët Hennessy Louis Vuitton was founded in 1987. The company headquartered in Paris specializes in luxury goods and stands at a valuation of $329 billion (market capitalization in June 2021). It is a consortium of 75 brands controlled under around 60 subsidies. Here, you can find a snapshot of LVMH Income statement for three years: 2018, 2019 and 2020. The last line highlights the basic and diluted EPS of the group for each of the three years.

Bijal Gandhi

Net income for the group= 4702 millions
Average number of shares= 503,679,272
Basic EPS= 9.33 euros per year.

Basic EPS vs. Diluted EPS

Basic EPS eliminates the dilutive effect of warrants, stock options, convertible debentures, etc. These instruments will increase the total number of outstanding shares if exercised by the holders. For example, warrants when exercised will result in dilution of equity.

Diluted EPS considers all the potential sources of equity dilution and therefore it gives a clear picture of the actual earnings per share. In the above LVMH example, the diluted earnings are derived after adding the dilutive effect of stock option like described below,

Net income for the group= 4,702 millions
Average number of shares outstanding: 503,679,272
Dilutive effect of stock option and bonus share plans: 530,861
Average number of shares after dilution: 504,210,133
Diluted earnings per share: 9.32

How is EPS used?

EPS is one of the best indicators of a company’s profitability and performance. It is a helpful indicator to choose stocks as it is one of the sole metrics that isolates net income to find the earnings for shareholders. A growing or a consistent EPS means that the company creates value for the shareholders while a negative EPS might indicate losses, financial trouble or eroding investor value.

It also helps calculate the price to earnings (PE) ratio where the market price per share is divided by the EPS. This ratio helps understand how much the market is willing to pay for each euro of earnings.

Related posts on the SimTrade blog

   ▶ Bijal GANDHI Income statement

   ▶ Bijal GANDHI Revenue

   ▶ Bijal GANDHI Cost of goods sold

About the author

Article written in May 2021 by Bijal GANDHI (ESSEC Business School, Grande Ecole Program – Master in Management, 2019-2022).

Income Statement

Income Statement

Bijal GANDHI

In this article, Bijal GANDHI (ESSEC Business School, Grande Ecole Program – Master in Management, 2019-2022) explains briefly the structure of an Income Statement.

This reading will help you understand the structure and the main components of the income statement.

Introduction

Income statement is a financial statement that reports the financial performance of an entity over a specified accounting period. The financial performance is measured by summarizing all income and expenses over a given period. Also known as ‘Profit and Loss’ Statement, the Income statement helps the company have a look at the profits for the year and helps it take financial decisions about costs and revenues. The Income statement is also the basis for the tax institution to compute the income tax that the company has to pay every year. The Income statement also allows shareholders to know the dividends that they can receive from the earnings.

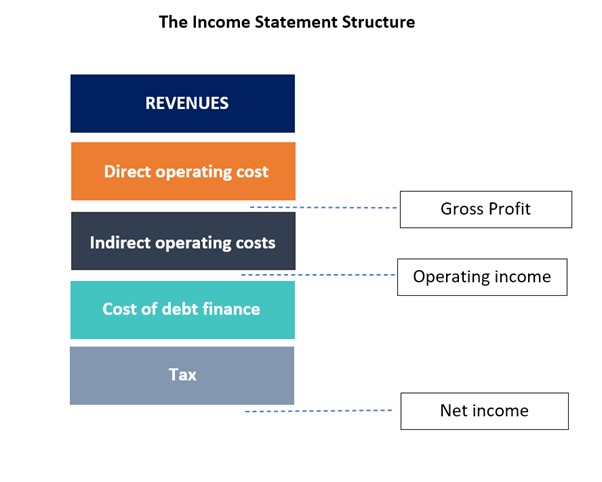
Structure of an income statement

Bijal Gandhi

Main components of an income statement

The income statement may slightly vary sometimes depending upon the type of company and its expenses and income, but the general structure and lines may remain the same.

  • Revenue: Also known as top line, revenue or sales revenue refers to the value of the total quantity sold multiplied by the average price of goods or services sold.
  • Cost of goods sold: The cost of goods sold is the sum of all the direct costs associated with a product or service. For example, labor, materials, equipment, machinery, etc.
  • Gross Profit: Gross profit is derived after subtracting the cost of goods from sales/revenue.
  • Indirect Expenses: Indirect expenses include general, selling, and administrative expenses like marketing, advertisement, salary of employees, office, and stationery, rent, etc.
  • Operating Income: Gross profit less indirect expenses are equal to operating income. It is the firm’s profit before non-operating expenses and income, taxes and interest expenses are subtracted from revenues.
  •  Interest Expenses/Income: Interest expense/income is deducted/added from operating income to derive earnings before tax.
  • Tax: The taxes are deducted from pre-tax income to derive the net income. The taxes can be both current and future. The net income then flows to retained earnings on the balance sheet after deducting dividends.

Example: LVMH

The French multinational company LVMH Moët Hennessy Louis Vuitton was founded in 1987. The company headquartered in Paris specializes in luxury goods and stands at a valuation of $329 billion (market capitalization in June 2021). It is a consortium of 75 brands controlled under around 60. Here, you can find a snapshot of LVMH Income statement for three years: 2018, 2019 and 2020.

Bijal Gandhi

Most important components of an income statement include:

  • Total Revenue= Sum of Operating and Non-Operating Revenues for the accounting period. ($ 44,651)
  • COGS: Cost of goods Sold is the total cost of sales of the products actually sold. ($15,871)
  • Gross Margin = Net Sales – Total COGS ($28780)
  • Total Expenses = Sum of Operating and Non-Operating Expenses (Marketing and Selling Expenses + General and administrative expenses + Loss from joint Venture = ($ 16,792 + $ 3641 + $ 42= $ 20475)
  • EBT: Earning before taxes = Net Financial Income (Income – Expenses before Taxes). ( – $ 608)
  • Net Income = (Total Revenues and Gains) – (Total Expenses and Loses) = $ 4702

Income statement and Statement of cash flow

It is important to know that Income Statement does not convey the cash inflow and outflow for the year; The Cash Flow Statement is used for this. For example, credit sale is not recorded in the cash flow statement while cash sale is. Credit sale refers to sale for which the customer will make payment in the future while for cash sales the customer makes the payment at the time of purchase.

Conclusion

Income statement is the source to obtain valuable insights about factors responsible for company’s profitability.

Related posts on the SimTrade blog

   ▶ Bijal GANDHI Earnings per share

   ▶ Bijal GANDHI Revenue

   ▶ Bijal GANDHI Cost of goods sold

About the author

Article written in May 2021 by Bijal GANDHI (ESSEC Business School, Grande Ecole Program – Master in Management, 2019-2022).

Consumer Confidence Index

Consumer Confidence Index

Bijal Gandhi

In this article, Bijal Gandhi (ESSEC Business School, Master in Management, 2019-2022) elaborates on the concept of Consumer Confidence Index.

This reading will help you understand the meaning, calculation, and importance of consumer confidence index.

Introduction

The consumer confidence index (CCI) is a statistical estimation that measures the current and future economic conditions. This indicator provides estimates based on households’ expectations and view of their financial situation like employability, saving capacity, consumption, etc.

It is a barometer that mainly measures the optimistic/pessimistic nature of the consumers regarding their future financial situation. The CCI is based on the concept that when consumers are optimistic about the future, they are likely to spend more currently and stimulate the economy but if the consumers are pessimistic about the future, then they are likely to save more in the present and hence this could lead to a recession. This index tells you about the optimal levels of the households about the economy and their ability to find jobs.

Measuring Consumer Confidence Index

The Consumer Confidence Index measures the degree of optimism/pessimism of the households for the future state of the economy by measuring household current saving and spending patterns. While the Consumer Confidence Index is measured differently in every economy based on various underlining factors, we talk about how it is measured in the U.S. economy to provide an understanding of its calculation process.

In the U.S. economy, the Conference Board calculates the Consumer Confidence Index. It was first calculated in 1985 and is now used as a benchmark to assess the CCI. The value of CCI is calculated monthly based on the results of a household survey of (1) consumers’ opinions on the current conditions as well as their (2) future economic positions. The former constitutes 40% of the index, while the latter constitutes the remaining 60%.

When the confidence increases, consumers spend more money in the present time ,and as a result, indicates the sustainability of an economy. And when the confidence decreases, consumers are prone to save more in the present time, and as a result, indicates the possibility of future economic turmoil.

Each month, the Conference Board conducts a survey for 5,000 U.S. households the survey participants are asked to answer each question in any of the three forms as positive, negative, or neutral. The survey is comprised of five questions about the following:

Present Situation Index

  • Current business conditions
  • Current employment conditions

Expectations Index

  • Business situation for the next six months
  • Employment situation for the next six months
  • Total family income situation for the next six months

A relative value is calculated separately for each question, it is then compared to the relative value from the 1985 survey. This comparison of the relative value is used to calculate the “index value” for each question.

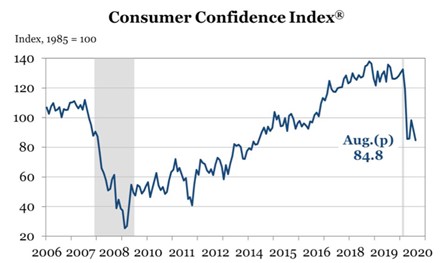
Finally, the average of all five index values forms the final consumer confidence index. In the U.S. Economy, this data is calculated for the economy as a whole. In the following graph, we can see the impact of the corona virus pandemic on the consumer confidence index in April 2020.

Bijal Gandhi

Source: The Conference Board

Interpreting Consumer Confidence Index

The consumer confidence index measures the spending/savings pattern of the consumers currently and their response to the economy’s future growth prospects.

Higher index value means that the consumers have confidence in the future of the economy and its growth and as a result will be spending more currently. On the contrary, a lower index value means that consumers have low confidence in the future of the economy and as a result will be likely to save more in the present. Therefore, the consumer confidence index does not only help to interpret the household’s opinion on the future of the economy’s growth but also helps businesses, banks, retailers, and government to factor in and adapt to the changes in the household’s future consumption/saving patterns.

For example, if the consumer confidence index shows a consistent decrease in its value, it means that the consumers are currently saving more and, in the future, as well. As a result, consumers will be less willing to spend. Based on these manufacturers’ can adapt to their production of retail goods, banks can interpret a decrease in the lending activity and credit card usage, the government can adapt its fiscal or monetary policies to stimulate the economy. On the contrary, if the consumer confidence index shows a consistent increase in its value it means that the consumers are willing to spend more currently and, in the future, because they have confidence that the economy will boost. As a result, the manufacturers can increase their supply of non-essential goods and luxury goods, banks can expect the increase of withdrawal from the consumers saving accounts, etc.

The consumer confidence index is a lagging indicator, as mentioned by many economists. This means that the indicator is not necessarily good at predicting future economic trends. On the contrary, it is more like the index follows the future economic conditions after they have occurred. For example, even after a regressive period is over, the impacts will remain. There will still be an increased unemployment rate in the economy. This simply means that the consumer confidence index is more like the aftershocks of an earthquake that already happened in the economy.

CCI therefore helps get an idea of the consumer spending/saving pattern and the degree with which it will increase/decrease. An increase in spending can increase the growth of businesses and therefore result in higher earnings in stock market prices for businesses. Hence, investors are more likely to buy stocks if the consumer confidence index rises. As a result, the stock market may move drastically during the publication date of the confidence index.

Useful resources

About the author

Article written in May 2021 by Bijal Gandhi (ESSEC Business School, Master in Management, 2019-2022).

Purchasing Managers’ Index

Purchasing Managers’ Index

Bijal Gandhi

In this article, Bijal GANDHI (ESSEC Business School, Grande Ecole Program – Master in Management, 2019-2022) elaborates on the concept of Purchasing Managers’ Index

This read will help you understand the formulation of PMI and it’s importance for each of the stakeholders.

Introduction

The Purchasing Managers’ Index (PMI) is a statistical estimation used to determine the economic directions in which the manufacturing and service sectors are moving forward. The PMI consists of a diffusion index that locates whether the market conditions for a particular sector are expanding, remaining the same, or contracting. The main goal of this index is to provide information about the present and future business conditions to decision-makers, analysts, investors, and the government.

The Purchasing Managers’ Index is an economic indicator formulated via surveys conducted for businesses in a particular sector.

PMI is formulated by three main institutions:

  • Institute for Supply Management (ISM): This institute originated the manufacturing and non-manufacturing metrics produced for the United States.
  • Singapore Institute of Purchasing and Materials Management (SIPMM): This institute formulates the Singapore PMI.
  • IHS Markit Group: This institute formulates metrics based on ISM’s metrics for more than 30 countries worldwide.

Calculation of PMI

The Purchasing Managers’ Index is formulated by several different surveys of purchasing managers at businesses in a different sector but mainly revolving around manufacturing and service sectors. All the surveys are amalgamated into a single numerical result depending on several possible answers to each question.

The calculation mentioned below is the methodology of the PMI being calculated and released by the Institute for Supply Management (ISM). The PMI is formulated from a monthly survey sent to senior executives at more than 400 companies in 19 primary industries (which are selected and weighted via their contribution to the U.S. GDP). The PMI is formulated around five main survey areas: (1) new orders, (2) inventory levels, (3) production, (4) deliveries, and (5) employment. All the survey areas are equally weighed while computing the PMI. This always consists of questions about business conditions regarding the sector and if any possible changes are occurring, whether be expanding, stagnant, or contracting.

The Purchasing Managers’ Index is an index indicating whether the economic conditions are better or worse for the companies surveyed by comparing it to the previous PMI. The methodology used to calculate the PMI assigns weight to each common element. The common element is multiplied by the following for a certain situation: multiplied by 1 for improvement, multiplied by 0.5 for stagnation, and multiplied by 0 for deterioration.

The PMI is calculated as:

PMI = (P1 x 1) + (P2 x 0.5) + (P3 x 0) where,

P1 = % of answers indicating an expansion
P2 = % of answers indicating no change
P3 = % of answers indicating a contraction

The PMI is a number ranging between 0 and 100. The formulated PMI is then compared to the previous month and if the PMI is greater than 50 represents an improvement/expansion while a PMI which is less than 50 represents a contraction/deterioration. A PMI equal to 50 represents no change/stagnation. It is also important to note that the greater the difference from the midpoint of 50, the greater is the expansion/contraction.

Importance of PMI

The PMI is turning out to be one of the most tracked indicators of business activity across the globe. It provides a good picture of how an economy is functioning particularly in the manufacturing sector. It is a good representative of the boom-and-bust cycles in the economy and hence it is closely administered by investors, businesses, traders, and financial professionals including economists. Furthermore, the PMI acts as a leading indicator of economic activity. It is important to various entities as explained below.

For Manufacturers

The PMI and its relevant data formulated every month by the ISM are crucial decision-making tools for managers in various roles ranging from different sectors. For example, if a smartphone manufacturer makes their production decisions based on the expected new orders from customers in the future months. These new orders drive the management’s purchasing decisions about multiple components and raw materials. Therefore, the PMI helps manufacturers in predicting the possibility for an expansion or unexpected contraction in their sector and them to make decisions for an anticipated future.

For Suppliers

The PMI also facilitates suppliers in making their decisions. A supplier from the manufacturing sector would follow the PMI to predict the market to estimate the amount of future demand for its products. PMI’s ability to inform about supply and demand, in turn, helps the supplier adjust the prices that they can charge. For example, if the manufacturer’s new orders are growing, it might result in increased customer prices and as a result, accept a price increase from its suppliers as well. On the contrary, if the new orders are declining, the manufacturers might reduce their prices and as a result demand lower prices for the parts that they procure from suppliers.

For Investors

Investors can also utilize the data from the PMI to their advantage because the PMI acts as an indicator of economic conditions. The direction in which the PMI tends to follow is usually preceded by changes in the trends of major economic activities and outputs such as the GDP, Industrial Production, and Employability. Therefore, paying attention to the value of PMI and its movement can result in profitable foresight for the investors.

For Government

The Purchasing Managers’ Index is an important indicator for economic growth. It is used by international investors who try to formulate an opinion on the economic growth and hence consider PMI as a leading indicator for the GDP’s growth or deterioration. Central banks also utilize the results of PMI to formulate monetary policies.

Why should one be concerned about PMI?

PMI is a good indicator to provide a direction in which the economy is moving forward. If you are a potential employee, it will help you determine the increase or decrease in employability in an economy. If you are an investor, PMI helps you determine changes in the macro fundamentals of the economy and their impact on the equity market. If you are a business owner, it could help formulate and guide in making more informed and certain decisions related to the sourcing of raw materials, inventory levels, etc.

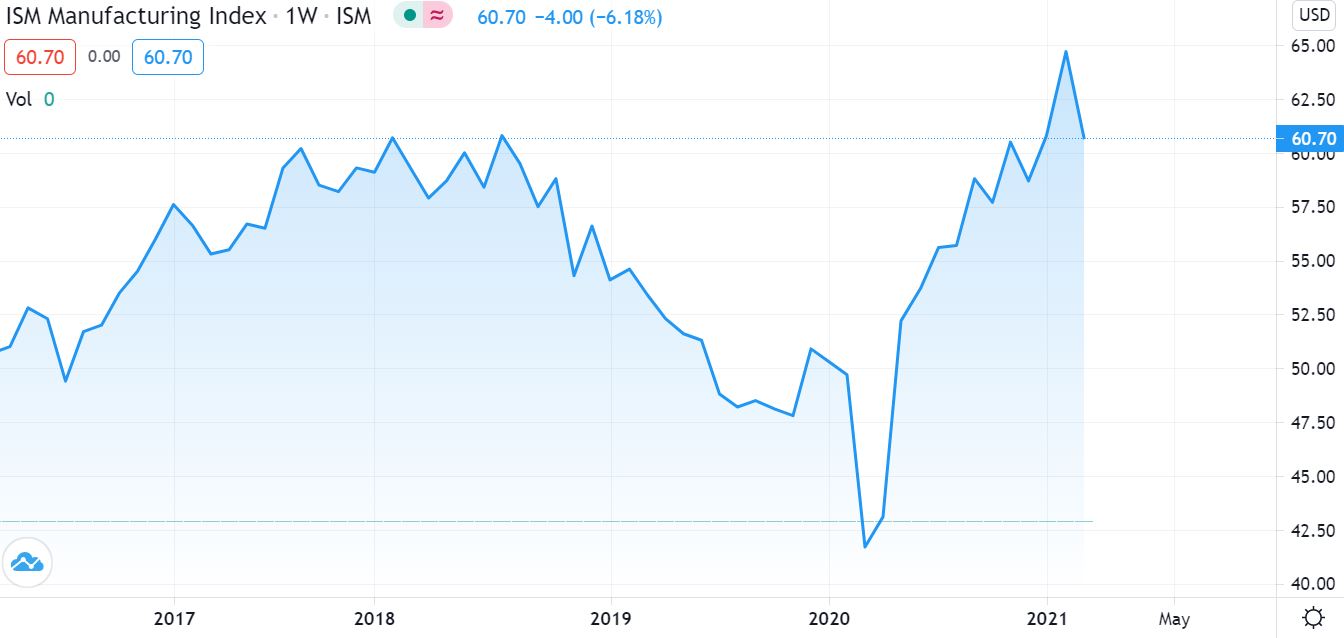
The following graph from tradingview.com depicts the PMI from 2017 to 2021. The PMI ranges between the value 0 and 100 with values below 50 showing contraction and values above 50 showing expansion in the economy. As of April 2021, the PMI was 60.70 as depicted in the chart below.

Bijal Gandhi

Source: www.tradingview.com

Related posts on the SimTrade blog

   ▶ Bijal GANDHI Economic Indicators

   ▶ Bijal GANDHI Leading and Lagging Indicators

   ▶ Bijal GANDHI GDP

   ▶ Bijal GANDHI Interest Rates

   ▶ Bijal GANDHI Inflation Rate

Useful resources

Institute for supply management

Trading View

About the author

Article written in May 2021 by Bijal GANDHI (ESSEC Business School, Grande Ecole Program – Master in Management, 2019-2022).

Credit Rating

Credit Rating

Bijal GANDHI

In this article, Bijal GANDHI (ESSEC Business School, Grande Ecole Program – Master in Management, 2019-2022) elaborates on the concept of Credit Rating.

This reading will help you understand the meaning, types, and importance of credit rating.

Introduction

Credit rating is the measurement of ability of the entity that seeks to borrow money to repay its financial obligation. Credit rating is based on the earning capacity of an entity as well as the history of the repayment of their past obligations. The entity seeking to borrow money can be an individual, a corporation, a state (at a national or federal level for some countries like the US), or a government agency. Credit ratings are used by banks and investors as one of the factors to determine their decision to lend money or not. Banks would develop their own credit analysis to decide to lend or not while investors would rely on the analysis by rating agencies to invest in credit products like commercial papers or bonds.

Rating agencies

The credit agency calculates the credit rating of an entity by analyzing its qualitative and quantitative attributes. Information can be procured from internal information directly provided by the entity such as financial statements, annual reports, etc. as well as external information such as analyst reports, published news articles, overall industry, etc.

A credit agency is not a part of the deal and therefore does not have any role involved in the transaction and, therefore, is assumed to provide an independent and honest opinion on the credit risk associated by a particular entity seeking to raise money through various means.

Now, three prominent credit agencies contribute 85% to the overall rating market:
1. Moody’s Investor Services
2. Standard and Poor’s (S&P)
3. Fitch Group

Each agency mentioned above utilizes a unique yet similar rating style to calculate credit ratings like described below,
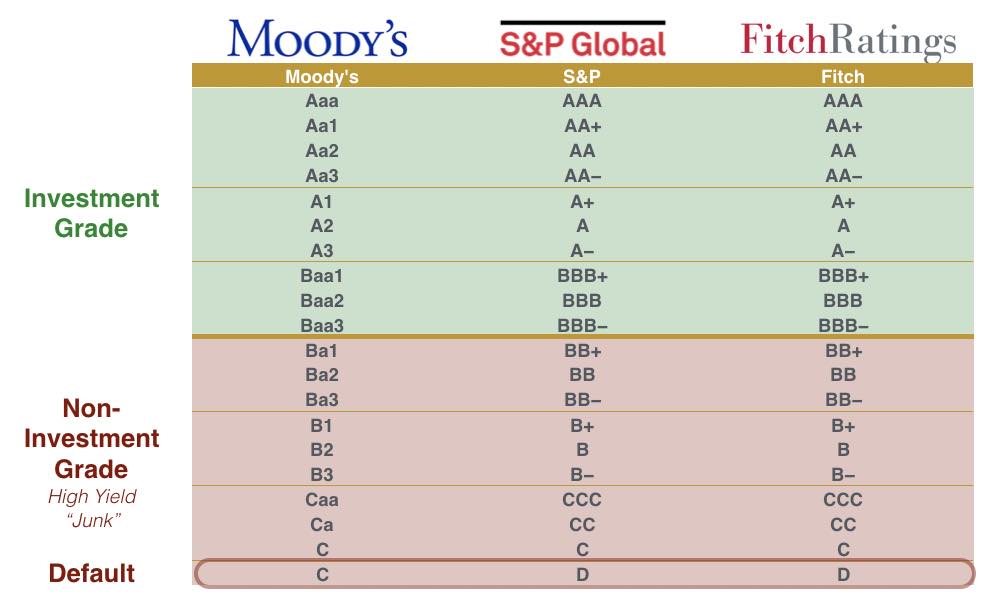
Bijal Gandhi

Types of Credit Rating

Credit rating agencies use their terminology to determine credit ratings. Even so, the terminology is surprisingly similar among the three credit agencies mentioned above. Furthermore, ratings are grouped into two main categories:

Investment grade

These ratings indicate the investment is considered robust by the rating agencies, and the issuer is likely to complete the terms of repayment. As a result, these investments are usually less competitively priced when compared to speculative-grade investments.

Speculative grade

These investments are of a high-risk nature and hence offer higher interest rates to reflect the quality of the investments.

Users of Credit Rating

Credit Ratings are used by multiple entities like the following:

Institutional investors

Institutional investors like pension funds or insurance companies utilize credit ratings to assess the risk associated to a particular investment issuance, ideally with reference to their entire portfolio. According to the rate of a particular asset, it may or not include it in its portfolio.

Intermediaries

Credit ratings are used by intermediaries such as investment bankers, which utilize these ratings to evaluate credit risk and therefore derive pricing for debt issues.

Debt Issuers

Debt issuers like governments, institutions, etc. use credit ratings to evaluate their creditworthiness and to measure the credit risk associated with their debt issuance. These ratings can furthermore provide prospective investors in these organizations with an idea of the quality of the instruments issued by the organization and the kind of interest rate they could expect from such instruments.

Businesses & Corporations

Business organizations can use credit ratings to evaluate the risk associated with certain other organizations with which the business plans to have a future transaction/collaboration. Credit ratings, therefore, help entities that are interested in partnerships or ventures with other businesses to evaluate the viability of their propositions.

Understanding Credit Rating

A loan is a debt, which is the financial obligation with respect to its future repayment by the debtor. A credit rating helps to distinguish between debtors who are more liable to repay the loan compared to debtors who are more likely to be defaulters.

A high credit rating indicates the repayment of the loan by the entity without any possible defaults. A poor credit rating indicates the possibility of the entity defaulting the repayment of loans due to their past patterns with respect to loan repayments. As a result of the strong emphasis on credit rating, it affects an entity’s chance of being approved for a loan and receiving favorable terms for that loan.

Credit ratings apply to both businesses and the government. For example, sovereign credit ratings apply to the national government whereas corporate credit ratings apply for cooperation. On the other hand, credit scores apply only to individuals and are calculated by agencies such as Equifax, Experian, and TransUnion for the citizens of the United States.

Credit ratings can be short-term or long-term. A short-term credit rating reflects the history of an entity’s rating with respect to recent loan repayments and therefore poses a possibility for this borrower to default with its loan repayment when compared to entities with long-term credit ratings.

Credit rating agencies usually assign alphabet grades to indicate ratings. For example, S&P Global has a credit rating scaling from AAA (excellent) to C and D. They consider a debt instrument with a rating below BB to be a speculative-grade or junk bond, indicating they are more likely to default on loans.

Importance of Credit Ratings

Credit ratings for entities are calculated based on due diligence conducted by the rating agencies. While a borrowing entity will aim to have the highest possible credit rating, the rating agencies aim to take a balanced and objective view of the borrowing entity’s financial situation and capacity to honor/repay the debt. Keeping this in mind, mentioned below are the importance of credit ratings for various entities:

For Lending Entities

Credit ratings give an honest image of a borrowing entity. Since no money lender would want to risk giving their money to a risky entity with a high possibility of default from their part, credit ratings genuinely help money lenders to assess the worthiness of the following entity and the risk associated with that entity, therefore helping them to make better investment decisions. Credit ratings act as a safety guard because higher credit ratings assure the safety of money and timely repayment of the same with interest.

For Borrowing Entities

Since credit ratings provide an honest review of a borrower’s ability to repay a loan, borrowers with high credit ratings find it easier to get loans approved by money lenders at interest rates that are more favorable to them. A considerable rate of interest is very important for a borrowing entity because higher interest rates make it more difficult for a borrower to repay the loan and fulfill their financial obligations. Therefore, maintaining a high credit rating is essential for a borrower as it helps them get a considerable amount of relaxation when it comes to a rate of interest for the loan issued to them. Finally, it is also important for a borrower to ensure that their credit rating has a long history of high rating. Just because a credit rating is all about longevity. A credit rating with a long credit history is viewed as more attractive when compared to a credit rating with a short credit history.

For Investors

Credit ratings play a very crucial role when it comes to a potential investor’s decision to invest or not in a particular bond. Now, investors have different risk natures associated with them. In general, investors, who are generally risk-averse in nature, are more likely to invest in bonds with higher credit ratings when compared to lower credit ratings. At the same time, credit ratings help investors, who are risk lovers to differentiate between bonds that are riskier due to the lower credit ratings and invest in them for higher returns at the risk of higher defaults associated with them. Overall, credit ratings help investors make more informed decisions about their investment schemes.

Related posts on the SimTrade blog

   ▶ Jayati WALIA Credit risk

   ▶ Bijal GANDHI Interest Rates

   ▶ Rodolphe CHOLLAT-NAMY Credit analyst

   ▶ Aamey MEHTA My experience as a credit analyst at Wells Fargo

   ▶ Jayati WALIA My experience as a credit analyst at Amundi Asset Management

   ▶ Louis DETALLE My professional experience as a Credit Analyst at Société Générale

Useful resources

S&P Global Ratings

Moody’s

Fitch Ratings

About the author

Article written in May 2021 by Bijal GANDHI (ESSEC Business School, Grande Ecole Program – Master in Management, 2019-2022).
Producer Price Index

Producer Price Index

Bijal Gandhi

In this article, Bijal Gandhi (ESSEC Business School, Master in Management, 2019-2022) elaborates on the concept of Producer Price Index.

This reading will help you understand the meaning, calculation, uses and limitations of the Producer Price Index.

What is Producer Price Index?

Producer price index or PPI is a statistical estimation used to measure the change in the prices of goods and services. It is used to track the selling prices of the products received by domestic producers for their output. Producer price index can be calculated in two ways:

  • the goods leave the place of production called the Output PPI
  • the goods enter a new production process called the Input PPI

PPI is an estimation of the change in the average prices that a producer receives, and it is not generally what the consumer has to pay for that same product. PPI in manufacturing measures this change in the prices of products when they leave the producer i.e., they exclude any taxes, transportation, and trade margins that the consumer may have to pay. Due to this very reason, PPI cannot be used to calculate the standard of living in an economy due to the difference in the price paid by a producer and the final consumer. PPI tracks the price change in goods and services and therefore provides a general overview of inflation in an economy.

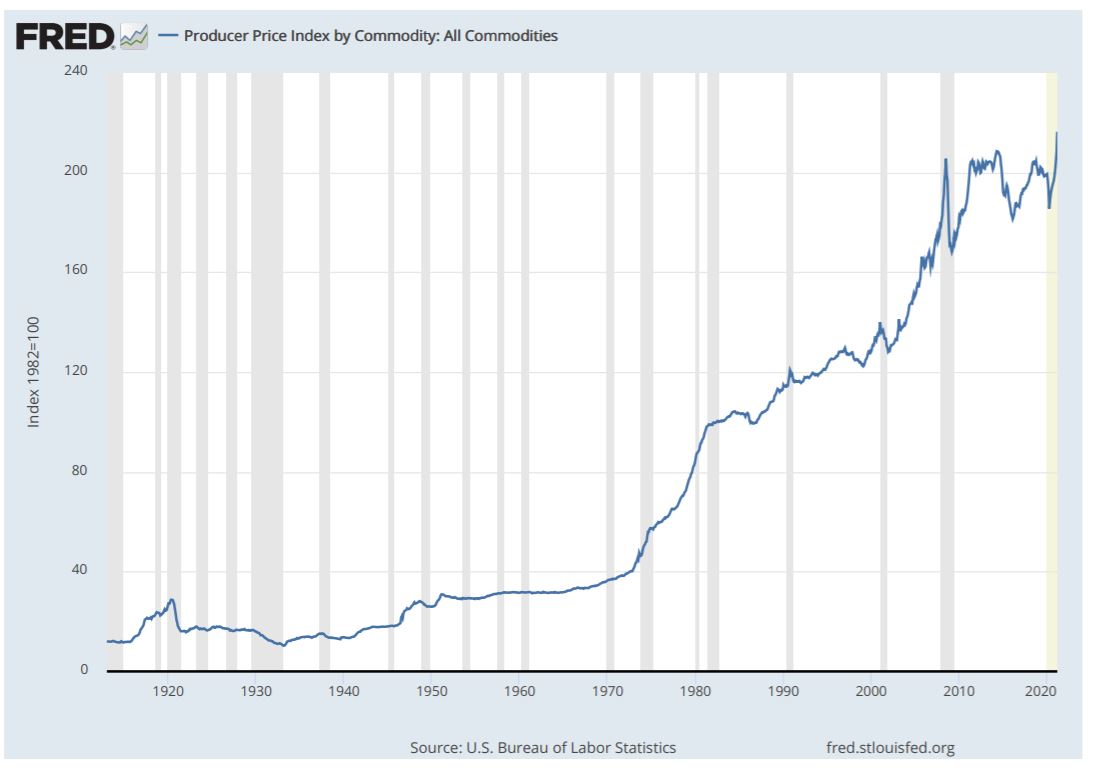
The Producer Price Index acts as a good leading economic indicator since it identifies various price changes in the economy before the goods enter the final marketplace. It is useful for the Government to formulate fiscal and monetary policies for the economy. Here, you can see the evolution of PPI from 1920 to 2020 for all commodities in the US.

Bijal Gandhi

Understanding Producer Price Index (PPI)

This index tracks the change in the cost of production. And due to the variety of businesses available, PPI is often classified using broad categories. In the US, the Bureau of Labor Statistics (BLS) distinguishes three categories:

1. Industry Level Classification

This level of classification measures the cost of production incurred at an industry level. It measures the changes in prices incurred for an industry’s output which is outside the sector itself by calculating the industry’s net output.

2. Commodity Classification

This is the second category of classification. This classification neglects the industry of production and instead amalgamates goods and services based on similarity and product make-up.

3. Commodity-Based Final Demand-Intermediate Demand (FD-ID)

This is the last category of classification where the system groups commodity indexes for various goods, services, and construction into sub-product classes (the specific buyer of products). This classification revolves around the physical assembly and processing required for goods.

Example of the use of Producer Price Index (PPI)

Usually, businesses indulge in long-term contracts with suppliers. And since price fluctuation is a common phenomenon over time, long-term deals are bound to be a difficult situation with only a single fixed price for this supply of goods or services. To curb the situation, the purchasing businesses and suppliers normally include a clause in the contracts that adjust the cost of these goods and services by external indicators, such as the PPI.

For example, firm X purchases a key component for its manufacturing unit from firm Y. The initial cost to procure that component is $10 along with the provision in the contract that the price will be adjusted quarterly, according to the PPI. So, after the end of a quarter, the cost of the component would be adjusted at a price higher or lower than $10 according to the change in the PPI (if it went up or down and by the degree with which it changed).

Benefits of Using Producer Price Index

1. Accurate Measuring of Inflation

Inflation causes an increase or decrease in the cost of consumer goods purchased by the people, affecting the purchasing power. Since the calculation of the Producer Price Index occurs before than the calculation of the Consumer Price Index, the Producer Price Index can be utilized to minimize or eliminate the effects of inflation in the economy. The PPI can be used to accurately determine the inflation rate by considering the price of goods whether the price increases or decreases when the goods are sent for distribution.

2. Predictive Value on Retail Changes

While the consumer price index indicates the prices of products when they reach the marketplace of end-consumers, the producer price index mentions the cost of goods before they are released in the market, ready to be consumed. Hence PPI can have a projecting value directly concerning their retail prices.

3. Contract Negotiations

A longer sale agreement usually involves the dynamic nature and uncertain consequences of inflation and how I can alter the future market. The PPI can help with the negotiation of these clauses because it can correspond to an independent measurement of price alterations.

Related posts on the SimTrade blog

Useful resources

About the author

Article written in May 2021 by Bijal Gandhi (ESSEC Business School, Master in Management, 2019-2022).

Consumer Price Index

Consumer Price Index

Bijal Gandhi

In this article, Bijal Gandhi (ESSEC Business School, Master in Management, 2019-2022) elaborates on the concept of Consumer Price Index.

This reading will help you understand the meaning, calculation, uses and limitations of Consumer Price Index.

What is Consumer Price Index?

The Consumer Price Index (CPI) is a statistical estimation to measure the aggregate price level in an economy. It measures the change in the price level of a basket of consumer goods and services, purchased by households and businesses. This basket is a market basket which is an amalgamation of goods and services most used by consumers. The CPI is a means to acknowledge the changes in the purchasing power of a country’s currency. It can be further used to compute the cost of living. The change in CPI is used to measure inflation in the economy.

Statistical agencies compute CPI to understand the price change of various commodities and keep a track of inflation. CPI is also an important medium to understand the real value of wages, salaries, and pensions. In most of the countries, CPI is one of the most closely watched national economic statistics.

The index is usually computed monthly, or quarterly including different components of consumer expenditure, such as food, housing, apparel, transportation, electronics, medical care, education, etc.

Calculation of CPI

The consumer price index is calculated as an expression of the change in the current price of the market basket for a particular period by comparing it to a base period. It is calculated as an expression to represent the expenditure pattern that includes people of all ages throughout the population. It is calculated as follows:

Bijal Gandhi

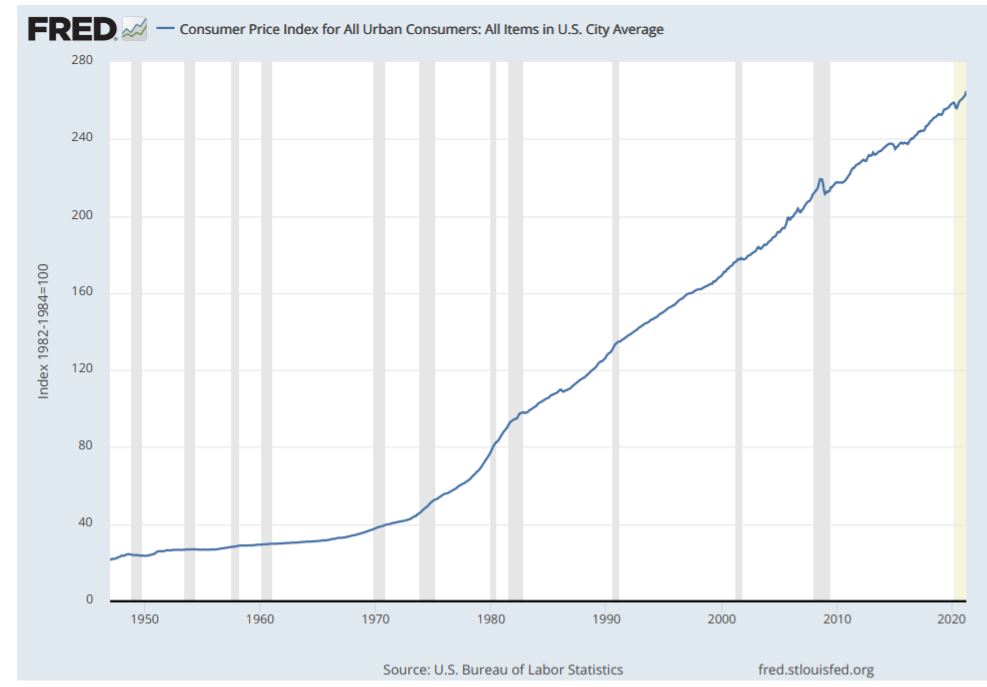
The calculated CPI acts as an indicator for inflation in an economy. For example, if the CPI is 120, it means that there has been a 20% rise in the prices of the market basket compared to the base period. Similarly, an index of 95 indicates a 5% decrease in the prices of the basket compared to the base period. The following graph tracks the CPI from 1950 till 2020 for the U.S city average.

Bijal Gandhi

Determining the Market Basket

A suitable basket of commonly used goods and services is developed using detailed expenditure information. The government spends a considerable number of resources including money and time to accurately measure this expenditure information. The source of this information includes surveys targeted at households and businesses.

A specific good or service is added to the basket after an initiation process. For example, the initiation process for shoes goes as follows: let us assume that there are three types of shoes A, B, and C, which make up 70%, 20% and 10% of the shoe market, respectively. The choice of the shoe is directly related to the sales figures. In this case, shoe A is being chosen as it represents 70% of the market share. After the selection, this shoe will continue to be priced each month in the same store for the next four years after which a new representative will be chosen.

Uses of the Consumer Price Index

CPI acts as an economic indicator since it is a measure of inflation in an economy. It can help in determining the purchasing power of an economy. It also aids the government in the formulation and effective implementation of a government’s economic policies. It is also used for the adjustment of other economic indicators for price changes. For example, the CPI is used to adjust various components of national income. Since CPI is an indicator of the cost of living in an economy, it helps to provide adjustments to the minimum wages and social security benefits available to the residents of a country.

Limitations of the Consumer Price Index

  • The consumer price index may not be perfectly applicable to all population groups. For example, the CPI of an urban area will be able to represent the urban population in the economy, but it will not be able to reflect the status of the population living in the rural areas.
  • CPI does not provide an official estimation for subgroups of a population.
  • CPI is a conditional cost of living measure and it does not include every aspect that affects the living standards of the consumers.
  • CPI provides the change in the price level of a basket of goods and services by comparing the prices of the basket’s current price with a base price. Hence two areas cannot always be compared since the base price of the basket may differ. Therefore, a higher index in one area does not necessarily mean that the prices are higher in that area.
  • CPI does not consider the social and environmental factors in the scope of its definition.

Limitations in measurement of the CPI

  • It is highly prone to sampling error since there is always a scope that the sample of the population chosen might not accurately represent the entire population.
  • The estimation of CPI can be prone to errors arising out of price data collection and errors associated with operational implementations.
  • One of the biggest drawbacks of CPI is that it does not include energy costs (for example, gas) in its basket of commonly used goods and services even though energy costs are a major part of the household expenditure.

Related posts on the SimTrade blog

Useful resources

About the author

Article written in May 2021 by Bijal Gandhi (ESSEC Business School, Master in Management, 2019-2022).

Unemployment Rate

Unemployment Rate

Bijal Gandhi

In this article, Bijal Gandhi (ESSEC Business School, Master in Management, 2019-2022) explains in detail about Unemployment Rate.
This read will help you understand the types of unemployment, the categories of unemployed individuals and the measures to calculate the unemployment rate.

What is the unemployment rate?

The unemployment rate is simply the percentage of the total labor force that is currently unemployed. These are individuals who are available to work and have taken measures to find work. The labor force is the total number of employed and unemployed people. This economic indicator is measured in percentage and is seasonally adjusted. The unemployment rate is considered a lagging indicator.
The unemployment rate is a very useful tool used to measure the underutilized labor force. It reflects the economy’s ability to generate employment. It basically helps in analyzing the effectiveness of the economy and its future performance.

Types of unemployment

Unemployment has been one of the most tenacious and unmanageable economic problems for several decades. Almost every country in the world has been affected by the same and therefore it is quite important to understand the types of unemployment and the reasons behind the same. There is a long list of unemployment types, but we will focus on the following important ones.

Structural unemployment

Structural unemployment is a result of technological shifts in the economy. It occurs when the existing skills of the workers are redundant due to mismatch of the skills that they possess versus the skills required. A common example would be automation of manufacturing processes, usage of robots, etc., which would cause unemployment as the workers might no longer be needed. The training of these workers may prove costly or time consuming, resulting in the workers often being displaced and unemployed for extended periods of time.

Frictional unemployment

Frictional unemployment refers to the period of unemployment after an individual leaves a particular job and till he/she finds a new one. It occurs when people voluntarily leave their jobs. It is generally short-lived. This short period of unemployment is caused naturally because it takes time for the individual to find the right job and for the companies to find the right employees. From an economic perspective, it is the least troublesome.

Cyclical unemployment

Cyclical unemployment is a result of economic downturns. It is caused during or before recessionary periods when the demand for goods and services drops drastically. The businesses to cut costs or save their companies would lay off workers resulting in unemployment.
These workers would now spend less, resulting in an even lesser demand for goods and services. Therefore, more workers would be laid-off. Cyclical unemployment creates more cyclical unemployment and therefore it becomes necessary for the government to intervene. The government may either use the monetary policy or the fiscal policy to stop this downward spiral.

How to calculate the unemployment rate?

The standard method for calculating unemployment would simply be:
Unemployment rate = Unemployed/Civilian Labor Force  100
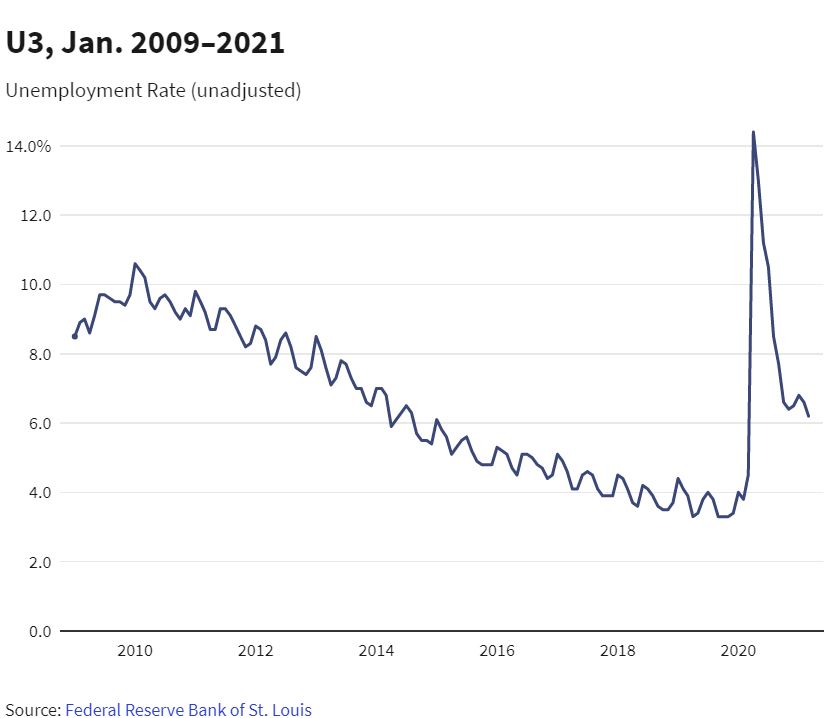
The above formula is used to calculate the most cited unemployment rate called the U-3. For U-3 calculation, categories of individuals who work temporarily or part-time are considered employed and so are the individuals who perform at least 15 hours of unpaid family work like homemakers.

Bijal Gandhi

Alternative measures of calculation

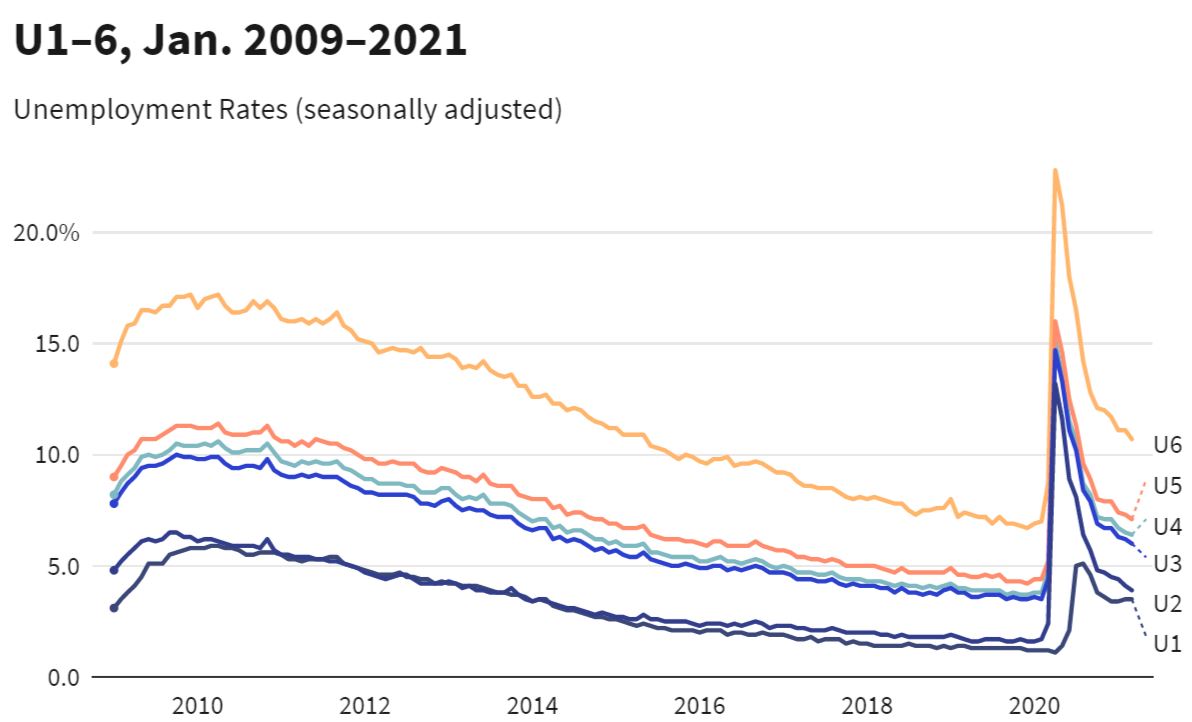
However, there are several other factors that need to be considered for calculation of the unemployment rate. Therefore, The Bureau of Labor Statistics (BLS) releases several variations of unemployment rates such as the U-1, U-2, U-4, U-5, and U-6. This is because the U-3 singularly does not convey the true picture of the unemployed labor force.

For example, the U-6 is considered as the “real unemployment rate” as it includes marginally attached workers and part-time workers unlike U-3. Marginally attached workers are the ones who have stopped looking for work in the past 4 weeks but have been looking for work for the entire year before. Those part-time workers are included who would like a full-time job if given the opportunity.

Bijal Gandhi
Source: Federal Reserve Bank of St. Louis

Related posts on the SimTrade blog

Useful resources

About the author

Article written in April 2021 by Bijal Gandhi (ESSEC Business School, Master in Management, 2019-2022). Bijal has two years of experience in the financial markets and is currently working as a financial analyst at Mega Biopharma.

Inflation Rate

Inflation Rate

Bijal GANDHI

In this article, Bijal GANDHI (ESSEC Business School, Master in Management, 2019-2022) explains in detail about the inflation Rate.

This read will help you understand the causes for inflation, the pros and cons of inflation and finally how to control inflation.

What is inflation?

Inflation in simple terms means an increase in the cost of living. It is basically an economic term which means that an individual must spend more money now than before to buy the same goods or services. The percentage increase in the prices over a specified period can be termed as the inflation rate. As the prices increase, the purchasing power of each unit of the currency decreases. The change in the price level of a well-diversified basket of goods and services can help estimate the decline in the purchasing power. This basket should include commodities, services, utilities, and everything else that humans need to lead a comfortable life. Therefore, the calculation of inflation is a complex process. It is measured in several ways depending upon the goods and services included in the calculation.

Deflation is the opposite of inflation and it indicates a general decrease in the prices of goods and services. It occurs when the inflation rate is lesser than 0%.

Types of inflation

Inflation rates can be divided into the following categories depending upon their characteristics,

  • Creeping inflation means that the prices have increased by 3% or less during a year.
  • Walking inflation refers to an increase in prices between 3-10% a year. It is destructive in nature and is harmful for the economy.
  • Galloping inflation causes an absolute havoc in the economy as the prices rise by 10% or more.
  • Hyperinflation is a rare phenomenon which occurs when the prices rise by 50% or more.

What are the three causes of inflation?

The rise in prices is most associated with the rise in demand. But there are several other mechanisms that result in an increase in the money supply of an economy. These mechanisms can be classified into the following three types,

Demand-pull effect

The demand-pull effect refers to the situation in which the demand exceeds the supply for goods and services. This may occur due to an increase in the money supply and credit, stimulating the overall demand. The consumers are willing and able to pay higher prices for a product thereby leading to a price rise.

Cost-Push Effect

A cost-push effect occurs when the supply is restricted while the demand is not. The supply could be restricted due to several factors like the scarcity of raw materials, the increase in the prices of production inputs, pandemics, etc. These additional costs may result in a higher cost for the finished product or reduce supply. In any case, the prices would rise resulting in inflation.

Built-in Inflation

The built-in inflation is a result of the cause-effect relationship. It is based on the people’s expectations of inflation in the coming years. The laborers and workers will demand a higher wage if they expect that the prices of goods and services will rise. Thereby increasing the cost of production. This will further result in an increase of the prices of goods and services again.

Measure of inflation

The Consumer Price Index (CPI) evaluates the change in the average price of a selected basket of goods and services over time. This predetermined basket mainly includes necessities like food, medical care, and transportation. The change in price of each component is calculated over a period and averaged to its relative weight in the basket. It is a widely used measure for both the inflation and effectiveness of the government’s policy. In the US, the CPI reports are published on a monthly and yearly basis by the U.S. Bureau of Labor Statistics. The value of inflation can be calculated over a period between two dates using the following methodology:

Formula for inflation

If you wish to know the purchasing power of a certain sum of money from one period to another, you can input data in this Inflation Calculator by the U.S. Bureau of Labor Statistics and see the results. This calculator uses the same methodology and CPI data as mentioned above.

Is inflation good or bad?

Inflation can be either good or bad depending upon the situation of individuals. For example, individuals holding cash or bonds would not like inflation as the purchasing power of their holdings would decrease. Individuals with investments in assets like real estate, commodities, etc. would appreciate inflation as the real value of their holdings will increase.

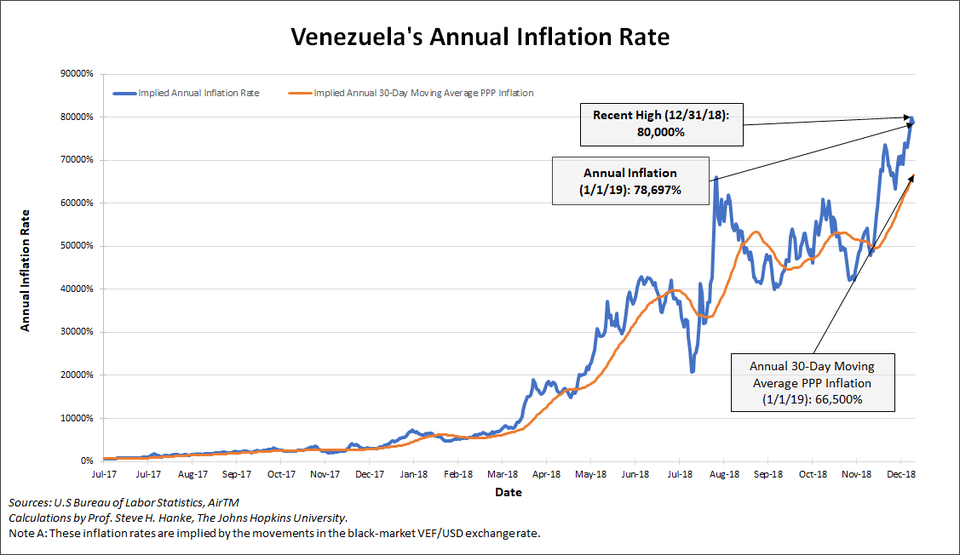
Central banks often struggle in maintaining an optimal level of inflation. Spending is encouraged over saving as increased spending will help boost economic activities. This is because it would be profitable for individuals to spend now instead of later if the purchasing power of money is expected to fall. For example, in the U.S., the Federal Reserve aims for a target rate of inflation of 2% YoY. A very high inflation rate can have catastrophic consequences. For example, Venezuela, which was suffering from hyperinflation (1087%) in 2017, collapsed into a situation of extreme poverty and uncertainty. Individuals who depend upon savings or fixed income are affected the most. This is because the interest rates in their savings accounts in the banks are lesser than the inflation rate, thereby making them poorer. Similarly, lower-income families are highly affected if the rise in their wages does not keep up with the rise in the prices. A high inflation also pressurizes governments to take actions to financially support the citizens as the cost-of-living increases.

Bijal Gandhi

Similarly, a deflation situation is not healthy as well. Consumers may put off spending as they may expect a fall in the prices. The reduced demand for goods and services will result in slow economic growth. This could further result in a recession-like situation with increased unemployment and poverty.

How to control inflation?

As discussed in the Interest rates post, the financial regulators of a country shoulder the responsibility of maintaining a stable and steady inflation rate. In the US, the Federal Reserve communicates inflation targets well in advance to keep a steady long-term inflation rate. This is because price stability helps businesses plan well ahead in future and know what to expect. The central banks through the monetary policy actions controls the money supply. For example, they adopt methods like quantitative easing to either counter deflation or to maintain the targeted inflation rate.

One powerful way for individuals would be to increase their earnings either through demanding a higher pay or promotions to keep up with inflation. Other options include investing in the stock market. Stocks are a good way to hedge against inflation. This is because a rise in the stock price will be inclusive of the effects of inflation. Another alternative would be to invest in instruments indexed to the inflation. Treasury Inflation Protected Securities (TIPS) and Series I Bonds are examples of such instruments.

Useful resources

U.S. Bureau of Labor Statistics

Investopedia Inflation Rate

The Balance How to measure Inflation

Related posts on the SimTrade blog

   ▶ Bijal GANDHI Economic Indicators

   ▶ Bijal GANDHI Leading and Lagging Indicators

   ▶ Bijal GANDHI GDP

   ▶ Bijal GANDHI Interest Rates

About the author

Article written in April 2021 by Bijal GANDHI (ESSEC Business School, Master in Management, 2019-2022). Bijal has two years of experience in the financial markets and is currently working as a financial analyst at Mega Biopharma.

Interest Rates

Interest rates

Bijal GandhiIn this article, Bijal Gandhi (ESSEC Business School, Master in Management, 2019-2022) explains in detail about Interest Rates.

This read will help you understand the impact of rising and falling interest rates and their relationship with the stock and the bond markets.

Definition of Interest Rates

Interest rate is the cost charged by the lender to the borrower for the amount borrowed. The buzz over interest rate is real as it has a huge impact on not just the stock markets but also the overall economy. It is therefore important to understand how the interest rates are set and influenced by different factors.

Economic policy

The primary goal of any nation would be to attain maximum levels of employment, stability in prices, and economic growth. To achieve these goals, the Central Bank uses the interest rates as a switch to either curb inflation or achieve growth. The federal funds rate is the rate at which banks borrow money from each other overnight. The federal body sets the target for the federal funds rate and any deviations from this target has a ripple effect over the entire economy and thereby on the stock markets. The graph below portrays the trajectory of the effective federal funds rate from 1998 to 2018.

Bijal Gandhi

Impact of rising interest rates

In the US, the Federal Reserve increases the federal funds rate in order to make borrowing money more expensive for banks. The Central Bank manages this through open market operations using government securities like Treasury bills, notes and bonds. It sells the Treasury securities in order to increase the interest rates. The banks therefore would charge a higher rate to their customers. With an increase in interest rates, the consumers will now have less money to spend due a decrease in their disposable income (due to a higher cost to obtain credit). An increase in interest rates may impact the demand for goods and services. The prices may fall and thereby help the federal body curb inflation. A further rise will start impacting businesses directly. This is because businesses borrow money from banks for their operations. Rise in interest rates will discourage business spending which may not just slow down the growth of one company but the entire economy. The negative impact on the revenues and profits of a company will eventually reflect in the stock prices.

Bijal GandhiSource: Federal Reserve & Balance.com

Impact of falling interest rates

Apart from the interest rate at which the banks borrow from one another, the Central Bank also set the reserve requirements for the banks. The reserve requirement is the percentage of deposits a bank is obliged to keep on hand each night. The Fed can also lower the reserve requirements in case it wants to encourage lending to businesses and households in the economy. Similarly, during a slump in the economy, the federal reserve may also stimulate activity by cutting down the federal funds rate. An increase in the borrowing by businesses would act as a catalyst for growth. This is because businesses would enjoy operations, expansions, and acquisitions at a cheaper rate. A lower interest rate will also result in higher consumer spending. The revenues and profits for businesses will rise thereby impacting the stock prices positively.

Relation between interest rates and stock market prices

A higher interest rate would mean higher debt costs for companies, which may result in a decrease in the projected future cash flows for stockholders. This will lower the stock price of that company and if similar situations occur in other companies in the economy, the whole stock market may decline. Not just the existing debt costs, but an interest rate hike may also discourage borrowing for expansionary measures. However, this may not be the case with all sectors. Some sectors like the financial industry may benefit from an increase in the interest rate as they can now charge more for lending. The impact cannot just be financial but also psychological. A reduction in the stock prices may also set off a bout of panic selling due to fear and uncertainty. The investors and businesses may lose confidence and would now not be willing to make any risky investments.

Relation between interest rates and bond market prices

Bond prices and interest rates have an inverse relationship: as interest rates rise, bonds prices fall and vice versa. This is because with an increase in interest rates, the cost of borrowing will also increase resulting in a decrease in demand for existing bonds which yield lower returns. Similarly, with a decrease in interest rates, companies will now issue new bonds at lower interest rates for their projects. The demand for high yielding bonds will increase and so would the prices of these bonds. The longer the maturity of a bond, the more the bond value would be subjected to fluctuations. Short-term bonds are less affected by the interest rate changes. Long-term bonds are more affected by the interest rate changes. Technically, this effect is captured by the duration measure of a bond.

Conclusion

Interest rates not just affect businesses and investors but also all individuals of the nation. They play a major role in deciding the fate of both investments and the economy and therefore it is important to understand its role and impact.

Related posts on the SimTrade blog

Useful resources

About the author

Article written in April 2021 by Bijal Gandhi (ESSEC Business School, Master in Management, 2019-2022).

GDP

Gross Domestic Product (GDP)

Bijal GANDHI

In this article, Bijal GANDHI (ESSEC Business School, Grande Ecole Program – Master in Management, 2019-2022) explains the concept of GDP.

This read will help you understand in detail the calculation, components, variations, and drawbacks of GDP.

Gross Domestic Product

Gross domestic product refers to the total monetary value of all finished goods and services produced within a geographical region during a specific period. The final value of the product is taken into consideration instead of the product components to avoid double-counting. The GDP is calculated for a country on an annual basis through data gathered from surveys and trade flows. The calculation is generally undertaken by the country itself and occasionally by the UN agencies like the World Bank and IMF. As discussed in Economic Indicators post, the GDP is helpful in estimating both the value of an economy and its growth rate.

Measuring GDP

The GDP is primarily calculated through the following three approaches. All three methods would yield the same results if computed correctly.

The Expenditure Approach

As the name suggests, this approach calculates the total spending by different participants in the economy. Therefore, the following formula is used:

Bijal Gandhi

where C represents consumption, G government spending, I investment, and (X-M) exports net of imports. Consumption is the largest and the most significant component of the GDP calculation. Consumers spend on goods and services and their willingness to spend reflects their level of confidence in the economy. Government spending refers to the sum of government consumption plus the total amount invested/spent to generate benefits for the residents. Investment by businesses is the sum of all the money invested in business activities or capital expenditures made to boost the businesses in an economy. Net exports are the total value of exports less the total value of imports. In the U.S., the Bureau of Economic Analysis (BEA) adopts the expenditure approach to calculate the GDP. The following is a snapshot of the U.S. GDP for Q3, 2020.

Bijal Gandhi
Source: Federal Reserve Bank of St. Louis.

The Income Approach

The income approach is based on the accounting logic that the total expenditures in an economy should be equal to the total income generated by the production of all the goods and services in that economy. Here, the assumption is that all revenues eventually go to either one of the four factors of production such as land, labor, capital, or entrepreneurship. Therefore, all the income generated through these factors like rent, wages, return on capital and corporate profits are summed and adjusted with taxes and depreciation.

The Production Approach

The total value of output generated by all the industries in an economy is summed in order to derive the GDP through the production approach. The cost of intermediate goods used in the production of this output is deducted from this value to avoid double-counting. Therefore, the gross value added is basically the total output less intermediate consumption.

Real GDP vs Nominal GDP

  • Real GDP refers to the inflation-adjusted GDP. It is important to remove the effects of inflation on GDP to make GDP comparable with the previous years. If not, then the real GDP would seem to be increasing while not the case. A price deflator is used to determine the change in prices since the base year.
  • Nominal GDP refers to the GDP calculated by considering the current market prices in the economy. It is basically the raw measurement which includes price changes over the years. The nominal GDP is the most used while comparing GDP between countries. The currency market exchange rates are used to convert the local currencies into U.S. dollars. Below, we can see that the U.S., China, Japan, Germany, and India dominate the market share of the world economy when measured by the Nominal GDP.

Bijal Gandhi
Source: World Bank.

Variations of GDP

GDP growth rate

The GDP growth rate is the percentage change in the GDP from one period to another. It compares one year/ quarter to another and helps policymakers take informed decisions. A negative growth rate for consecutive years suggests that the economy is contracting which further signals a recession. A very high growth rate is an indication of inflation. According to economists, a growth rate of approximately 2% is ideal for sustainable economic growth.

GDP per capita

GDP cannot be directly compared from one country to another due to the difference in the population size. One of the methods to make GDP comparable would be to use GDP per capita. In GDP per capita calculation, the total GDP is divided by the number of residents in the country. This helps in direct comparison of the standard of living of the residents of two or more nations. The real GDP per capita would be one of the optimal methods as it eliminates the effects of inflation and exchange rates as well. The following graph is the per capita growth rate of China from 1980 to 2019.

Bijal Gandhi Source: Datacommons.org

GDP and PPP (Purchasing power parity)

To make GDP comparable, it is also necessary to adjust for differences of the local currency and the exchange rate. The purchasing power parity method is used to make cross-country comparisons using the real outputs, living standards and real income.

GDP and Investing

Even though a lagging indicator, the GDP is a very important economic indicator for investors. This is because the GDP data aids investors in making comparisons and adjustments for their asset allocation. Being a direct indicator of the condition of the economy, it helps investors make well informed decisions even for their funds in other developed and developing nations. The GDP report is a good source of information and data related to inventory, corporate profits, and operating cash flows of different sectors of the economy. Also, investors can make rough estimations of the equity market value through the ratio of total market capitalization to GDP. To conclude, GDP provides a good decision-making framework for investors.

Criticisms of GDP

Even though very useful, GDP has its own share of drawbacks. The major drawback is that it does not consider the value generated through informal and illegal trade. The activities in the black market are unaccounted for and therefore this results in underestimating the actual output. Also, unpaid work and services like volunteering are not considered, even though they have a significant impact on the economy.

Another major flaw could be that it ignores the environmental costs of producing the output. The impact on the well-being of society and the costs attached to the same are ignored while calculating the GDP. Similarly, every expense or income by the government or individual is included irrespective of whether they were productive or not. Therefore, even the unproductive output regularly contributes to the GDP growth rate.

Related posts on the SimTrade blog

   ▶ Bijal GANDHI Economic Indicators

   ▶ Bijal GANDHI Leading and Lagging Indicators

Useful resources

Investopedia World Economy

The balance GDP Definition

About the author

Article written by Bijal GANDHI (ESSEC Business School, Grande Ecole Program – Master in Management, 2019-2022).

Leading and Lagging Indicators

Leading and lagging indicators

Bijal GANDHI

In this article, Bijal GANDHI (ESSEC Business School, Grande Ecole Program – Master in Management, 2019-2022) elaborates on the concept of leading and lagging indicators. This reading will help you understand in detail the meaning of the leading and lagging indicators.

Leading indicators

Indicators that precede economic events and help predict the direction of an economy are termed as “leading indicators”. These indicators prove to be critical when the economy is heading from one stage to another in the business cycle. A single indicator may or may not be accurate to forecast the health of the economy. Therefore, these indicators are analyzed in conjunction through a composite index to predict the trend. In this post we deal with the U.S. case.

Composite index of leading indicators

The Composite Index of Leading Indicators is published monthly by The Conference Board to help market participants (traders, investors, financial analysts, central bankers, etc.) gauge the overall direction of the economy in the near-term future. It is a comprehensive index calculated with leading indicators based on their impact on the economy. This index is also known as the Leading Economic Index (LEI) in the U.S., and it comprises ten components detailed below.

The following is a snapshot of the LEI and the CEI for the United States. CEI refers to the coincident economic index which is based on the coincident indicators. Economic indicators that describe the current state of the economy within a particular segment (such as the job market or the market for goods and services), are termed “coincident indicators”. Coincident indicators move simultaneously along the changes in business cycles of the economy. Here we can see that the LEI increased for the month of February. The CEI also increased, following the LEI.

Bijal Gandhi
Source: The Conference Board.

Yield curve

Daily yields compare the return on short-term investment instruments like Treasury bills to long-term instruments like Treasury bonds. Generally, in the yield curve, the yields over the short term are lower than those over the long-term. When the yield curve inverts, it is a signal that the investors are expecting uncertainty over the long term. This may also be an indicator of a downturn in the economy or a recession.

Source: worldgovernmentbonds

Credit spreads

Credit Spread refers to the difference in yield between a risk-free instrument and a corporate bond over the same maturity. Credit spreads fluctuations are caused due to changes in other economic indicators like inflation, liquidity, etc. A widening credit spread would reflect investor concern and vice versa.

Stock market

The stock market is a leading indicator as stock prices are highly dependent on the future growth and expected earnings of companies. Investors may sell their stocks if they are not confident about the future of the company. The S&P 500 stock index for the U.S. is a close estimation of the total value of the business sector and therefore it is used to comprise the LEI.


Source: TradingView.

Durable goods orders

Durable Goods Manufactures’ report refers to the total capital goods purchased by companies. An increase in the volume of purchases is an indication that companies are confident about the future. It is classified under the leading indicator as business orders change much before an actual change in the business cycle.

Manufacturing jobs

The manufacturing jobs survey is also classified as a leading indicator as to the demand for labor shifts much before an actual change in the business cycle. If the demand for goods is anticipated to increase the supervisors may ask for a greater labor supply indicating a positive sign for the economy. A change in demand for labor will also impact other dependent sectors like transportation and retail.

Building permits

Building permit numbers are published monthly by the U.S. census which tells us in advance about the expected spending on construction-related projects. We all know the importance of the real estate sector on the economy from the subprime mortgage crisis in 2008.

Unemployment claims

The weekly claims for unemployment insurance help the government calculate the total layoffs and publish a report. This report is an indication of the changes in unemployment levels, business activities, and their impact on consumer income.

Manufacturing new orders

The Manufacturing New Orders Index published by the Institute of Supply Management (ISM) is calculated from the survey of purchasing manufacturers of hundreds of manufacturing firms. It indicates the change (increase or decrease) of orders of manufactured goods.

Consumer expectations

Consumer expectations is a survey conducted to gain insights from the end-users themselves. The surveyors ask the consumers about their opinions regarding jobs, income, and overall business conditions. They try to gauge the consumer sentiment for the next 6 to 12 months.

Leading Credit Index

This component is derived from six other financial indicators. All these financial indicators are forward looking such as 2 years swap spreads, security repurchases, investor’s sentiments, etc.

Lagging indicators

Lagging indicators are those economic indicators that lag the economic performance of a geographic region. Therefore, these indicators are not useful to predict the future health of the economy but to assess and confirm a pattern after a large movement in an underlying economic variable of interest like the unemployment rate. Since these indicators trail the shifts in the underlying variable, they are useful to analyze long-term trends in the economy. They are further categorized into economic, technical, and business indicators as per their use.

Composite index of lagging indicators

As discussed in the blog Economic Indicators, the Composite Index of Lagging Indicators is published monthly by the Conference Board. This Index includes the following seven components which help assess and confirm the economic situation of the U.S.

Average duration of unemployment

The Bureau of Labor Statistics computes the average number of weeks an individual has been unemployed. During a recession, long-term unemployment rises and vice versa.

Ratio, manufacturing, and trade inventories to sales

The Bureau of economic analysis computes the ratio of inventories to sales to understand the business conditions of both the individual firm and the industry. The inventory and sales data related to the manufacturing, wholesale, and retail is provided by the Bureau of the Census. When sales targets are not reached due to a weak economy, the inventories tend to shoot up and the ratio reaches its cyclical peak in the middle of a recession.

Change in labor cost per unit of output, manufacturing

The Conference Board computes the rate at which the labor costs per unit rise with respect to the cost of production per unit. During a weakening state of the economy, the production declines at a much higher rate than the labor costs even with layoffs of the laborers. This series is calculated over six months as monthly data can tend to be inconsistent.

Average prime rate charged by banks

The prime rate is the benchmark rate which banks use to estimate their interest rates for various types of loans. The change in this rate usually tends to lag the general economic performance. During periods of a strengthening economy, banks tend to resist reducing the interest rates, while during times of a weak economy, banks tend to resist increasing the interest rates.

Commercial and industrial loans outstanding

The total volume of outstanding business loans held by both banks and non-financial companies is computed by The Conference Board from the data compiled by the Board of Governors of the Federal Reserve System. When the revenues or profits decline in a business due to the weakening of the economy, banks start to take out more loans to cover their costs. Similarly, an improvement in the economy will result in liquidity and the demand for short-term credit may fall if the deflation sets in.

Ratio, consumer installment credit outstanding to personal income

This is the ratio of consumer debt to personal income. This ratio is a measurement of the indebtedness relative to income. This ratio tends to increase during times of expansion when the consumers are confident enough to pay off their debts in the future. Similarly, they tend to hold off borrowing even until after the months of recession due to skepticism and uncertainty.

Change in Consumer Price Index for services

The Bureau of Labor Statistics computes the rate of change in the services component of the Consumer Price Index (CPI). This is a lagging indicator as the services sector may raise prices well in advance in anticipation of a recession. The rise in prices may be due to market rigidities and recognition lag. Even with the recovery, firms in the services sector may keep cutting the prices. This is because they might not recognize when the recession is over.

Related posts on the SimTrade blog

   ▶ Bijal GANDHI Economic indicators

   ▶ Bijal GANDHI Gross Domestic Product (GDP)

Useful resources

US Department of Treasury

United States Census Bureau

Labor Statistics

About the author

Article written by Bijal GANDHI (ESSEC Business School, Grande Ecole Program – Master in Management, 2019-2022).
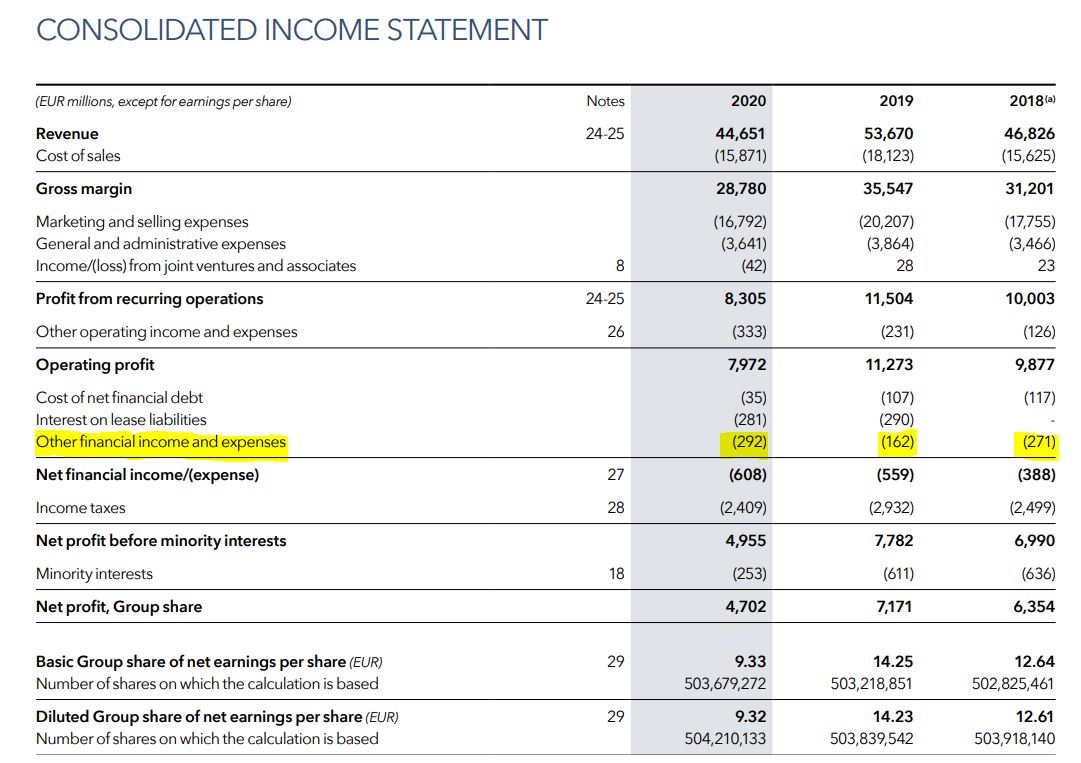
Economic Indicators

Economic indicators

Bijal Gandhi

In this article, Bijal Gandhi (ESSEC Business School, Master in Management, 2019-2022) elaborates on the concept of economic indicators.

This read will help you understand in detail the types of economic indicators, their impact on stock prices and their use by investors in the financial markets.

Economic indicators

Economic indicators are statistical data related to economic activity. They help to evaluate and forecast the health of the economy at the macro level. These indicators measure the systematic risk of the economy and are widely used by investors for their investment decisions. Economic indicators are generally published on a regular basis in a timely manner by governments, universities, and non-profit organizations. To build economic indicators, these institutions use census and surveys. For example, the U.S Bureau of Labor Statistics publishes a monthly report on the Employment Situation through a survey. This report details about the jobs lost or created every month, compensation costs, unemployment rate, etc.

Economic indicators can be of great use if interpreted accurately. Historically, it has had a strong correlation with the economic growth of a nation. The impact can be clearly seen in the long-term performance of the financial markets and therefore investors keep a close eye on them. They try to evaluate and understand the impact of each of the economic indicators to make informed decisions. The government, economists, corporations, and research organizations are the other beneficiaries of these indicators.

Types of economic indicators

Leading indicators

Economic indicators that help understand and forecast the future health of the economy, are termed “leading indicators”. These indicators tend to precede economic events and therefore prove to be critical during times of economic recession. A single leading indicator may not prove to be accurate, but several indicators analyzed in conjunction may help in providing insights into the future of the economy. Economists, investors, and policymakers may use and analyze these indicators according to their interests.

The evolution of the stock market is one of the major leading indicators. Weak earnings forecasts may indicate to investors the weak state of the economy beforehand. The stock market may therefore tend to decline preceding to the decline of the economy as a whole and vice versa. For the United States, other important leading indicators include the following,

Investors may or may not look at the same indicators as economists. For example, investors would be more interested in the data related to jobless claims by the U.S. Department of Labor to gauge the signs of a weakening economy.

Coincident indicators

Economic indicators that describe the current state of the economy within a particular segment (such as the job market or the market for goods and services), are termed “coincident indicators”. Coincident indicators move simultaneously along the changes in business cycles of the economy. For example, the payroll data published by the U.S. Bureau of Labor Statistics can help analyze the demand for employees. This evaluation would help understand if the economy’s present condition is strong or weak. Therefore, coincident indicators reflect the real-time situation. They are more useful when used with the leading and lagging indicators. For the United States, other important coincident indicators are:

Lagging indicators

Economic indicators that describe the past state of the economy which confirms a pattern only after a large movement in the underlying variable, are termed “lagging indicators”. These factors tend to trail the shift in the underlying asset and are therefore useful to validate the long-term trends in the economy. Lagging indicators can further be classified under economic, technical, and business indicators as per their use.

The Lagging Index is published by The Conference Board . This economic indicator lags the composite economic performance of the U.S. This indicator is calculated with following seven economic components:

  • Average prime rates
  • Average duration of unemployment
  • Change in the Consumer Price Index for services
  • Ratio of manufacturing and trade inventories to sales
  • Real dollar volume of outstanding commercial and industrial loans
  • Change in labor cost per unit of output in manufacturing
  • Ratio of consumer installment credit outstanding to personal income

Important economic indicators

Gross domestic product

GDP refers to the sum of all goods and services produced in a country during a specific period. The motive is to calculate either the total income or spending in a country and compare it with the preceding period. This difference over time (from a quarter to another or from a year to another) allows economists to understand whether the economy has contracted or expanded.

GDP being the key indicator of the economy, has a significant impact on the investors’ sentiment. A positive change in the GDP would mean that the economy is thriving as compared to the previous period. This would further mean lower levels of unemployment, higher spending, and positive earnings outlook for the companies. This would translate into higher stock prices for investors. Therefore, GDP can be termed as an important economic indicator for both economists and investors.

Inflation (CPI & PPI)

Inflation is referred to the rate at which the value of goods and services rise and consequently the value of currency declines. It is one of the most important economic indicators for investors because it measures the real value of an investment being eroded in a certain period. For example, if the inflation rate is 4% and yield from an investment is 3%, then investors would in real terms lose 1% every year. Therefore, it is a vital factor in investment decision-making, as a higher inflation rate would mean that investor should get an even higher return on their investment. The effect of inflation on the costs incurred by the companies is another factor investor should look at. Decline in inflation would mean lower costs for companies resulting in better overall performance.
The most relevant inflation indexes are Consumer Price Index (CPI) and Producer Price Index (PPI)

  • The Consumer Price Index (CPI) is defined by the Bureau of Labor Statistics in the U.S. as “a measure of the average change over time in the prices paid by urban consumers for a market basket of consumer goods and services”. It is widely used as a close proxy and estimate to inflation. It helps economists, investors and others get an idea about the change in prices in the economy and make informed decisions accordingly.
  • The Producer Price Index (PPI) is defined by the Bureau of Labor Statistics in the U.S. as “a measure of the average change over time in the selling prices received by domestic producers for their output”. It differs from the CPI as it calculates the cost from the perspective of the producer instead of the consumer. It is an important tool as inflation can be tracked in the PPI much before any other economic indicators (including the CPI).

Interest rates

Interest rates are vital economic indicators both for economists and investors. In the U.S., the Federal fund rate is the interest rate at which the banks borrow from each other on an overnight basis. It is targeted by the Federal Open Market Committee (FOMC), which is the monetary policy making body in the U.S. The FOMC sets this target rate eight times a year. The announcement of the changes in the Fed rate is religiously followed by investors. This is because rate adjustments are decided by the FOMC after careful consideration of several economic variables ranging from inflation to employment.
Financial markets (both equity and bond markets) generally react heavily as even a minor rise or decline in this rate can significantly impact the borrowing costs of corporations.

Article written by Bijal Gandhi (ESSEC Business School, Master in Management, 2019-2022).