Leading and lagging indicators
In this article, Bijal GANDHI (ESSEC Business School, Grande Ecole Program – Master in Management, 2019-2022) elaborates on the concept of leading and lagging indicators. This reading will help you understand in detail the meaning of the leading and lagging indicators.
Leading indicators
Indicators that precede economic events and help predict the direction of an economy are termed as “leading indicators”. These indicators prove to be critical when the economy is heading from one stage to another in the business cycle. A single indicator may or may not be accurate to forecast the health of the economy. Therefore, these indicators are analyzed in conjunction through a composite index to predict the trend. In this post we deal with the U.S. case.
Composite index of leading indicators
The Composite Index of Leading Indicators is published monthly by The Conference Board to help market participants (traders, investors, financial analysts, central bankers, etc.) gauge the overall direction of the economy in the near-term future. It is a comprehensive index calculated with leading indicators based on their impact on the economy. This index is also known as the Leading Economic Index (LEI) in the U.S., and it comprises ten components detailed below.
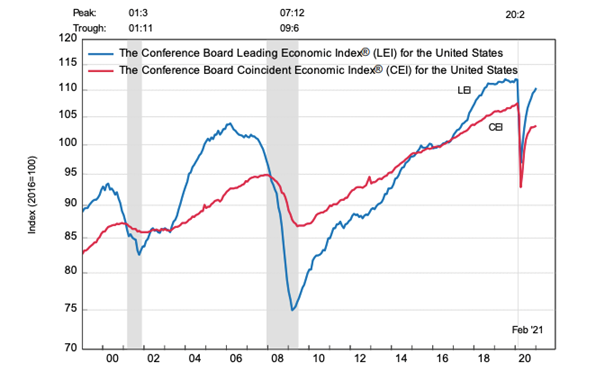
The following is a snapshot of the LEI and the CEI for the United States. CEI refers to the coincident economic index which is based on the coincident indicators. Economic indicators that describe the current state of the economy within a particular segment (such as the job market or the market for goods and services), are termed “coincident indicators”. Coincident indicators move simultaneously along the changes in business cycles of the economy. Here we can see that the LEI increased for the month of February. The CEI also increased, following the LEI.

Source: The Conference Board.
Yield curve
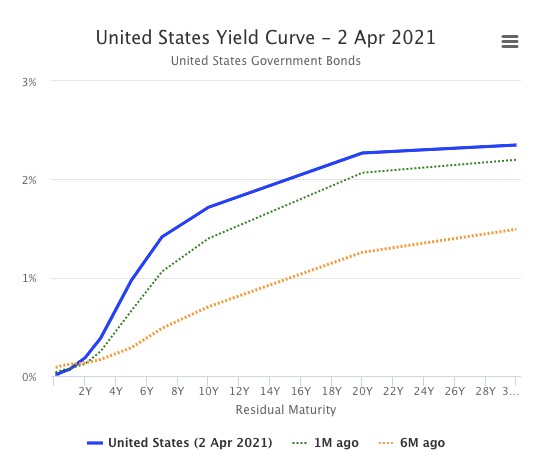
Daily yields compare the return on short-term investment instruments like Treasury bills to long-term instruments like Treasury bonds. Generally, in the yield curve, the yields over the short term are lower than those over the long-term. When the yield curve inverts, it is a signal that the investors are expecting uncertainty over the long term. This may also be an indicator of a downturn in the economy or a recession.

Source: worldgovernmentbonds
Credit spreads
Credit Spread refers to the difference in yield between a risk-free instrument and a corporate bond over the same maturity. Credit spreads fluctuations are caused due to changes in other economic indicators like inflation, liquidity, etc. A widening credit spread would reflect investor concern and vice versa.
Stock market
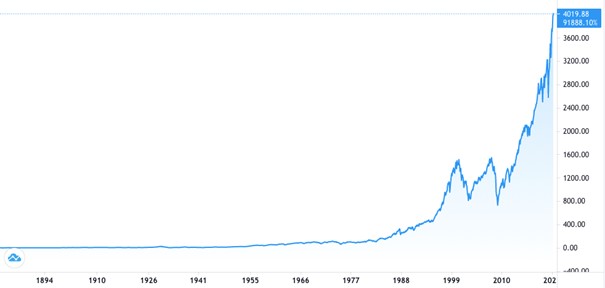
The stock market is a leading indicator as stock prices are highly dependent on the future growth and expected earnings of companies. Investors may sell their stocks if they are not confident about the future of the company. The S&P 500 stock index for the U.S. is a close estimation of the total value of the business sector and therefore it is used to comprise the LEI.

Source: TradingView.
Durable goods orders
Durable Goods Manufactures’ report refers to the total capital goods purchased by companies. An increase in the volume of purchases is an indication that companies are confident about the future. It is classified under the leading indicator as business orders change much before an actual change in the business cycle.
Manufacturing jobs
The manufacturing jobs survey is also classified as a leading indicator as to the demand for labor shifts much before an actual change in the business cycle. If the demand for goods is anticipated to increase the supervisors may ask for a greater labor supply indicating a positive sign for the economy. A change in demand for labor will also impact other dependent sectors like transportation and retail.
Building permits
Building permit numbers are published monthly by the U.S. census which tells us in advance about the expected spending on construction-related projects. We all know the importance of the real estate sector on the economy from the subprime mortgage crisis in 2008.
Unemployment claims
The weekly claims for unemployment insurance help the government calculate the total layoffs and publish a report. This report is an indication of the changes in unemployment levels, business activities, and their impact on consumer income.
Manufacturing new orders
The Manufacturing New Orders Index published by the Institute of Supply Management (ISM) is calculated from the survey of purchasing manufacturers of hundreds of manufacturing firms. It indicates the change (increase or decrease) of orders of manufactured goods.
Consumer expectations
Consumer expectations is a survey conducted to gain insights from the end-users themselves. The surveyors ask the consumers about their opinions regarding jobs, income, and overall business conditions. They try to gauge the consumer sentiment for the next 6 to 12 months.
Leading Credit Index
This component is derived from six other financial indicators. All these financial indicators are forward looking such as 2 years swap spreads, security repurchases, investor’s sentiments, etc.
Lagging indicators
Lagging indicators are those economic indicators that lag the economic performance of a geographic region. Therefore, these indicators are not useful to predict the future health of the economy but to assess and confirm a pattern after a large movement in an underlying economic variable of interest like the unemployment rate. Since these indicators trail the shifts in the underlying variable, they are useful to analyze long-term trends in the economy. They are further categorized into economic, technical, and business indicators as per their use.
Composite index of lagging indicators
As discussed in the blog Economic Indicators, the Composite Index of Lagging Indicators is published monthly by the Conference Board. This Index includes the following seven components which help assess and confirm the economic situation of the U.S.
Average duration of unemployment
The Bureau of Labor Statistics computes the average number of weeks an individual has been unemployed. During a recession, long-term unemployment rises and vice versa.
Ratio, manufacturing, and trade inventories to sales
The Bureau of economic analysis computes the ratio of inventories to sales to understand the business conditions of both the individual firm and the industry. The inventory and sales data related to the manufacturing, wholesale, and retail is provided by the Bureau of the Census. When sales targets are not reached due to a weak economy, the inventories tend to shoot up and the ratio reaches its cyclical peak in the middle of a recession.
Change in labor cost per unit of output, manufacturing
The Conference Board computes the rate at which the labor costs per unit rise with respect to the cost of production per unit. During a weakening state of the economy, the production declines at a much higher rate than the labor costs even with layoffs of the laborers. This series is calculated over six months as monthly data can tend to be inconsistent.
Average prime rate charged by banks
The prime rate is the benchmark rate which banks use to estimate their interest rates for various types of loans. The change in this rate usually tends to lag the general economic performance. During periods of a strengthening economy, banks tend to resist reducing the interest rates, while during times of a weak economy, banks tend to resist increasing the interest rates.
Commercial and industrial loans outstanding
The total volume of outstanding business loans held by both banks and non-financial companies is computed by The Conference Board from the data compiled by the Board of Governors of the Federal Reserve System. When the revenues or profits decline in a business due to the weakening of the economy, banks start to take out more loans to cover their costs. Similarly, an improvement in the economy will result in liquidity and the demand for short-term credit may fall if the deflation sets in.
Ratio, consumer installment credit outstanding to personal income
This is the ratio of consumer debt to personal income. This ratio is a measurement of the indebtedness relative to income. This ratio tends to increase during times of expansion when the consumers are confident enough to pay off their debts in the future. Similarly, they tend to hold off borrowing even until after the months of recession due to skepticism and uncertainty.
Change in Consumer Price Index for services
The Bureau of Labor Statistics computes the rate of change in the services component of the Consumer Price Index (CPI). This is a lagging indicator as the services sector may raise prices well in advance in anticipation of a recession. The rise in prices may be due to market rigidities and recognition lag. Even with the recovery, firms in the services sector may keep cutting the prices. This is because they might not recognize when the recession is over.
Related posts on the SimTrade blog
▶ Bijal GANDHI Economic indicators
▶ Bijal GANDHI Gross Domestic Product (GDP)
Useful resources
About the author
Article written by Bijal GANDHI (ESSEC Business School, Grande Ecole Program – Master in Management, 2019-2022).

