In this article, Isaac FAINSTEIN, Director at Petrini Valores and Visiting Lecturer at IESEG School of Management (Lille), shares his professional experience as a trader in illiquid fixed income and emerging markets — and what practitioners know that most finance courses never cover.
About Petrini Valores
Petrini Valores is an Argentine broker-dealer specializing in fixed income, equities, derivatives, and financing. The firm operates as a market maker in illiquid corporate and provincial bonds, across multiple asset classes: peso-denominated, USD-denominated, inflation-linked, and dollar-linked instruments. It also participates as a member of underwriting syndicates in primary bond issuances.
As Director of the trading desk, I am responsible for pricing, execution, and risk management across these asset classes on a daily basis.
Logo of Petrini Valores.

Source: Petrini Valores.
Trading in practice: what the desk actually looks like
I have been trading fixed income and foreign exchange in Argentine markets for over fifteen years. Over that same period, I have taught applied finance courses at IESEG School of Management in Lille — courses built around the situations I encounter at the desk every week. What follows is an attempt to bridge those two worlds.
Agency, intermediation, and principal trading: three different jobs
Most finance programs teach students how to price securities. Fewer teach them what it actually feels like to put the firm’s capital at risk to make a market. The distinction between agency trading, intermediation, and principal trading is more consequential than most courses suggest.
In agency trading, you act on behalf of a client — executing their order in the market, taking no position yourself, earning a fee for the service. The client bears the market risk. You are their agent.
Intermediation — what practitioners often call riskless principal — is already a form of proprietary trading, technically speaking. You act as principal on both legs: you buy from one counterparty and simultaneously sell to another, earning the bid-ask spread. Because both legs close at the same time, your market exposure is minimal. You are not an agent of either side. You are a counterparty to both, just briefly, and without meaningful inventory risk.
Principal trading with inventory risk is something else entirely. The firm puts its own capital on the line with no guaranteed exit. You buy a bond from a client with no buyer lined up on the other side. You sell from your own inventory because a client needs to buy. You absorb the spread — and the full market risk that comes with holding the position until you can unwind it. The longer you hold, the more exposure you carry. This is the mode that no simulation fully replicates, and the one this article is about.
Pricing illiquid bonds: when there is no obvious answer
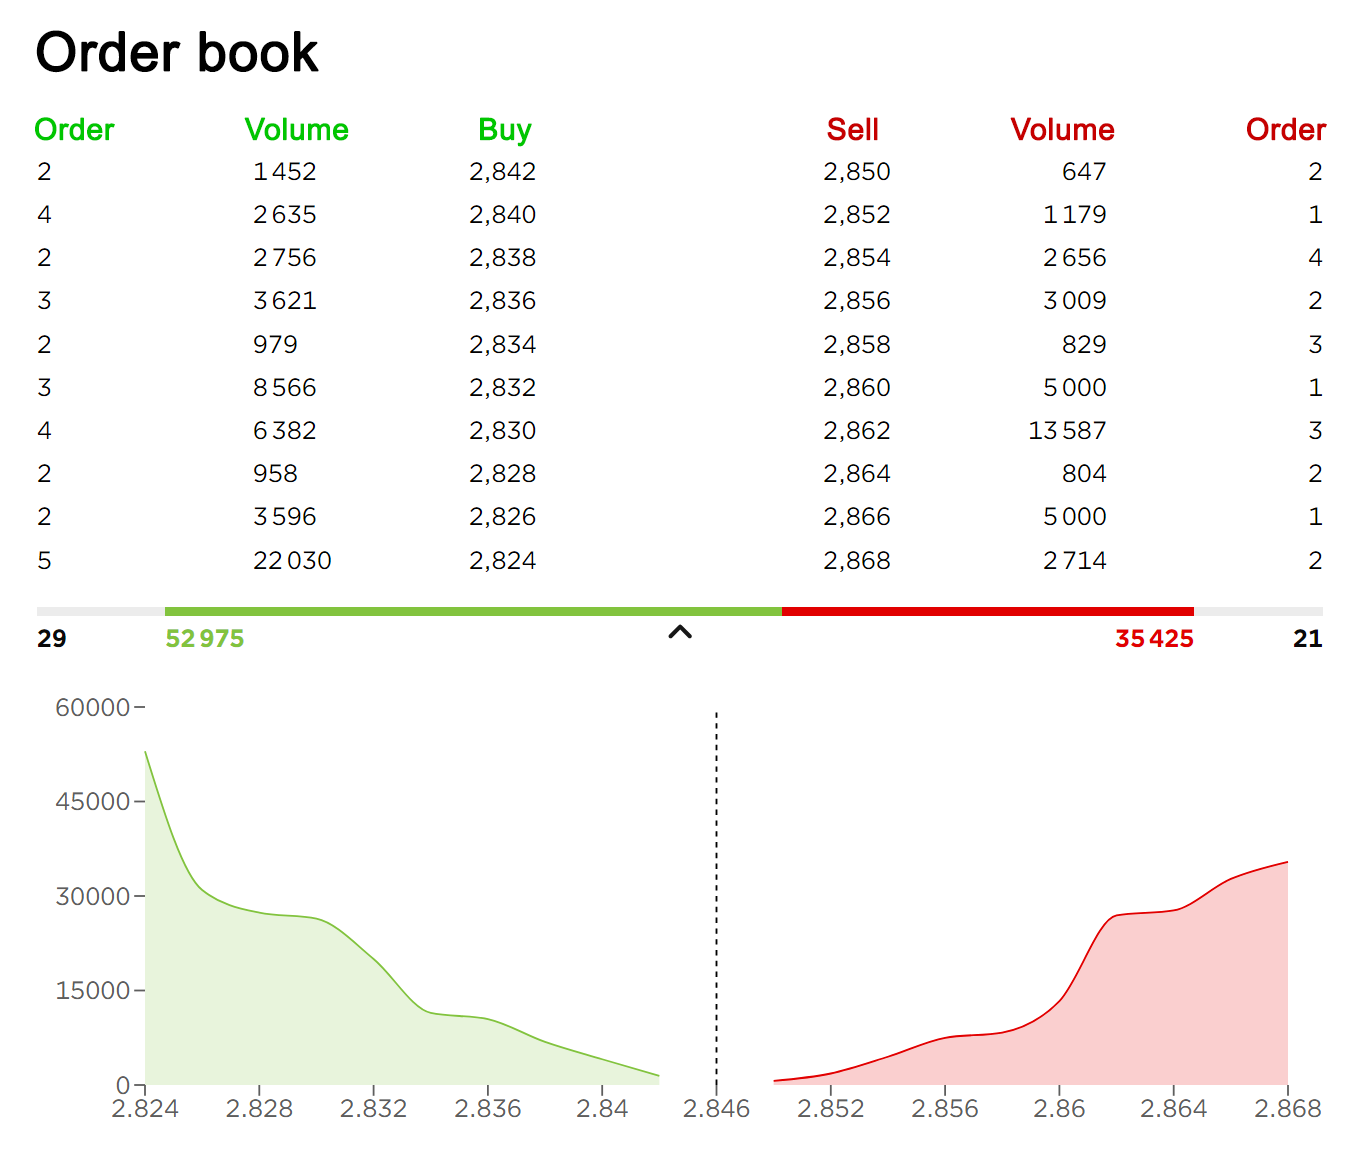
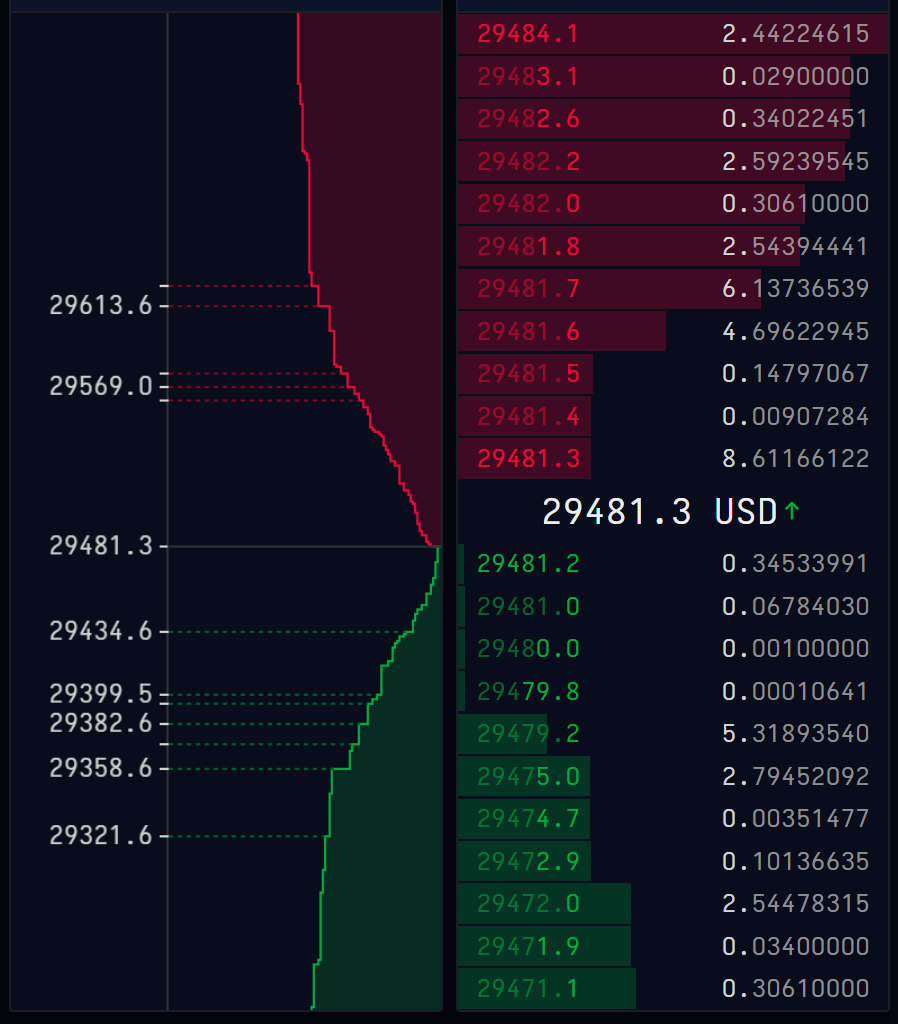
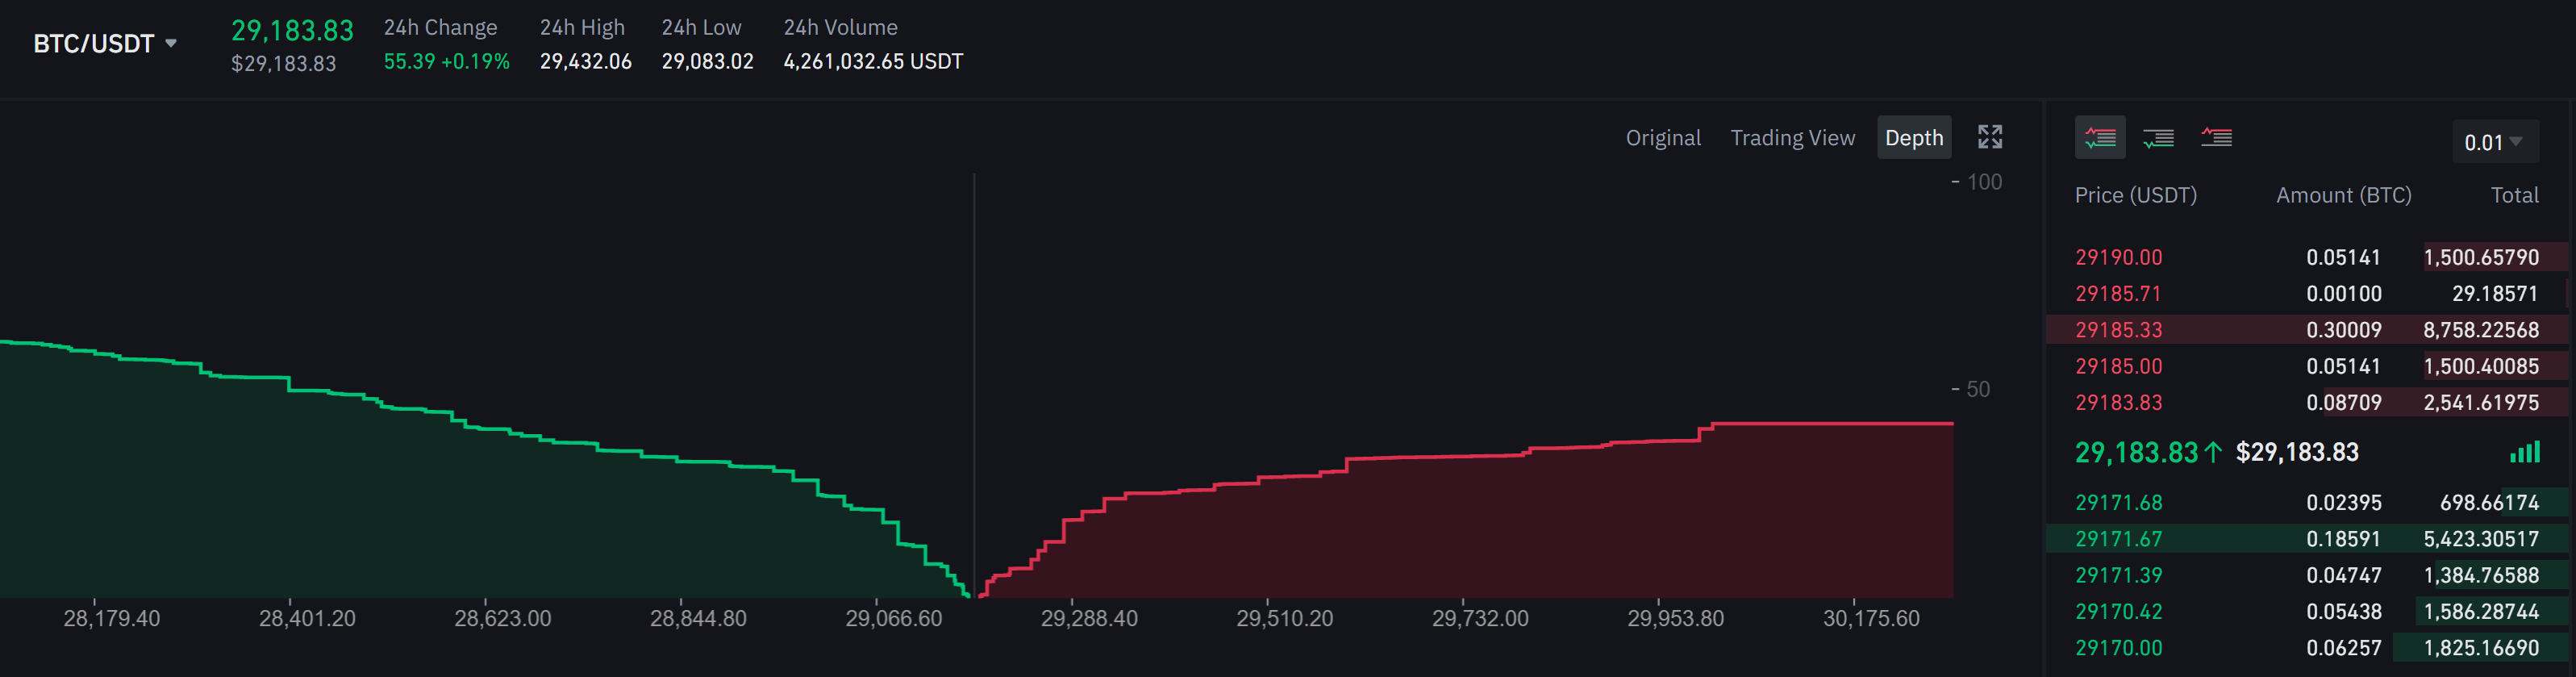
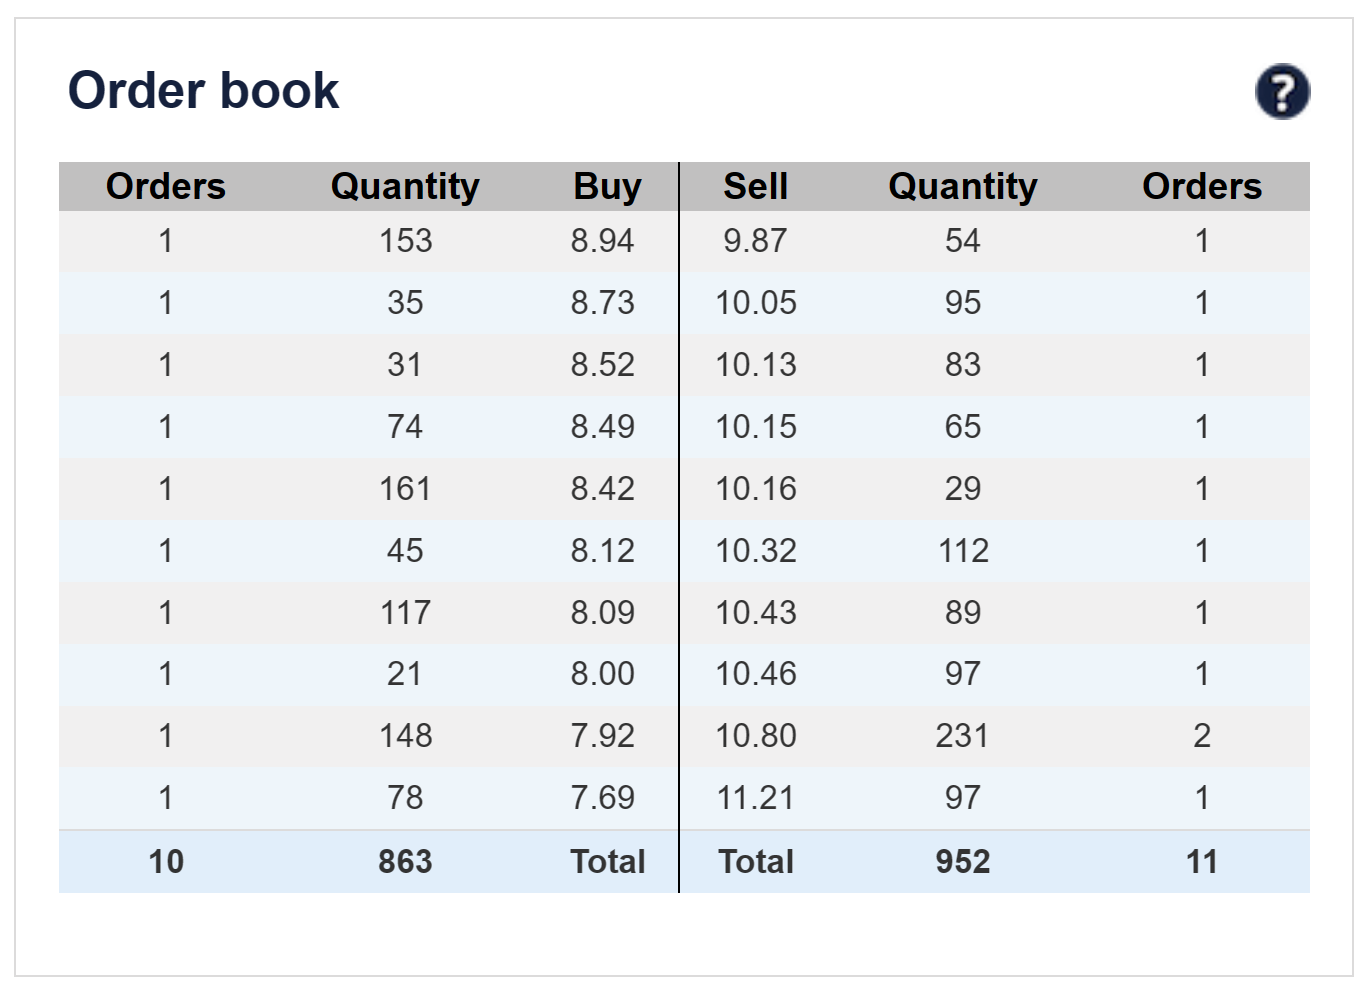
A large portion of my daily activity involves corporate and provincial bonds that do not trade on a liquid exchange. There is no visible order book. There is no Bloomberg mid-price that everyone agrees on. There is a fragmented OTC market where each dealer forms their own view of value.
When a client calls and asks for a bid or offer on one of these bonds, I have to produce a price — quickly, without full information. I know what I think the bond is worth. What I do not know is whether the client is a buyer or a seller.
This asymmetry is at the heart of market-making in illiquid securities. If I quote too tight a spread, I may find myself on the wrong side of a pre-arranged trade. A client may call five dealers simultaneously, collect our offers, and hit the best one — while already having a buyer on the other side paying more than my offer. In that case, I have sold bonds below what the market was willing to pay, and the client has effectively traded through me.
I use this scenario in class regularly. Students are always surprised. They assume that being a good trader means knowing what something is worth. It does — but it also means understanding the information game you are playing with the person on the other side of the phone.
Then there is the moment that every trader knows: you have priced the trade, the client has everything they need to decide, and then — nothing. They go to lunch. They are in a meeting. They are closing another trade. You are sitting there holding a price in a moving market, watching the bid shift while you wait for a response that may or may not come. No simulation I have seen fully replicates the specific discomfort of that moment.
Primary market underwriting: when commitment meets reality
Beyond secondary market activity, I participate as an underwriter in primary bond issuances for Argentine corporates, as part of the underwriting syndicate organized around each deal. This is a different kind of principal risk — one that is taken on before the bond even exists.
When a company decides to issue a bond, I commit to underwriting a portion of the deal. This is a real financial commitment: if investor demand is insufficient to cover the full issuance, I absorb the remainder onto my own book. In Argentina, primary markets typically use a Dutch auction format — investors submit bids specifying the coupon rate they are willing to accept and the quantity they want. The issuer then sets a clearing rate that satisfies the target issuance amount.
On auction day, I am simultaneously placing bonds with my own client base, managing my underwriting exposure, and monitoring where the clearing rate is likely to land. If I have covered my commitment with investor demand, I am in good shape. If not, the unsold portion of my underwriting commitment ends up on my balance sheet at the clearing rate — and I work that position off over the following days or weeks, offering it into a market that may or may not be ready to absorb it.
This is textbook principal risk. It is also something that very few students have any mental model for before entering the industry.
FX mismatches and capital controls: the Argentine laboratory
Argentina has operated with capital controls for years. At their peak, the gap between the official exchange rate and the blue-chip swap rate — a market-implied rate derived from the implicit FX embedded in cross-market bond transactions — reached several hundred percent. Today the gap has narrowed significantly, but the structure remains.
This creates situations that no standard finance course addresses. A bond denominated in dollars can be bought and sold in different currencies. If I buy a USD bond paying dollars and sell it against pesos, I receive pesos for an asset I paid for in dollars. I now have a currency mismatch on my book: I am effectively long pesos, short dollars. I can hedge that exposure immediately by buying back the dollars in the FX market, or — if I have a view that the implied exchange rate will move in my favor — I can hold the position and let it run.
The decision is not mechanical. It depends on my reading of the regulatory environment, the direction of the blue-chip swap rate, and how much currency risk I am willing to carry on the book at that moment. This is daily life on the desk. And it is very difficult to teach without the context that produces it.
When models break: the lesson of negative oil prices
In April 2020, front-month WTI crude oil futures briefly traded at negative prices. Physical storage constraints had overwhelmed the market’s mechanics, and sellers were willing to pay counterparties to take delivery of crude oil they had nowhere to store.
I watched it happen from the desk in real time. What struck me was not the price itself — it was the reaction across the industry. Many traders assumed it was a glitch. Some platforms were simply not built to display or process negative prices, and brokers whose systems could not show the quotes found themselves liable to clients who could not see — let alone act on — what was happening in the market. Several firms had to absorb losses because their technology had never contemplated the possibility.
I use this episode as an opening in class — not to explain futures mechanics, which students can read in any textbook — but to ask a different question: what do you do when the model produces an answer that the real world seems to reject? What is your decision framework when your screen shows something that looks impossible? The answer is that you need to understand the why behind the price before you can act on it. That understanding is not something you can look up in real time. Either you have built it, or you have not.
The most important rule on a trading desk
Every trader makes mistakes. A wrong-way position, a misread signal, a fat-finger entry. What separates good trading culture from bad is not the absence of errors — it is what happens in the first thirty seconds after one occurs.
The worst thing a trader can do is wait. Hiding a mistake, even briefly, turns a manageable problem into a serious one. A position that could have been closed at a small loss will compound. The bid-ask spread you avoided paying once will have widened by the time you are forced to act.
The most important rule on any trading desk is this: when you make a mistake, communicate it immediately. No fear of consequences should outweigh the cost of silence. A well-run desk creates an environment where immediate transparency is rewarded — because the alternative is invariably more expensive. This is not a financial concept. It is a cultural one. And it may be the most practically useful thing I can tell any student before they sit down at a real trading desk for the first time.
Argentina: the best trading school you never attended
With a World Cup recently concluded — and Argentina’s performance still fresh in everyone’s memory — there is a useful analogy worth making. Argentina’s best players did not all come through polished academies with perfect pitches and controlled conditions. Many learned on uneven surfaces, in chaotic environments, where improvisation and resilience were not optional. Those conditions, more often than not, produced technically complete and mentally durable players.
The same logic applies to trading in an environment like Argentina. Multiple asset classes, multiple yield curves, structural illiquidity, capital controls, and macroeconomic volatility — all simultaneously, all the time. Traders who come through this market and move to larger ones — Brazil, Mexico, or developed markets — typically find the transition smoother than expected. They have already navigated conditions that most traders in more liquid markets never face. When you learn to trade in the mud, the rest feels like solid ground.
Financial concepts related to this article
I present below four financial concepts central to my daily work as a trader in illiquid and emerging markets.
Principal trading and inventory risk
In principal trading, the broker-dealer buys or sells securities using its own capital, taking market risk onto its own balance sheet. This contrasts with agency trading, where the firm executes on behalf of a client and earns a fee, or with intermediation (riskless principal), where the firm matches both sides simultaneously and earns the bid-ask spread without holding inventory risk. The critical difference is time: in principal trading, the firm holds a position that may not be unwound immediately, and the longer it is held, the greater the market exposure.
Underwriting syndicate and book runner
In a primary bond issuance, several broker-dealers form an underwriting syndicate, each committing to place a portion of the deal with investors. The book runner is the lead of this syndicate — it manages the investor order book, coordinates pricing with the issuer, and oversees the allocation process. Other syndicate members, such as Petrini Valores in many Argentine corporate issuances, commit to their own underwriting tranche and are responsible for placing it with their client base. If a syndicate member cannot fully place its portion, the unsold bonds remain on its balance sheet at the clearing rate.
Dutch auction in primary bond markets
A Dutch auction is a price-discovery mechanism in which investors submit bids specifying both quantity and the coupon rate they are willing to accept. The issuer sets a single clearing rate that satisfies the target issuance amount. All successful bidders receive bonds at the clearing rate, regardless of their individual bids. This format is widely used in Argentine primary markets for corporate bond issuances.
Blue-chip swap rate and capital controls
In markets with capital controls, such as Argentina, the blue-chip swap rate (also known as the contado con liquidación or CCL rate) is an implied exchange rate embedded in cross-market bond transactions. It reflects the market’s assessment of currency value in the absence of free convertibility and can diverge significantly from the official rate. Managing positions across currencies in this environment requires an understanding of the regulatory framework and a constant read on the gap between official and market-implied rates.
Why should I be interested in this post?
If you are a finance student planning to work in sales and trading, fixed income, or any market-facing role, the situations described here are among the ones you will encounter earliest — and none of them are fully captured in a simulation or a pricing model.
The gap between finance education and market reality is not about knowledge. Most graduates know their bond math. The gap is about judgment: knowing how to act when information is incomplete, the counterparty is not responding, and the market is moving. Understanding how principal risk, illiquidity, and currency mismatches interact in real time is the difference between arriving prepared and arriving surprised.
Related posts on the SimTrade blog
▶ All posts about Professional experiences
▶ Abel ARAYA Inside the Markets COO Office at HSBC: Understanding How Trading Floors Are Managed
▶ David GONZALEZ Discovering the Secrets of a Bank Trading Room
▶ Mickael RUFFIN My Internship Experience as a Structured Finance Analyst at Société Générale
▶ All posts about Financial techniques
Useful resources
Academic research
Gkillas K. and Longin, F. (2018) Financial market activity under capital controls: lessons from extreme events, Economics Letters, 171, 10-13.
Martellini, L., Priaulet, P., Priaulet, S. (2003) Fixed-Income Securities: Valuation, Risk Management and Portfolio Strategies, John Wiley & Sons.
Hull, J. C. (2021) Options, Futures, and Other Derivatives, 11th edition, Pearson.
Business resources
Petrini Valores — Argentine broker-dealer specializing in fixed income, equities, derivatives, and financing.
FINRA Tools and Calculators — public source for US bond transaction data and pricing context.
About the author
This article was written in July 2026 by Isaac FAINSTEIN, Director at Petrini Valores and Visiting Lecturer at IESEG School of Management (Lille), where he has taught applied finance and trading courses for over 10 years.
▶ Discover all articles by Isaac FAINSTEIN.