VIX Futures and Options

Saral BINDAL

In this article, Saral BINDAL (Indian Institute of Technology Kharagpur, Metallurgical and Materials Engineering, 2024–2028; Research Assistant at ESSEC Business School) examines the characteristics, pricing, and settlement of VIX futures and options, along with their term structure and market microstructure.

Introduction

The Cboe Volatility Index (VIX) is a real-time measure of the market’s expectation of S&P 500 volatility over the next 30 days. It is calculated from the prices of S&P 500 Index (SPX) options and is expressed as an annualized percentage. The VIX is widely used as a measure of expected market volatility. For more details, see the previous posts on Implied Volatility and Option Prices and Cboe Volatility Index.

The VIX itself is an index and cannot be directly bought or sold. To allow market participants to trade volatility, Cboe introduced VIX derivatives such as futures and options. VIX futures were introduced in 2004, followed by VIX options in 2006. VIX futures provide linear exposure to changes in the market’s pricing of the future level of the VIX Index, while VIX options provide nonlinear exposure, allowing investors to take positions on changes in the VIX through a range of strike prices and maturities.

VIX Futures

A VIX futures contract is a standardized agreement whose value is linked to the VIX Index at a specified future date (expiration date of the contract). A VIX futures contract reflects the market’s pricing of the VIX Index at a specified future expiration date. Its price incorporates expectations about future volatility as well as risk premia and therefore should not necessarily be interpreted as an unbiased forecast of the future VIX level. VIX futures are traded on the Cboe Futures Exchange (CFE) under the symbol VX.

The pricing of VIX futures differs from that of conventional futures on a tradable stock or stock index. For a stock, the futures price can be related to the current spot price through a cash-and-carry arbitrage relationship, typically expressed as F0 = S0e(r-q)T, where r is the interest rate and q is the dividend yield. This relationship relies on the ability to buy and hold the underlying asset. In contrast, the VIX is an index and cannot itself be directly bought or held. Therefore, the VIX futures contract does not simply represent the current VIX value carried forward to a future date. Instead, it is a market price determined by participants’ expectations about future volatility (the expected value of VIX at maturity), together with the supply and demand for volatility exposure and the risk associated with holding the contract.

VIX futures have a $1,000 contract multiplier. Therefore, a one-point change in the price of a VIX futures contract corresponds to a $1,000 change in the value of one contract.

For example, if an investor buys one VIX futures contract at 20 and its price subsequently rises to 23, the change of 3 VIX points corresponds to a gain of:

VIX Futures Calculation Example

before transaction costs and any financing or opportunity costs associated with margin requirements.

Transaction Costs

Trading VIX derivatives involves both explicit (commissions and fees) and implicit (price impact) transaction costs. These affect the cost of entering and exiting positions and, ultimately, strategy performance. These costs can be broken down into the following components:

Brokerage commissions: Fees charged by brokers for executing trades.

Exchange transaction fees: Fees levied by the exchange on executed contracts.

Clearing and regulatory fees: Charges associated with clearing trades and applicable regulatory requirements.

Bid-ask spread: The difference between the best available ask and bid prices. Crossing the spread creates an immediate execution cost, which varies with market liquidity and volatility.

Slippage: The difference between the expected and actual execution prices. It can arise from market movements, order size and limited liquidity, particularly during periods of elevated volatility.

Margin Requirements and Costs

Unlike transaction costs, margin is not a fee paid to execute a trade. It is the collateral required to maintain a derivatives position, tying up capital that could otherwise be deployed elsewhere.

When opening a position, a trader must meet the initial margin requirement. As the position is marked to market, gains and losses affect the account balance. If losses reduce the balance below the maintenance margin requirement, additional funds may be needed to keep the position open.

The cost of margin therefore lies primarily in the capital committed to the trade and its associated opportunity cost. Traders may also incur financing costs if they borrow funds to meet margin requirements. These considerations become particularly important in VIX derivatives, where margin requirements can change with market conditions and increase during periods of elevated volatility.

Settlement of VIX Futures

VIX futures are cash-settled. Unlike futures on physical commodities, there is no delivery of an underlying asset at expiration because the VIX itself is an index and not a traded asset. Instead, the final profit or loss is determined using the final settlement value of the contract.

The final settlement value is determined on the morning of the expiration date, usually a Wednesday, through a Special Opening Quotation (SOQ) of the VIX Index. The SOQ is calculated using the VIX methodology applied to the relevant SPX options and determines the final settlement value of the VIX futures contract. As expiration approaches, the futures price converges toward this settlement value, reflecting the contract’s approaching expiration.

For a long VIX futures position, the profit or loss at settlement can be represented as:

VIX Futures Payoff Formula

For example, suppose an investor purchases one VX futures contract at 20. If the final settlement value is 28, the investor receives:

VIX Futures Calculation Example 2

Thus, the cash-settlement mechanism allows investors to gain or lose based on changes in the market’s pricing of volatility without owning the underlying SPX options used in the VIX calculation.

Figure 1 below illustrates the VIX Futures P&L at Settlement for both long and short positions as a function of the VIX value at maturity, for a VX futures contract bought (long) or sold (short) at a futures price of 20. The contract has a multiplier of $1,000 per index point and is cash-settled at maturity at the Special Opening Quotation (SOQ) of the VIX Index.

Figure 1. VIX Futures P&L at Settlement
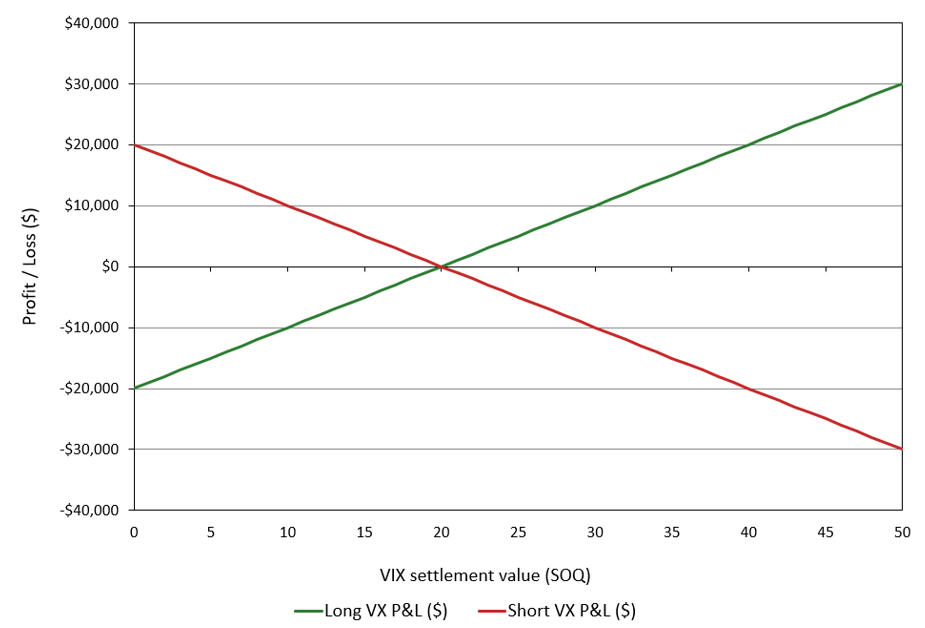
VIX Futures P&L at Settlement
Source: computation by the author.

VIX Futures Term Structure

A term structure exists because VIX futures contracts have different expiration dates and therefore reflect market expectations over different future periods. As the time to expiration changes, the information, uncertainty, and expected volatility associated with that future period also change, causing futures contracts with different maturities to trade at different prices.

An upward-sloping term structure indicates that VIX futures with later expiration dates are priced at higher VIX levels than contracts with nearer expirations. This is known as contango. By contrast, a downward-sloping term structure indicates that VIX futures with later expiration dates are priced at lower VIX levels than contracts with nearer expirations. This is known as backwardation.

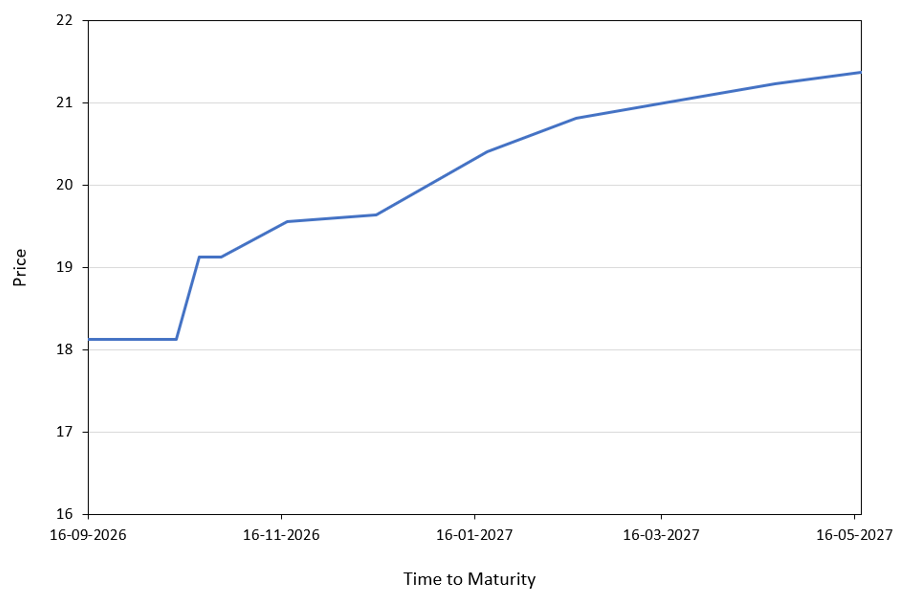
Figure 2 below illustrates the VIX Futures Term Structure using data obtained from Cboe, covering expiration dates from September 16, 2026, to May 18, 2027. The figure shows an upward-sloping curve, indicating a state of contango. This suggests that VIX futures contracts with later expiration dates are priced at higher levels than those with nearer expirations, indicating that the market assigns higher prices to longer-dated volatility exposure.

Figure 2. VIX Futures Term Structure (September 2026)
VIX Futures Term Structure
Source: computation by the author (Cboe data).

This term structure has implications for investors who maintain long positions in VIX futures. As contracts approach expiration, investors seeking to maintain their exposure must sell the expiring contracts and buy later-dated ones. In a contango market, longer-dated futures contracts trade at higher prices than nearer-dated contracts. Maintaining a long futures exposure therefore involves replacing expiring contracts with higher-priced contracts. Although contango can create a negative roll effect for long futures strategies, the realized return depends on subsequent changes in futures prices and the specific rolling strategy. For long positions, this can create a drag on returns as futures prices evolve toward settlement. However, the outcome depends on how futures prices change over time, rather than on contango alone. The relationship between trading demand, futures pricing and the term structure is discussed further in the market microstructure section below.

VIX Options

VIX options are exchange-traded derivatives that provide nonlinear exposure to the VIX settlement value at expiration. Their pricing is closely related to the corresponding VIX futures contract rather than solely to the current spot level of the VIX Index. VIX options are traded on Cboe Options Exchange and are based on the Cboe Volatility Index (VIX). Unlike individual stocks in stock options, the VIX is itself an index derived from prices of S&P 500 Index (SPX) options.

Cboe offers both monthly and weekly VIX option expirations, providing market participants with different maturities for expressing views on volatility.

Each VIX option contract has a $100 multiplier. Therefore, the dollar value of an option is obtained by multiplying its quoted premium by $100.

For example, if an investor buys one VIX call option with a strike price of 20 and the VIX settlement value is 15 at expiration, the option finishes 5 VIX points out-of-the-money. Consequently, the option expires worthless, with a payoff of zero (before accounting for the premium paid, transaction costs, and other applicable charges).

Settlement of VIX Options

VIX options are cash-settled. This means that there is no physical delivery of an underlying asset when an option is exercised. Instead, the value of an exercised option is determined using the final settlement value of the VIX.

The final settlement value is determined on the morning of the expiration date, usually a Wednesday through a Special Opening Quotation (SOQ) of the VIX Index. The SOQ is calculated using the VIX methodology applied to the relevant SPX options and is used to determine the final settlement value of the VIX option.

For a VIX call option, the settlement value is based on the amount by which the final VIX settlement value exceeds the strike price, and for a VIX put option, the settlement value is based on the amount by which the strike price exceeds the final VIX settlement value.

For a call option, this can be represented as:

VIX Call Option Payoff Formula

For a put option:

VIX Put Option Payoff Formula

For example, suppose an investor holds a VIX call option with a strike price of 20 and the final settlement value is 28. The option’s settlement value is:

VIX Options Calculation Example 2

If the final settlement value is below 20, the call expires without value.

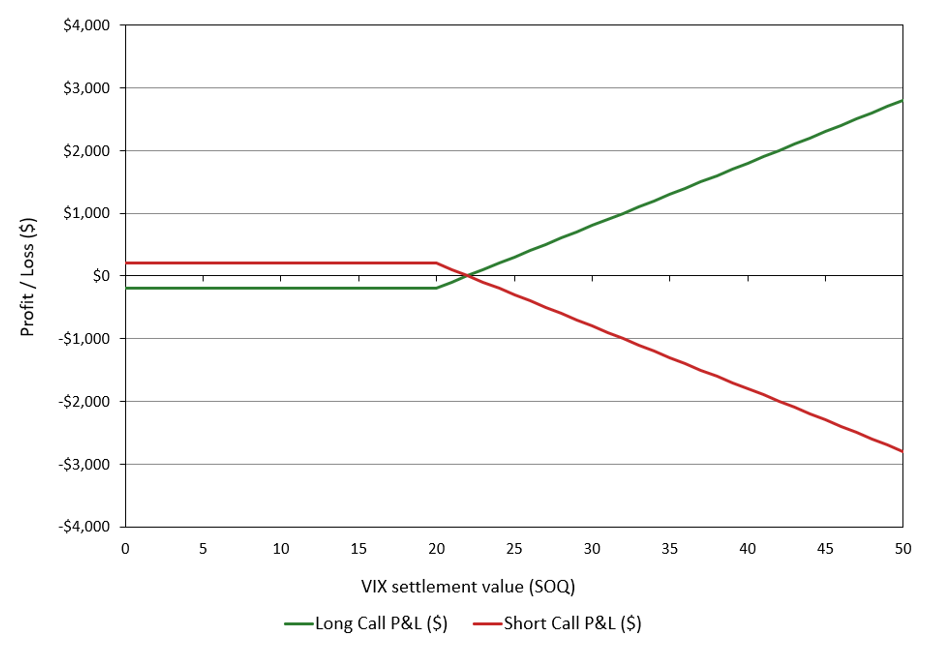
Figure 3 illustrates the P&L at expiration for long and short VIX call positions as a function of the VIX value at maturity. For a strike price of 20, a premium of 2.00 VIX points, and a $100 multiplier, the long call has a maximum loss of $200 when the VIX settles at or below 20 and unlimited gain above the breakeven level of 22. VIX options are cash-settled at expiration based on the VIX SOQ.

Figure 3. VIX Call Option P&L at Settlement
VIX Call Option P&L at Settlement
Source: computation by the author.

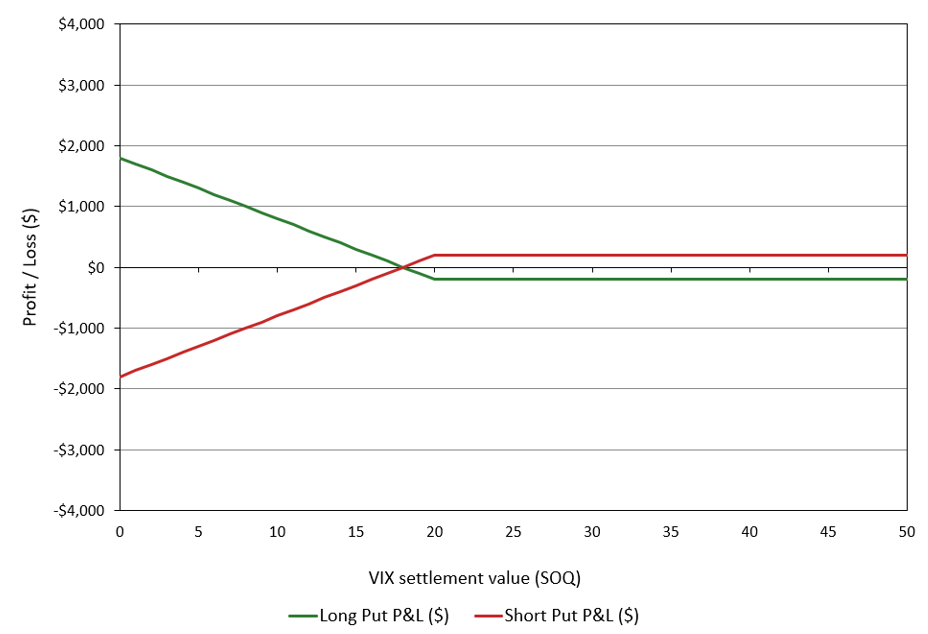
Figure 4 illustrates the P&L at expiration for long and short VIX put positions as a function of the VIX value at maturity. For a strike price of 20, a premium of 2.00 VIX points, and a $100 multiplier, the long put has a maximum loss of $200 when the VIX settles at or above 20 and becomes profitable below the breakeven level of 18. VIX options are cash-settled at expiration based on the VIX SOQ.

Figure 4. VIX Put Option P&L at Settlement
VIX Put Option P&L at Settlement
Source: computation by the author.

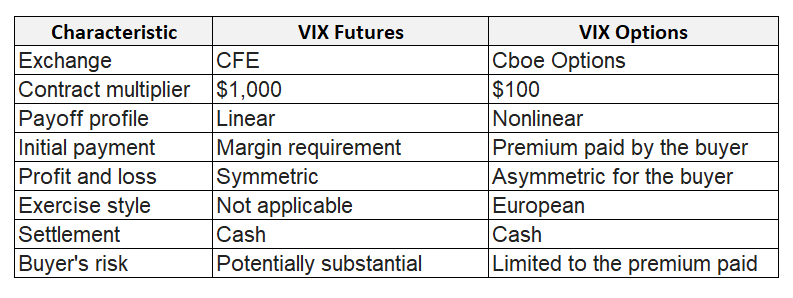
The table below summarizes the key characteristics of VIX futures and options contracts discussed above.

Figure 5. Key Characteristics of VIX Futures and VIX Options
 Key Characteristics of VIX Futures and VIX Options
Source: computation by the author.

Market Participants

VIX futures and options involve several types of market participants with different objectives.

Institutional investors and asset managers may use VIX derivatives to hedge portfolios against changes in market volatility.

Hedge funds and proprietary trading firms may use VIX futures and options to speculate on future movements in volatility or implement volatility-related strategies.

Market makers provide liquidity by quoting prices at which they are willing to buy and sell VIX derivatives, facilitating trading in these instruments.

Individual investors can also access VIX futures and options through eligible brokers, subject to account approval, margin requirements and regional availability. They may use these instruments to speculate on changes in expected market volatility or to hedge equity-market exposure. However, access to these products does not imply that they are suitable for all investors, given their leverage, complexity and potential for substantial losses.

Other market participants may combine VIX futures, VIX options, SPX options, and other volatility-related instruments to construct different trading and hedging strategies.

Market Microstructure

Prices in financial markets emerge from the interaction between buyers and sellers. In the conventional microeconomic framework, the demand curve represents the quantities buyers are willing to purchase at different prices, while the supply curve represents the quantities sellers are willing to offer. Their intersection determines the market equilibrium, where quantity demanded equals quantity supplied. In practice, trading mechanisms can take different forms like an electronic order book or block trading arrangements for large transactions. Demand and supply are influenced by market participants’ expectations of future prices (volatility for VIX futures and option markets).

VIX futures and options are traded on electronic markets where buyers and sellers submit orders. Market participants can use different order types, particularly market orders and limit orders. In the VIX futures market, limit orders are recorded in an electronic order book, which displays outstanding buy and sell orders along with their prices and quantities. Incoming orders are matched against existing orders according to the exchange’s matching rules. The highest price buyers are willing to pay is the best bid, while the lowest price sellers are willing to accept is the best ask. The difference between these two prices is the bid-ask spread, which represents an important component of transaction costs. Market depth refers to the quantities available for trading at different price levels. Together, the bid-ask spread and market depth provide useful indicators of market liquidity and the potential price impact of executing an order.

VIX options also trade electronically. Market makers provide quotes and may supply liquidity by taking the opposite side of a trade. Multi-leg strategies, such as vertical spreads, present an additional execution challenge because the trader needs to buy and sell options at a suitable combined price. Cboe’s Complex Order Book (COB) allows these orders to be matched as a combined position, while its Complex Order Auction (COA) gives eligible orders an opportunity for price improvement.

For large VIX futures positions, block trades offer an alternative to execution through the displayed order book. Eligible counterparties can negotiate a transaction privately and report it to the exchange under the applicable rules. This can help participants execute large orders without relying entirely on the liquidity available in the electronic market.

Trading prices also differ from the value used to settle contracts at expiration. VIX futures and options are cash-settled using the Special Opening Quotation (SOQ) of the VIX Index on the final settlement date. Unlike the regular VIX calculation, which uses bid-ask midpoints from SPX options across two expirations, the SOQ uses opening trade prices from a single SPX option expiration selected to provide the required 30-day measure. If a selected option has no opening trade price, its bid-ask midpoint is used instead. The resulting SOQ determines the final settlement value of the expiring derivatives.

Price Formation in VIX Futures

A VIX futures price reflects the price at which market participants are willing to trade exposure to the VIX Index at a specified future expiration. It is not necessarily an unbiased forecast of the VIX level at that date. The VIX measures expected 30-day volatility derived from S&P 500 index options, whereas a VIX futures contract provides exposure to the value of this index at its own expiration. Futures prices therefore reflect expectations about future volatility conditions, risk premia and the balance of buying and selling pressure.

The relationship between futures prices across expiration dates is described by the VIX futures term structure. In contango, longer-dated contracts trade above nearer-dated contracts; in backwardation, nearer-dated contracts trade above longer-dated ones. Contango is frequently observed in relatively calm markets, while backwardation can emerge during periods of market stress, when demand for near-term volatility exposure increases sharply. However, an upward-sloping futures curve does not necessarily imply that the market expects the spot VIX to rise. The curve also reflects risk premia and supply and demand for volatility exposure across different maturities.

Trading activity can influence both the overall level of futures prices and the relative pricing of contracts with different expiration dates. Mixon and Onur (2019) examine how non-dealer trading activity relates to VIX futures pricing. Their findings highlight the role of aggregate net demand in the overall level of futures prices and the relationship between trading activity in individual contracts and the shape of the futures curve. This is relevant to the roll effect, which describes the contribution to returns from replacing a futures contract approaching expiration with a later-dated contract. In contango, maintaining a long position typically involves selling a nearer-dated contract and buying a more expensive deferred contract. This can create a headwind for returns, although the realised outcome depends on subsequent futures-price movements and the investor’s rolling strategy.

Price Formation in VIX Options

The price of a VIX option depends on the possible VIX settlement values at expiration relative to the option’s strike price. A call option has a positive payoff when the final settlement value exceeds the strike, while a put option has a positive payoff when the settlement value falls below the strike. The option premium reflects the potential payoffs, the time remaining until expiration, interest rates and the market’s assessment of the distribution of possible settlement values.

VIX futures play an important role in standard VIX option valuation. Because the VIX Index itself is not directly tradable, VIX futures provide market-based information about volatility priced for specific future dates. The relevant futures price is an important input in option valuation, but it does not determine the option premium on its own. The strike price, time to expiration, interest rates and the distribution of possible settlement values also influence the premium.

Option prices vary across strike prices and expiration dates. Implied volatility, calculated from observed option premiums using an option-pricing model, provides a common measure for comparing these prices. The implied volatility skew describes variation in implied volatility across strike prices, while the term structure describes variation across option maturities. These patterns show how the market prices options with different payoff profiles and maturities.

Tong, Huang and Wang (2022) compare VIX option pricing models that use the VIX Index and VIX futures as state variables, meaning market variables used as model inputs. Their findings indicate that models incorporating VIX futures prices perform better empirically than models relying on the VIX Index alone and several alternative market variables. This highlights the importance of futures-market information in modelling and valuing standard VIX options.

Trading Activity and Market Liquidity

In this section, we examine the trading activity and relative scale of the S&P 500 and VIX derivatives markets by comparing the average daily volumes of their futures and options contracts. The data are sourced from CME Group and Cboe.

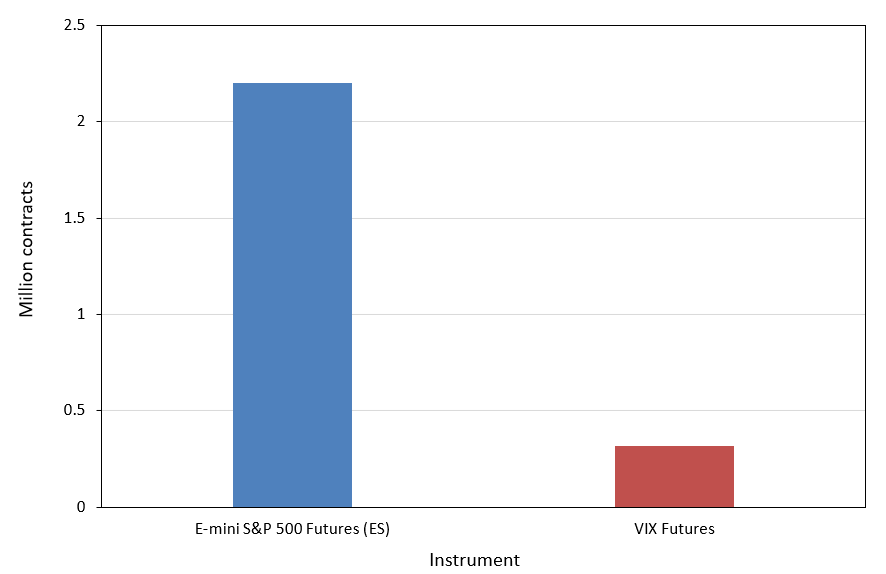
Figure 6 below compares the average daily trading volume of E-mini S&P 500 futures and VIX futures in March 2026. E-mini S&P 500 futures (ES) are standardized futures contracts on the S&P 500 Index, with a contract multiplier of $50 per index point. ES recorded an average daily volume of 2.2 million contracts (CME Group), compared with 0.318 million contracts for VIX futures (Cboe).

Figure 6. Average daily number of contracts of S&P 500 and VIX futures (March 2026)
Average Daily Number of Contracts of S&P 500 and VIX Futures, March 2026
Source: computation by the author (CME Group and Cboe data).

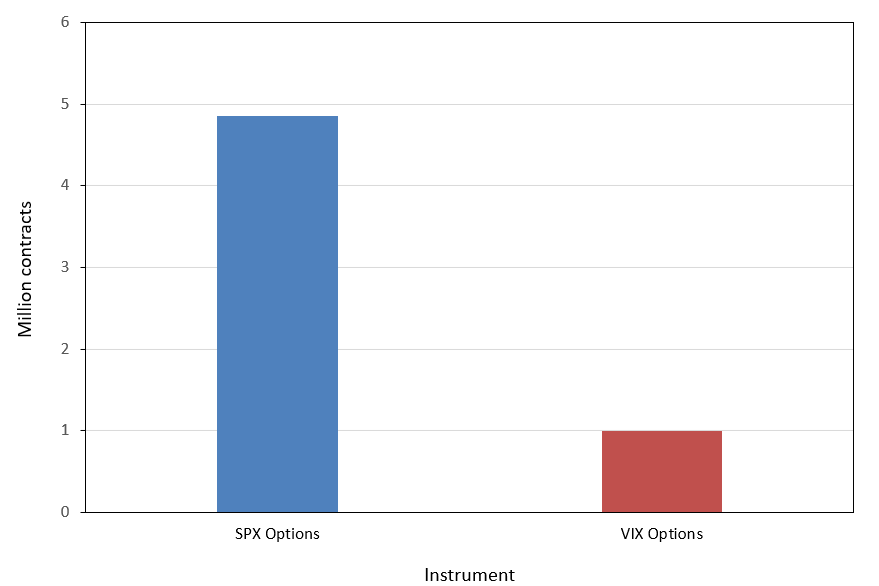
Figure 7 below compares the average daily number of contracts (a proxy for trading activity) of S&P 500 Index (SPX) options and VIX options during Q1 2026. SPX options recorded an average daily volume of 4.855 million contracts (Cboe), while VIX options recorded 0.994 million contracts (Cboe). The figures represent average daily volume across January, February, and March 2026.

Figure 7. Average daily number of contracts of S&P 500 and VIX options (Q1 2026)
Average Daily Number of Contracts of S&P 500 and VIX Options (Q1 2026)
Source: computation by the author (Cboe data).

The figures provide an indication of the relative trading activity in S&P 500 and VIX derivatives, but they should be interpreted with caution. Average daily trading volume, measured in contracts, differs from the monetary or notional value of transactions. A higher contract volume does not necessarily imply a proportionally larger market in terms of economic exposure or liquidity. Furthermore, trading volume alone does not fully capture liquidity, which also depends on bid-ask spreads, market depth (number of contracts available in the market at a given price), and execution costs (bid-ask spreads, commissions, and the price impact of a trade). Therefore, the figures are best interpreted as a comparison of trading activity rather than a direct measure of market size or relative liquidity.

Why should I be interested in this post?

VIX futures and options are important instruments for market participants to take positions on future volatility, hedge portfolios against changes in volatility, and manage exposure to market risk. Understanding these instruments therefore provides a practical perspective on the management of volatility risk in financial markets.

Related posts on the SimTrade blog

Futures

   ▶ Akshit GUPTA Futures Contract

   ▶ Alexandre VERLET Understanding financial derivatives: futures

Options

   ▶ Akshit GUPTA Options

   ▶ Jayati WALIA Black-Scholes-Merton Option Pricing Model

   ▶ Jayati WALIA Implied Volatility

   ▶ Saral BINDAL Implied Volatility and Option Prices

VIX

   ▶ Youssef LOURAOUI VIX index

   ▶ Saral BINDAL Cboe Volatility Index

   ▶ Saral BINDAL VIX Data and Statistical Properties

Useful resources

Business resources

CME Group (2026) March 2026 Trading Volume.

Cboe Global Markets (2026) March 2026 Monthly Volume Statistics.

Cboe Global Markets (2026) VIX Futures.

Cboe Global Markets (2026) VIX Options.

Academic references

Black F. (1976) The pricing of commodity contracts, Journal of Financial Economics, 3, 167-179.

Carr P. and L. Wu (2006) A tale of two indices. The Journal of Derivatives, 13(3), 13-29.

Mixon S. and Onur E. (2019) Derivatives Pricing When Supply and Demand Matter: Evidence from the Term Structure of VIX Futures. The Journal of Futures Markets, 39(9), 1035-1055.

Tong C., Huang Z. and Wang T. (2022) Do VIX Futures Contribute to the Valuation of VIX Options? The Journal of Futures Markets, 42(9), 1644-1664.

Whaley R. E. (2009) Understanding the VIX. The Journal of Portfolio Management, 35(3), 98-105.

Zhang J. E. and Y. Zhu (2006) VIX futures. Journal of Futures Markets, 26(6), 521-531.

About the author

The article was written in October 2026 by Saral BINDAL (Indian Institute of Technology Kharagpur, Metallurgical and Materials Engineering, 2024-2028 & Research assistant at ESSEC Business School). His interests include tracking geopolitical developments and analyzing their direct impact on macroeconomic factors such as inflation, trade balances, and currency volatility, with a focus on using data to quantify these global economic ripple effects.

Discover all posts by Saral BINDAL

Financial Consolidation Step by Step: What I Learned as an Intern at Evernex

Mathis HOUROU

In this article, Mathis HOUROU (ESSEC Business School, Global Bachelor in Business Administration (GBBA), 2022-2026) shares his experience as a consolidation intern at Evernex. He explains how a group builds its consolidated accounts, step by step.

About the company

Evernex is a global provider of third-party maintenance (TPM) for data center equipment. It maintains and repairs servers, storage and network devices, but it is not their manufacturer. Clients keep their hardware running for longer and pay less than with the support of the manufacturer. The company is based in Paris.

Logo of Evernex.
Logo of Evernex
Source: Evernex.

Evernex also manages spare parts, recycles equipment, erases data in a secure way and moves data centers. It offers rental and financing of IT hardware as well. In November 2024, 3i described a presence in more than 165 countries and more than 500,000 IT systems maintained.

The group has grown through acquisitions. The investment company 3i entered its capital in October 2019. Since then, Evernex has bought companies such as Storex in South Africa (2020), XSi in the United States (2022) and Ultra Support in the United Kingdom (2024). Ultra Support was the seventh acquisition since the investment of 3i. From an accounting point of view, each new company has its own ledger, its own currency and its own accounting habits. This is why consolidation matters a lot for this group.

Evernex IT maintenance.
Evernex IT maintenance
Source: Evernex.

My internship

I work in the consolidation team in Paris. My internship lasts six months and started in September 2026. The team produces the accounts of the group every month. The work starts with the closing of each subsidiary and ends with the figures shown to top management.

I knew consolidation from my courses at ESSEC Business School. In practice, it is different. The numbers do not come from one ledger. They come from many entities. My role is to check that they fit together.

My missions

My main mission is to follow the monthly closing of the subsidiaries. They are in several countries and on several continents. Each month, I check that their accounts are complete and consistent before they enter the group figures. It is the first control of the team.

I also reconcile intercompany balances. This means checking that two entities of the group record the same transaction in the same way. For example, one entity books an invoice in December and the other one books it in January. This creates a difference of a few thousand euros. I look for the cause and ask the local accountant to correct it.

I follow indicators such as DSO (Days Sales Outstanding), DPO (Days Payable Outstanding) and bad debt. Bad debt is the part of the client invoices that may never be paid. I take part in the IFRS restatements used to calculate the EBITDA of the group, and I review the P&L of the entities. I also prepare slides for the CFO and the COO, with a focus on the expenses part of the EBITDA.

Required skills and knowledge

You need solid accounting bases, especially debit and credit, and a good knowledge of IFRS. I use Excel every day to check and compare large amounts of data. Rigor matters, because a small error in one entity can change the group figures.

Communication matters too. I often write to accountants in other countries and time zones. My requests must be clear and polite, so that they can explain or correct a number quickly.

What I learned

The quality of the group accounts starts with the quality of each local closing. I also learned to look at a number from the point of view of the group. A small difference in one entity can become a real issue when you compare it with the other side of the transaction.

Financial concepts related to my internship

The main concept of this post is financial consolidation. It is the core of my daily work. I define it first. Then I follow the process step by step and explain the purpose of each step.

What is financial consolidation?

Financial consolidation combines the financial statements of several legal entities into one set of accounts. The group is treated as if it were a single company. According to the IFRS Foundation, IFRS 10 defines consolidated financial statements as the statements of a parent and its subsidiaries, presented as those of a single economic entity.

Why do we need it? The performance of a group is not the sum of the accounts of its entities. Take an example. Entity A invoices EUR 200,000 of maintenance services to Entity B. Both belong to the same group. A records EUR 200,000 of revenue. B records EUR 200,000 of costs. For the group, nothing happened with the outside world. The group only paid itself. Without correction, the revenue and the costs of the group are both overstated by EUR 200,000.

Two other problems must be solved. The entities can work in different currencies. They can also use different accounting rules. The consolidation process solves these three problems one after the other. It starts with one question: which entities are in the group? This is the consolidation scope. When Evernex acquired Ultra Support in November 2024, a new entity entered the scope with all its accounts.

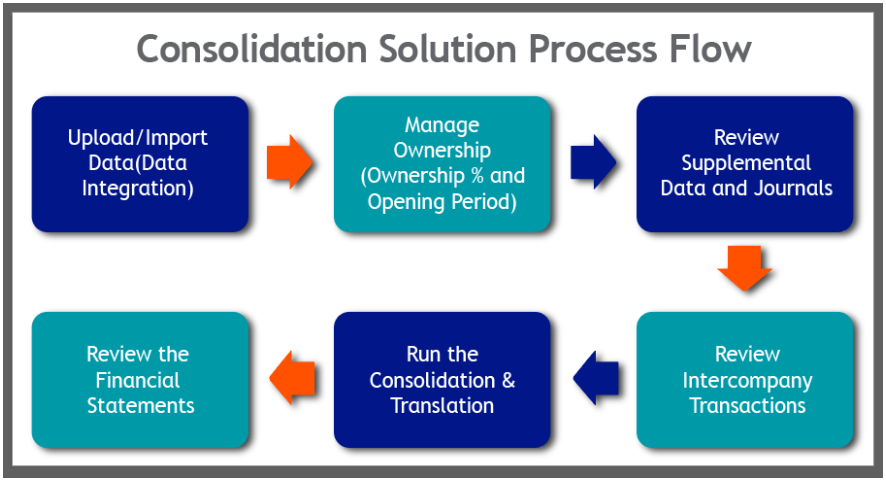
Example of a financial consolidation process flow.
Example of a financial consolidation process flow
Source: Mastek.

The steps below follow my own experience. They can differ a little from this example, because each group organizes its process in its own way.

Step 1: Local closing in each entity

Each subsidiary closes its own books first. The local team records its last entries, reconciles its bank and client accounts and produces a trial balance.

Purpose: the group accounts can only be as reliable as the local ones. An error that stays in this step will travel through the whole process.

Step 2: Reporting package and validation

Each entity sends its figures to the consolidation team in a standard reporting package. The local accounts are mapped to the chart of accounts of the group, so that a line such as revenue means the same thing everywhere. Checks flag missing data, accounts that do not balance and unusual changes from one month to the next.

Purpose: get comparable data and find the obvious errors early, while the local accountant can still fix them quickly.

Step 3: IFRS restatements

Local accounts often follow local rules. The group reports under IFRS. So the consolidation team adjusts the figures to the same standard. Leases are a good example. Under IFRS 16, a lessee records most leases on its balance sheet, as a right of use asset and a lease liability. Imagine that a subsidiary books a rent of EUR 120,000 per year as a simple expense in its local accounts. In the group accounts, this rent is replaced by a depreciation and an interest expense. The EBITDA of the group is then EUR 120,000 higher, because the rent is no longer in the operating expenses.

Purpose: measure all entities with the same rules, so that they can be added together and compared.

Step 4: Intercompany reconciliation

Before any elimination, the team checks that both sides of each internal transaction match. If entity A shows a receivable of EUR 200,000 on entity B, B must show a payable of EUR 200,000 to A. If B shows only EUR 195,000, the gap of EUR 5,000 has to be explained. The usual causes are an invoice booked in different months, a different exchange rate or a simple booking error.

Purpose: make the next steps possible, because an elimination works only if both sides agree. Handling intercompany activity is described as one of the most time consuming parts of the close (Workday). It is also where I spend a large part of my time as an intern.

Step 5: Currency translation

Subsidiaries report in their local currency. The group reports in one currency. Under IAS 21, assets and liabilities are translated at the closing rate. Income and expenses are translated at the rate of the transaction date, usually approximated by the average rate of the period. Equity items stay at historical rates.

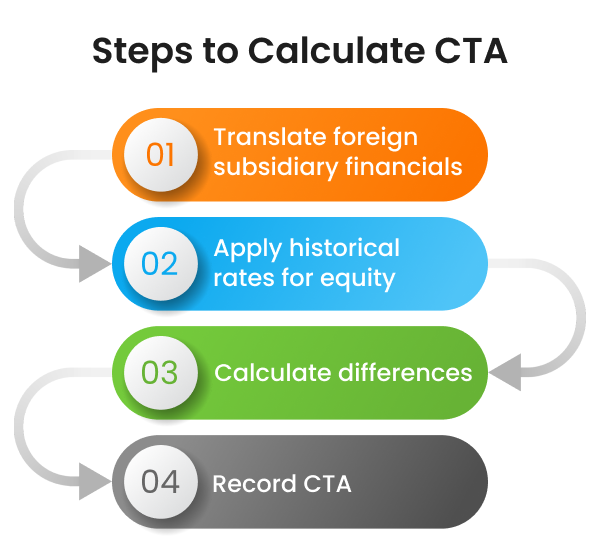
Take an example. A UK subsidiary has assets of GBP 1,000, liabilities of GBP 400 and equity of GBP 600. This equity is made of a share capital of GBP 500 and a profit of GBP 100 for the year. The closing rate is 1.20, the average rate is 1.15 and the historical rate is 1.10 euros per pound. Assets become EUR 1,200 and liabilities EUR 480, so the net assets are EUR 720. On the equity side, the share capital becomes EUR 550 and the profit EUR 115, which makes EUR 665. The balance sheet does not balance by itself. The missing EUR 55 is recorded in equity, in a line called the cumulative translation adjustment (CTA).

Steps to calculate the cumulative translation adjustment (CTA).
Steps to calculate the cumulative translation adjustment
Source: HighRadius.

Purpose: express everything in one currency, and keep the effect of exchange rates visible in equity instead of hiding it in the result of the year.

Step 6: Eliminations

Now the group removes everything that exists only inside the group. There are three main eliminations:

  • Internal revenue and costs: in our example, once the gap is corrected, the EUR 200,000 of revenue of A is cancelled against the EUR 200,000 of costs of B.
  • Internal receivables and payables: the receivable of A and the payable of B are removed from the balance sheet.
  • Investments and equity: the investment of the parent in a subsidiary is cancelled against the equity of this subsidiary. If the parent owns less than 100%, the share of the other shareholders is shown separately as non-controlling interests.

Purpose: avoid double counting, so that the group figures show only the transactions with the outside world.

Step 7: Review, analysis and reporting

The last step is the review of the consolidated balance sheet, income statement and cash flow statement. The team compares them with the budget and with the previous month. It explains the main changes and checks key indicators such as EBITDA or DSO. The figures are then presented to the management.

Purpose: make sure that every number can be explained. Consolidated accounts are a legal obligation. They are also the tool that managers use to take decisions.

Why should I be interested in this post?

If you want to work in asset management, equity research, audit or corporate finance, you will read consolidated accounts all the time. Knowing how they are built helps you understand what the numbers say. It explains, for example, why a strong dollar can change the reported results of a group, or why an acquisition makes the revenue jump.

This knowledge also helps if you look for an internship in consolidation, controlling or FP&A. These teams sit at the center of the information of the group and work with all the other departments. My advice to understand consolidation: follow one transaction from the local ledger to the group accounts.

Related posts on the SimTrade blog

Professional experiences

   ▶ All posts about Professional experiences

   ▶ Iris ORHAND My apprenticeship experience as a Junior Financial Auditor at EY

   ▶ Annie YEUNG My Audit Summer Internship experience at KPMG

Financial and accounting techniques

   ▶ Maxime PIOUX From IAS to IFRS: How International Accounting Standards Shape Financial Reporting

   ▶ Shruti CHAND Balance sheet

Useful resources

Evernex

Evernex Evernex website

3i 3i-backed Evernex continues its international growth with acquisition of Ultra Support

Evernex Evernex completes its first acquisition since 3i’s investment and expands its presence in Eastern and Southern Africa

Evernex IT Maintenance: Complete guide for business IT teams

IFRS

IFRS Foundation IFRS 10 Consolidated Financial Statements

IFRS Foundation IAS 21 The Effects of Changes in Foreign Exchange Rates

IFRS Foundation IFRS 16 Leases

Business resources

Mastek Oracle Financial Consolidation & Close Service (FCCS) Guide

HighRadius A Guide to Cumulative Translation Adjustment (CTA) with Examples

Workday Financial consolidation and close process guide

About the author

The article was written in October 2026 by Mathis HOUROU (ESSEC Business School, Global Bachelor in Business Administration (GBBA), 2022-2026).

   ▶ Discover all posts by Mathis HOUROU.

My experience as an M&A Analyst intern at Dilcap Invest

William LONGIN

In this article, William LONGIN (MSc Financial Mathematics at Queen Mary University of London, 2026-2027) shares his experience as an M&A Analyst intern at Dilcap Invest, an independent M&A advisory boutique.

Dilcap Invest

Dilcap Invest is an independent M&A Advisory Boutique founded in 2025 by Christophe AUGER. The firm is headquartered in the historic Hôtel de la Marine, overlooking Place de la Concorde in Paris. The firm focuses on European mid-market companies, primarily on transactions with values below €100 million, with particular expertise in proptech, technology, financial services, and services for senior citizens.

The firm combines three complementary activities: strategic and governance advisory services; corporate finance advisory on acquisitions, disposals, fundraising, and restructuring transactions and direct equity investments in growing companies. Its boutique structure allows for direct senior involvement and close interaction with clients throughout the transaction process.

Logo of Dilcap Invest
Dilcap Invest
Source: Dilcap Invest.

Christophe AUGER studied at Université Paris Dauphine and completed the financial analyst program of the Société Française des Analystes Financiers (SFAF). Building on experience in financial analysis, investment banking, corporate M&A, and entrepreneurship, he developed expertise in strategic and financial decision-making. Dilcap Invest’s boutique model provides clients with direct access to senior professionals and enables the firm to dedicate significant time and resources to a limited number of mandates.

My missions

During my internship, I worked on several dimensions of the M&A advisory process. My assignments combined financial analysis, valuation, market research, transaction screening, and business development. This gave me a practical view of how financial analysis is transformed into strategic recommendations and, eventually, into transaction opportunities.

Financial modeling and analysis

As an M&A analyst covering mid-cap companies, I built and maintained fully integrated three-statement financial models to analyze companies’ historical performance and forecast their future financial position. These models linked the income statement, balance sheet, and cash flow statement and incorporated operating assumptions, revenue projections, working capital, capital expenditure and depreciation, and debt schedules.

The models were typically structured into separate tabs for historical financial statements, assumptions, revenue build-up, operating projections, working capital, depreciation and capital expenditure, debt schedules, supporting calculations, valuation outputs, and sensitivity analyses. For example, during my internship I learned the importance of formatting with color coding (blue for inputs, black for formulas, green for links, red for checks) and learned many Excel short cuts allowing me to bypass the usage of a mouse.

Market research and transaction screening

During my internship I was brought to perform some market research on housing promoters based in various cities in France. As part of a mission that could potentially have a lot of upside and take advantage of a fragmented market. When it comes to complex capitalistic moves, Dilcap has a real expertise in understanding financial health of companies and competitive dynamics between actors in a market. Then the company contacted the presidents of each firm to discuss the projects. It showed the link between going from financials then narrowing it down to pre-deposition of CEO’s to pass the torch or be open to merging opportunities.

Comparable companies and transaction analysis

I also worked on valuation analysis using comparable companies and precedent transactions. I regularly used CFNews to monitor M&A activity and identify transactions relevant to the companies and sectors being analyzed. The platform enabled me to identify comparable transactions, analyze observed valuation multiples (EV/EBITDA and EV/Revenue), and benchmark them against prevailing market conditions to support assumptions used in valuation exercises. I also leveraged the database to analyze historical transactions, identify the most active acquirers, understand sector-specific dynamics, and track trends across the mid-cap market. In addition, I prepared weekly market briefings for the team, summarizing key announced transactions, market developments, and strategic insights that could impact ongoing mandates or business development opportunities.

The Répertoire.finance Project

I contributed to the development of repertoire.finance, an online platform connecting business owners and executives with independent M&A advisory firms. By working on repertoire.finance, I helped identify and onboard specialized advisory boutiques, structured their profiles by documenting sector expertise, transaction size, geographic coverage, and mandate focus, and contributed to improving the quality and consistency of the information available on the platform. The objective was to simplify the process of selecting an M&A advisor by providing business leaders with a comprehensive and transparent overview of the independent advisory landscape. This project strengthened my understanding of the French M&A advisory market, its key participants, and their respective positioning, while giving me valuable insight into the criteria companies use when selecting advisors for strategic transactions.

Concepts to master

EBITDA and Adjusted EBITDA

EBITDA (Earnings Before Interest, Taxes, Depreciation, and Amortization) is one of the most widely used financial metrics in mergers and acquisitions because it measures a company’s operating profitability independently of its financing structure, tax environment, and non-cash accounting charges. By excluding interest, taxes, depreciation, and amortization, EBITDA provides a standardized measure of operating performance that allows investors and advisors to compare companies across industries and capital structures. It also serves as the primary earnings metric used in valuation, with Enterprise Value typically expressed as a multiple of EBITDA (EV/EBITDA).

Adjusted EBITDA is a normalized version of EBITDA that excludes non-recurring, exceptional, or non-operating items that are not considered representative of the company’s ongoing performance. Typical adjustments include one-time legal expenses, restructuring costs, acquisition-related fees, litigation settlements, gains or losses from asset disposals, and, in founder-owned businesses, excess owner compensation or personal expenses. The objective is to present a sustainable earnings figure that more accurately reflects the company’s future operating capacity.

Adjusted EBITDA plays a critical role in M&A negotiations because it directly impacts valuation. Since enterprise value is commonly determined by applying an EV/EBITDA multiple, even small adjustments to EBITDA can significantly affect the purchase price. Consequently, sell-side advisors seek to identify and justify legitimate normalization adjustments that maximize value, while buy-side advisors carefully scrutinize each adjustment during financial due diligence to ensure it accurately reflects the company’s recurring operating performance.

Quality of Earnings (QoE)

Quality of Earnings (QoE) is a financial due diligence analysis that assesses whether a company’s reported earnings accurately reflect its sustainable and recurring operating performance. Rather than focusing solely on accounting profitability, a QoE review examines the underlying drivers of earnings to determine whether EBITDA is supported by normal business operations or distorted by one-time, non-recurring, or non-operating items. The objective is to provide potential buyers with a reliable measure of normalized earnings that can serve as the basis for valuation and purchase price negotiations.

A Quality of Earnings analysis typically includes a detailed review of revenue recognition policies, customer concentration, gross margins, operating expenses, working capital trends, seasonality, accounting policies, and cash conversion. It also identifies adjustments to EBITDA, such as restructuring costs, litigation expenses, acquisition-related fees, non-recurring gains or losses, and other exceptional items that should be excluded from normalized earnings. In addition, a QoE report evaluates whether historical financial performance is sustainable and highlights any financial risks or accounting issues that could impact future profitability.

In M&A transactions, the Quality of Earnings report is one of the most important components of financial due diligence. Buyers rely on it to validate the seller’s reported Adjusted EBITDA, assess the sustainability of future cash flows, and identify potential risks before completing an acquisition. Because enterprise value is typically based on Adjusted EBITDA, the conclusions of a QoE analysis can have a direct impact on valuation, purchase price negotiations, and transaction structure.

Information Memorandum

An Information Memorandum (IM), also referred to as a Confidential Information Memorandum (CIM), is a comprehensive marketing document prepared by the sell-side M&A advisor to present a company to potential buyers after they have signed a Non-Disclosure Agreement (NDA). Its purpose is to provide prospective acquirers with a detailed understanding of the business, its financial performance, competitive positioning, growth opportunities, and investment rationale, enabling them to evaluate the acquisition opportunity and prepare a non-binding offer.

An Information Memorandum typically includes an overview of the company and its history, descriptions of its products and services, market and industry analysis, customer and supplier relationships, management team, business strategy, operational model, historical financial statements, key performance indicators (KPIs), and management’s financial forecasts. It also highlights the company’s competitive advantages, growth drivers, and value creation opportunities while addressing key risks and market dynamics. Financial information is often presented with normalized or Adjusted EBITDA figures to facilitate valuation using comparable transaction and trading multiples.

The Information Memorandum is a central document in the M&A sale process and serves as the primary source of information for interested buyers during the initial stages of due diligence. It is designed to generate competitive interest, support management presentations, and provide sufficient information for bidders to submit indicative offers before entering a more detailed due diligence phase. A well-prepared IM balances transparency with commercial positioning, presenting the business accurately while emphasizing the key strengths and investment merits that underpin its valuation.

Why should you be interested in this post?

Whether you are preparing for investment banking interviews, starting an internship in M&A, or simply looking to strengthen your understanding of corporate finance, this guide brings together some of the most important concepts used in real transactions. It provides clear, practical explanations of key topics such as EBITDA, Adjusted EBITDA, Quality of Earnings (QoE), Information Memorandums, valuation multiples, and financial modeling, making complex M&A concepts accessible and directly applicable in a professional setting.

Word of conclusion

My internship as an M&A Analyst at Dilcap Invest provided me with invaluable exposure to the full lifecycle of middle-market M&A transactions. Through financial modeling, valuation analyses, market research, transaction screening, and the preparation of marketing materials, I developed both the technical expertise and commercial awareness required in investment banking. Working closely with experienced professionals allowed me to strengthen my analytical skills, attention to detail, and ability to communicate complex financial information in a clear and structured manner. Beyond the technical aspects, this experience deepened my understanding of the strategic considerations that drive acquisitions and disposals, while reinforcing my interest in corporate finance and mergers and acquisitions. It confirmed my ambition to pursue a career in investment banking, where I can continue to develop my financial and advisory skills while contributing to high-impact transactions.

Related posts on the SimTrade blog

Mergers & Acquisitions (M&A)

   ▶ All posts about M&A

   ▶ Ian DI MUZIO Valuation in Niche Sectors: Using Trading Comparables and Precedent Transactions When No Perfect Peers Exist

   ▶ Emanuele BAROLI Interest Rates and M&A: How Market Dynamics Shift When Rates Rise or Fall

   ▶ Anant JAIN FMCG Sector: M&A Trends and Its Implications

   ▶ Lilian BALLOIS M&A Strategies: Benefits and Challenges

   ▶ Suyue MA Analysis of synergy-based theories for M&A

Profesional expriences

   ▶ Ian DI MUZIO My Internship Experience at ISTA Italia as an In-House M&A Intern

   ▶ Basma ISSADIK My experience as an M&A Analyst Intern at Oaklins Atlas Capital

Useful resources

Dilcap Invest

Répertoire.finance

Interview with Christophe Auger, founder of Répertoire.finance

About the author

The article was written in October 2026 by William LONGIN (MSc Financial Mathematics at Queen Mary University of London, 2026-2027).

   ▶ Discover all posts by William LONGIN.