How to download financial data with R

Hadrien Puche

Any financial analysis starts with data. Whether you want to analyze a stock, build a portfolio, measure risk, create a valuation model or develop trading strategies, the first step is always the same: obtaining financial data.

You could download data manually from websites such as Yahoo! Finance or Investing.com, but this quickly becomes tedious and time-consuming. It also limits the amount of data you can work with.

R allows us to automate this process and retrieve large amounts of financial information in just a few lines of code.

In this article, Hadrien PUCHE (ESSEC Business School, Grande École Program, Master in Management, 2023-2027) will help you to:

  • Download historical stock prices and market indices with R
  • Explore, clean, and visualize xts time-series data
  • Compute basic statistics and historical distributions
  • Compare multiple securities
  • Build the foundation needed for more advanced financial analysis

But first, what financial data can we actually download?

Financial professionals use many different categories of data across individual assets as well as portfolios and funds.

Market data (Easily downloadable for free via Yahoo! Finance)

  • Individual asset prices (e.g., individual stocks, corporate bonds)
  • Portfolios and funds (e.g., ETFs, mutual funds)
  • Currency exchange rates (e.g., EUR/USD)
  • Market indices (e.g., S&P 500)

Macroeconomic data (Available via the St. Louis Fed – FRED)

  • Inflation and Consumer Price Index (CPI)
  • Interest rates and bond yields
  • GDP growth and unemployment

Not all data sources are freely available. Many professional investors rely on paid platforms such as Bloomberg or FactSet to access fundamental accounting data (revenue, cash flows) and alternative data (satellite imagery, sentiment). Fortunately, market prices and macroeconomic indicators can easily be accessed for free using R for research and learning purposes.

While you can download macroeconomic data using specialized packages like fredr, we will keep things simple in this article and focus purely on extracting and modeling market prices using the open-source quantmod package.

A step-by-step guide

Follow the next steps to download your first financial dataset with R.

Step 1: Instal the required packages

If you have not yet installed R, refer to the setup guide published earlier in this series to configure your execution environment (RStudio).

Once your environment is ready, install the required packages by running this in your console (you only need to do this once):

install.packages(c("quantmod", "PerformanceAnalytics"))

Here is what these packages do:

  • quantmod: Short for Quantitative Financial Modelling Framework, it is a widely used R package for downloading and analyzing financial market data, including data from Yahoo! Finance.
  • xts: Short for eXtensible Time Series, this package is automatically installed with quantmod. It provides data structures specifically designed for time-indexed data.
  • PerformanceAnalytics: A package of econometric functions used to calculate returns and risk metrics.

Step 2: Import your R packages

Most financial analysis scripts begin by loading the packages required for the analysis using the library() function.

Create a new R script file. You can also save it wherever you want. Paste the following script and run it (as a reminder, you need to select the code you want with your mouse before running it):

library(quantmod)
library(PerformanceAnalytics)

Step 3: Download your first data

To download financial data, we use ticker symbols, which identify securities or market instruments within a given exchange or data provider. For example, AAPL represents Apple.

We will use the getSymbols() function. By passing arguments to the function, we can customize the output. Setting auto.assign = FALSE assigns the dataset directly to a variable that we can name aapl_data.

Let us download daily data for Apple’s stock price over the last five years (from 01/01/2019 to 31/12/2024 at that time)t.

# Download historical Apple stock data
aapl_data <- getSymbols("AAPL", src = "yahoo", from = "2019-01-01", to = "2024-01-01", auto.assign = FALSE)
 
# Display the first 5 rows
head(aapl_data, 5)

You will obtain this xts table with the following columns:

  • Open: opening price at the beginning of the trading day
  • High: highest price during the trading day
  • Low: lowest price during the trading day
  • Close: closing price at the end of the trading day
  • Volume: transaction volume during the trading day
  • Adjusted: closing price adjusted for stock splits and dividends
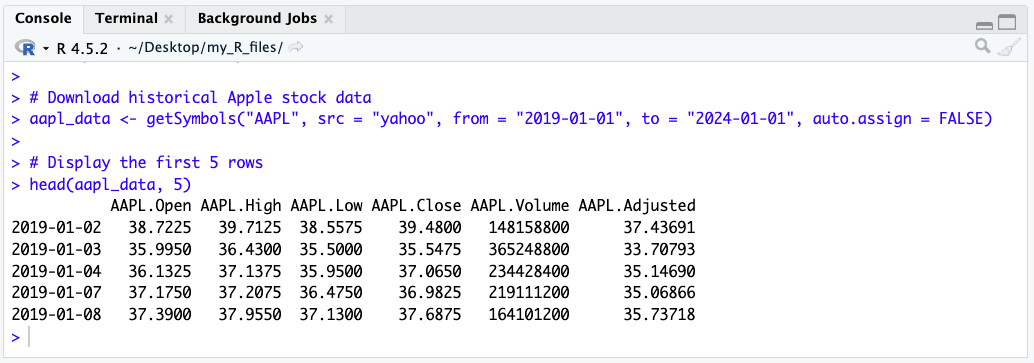
A screenshot from RStudio showing the output table of the getSymbols query

To keep things simple for this guide, we will focus strictly on the raw Close price. quantmod provides a convenient helper function called Cl() that instantly extracts just the closing price column from the dataset.

# Extract only the closing price
aapl_close <- Cl(aapl_data)
head(aapl_close, 3)

Add this code to your script, then highlight it with your mouse, and press run. Your RStudio should now display this:
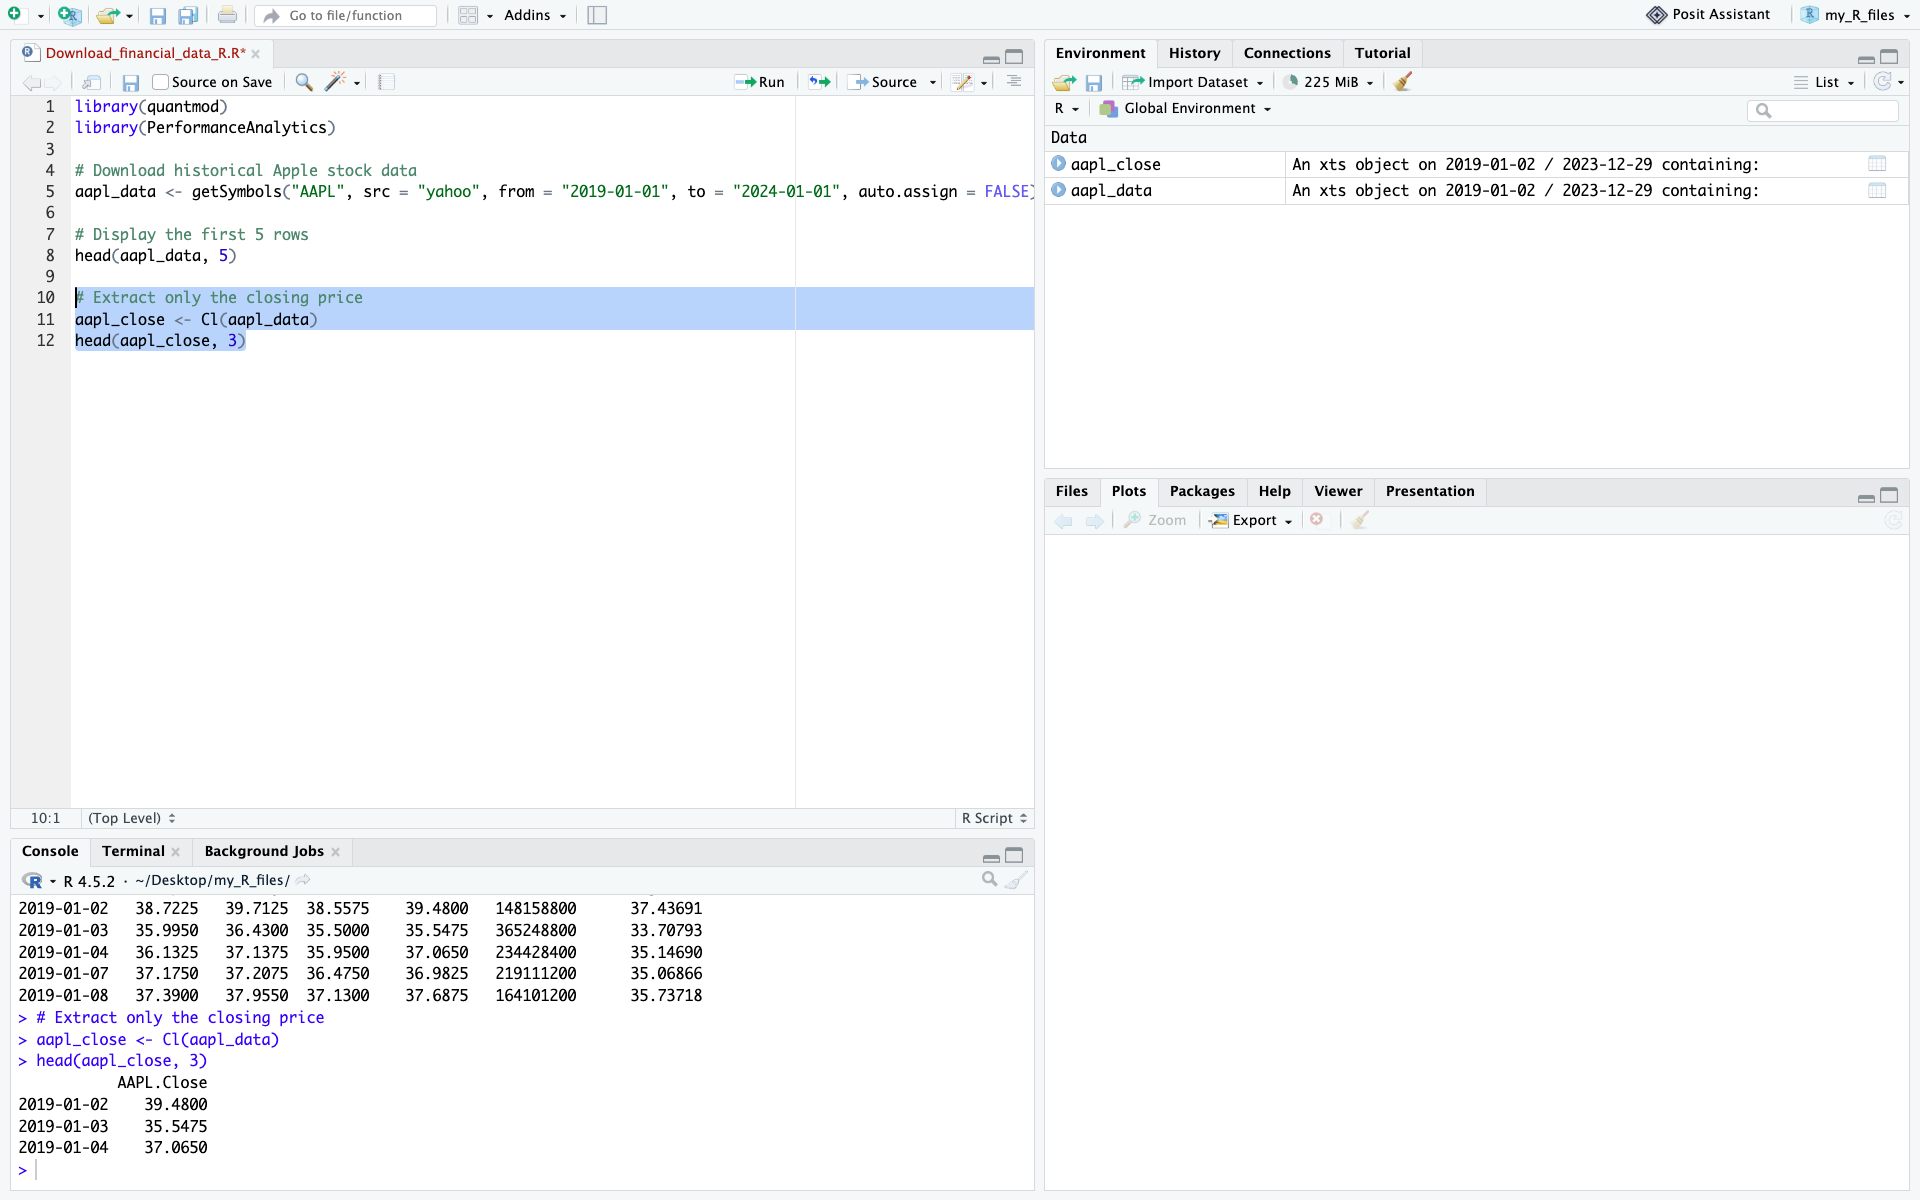
A screenshot from RStudio showing the new output

Step 4: Use more precise queries for historical context

As financial analysts, we routinely extract specific timeframes to understand how assets behave under macroeconomic stress. Because our data is stored as an xts object, R makes it incredibly easy to slice time-series data using date ranges.

For example, examining the COVID-19 market shock in early 2020 provides a useful illustration of extreme market volatility. Let’s isolate Apple’s stock specifically during the COVID-19 market shock and initial recovery (January to June 2020):

# Isolate the COVID-19 crash using xts date subsetting (YYYY-MM-DD/YYYY-MM-DD)
covid_crash <- aapl_close["2020-01-01/2020-06-30"]
 
# Plot the isolated data
plot(covid_crash, main = "AAPL Stock Price - COVID-19 Crash & Recovery", col = "red", lwd = 2)
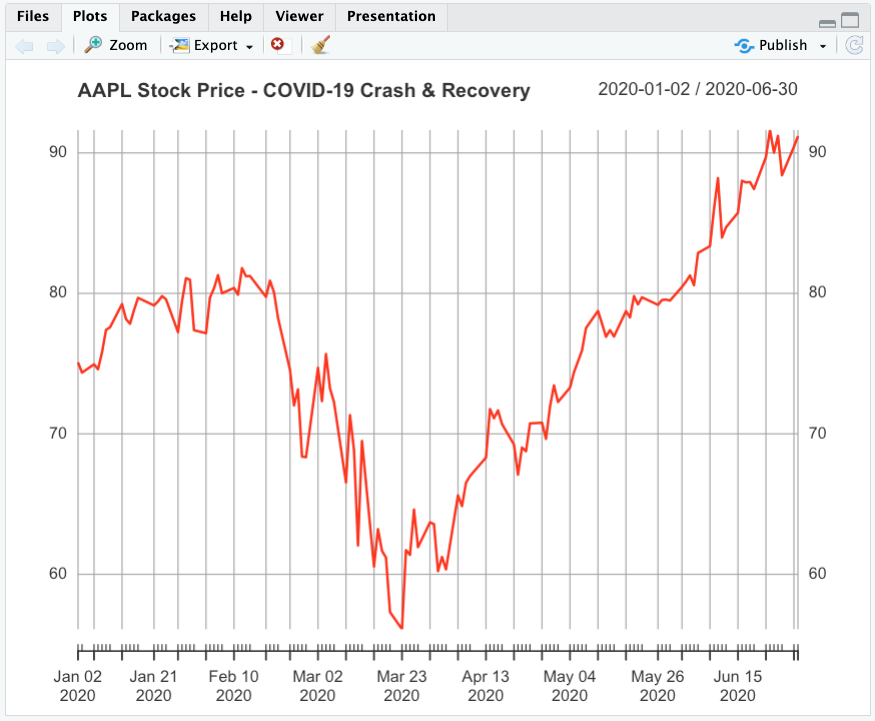
The output of the previous code cell showing the COVID crash

Step 5: Download the data for multiple stocks at the same time

Downloading multiple stocks is necessary for financial analysis that often requires comparing securities, analyzing sectors, or building a portfolio. Instead of issuing separate requests and risking misaligned dates, we can fetch all tickers at once.

Let’s download the data for six of the largest US banks: JPMorgan Chase, Bank of America, Wells Fargo, Citigroup, Goldman Sachs, and Morgan Stanley. Analyzing this sector is a classic way to measure the impact of interest rates on the broader economy.

# Define the major US bank tickers
bank_tickers <- c("JPM", "BAC", "WFC", "C", "GS", "MS")
 
# Download data into the global environment
getSymbols(bank_tickers, src = "yahoo", from = "2019-01-01", to = "2024-01-01")
 
# Extract only the closing prices and merge them into a single matrix
bank_prices <- merge(Cl(JPM), Cl(BAC), Cl(WFC), Cl(C), Cl(GS), Cl(MS))
 
head(bank_prices, 3)

The result is an xts object in which each column represents a stock and each row corresponds to a trading date.
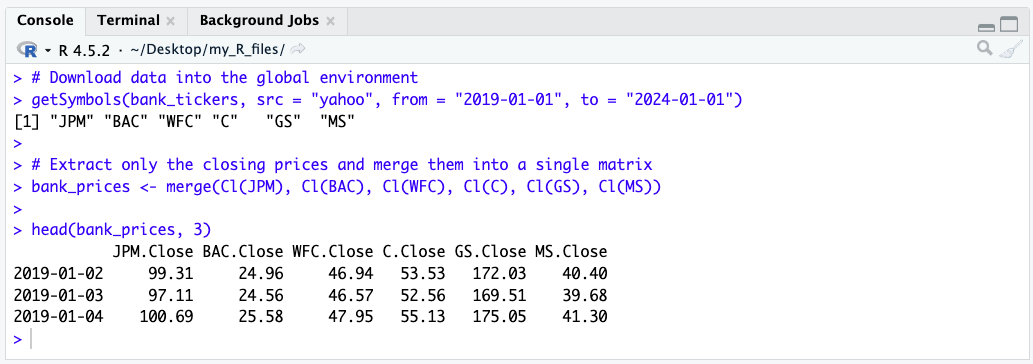
Screenshot of the output of the previous cell showing the US Banks matrix

This table format is ideal for portfolio analysis and benchmarking. To save it for external use, you can export it as a CSV file:

# Save the data frame as a CSV file
write.csv(as.data.frame(bank_prices), file = "us_banks_data.csv")

Now that you have successfully downloaded your financial data, let’s see how you can clean it and then use it.

Inspecting and cleaning the dataset

Financial datasets may contain missing values (NA) for various reasons, including trading suspensions, differences in trading calendars, listing dates, or data-provider issues. Missing observations should be identified before computing returns or risk measures, as they may affect subsequent calculations. For this introductory example, we simply remove rows containing missing values using na.omit(). In applied financial analysis, however, the appropriate treatment depends on the source of the missing data and the objective of the analysis.

In R, we can easily remove any rows containing missing data using the na.omit() function.

# Check for missing values (returns the total count)
sum(is.na(aapl_close))

# Clean missing values by dropping rows with NAs
aapl_close <- na.omit(aapl_close)

# View the last few rows of the cleaned data
tail(aapl_close, 5)
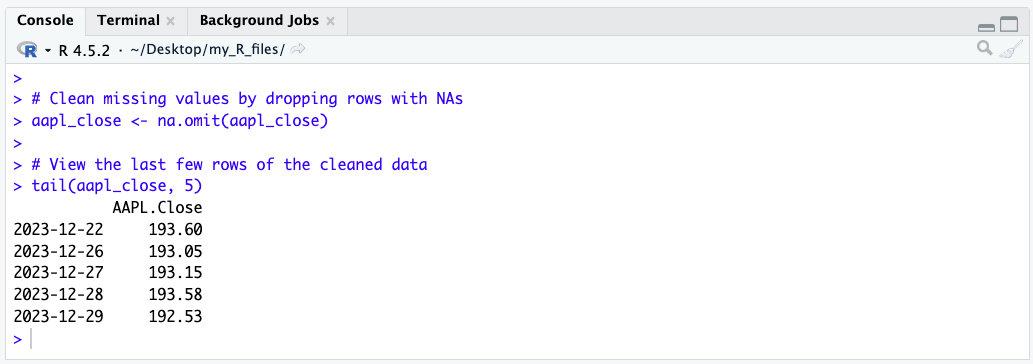
A screenshot from RStudio showing the output of the tail function

Vizualizing your data

Let’s create our first chart to visualize the evolution of Apple’s stock price using the chartSeries() function, which is built specifically for financial time series.

chartSeries(aapl_close, 
            name = "Apple Stock Price", 
            theme = chartTheme("white"), 
            TA = NULL) # TA = NULL removes technical indicators for a clean chart
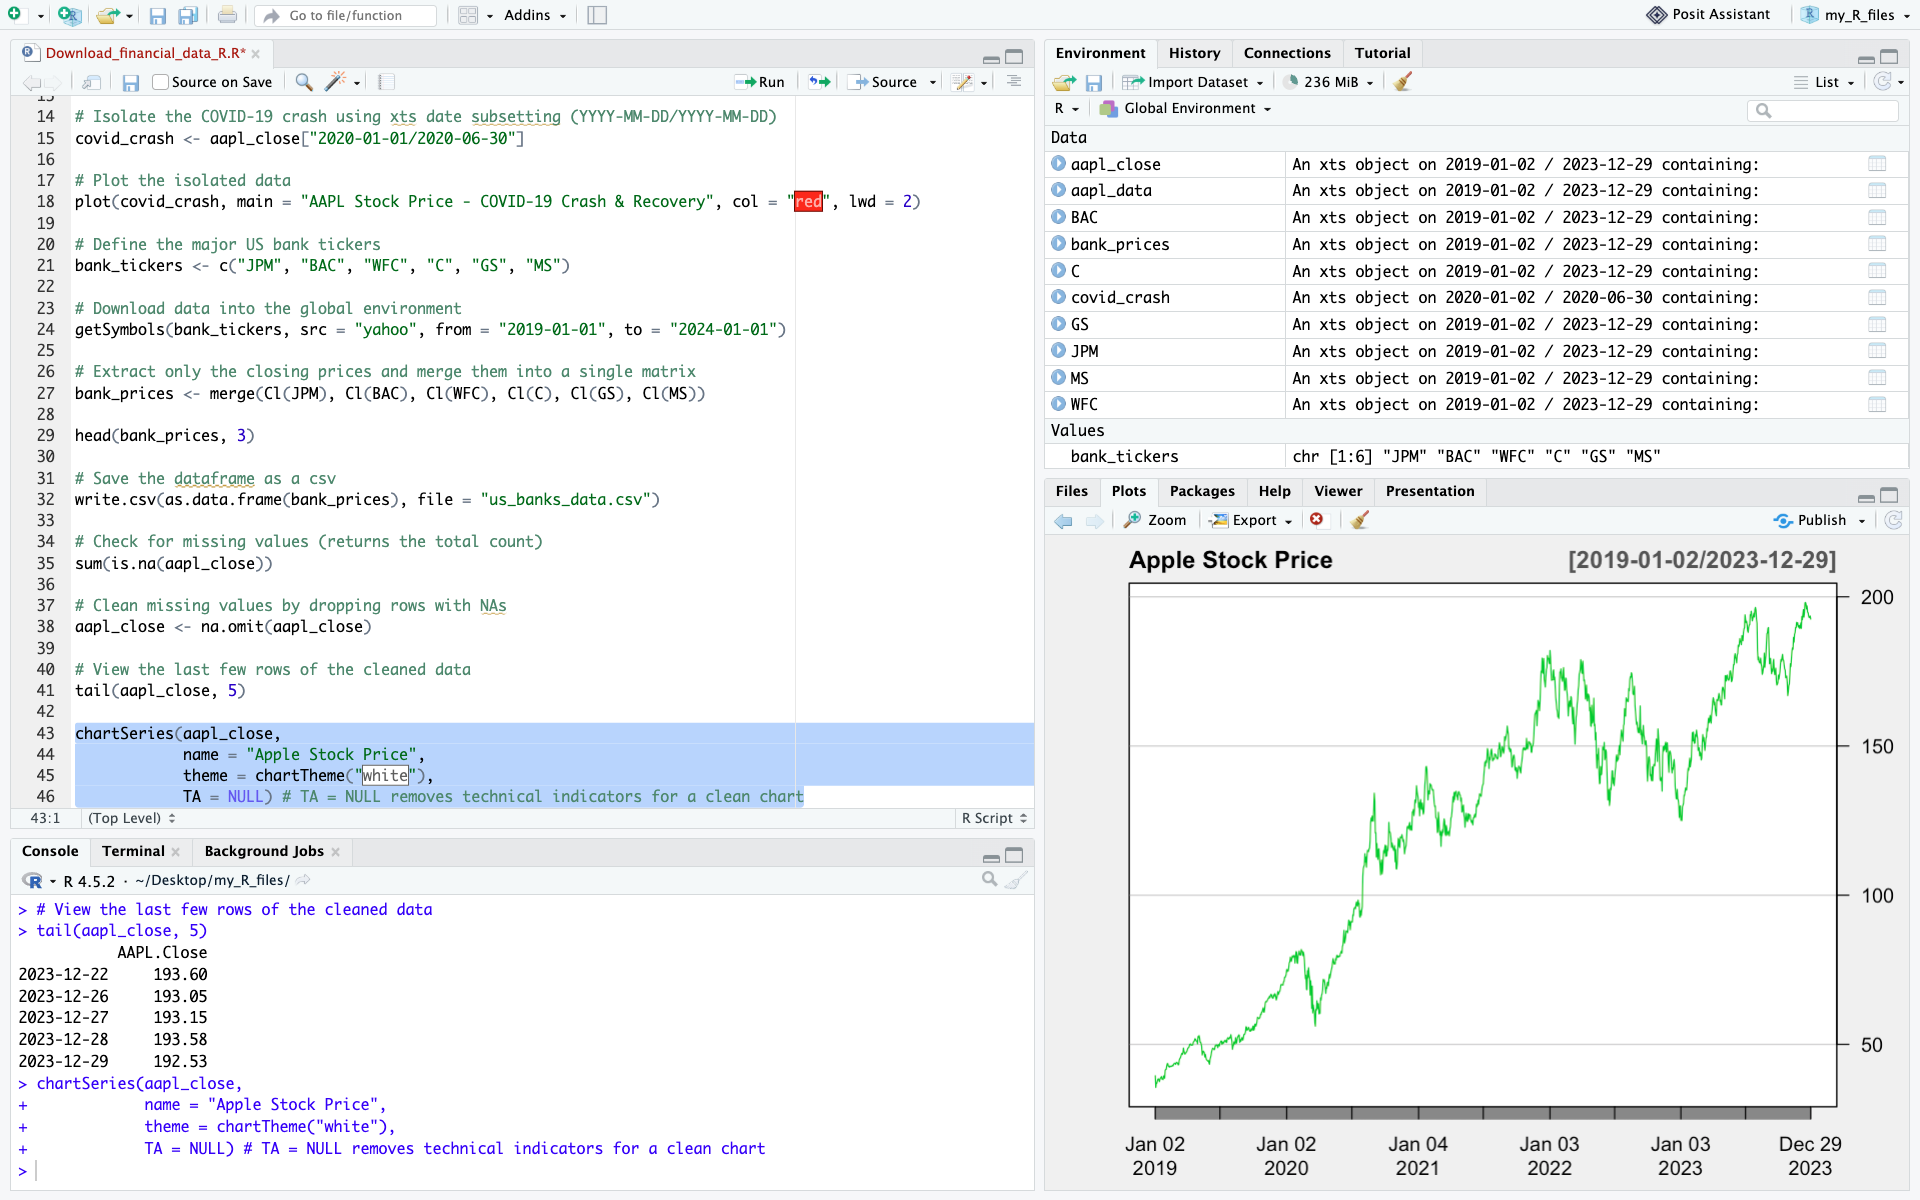
A screenshot of RStudio with the stock price visualization chart output

We have now:

  • Downloaded market data from Yahoo! Finance
  • Extracted the closing price and cleaned the data
  • Created a time-series plot to visualize stock prices

These core steps form the basis of empirical financial research and quantitative models.

Computing basic statistics and historical distributions

To evaluate stock performance and risk, we compute basic descriptive statistics. First, we calculate daily returns using the Return.calculate() function from the PerformanceAnalytics package.

# Calculate daily percentage returns (and remove the first NA row)
aapl_returns <- Return.calculate(aapl_close)
aapl_returns <- na.omit(aapl_returns)
 
# Compute summary statistics
mean_return <- mean(aapl_returns)
volatility <- sd(aapl_returns)
skew <- skewness(aapl_returns)
kurt <- kurtosis(aapl_returns)

print(paste("Mean Daily Return:", round(mean_return, 5)))
print(paste("Daily Volatility (Std Dev):", round(volatility, 4)))

Plotting historical distributions

Histograms display the frequency distribution of daily returns, helping us inspect distribution symmetry and tail risks.

# Return distribution histogram
hist(aapl_returns, breaks = 50, col = "salmon", main = "Historical Daily Return Distribution", xlab = "Daily Return")
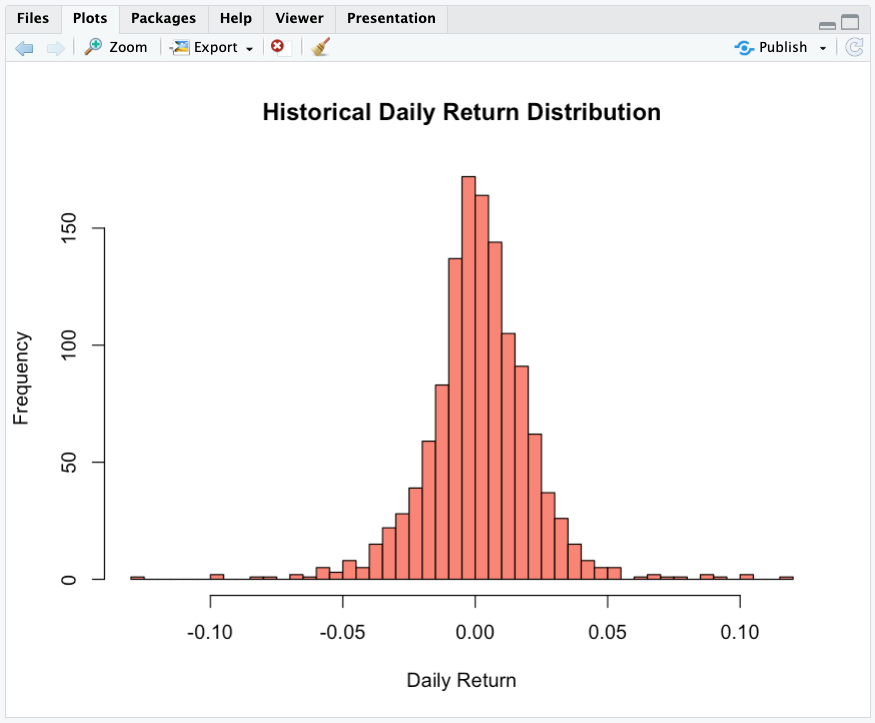
The output of the previous cell – distribution histogram

Normalizing stock prices and computing returns

All stocks have different nominal prices. If Tesla trades at $350 and Nvidia at $220, it does not mean that Tesla performed better. To establish an accurate comparison, we execute two fundamental computations:

  1. Price normalization: We normalize all historical time series to a base index of 100, ensuring a standardized starting point.
  2. Return calculation: We compute periodic returns to measure performance independently of the nominal price level.
# Clean any missing data
bank_prices <- na.omit(bank_prices)

# Harmonize prices to Base 100 (Divide every row by the first row, multiply by 100)
normalized <- sweep(bank_prices, MARGIN = 2, STATS = as.numeric(bank_prices[1,]), FUN = "/") * 100
 
# Plot the performance comparison
plot(normalized, legend.loc = "topleft", main = "Performance Comparison (Base = 100)", ylab = "Growth of $100")
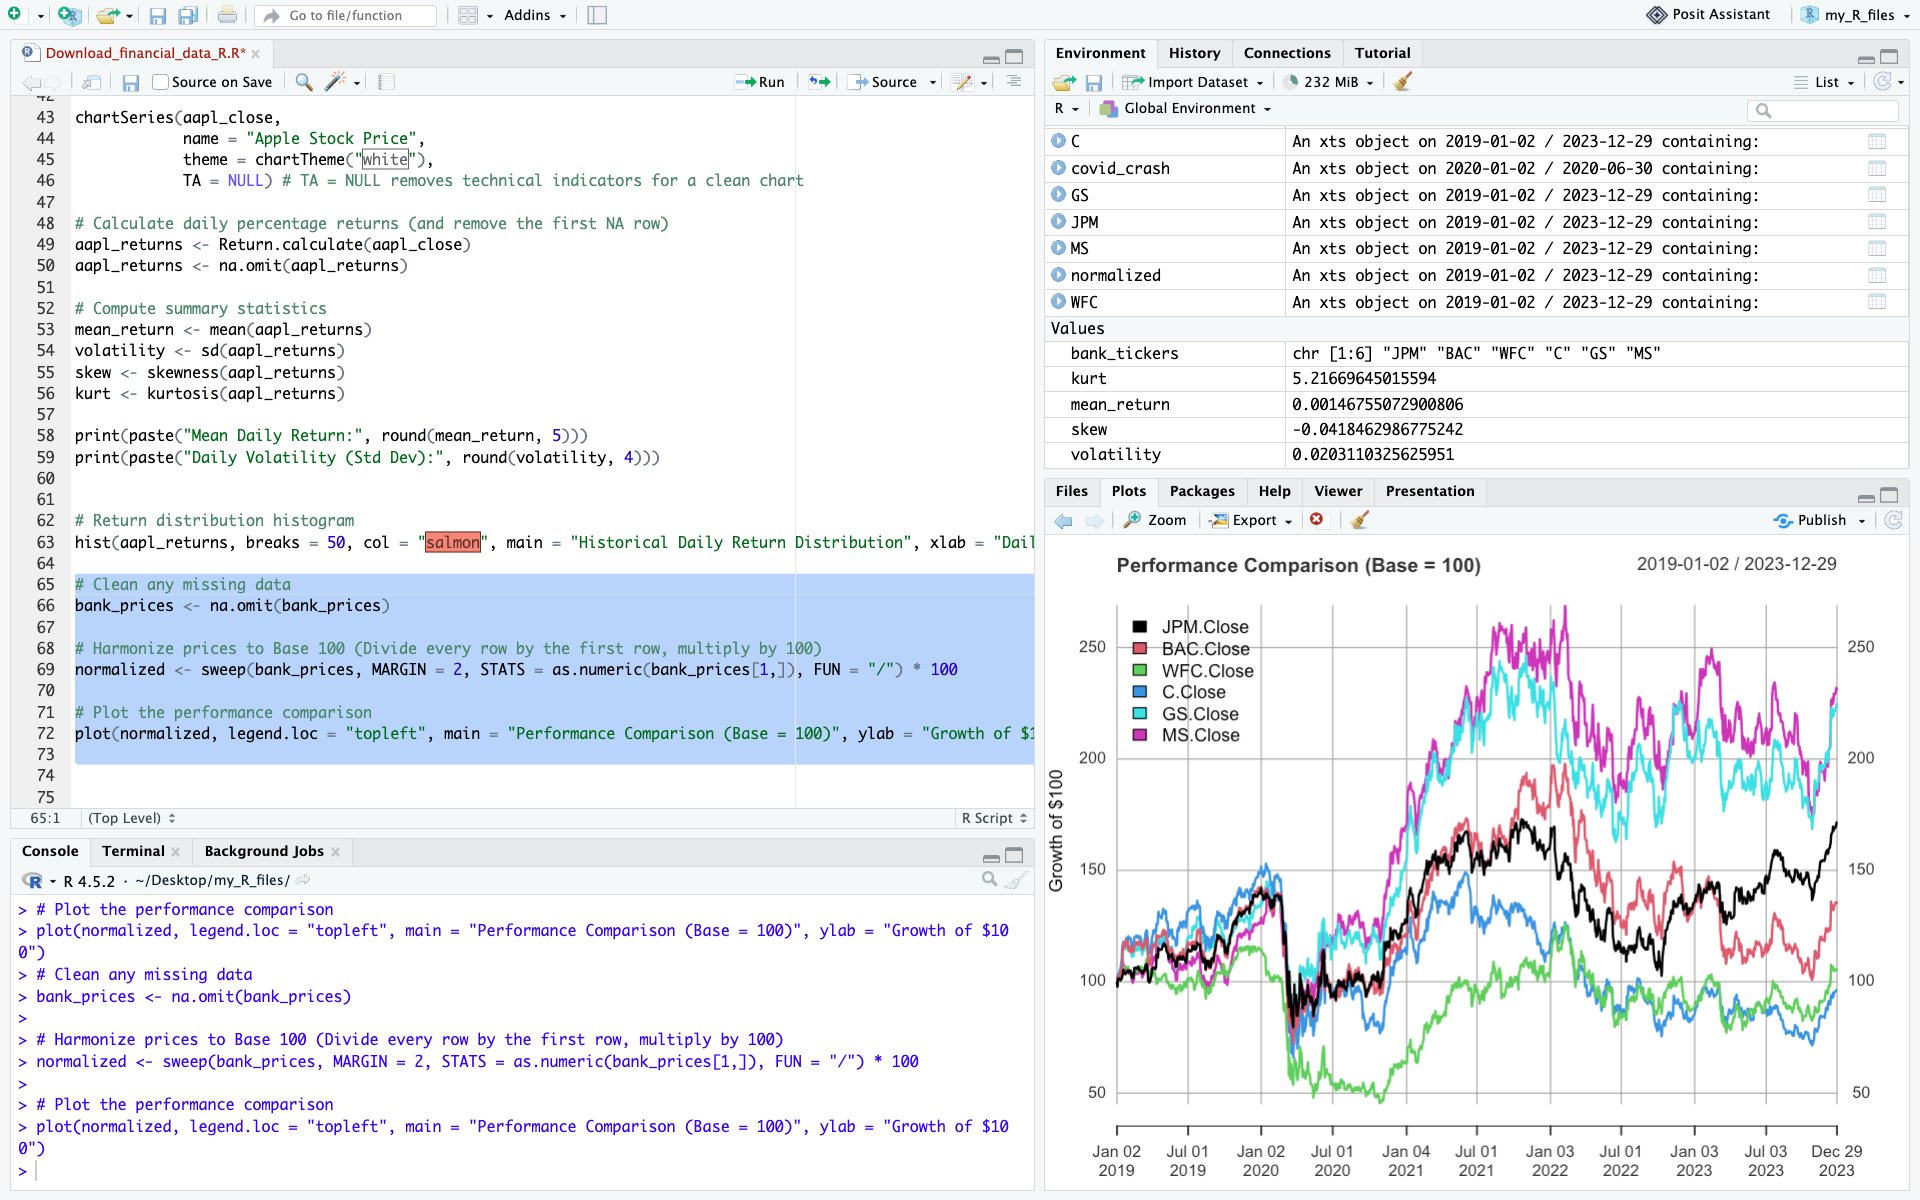
The output of the previous cell showing normalized prices

We can also compute daily returns across all stocks in one line:

bank_returns <- na.omit(Return.calculate(bank_prices))
head(bank_returns, 3)

This is a standard technique used by portfolio managers and equity analysts to compare growth trajectories.

Common pitfalls

When working with market data in R, beginners often run into the same issues:

  • Using the wrong ticker symbol
  • Comparing stocks without normalizing prices (Base 100)
  • Forgetting that markets are closed on weekends and holidays
  • Failing to clean and handle missing values (NA) using na.omit()
  • Using raw closing prices when adjusted prices are required: for long-term performance analysis, adjusted prices are generally preferable because they account for stock splits and dividends.

Overall, don’t forget to always inspect and clean your data before starting your analysis.

Exercises

Exercise 1: Basic data retrieval and price visualization (RACE)

Ferrari N.V. (RACE) presents an interesting case study in market dynamics: it is a car manufacturer that acts as a high-end luxury franchise. Its deliberate production scarcity, multi-year order backlogs, and immense pricing power decouple it from typical automotive boom-and-bust cycles.

Using the ticker symbol RACE, download the last five years of daily market data.

Your tasks:

  • Use the appropriate R functions to display the first 5 rows and the last 5 rows of the dataset to verify data integrity.
  • Extract the closing price and generate a line chart plotting the price over the entire 5-year period. Observe how its price trajectory reflects Ferrari’s distinctive positioning at the intersection of the automotive and luxury industries.

Exercise 2: time-series extraction and volume analysis on Tesla (TSLA)

Tesla is renowned for its high historical volatility and massive retail trading interest. The 2022-2024 window was particularly eventful for growth and electric vehicle stocks, marked by shifting supply chains and a rapid rise in interest rates.

Using the ticker symbol TSLA, extract the market data for the precise calendar period from January 1, 2022, to December 31, 2024 (using the from and to parameters).

Your tasks:

  • Identify the peak (highest closing price) and the trough (lowest closing price) over this period using the max() and min() functions.
  • Extract the Volume column (using Vo()) and calculate the average daily trading volume, a fundamental metric used by analysts to assess market liquidity.

Exercise 3: Comparative performance and risk profiling on Chinese tech companies

Chinese technology stocks often experience unique market cycles driven by distinct domestic regulatory environments and macroeconomic factors. Using the last five years of daily market data, compare the performance and risk characteristics of the following three US-listed ADRs:

  • Alibaba (BABA)
  • Baidu (BIDU)
  • PDD Holdings (PDD)

Questions:

  1. Which stock achieved the highest total cumulative return?
  2. Which stock was most volatile (highest standard deviation of daily returns)?
  3. Which one offered the best risk-adjusted profile over the period? Use the harpe ratio or any risk-adjusted measure

Download the solutions

To help you check your work and experiment further, you can download the complete R Script containing the full code, charts, and commentary for all exercises.

Download Solutions (.R Script)

What’s next?

Now that you know how to download financial data, compute returns, and analyze basic performance and risk measures in R, you are ready to delve into more advanced quantitative and corporate finance topics.

If you want to learn more about other programming languages, check out these two articles to learn how to install Python on your computer and use it to download financial data:

   ▶ Hadrien PUCHE How to Install and Run Python on Your Computer (A Step-by-Step Guide)

   ▶ Hadrien PUCHE How to download and model financial data with Python

About the Author

This article was written in September 2026 by Hadrien PUCHE (ESSEC Business School, Grande École Program, Master in Management, 2023-2027).

   ▶ Discover all posts by Hadrien PUCHE
How to install and run R on your computer (a step-by-step guide)

Hadrien Puche

Understanding and writing R code can be a valuable skill for your career. While general-purpose programming languages such as Python are more widely used, R is particularly well suited to statistical analysis, data visualization, and quantitative research.

In this article, Hadrien Puche (ESSEC Business School, Grande École Program, Master in Management, 2023-2027) will help you to:

  • Understand the core components of the R statistical ecosystem for finance
  • Compare development setups (RStudio Desktop vs. Visual Studio Code)
  • Install R alongside essential build tools (RTools / Xcode)
  • Set up RStudio Desktop as a purpose-built workspace
  • Install econometric packages via CRAN (like quantmod)
  • Run a test script

But first, what is R exactly?

Historically, R was created in 1993 as an open-source implementation of the S language, developed at Bell Labs for statistical computing.

Setting up your R workspace can be straightforward. We will rely on CRAN (the Comprehensive R Archive Network), R’s main public repository for packages, to install the packages required for our analysis and their dependencies. Let’s walk through deploying a professional quantitative workspace for R.

Quick vocabulary for beginners

Before we dive in, let’s define a few technical terms you will encounter frequently:

  • Package: A collection of reusable R functions, data, and documentation designed for a specific purpose. For example, quantmod provides tools for quantitative financial analysis and financial data retrieval.
  • Library: A directory on your computer, where your installed packages are stored. You will use the library() command in your code to load them. While developers often use the terms package and library interchangeably, technically you install a package into your library.
  • Dependency: A package that another package requires in order to work properly. R manages these dependencies automatically, so you do not have to take care of them, but do not be surprised if R installs many more packages than you initially requested.
  • Build Tools (Rtools / Xcode): Background software required by your computer to translate (or “compile”) raw source code into executable instructions. R frequently compiles financial packages directly on your machine, making these essential to prevent errors.

Choosing your development environment: RStudio or Visual Studio Code?

You generally have two choices when it comes to writing R code: RStudio Desktop and Visual Studio Code (VS Code).

  • RStudio Desktop: An Integrated Development Environment (IDE) built specifically for R. It features a 4-pane layout that lets you simultaneously view your scripts, console, environment variables (data frames loaded in memory), and charts.
  • Visual Studio Code: VS Code is a highly versatile code editor. You can run R in VS Code by installing the R extension and configuring the required R packages. This is a good choice if you plan to mix multiple programming languages in the same project, though configuring VS Code for R requires a bit more effort than RStudio.

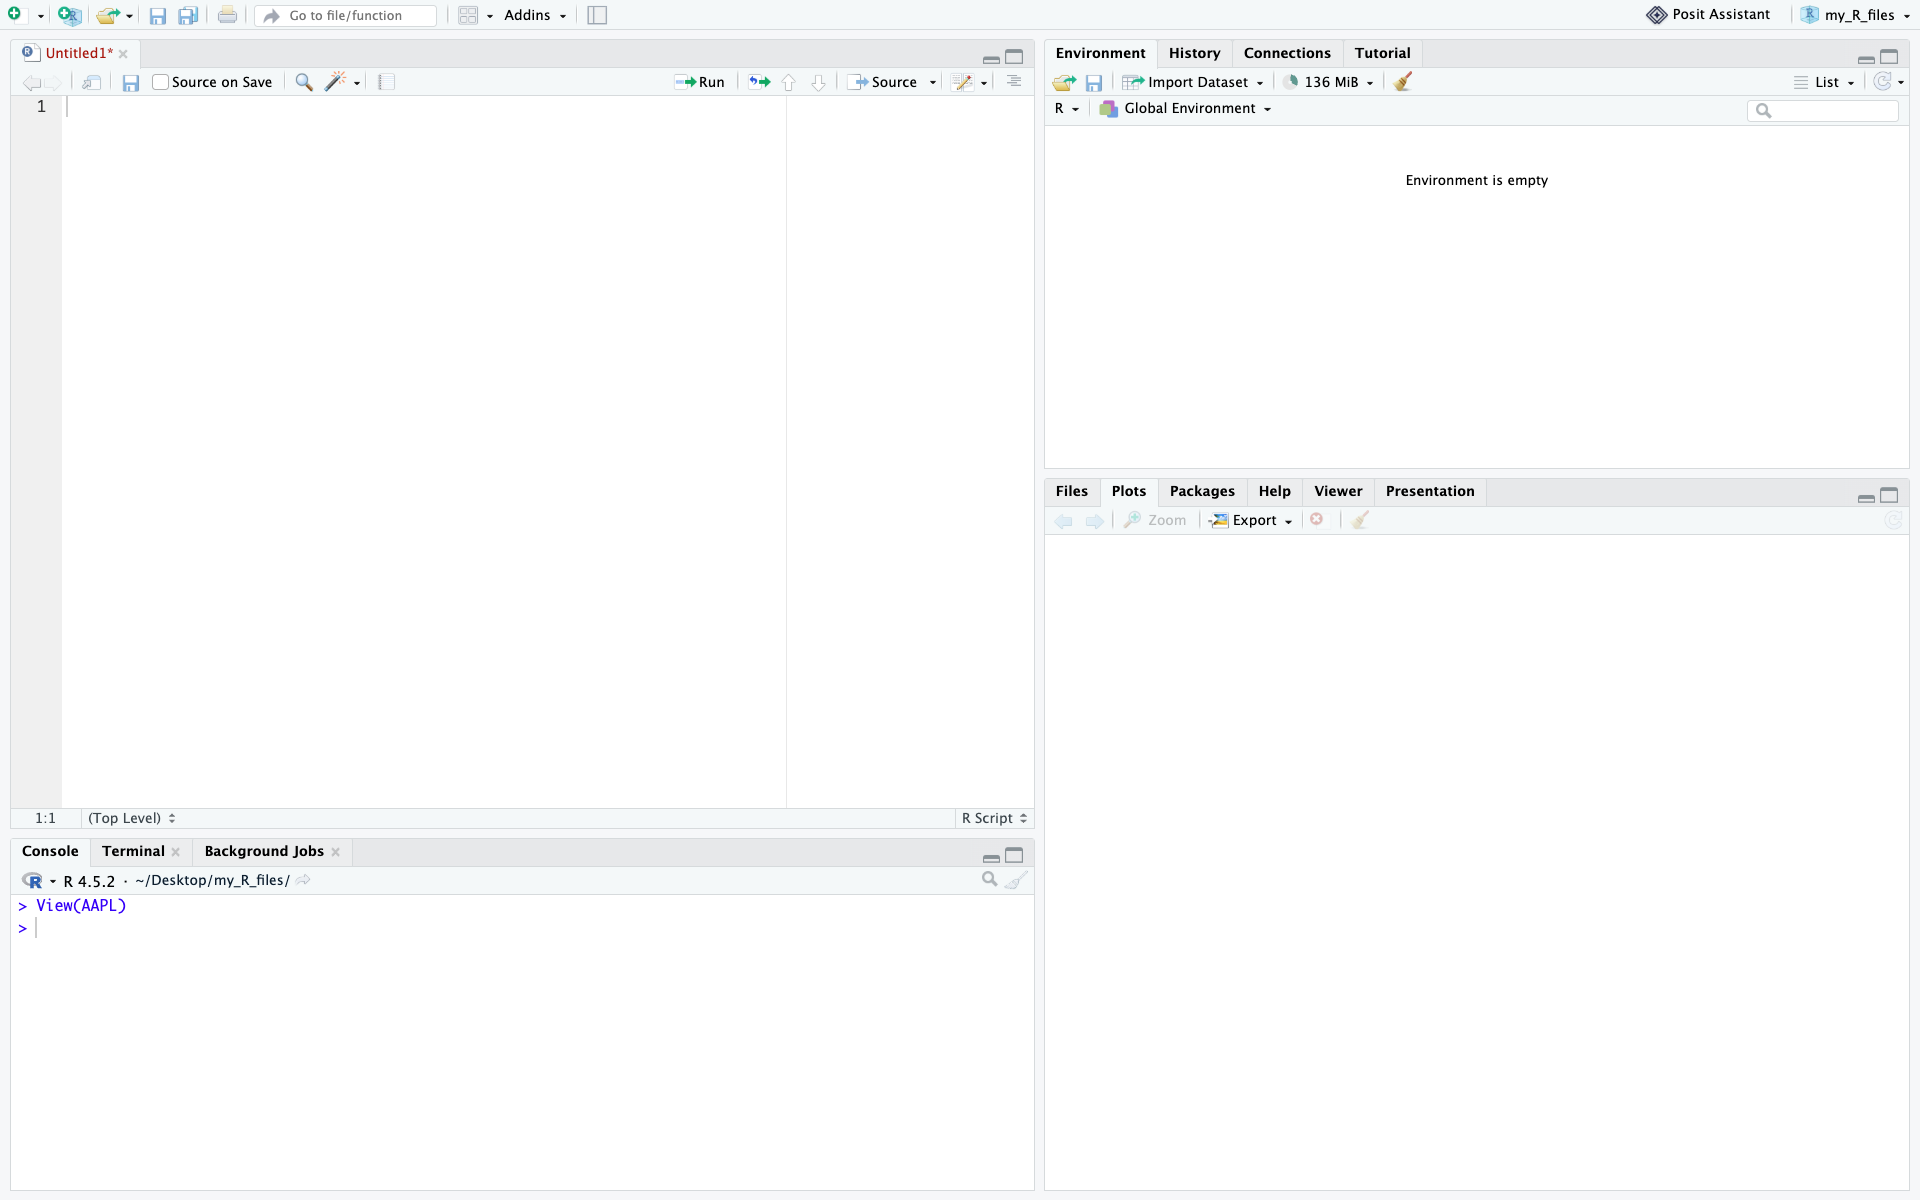
RStudio Desktop 4-pane layout
RStudio Desktop Interface

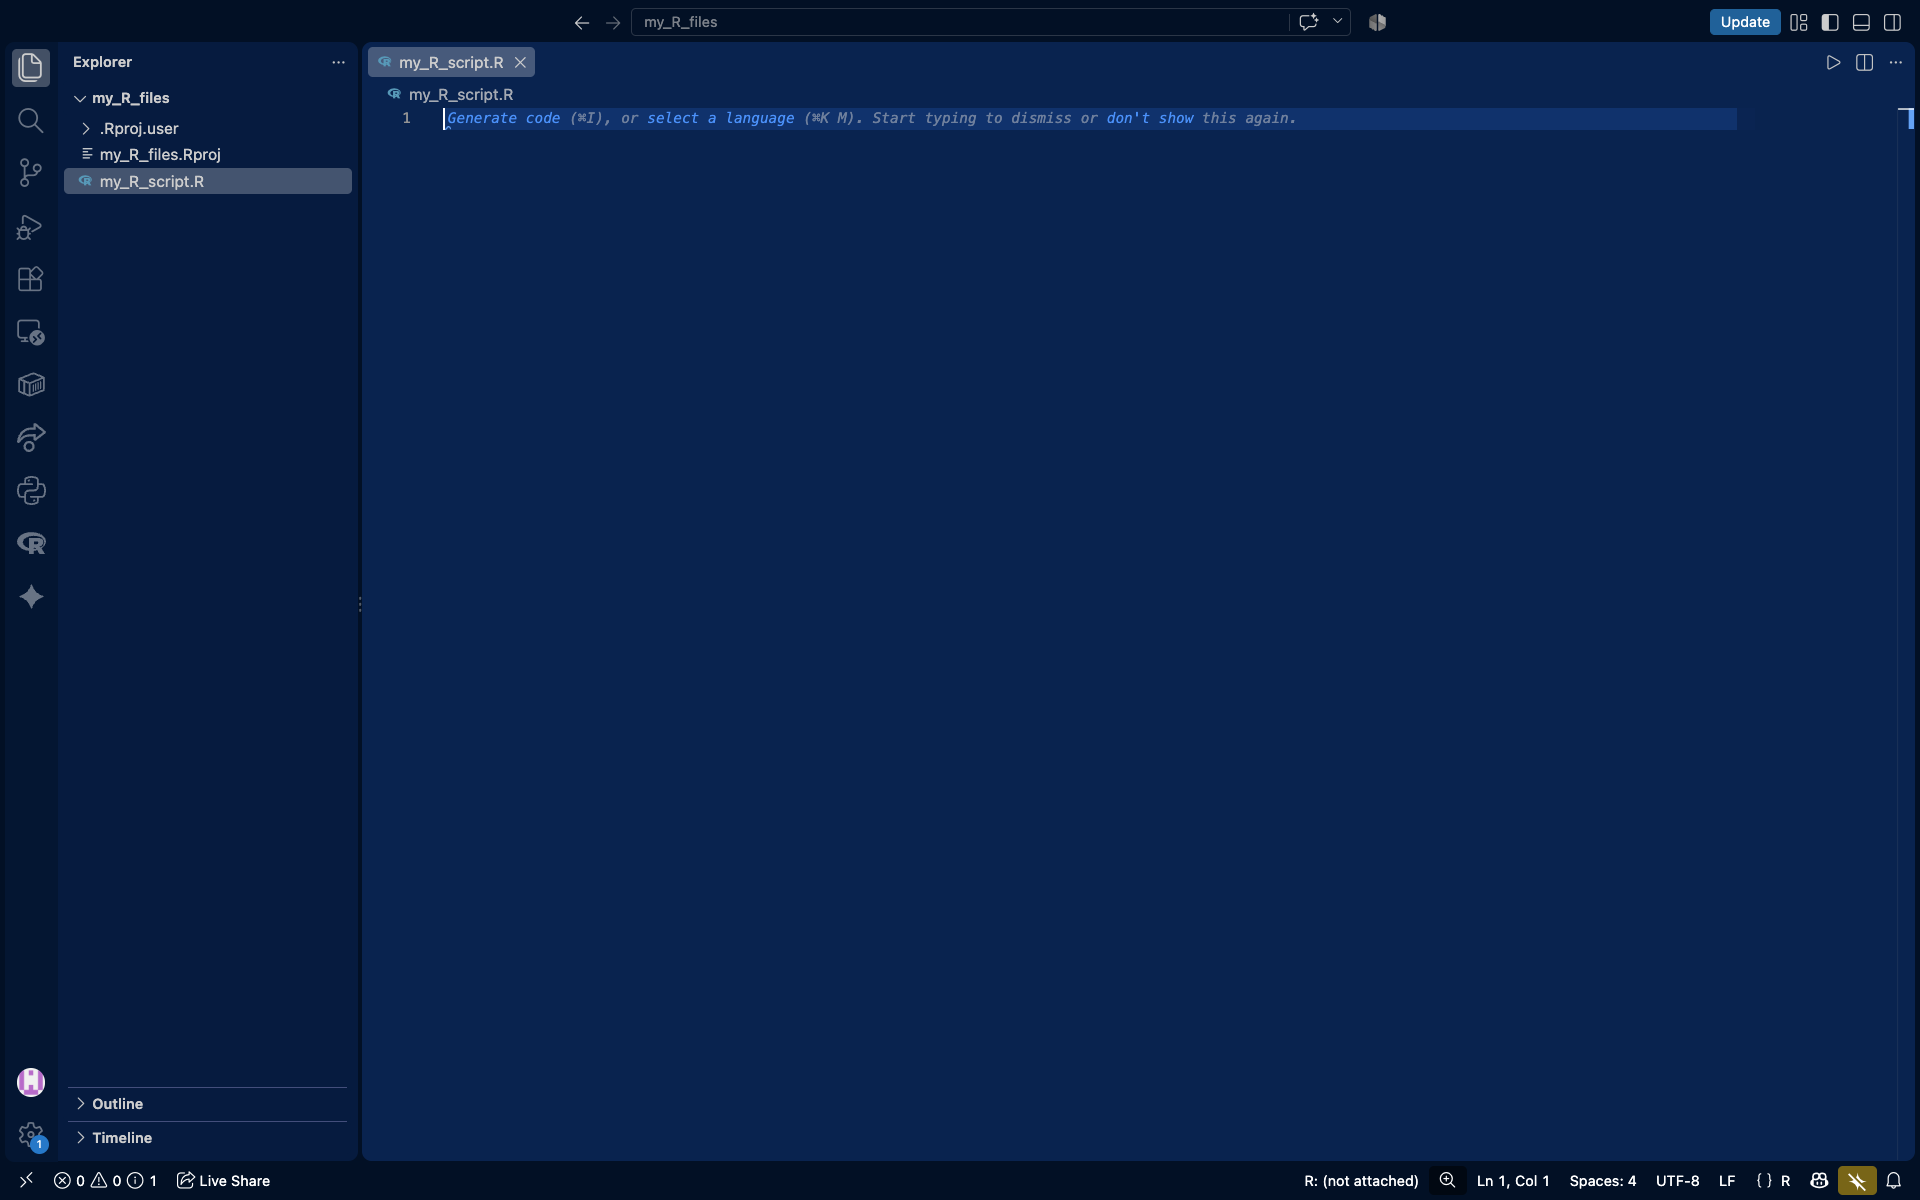
Visual Studio Code running R
Visual Studio Code configured for R

For this guide, we will focus on setting up R and integrating it with RStudio, as it offers a purpose-built user experience for R.

Understanding the R architecture

The R architecture operates as follows:

  • Base R: The underlying computational engine that calculates the math and runs the logic.
  • Build tools (RTools / Xcode):oftware required to compile R packages from source when precompiled binary versions are not available. Most beginners will install packages from binaries, but having these tools available can prevent installation problems with packages that require compilation.
  • CRAN: The Comprehensive R Archive Network. This is the centralized, strictly regulated global repository for R packages.

Step-by-step installation guide

Step 1: Install R and build tools

First, we must install R. RStudio will not function without it.

  1. Go to the official CRAN Download Page.
  2. For Windows:
    • Click Download R for Windows > base > Download the latest R executable and install it using default settings.
    • Go back to the Windows page, click Rtools, and install the version matching your R installation. This is critical for compiling quantitative packages later.
  3. For macOS:
    • Click Download R for macOS and select the .pkg matching your chip (Apple Silicon or Intel).
    • To ensure packages compile correctly, open your Mac Terminal and run xcode-select --install to get the necessary developer tools.

Step 2: Install RStudio

Now, we install the integrated development environment (IDE) that we will use to write and execute R code.

  1. Head to the Posit RStudio Desktop website.
  2. Download the free version corresponding to your operating system (Windows or macOS).
  3. Run the installer. RStudio will normally detect the R installation completed in Step 1 automatically.

Step 3: Install packages from CRAN

Because R uses centralized package repositories such as CRAN, we can install the packages required for our financial analysis directly from the R console in RStudio.

  1. Launch RStudio.
  2. In the Console pane (bottom-left), type the following command and press Enter. This will reach out to CRAN and download the essential tools for market data and time-series analysis:

# Install quantmod for data retrieval, xts for time-series, and PerformanceAnalytics for risk metrics
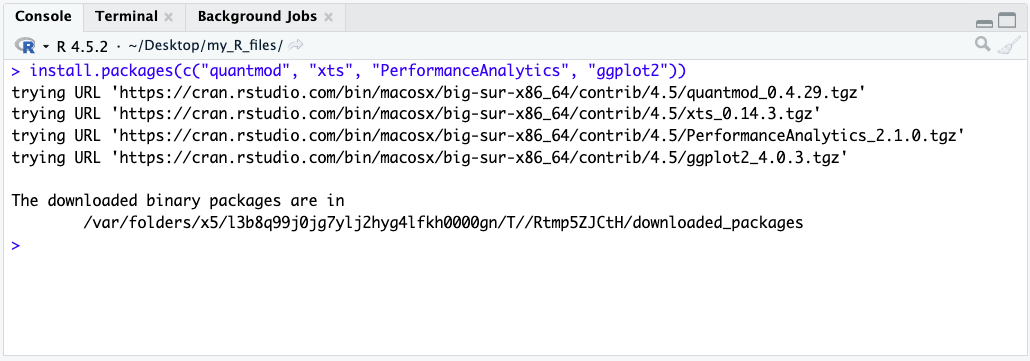
install.packages(c("quantmod", "xts", "PerformanceAnalytics", "ggplot2"))

💡 Quick fix tip: R may occasionally ask whether you want to install a package from source when a binary version is also available. For beginners, the binary version is usually the simplest option. Installing from source may require Rtools on Windows or the Xcode Command Line Tools on macOS.

a screenshot of the output of the script when downloading the packages

Checking that everything is working as intended

Let’s verify your infrastructure by writing a short script that pulls actual market data.

  1. In RStudio, go to File > New File > R Script.
  2. Paste the following quantitative code into the top-left editor pane.
  3. Highlight all the text and press Ctrl+Enter (Windows) or Cmd+Enter (macOS) to run it.
# Load the quantitative financial modeling library
library(quantmod)
 
# Download historical financial data for Apple via Yahoo Finance API
getSymbols("AAPL", src = "yahoo", from = "2023-01-01", to = "2024-01-01", auto.assign = TRUE)
 
# Display the first 5 rows of the time-series array in the console
print(head(AAPL))
 
# Generate a financial chart with volume and Bollinger Bands for volatility analysis
chartSeries(AAPL, 
            name = "Apple Inc. (AAPL) Historical Prices", 
            theme = chartTheme("white"), 
            TA = c(addVo(), addBBands()))

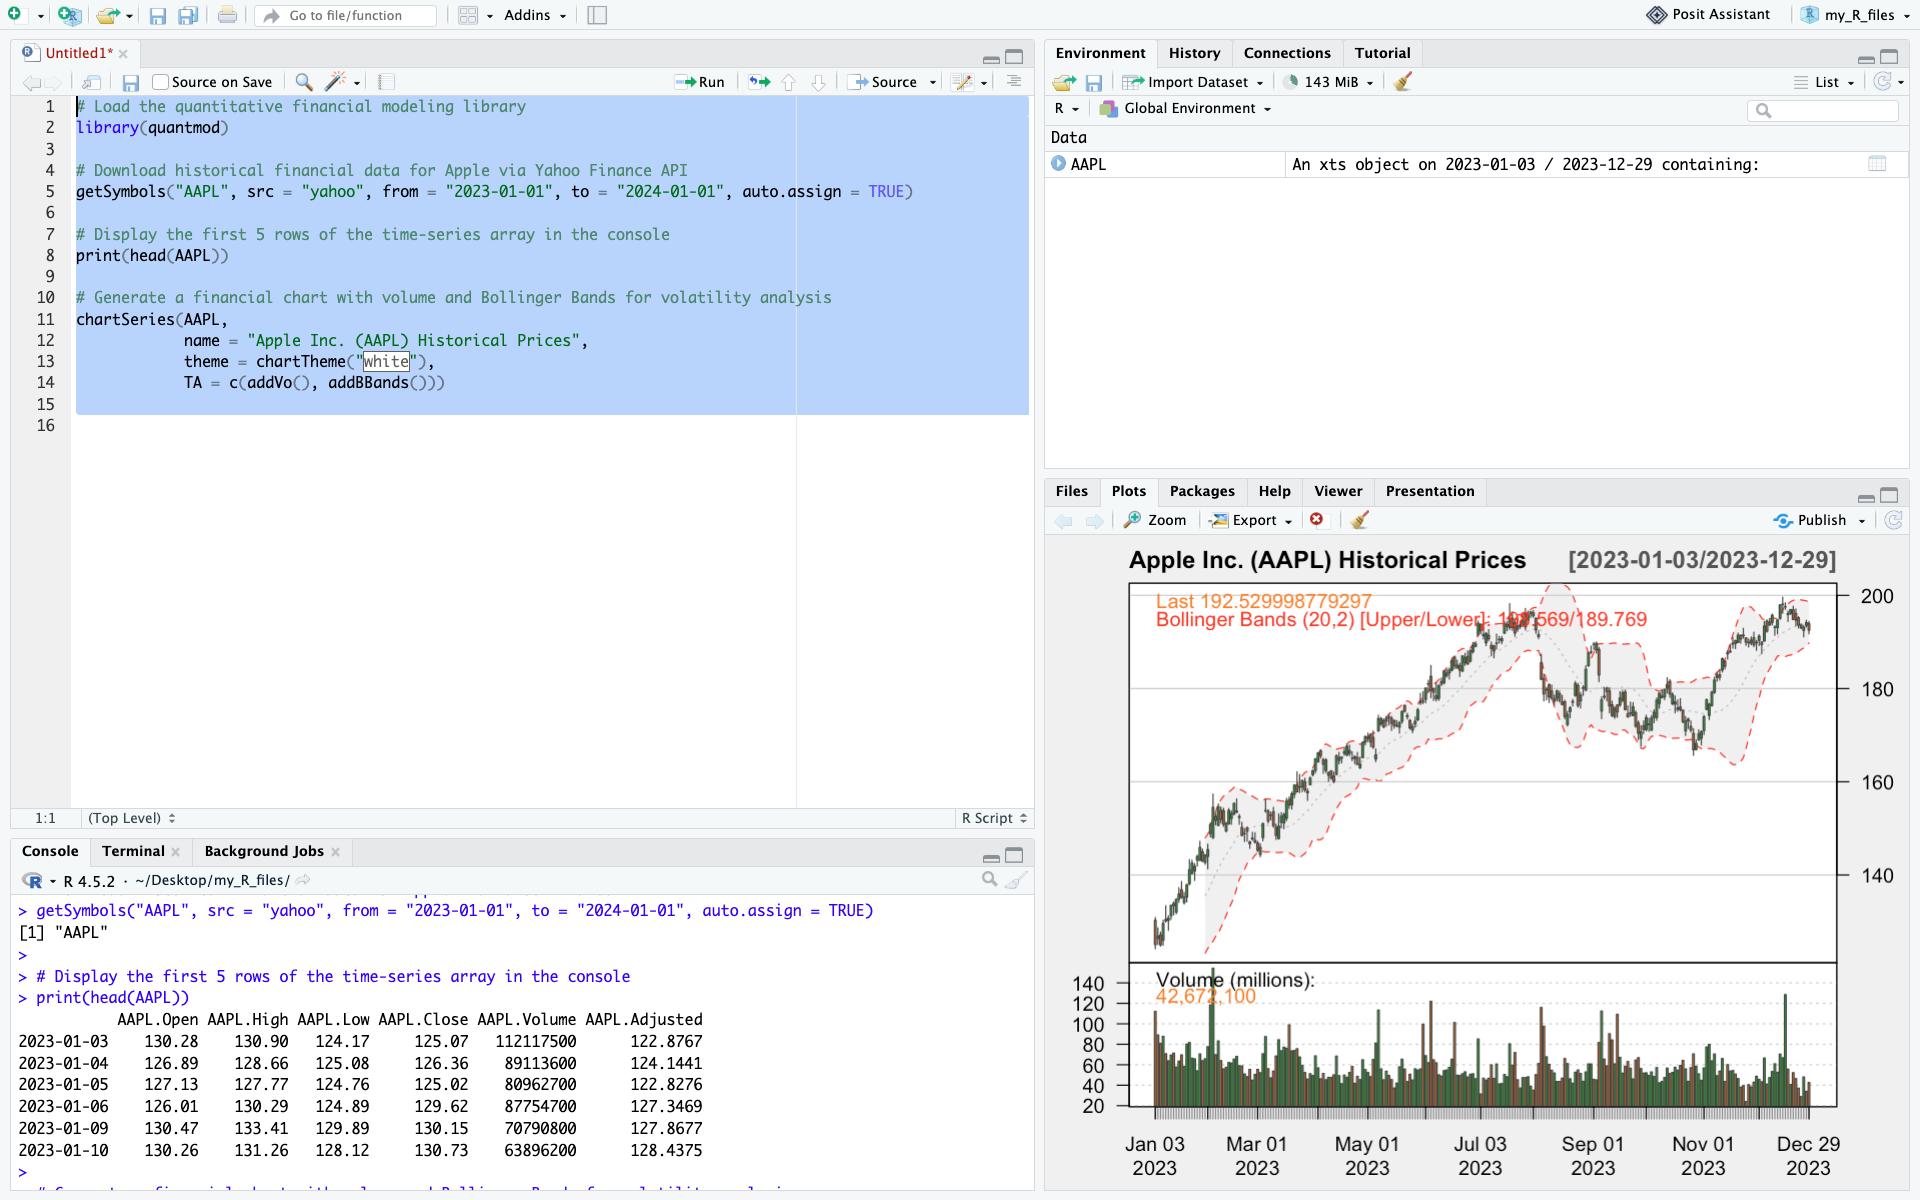
A screenshot of RStudio after running the test script
After running the script, your RStudio should look like this

If the AAPL dataset appears in your top-right Environment pane, the data prints in your Console, and a professional candlestick chart renders in your bottom-right Plots pane, your R setup is fully operational.

Next steps & use cases

With R correctly configured, you are now equipped to tackle complex econometric and financial challenges. A good next step would be to learn how to download financial data with R.

You can learn how to do so in this article: How to download financial data with R

Useful resources

   ▶ CRAN (The Comprehensive R Archive Network): The main public repository for R packages, R distributions, and documentation. CRAN provides a centralized infrastructure for distributing and maintaining thousands of R packages used in statistical computing, econometrics, and quantitative research.

About the author

This article was written in September 2026 by Hadrien PUCHE (ESSEC Business School, Grande École Program, Master in Management, 2023-2027).

   ▶ Discover all posts by Hadrien PUCHE
How to download and model financial data with Python

Hadrien Puche

Any financial analysis starts with data. Whether you want to analyze a stock, build a portfolio, measure risk, create a valuation model or develop trading strategies, the first step is always the same: obtaining financial data.

You could download data manually from websites such as Yahoo! Finance or Investing.com, but this quickly becomes tedious and time-consuming. It also limits the amount of data you can work with.

Python allows us to automate this process and retrieve large amounts of financial information in just a few lines of code.

In this article, Hadrien Puche (ESSEC Business School, Grande École Program, Master in Management, 2023-2027) will help you understand how to:

  • Download historical stock prices with Python
  • Explore and visualize market data
  • Compute basic statistics and historical distributions
  • Compare multiple securities
  • Learn more about the CAPM
  • Build the foundation needed for more advanced financial analysis

What financial data can we download?

Financial professionals use many different categories of data across individual assets as well as portfolios and funds.

Market data

  • Individual asset prices (e.g., individual stocks, corporate bonds)
  • Portfolios and funds (e.g., ETFs, mutual funds)
  • Currency exchange rates
  • Commodity prices
  • Bond yields

Company fundamentals

  • Revenue
  • Earnings
  • Margins
  • Cash flows

Macroeconomic data

  • Inflation
  • Interest rates
  • GDP growth
  • Unemployment

Alternative data

  • News
  • Social media sentiment
  • Satellite imagery
  • Credit card spending

Not all data sources are freely available. Many professional investors rely on paid platforms such as Bloomberg, FactSet, Capital IQ or Morningstar to access standardized, high-frequency, and point-in-time data.

Fortunately, stock market data specifically can easily be accessed for free using Python for research and learning purposes.

In this article, we will use the open-source yfinance library to download historical market data that you will then be able to model and use for any financial analysis project you may have.

A step-by-step guide

Follow the next steps to download your first financial data with Python 🙂

Step 1: Installing the required libraries

If you have not yet installed Python, refer to the setup guide to configure your execution environment (such as Jupyter Notebook or Anaconda).

Once your environment is ready, install the required packages:

pip install yfinance pandas numpy matplotlib

or inside Jupyter Notebook:

!pip install yfinance pandas numpy matplotlib

We will use:

  • yfinance to retrieve market data
  • pandas to manipulate data structures
  • numpy for financial and mathematical operations
  • matplotlib to create charts

Step 2: Import our Python packages

Most data analysis scripts begin by importing the packages required for the analysis. In Python, packages provide reusable code and functionality that extend Python’s core capabilities.

import yfinance as yf
import pandas as pd
import numpy as np
import matplotlib.pyplot as plt

The aliases (yf, pd, np, plt) make the code shorter and easier to read.

Step 3: Download our first data set

To download financial data, we use ticker symbols, which identify securities or market instruments within a given exchange or data provider. For example, AAPL represents Apple.

When calling a Python function, we can customize its behavior by passing arguments such as period (e.g., "5y" for 5 years) or specific start and end dates.

As an example, let us download daily data for Apple stock price over the last five years (Yahoo! Finance ticker: AAPL). The data will be stored in a data frame (df) that we can name df_apple.

df_aapl = yf.download("AAPL", period="5y")

print(df_aapl.head())

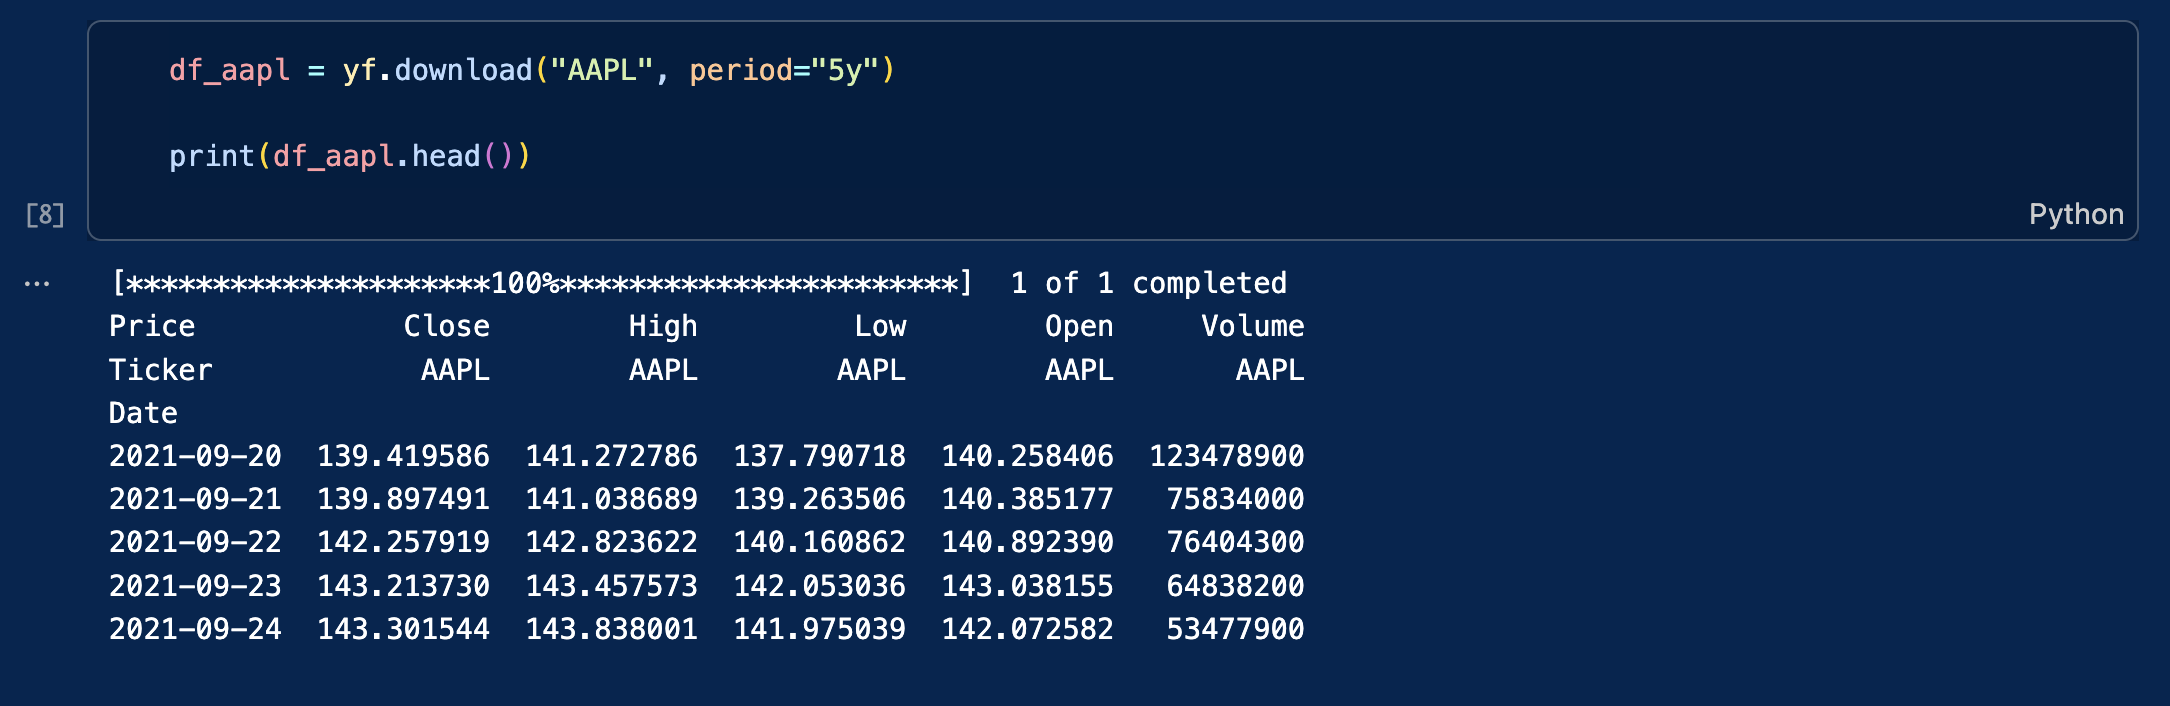
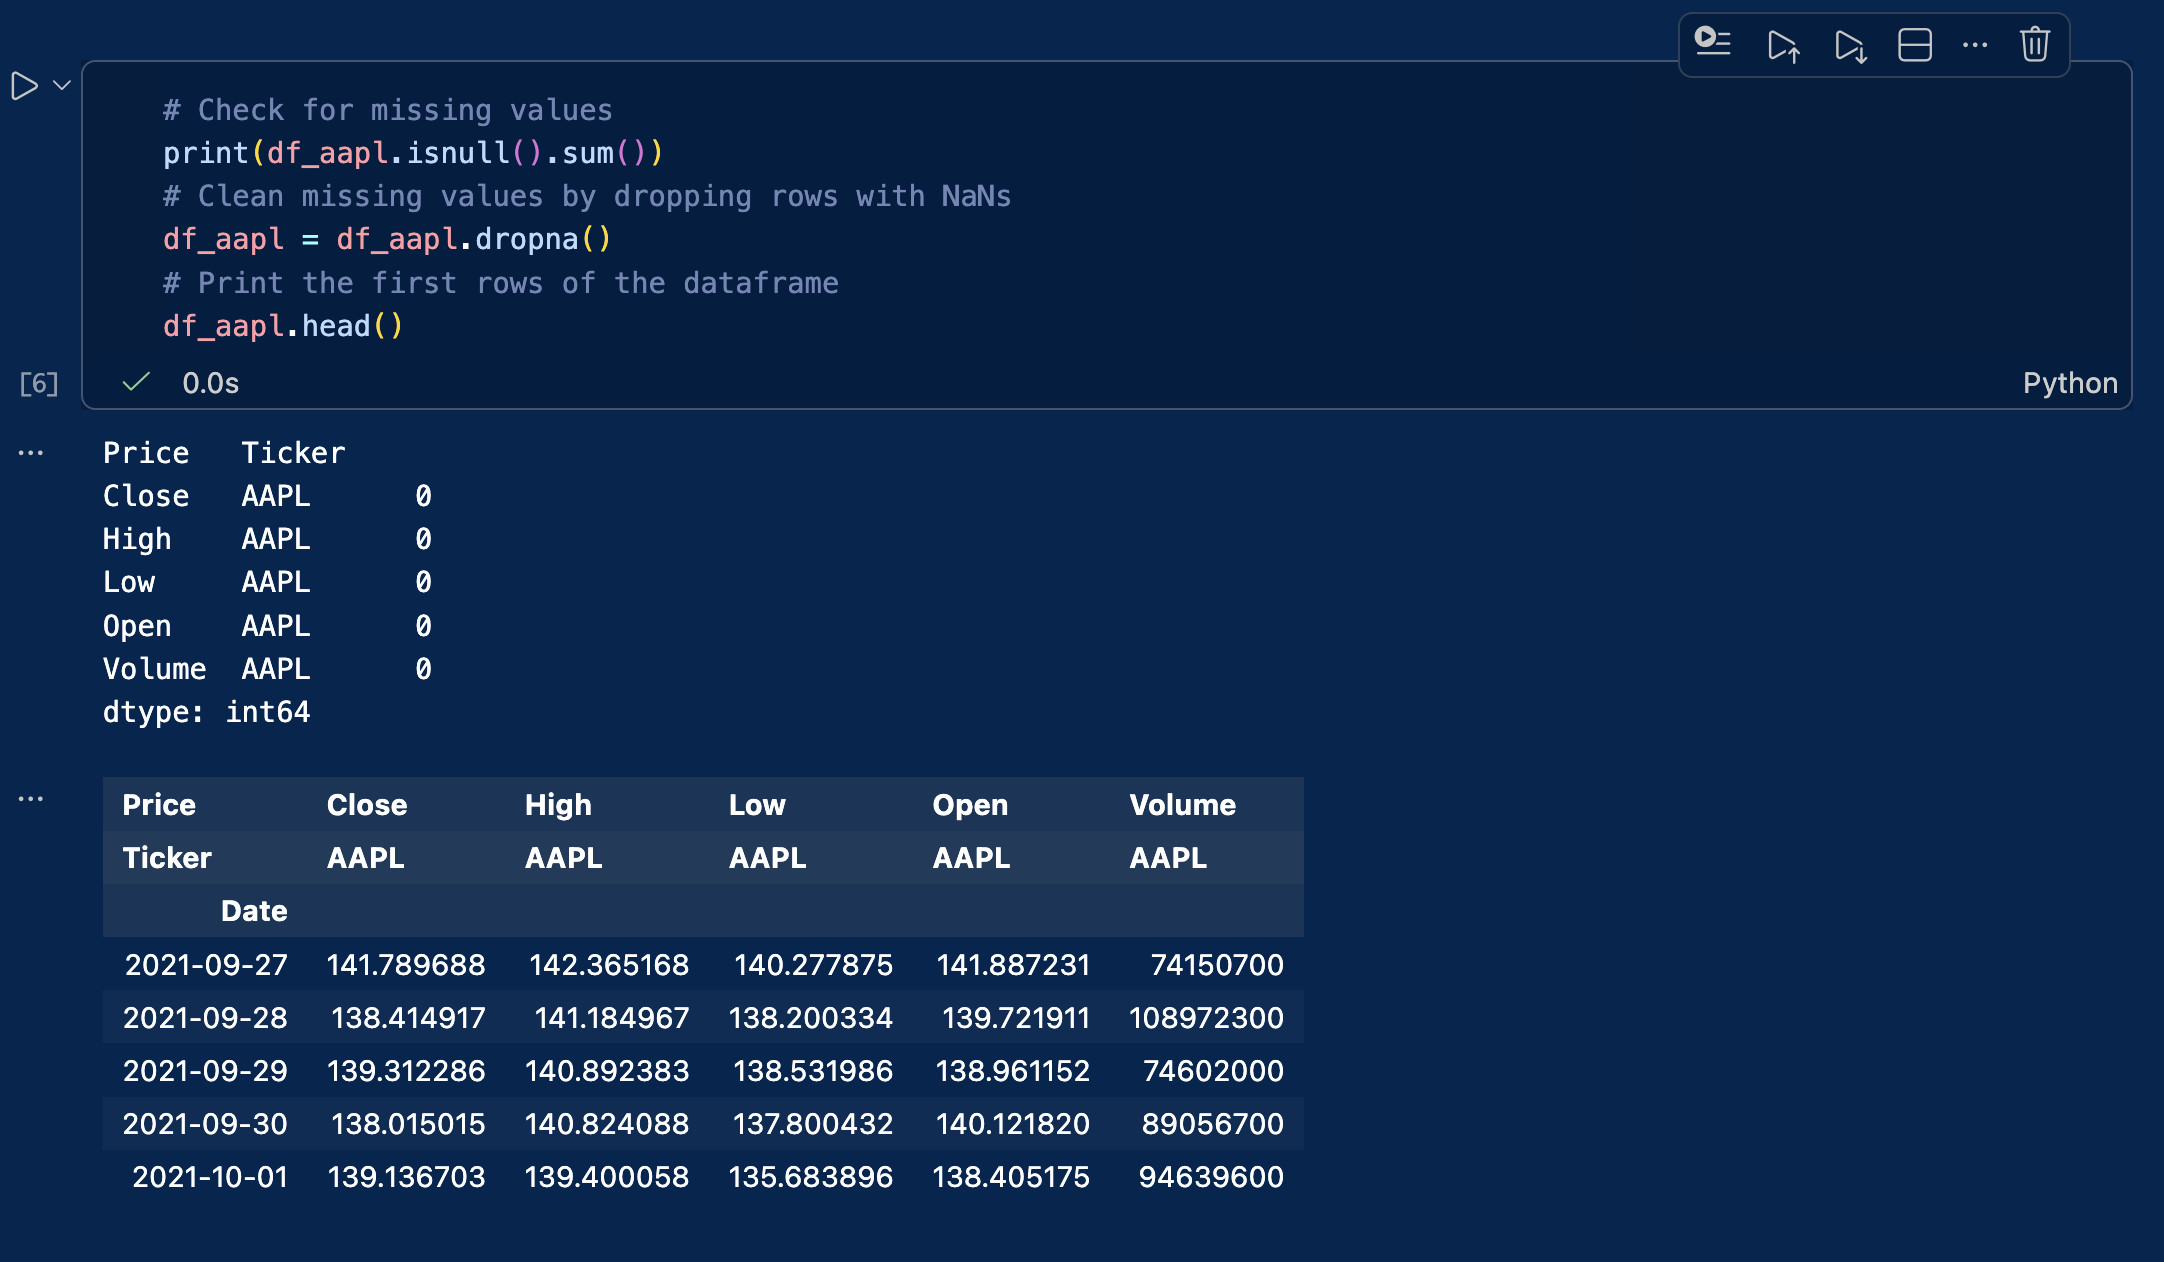
You will obtain this table with the following columns:

  • Close: closing price at the end of the trading day
  • High: highest price during the trading day
  • Low: lowest price during the trading day
  • Open: opening price at the beginning of the trading day
  • Volume: transaction volume during the trading day

An screenshot from VSC showing the output table of this Yfinance query

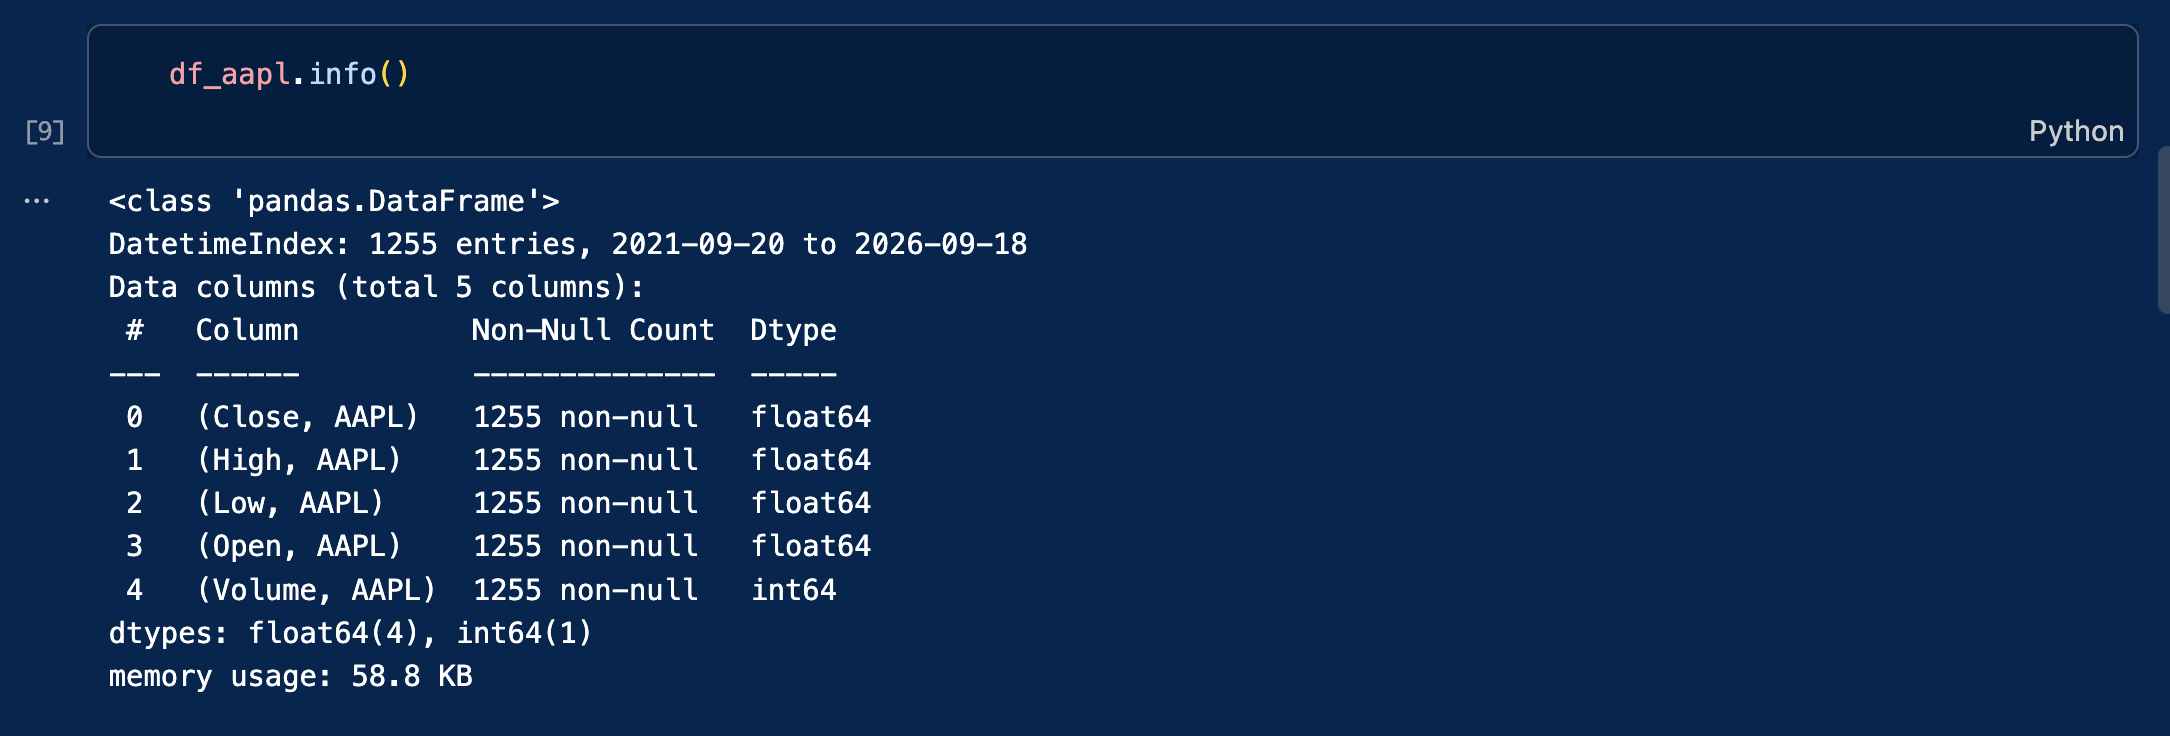
The data is stored in a Pandas DataFrame. This is a popular two-dimensional, tabular data structure with labeled axes (rows and columns).

To inspect its structure, type the following code:

df_aapl.info()

A screenshot from VSC showing the output of df_aapl.info()

Step 4: Using more precise queries for historical context

Instead of downloading a rolling period (like “5y”), we can isolate specific market events by passing exact start and end dates to the download function. As financial analysts, we routinely extract specific timeframes to understand how assets behave under macroeconomic stress.

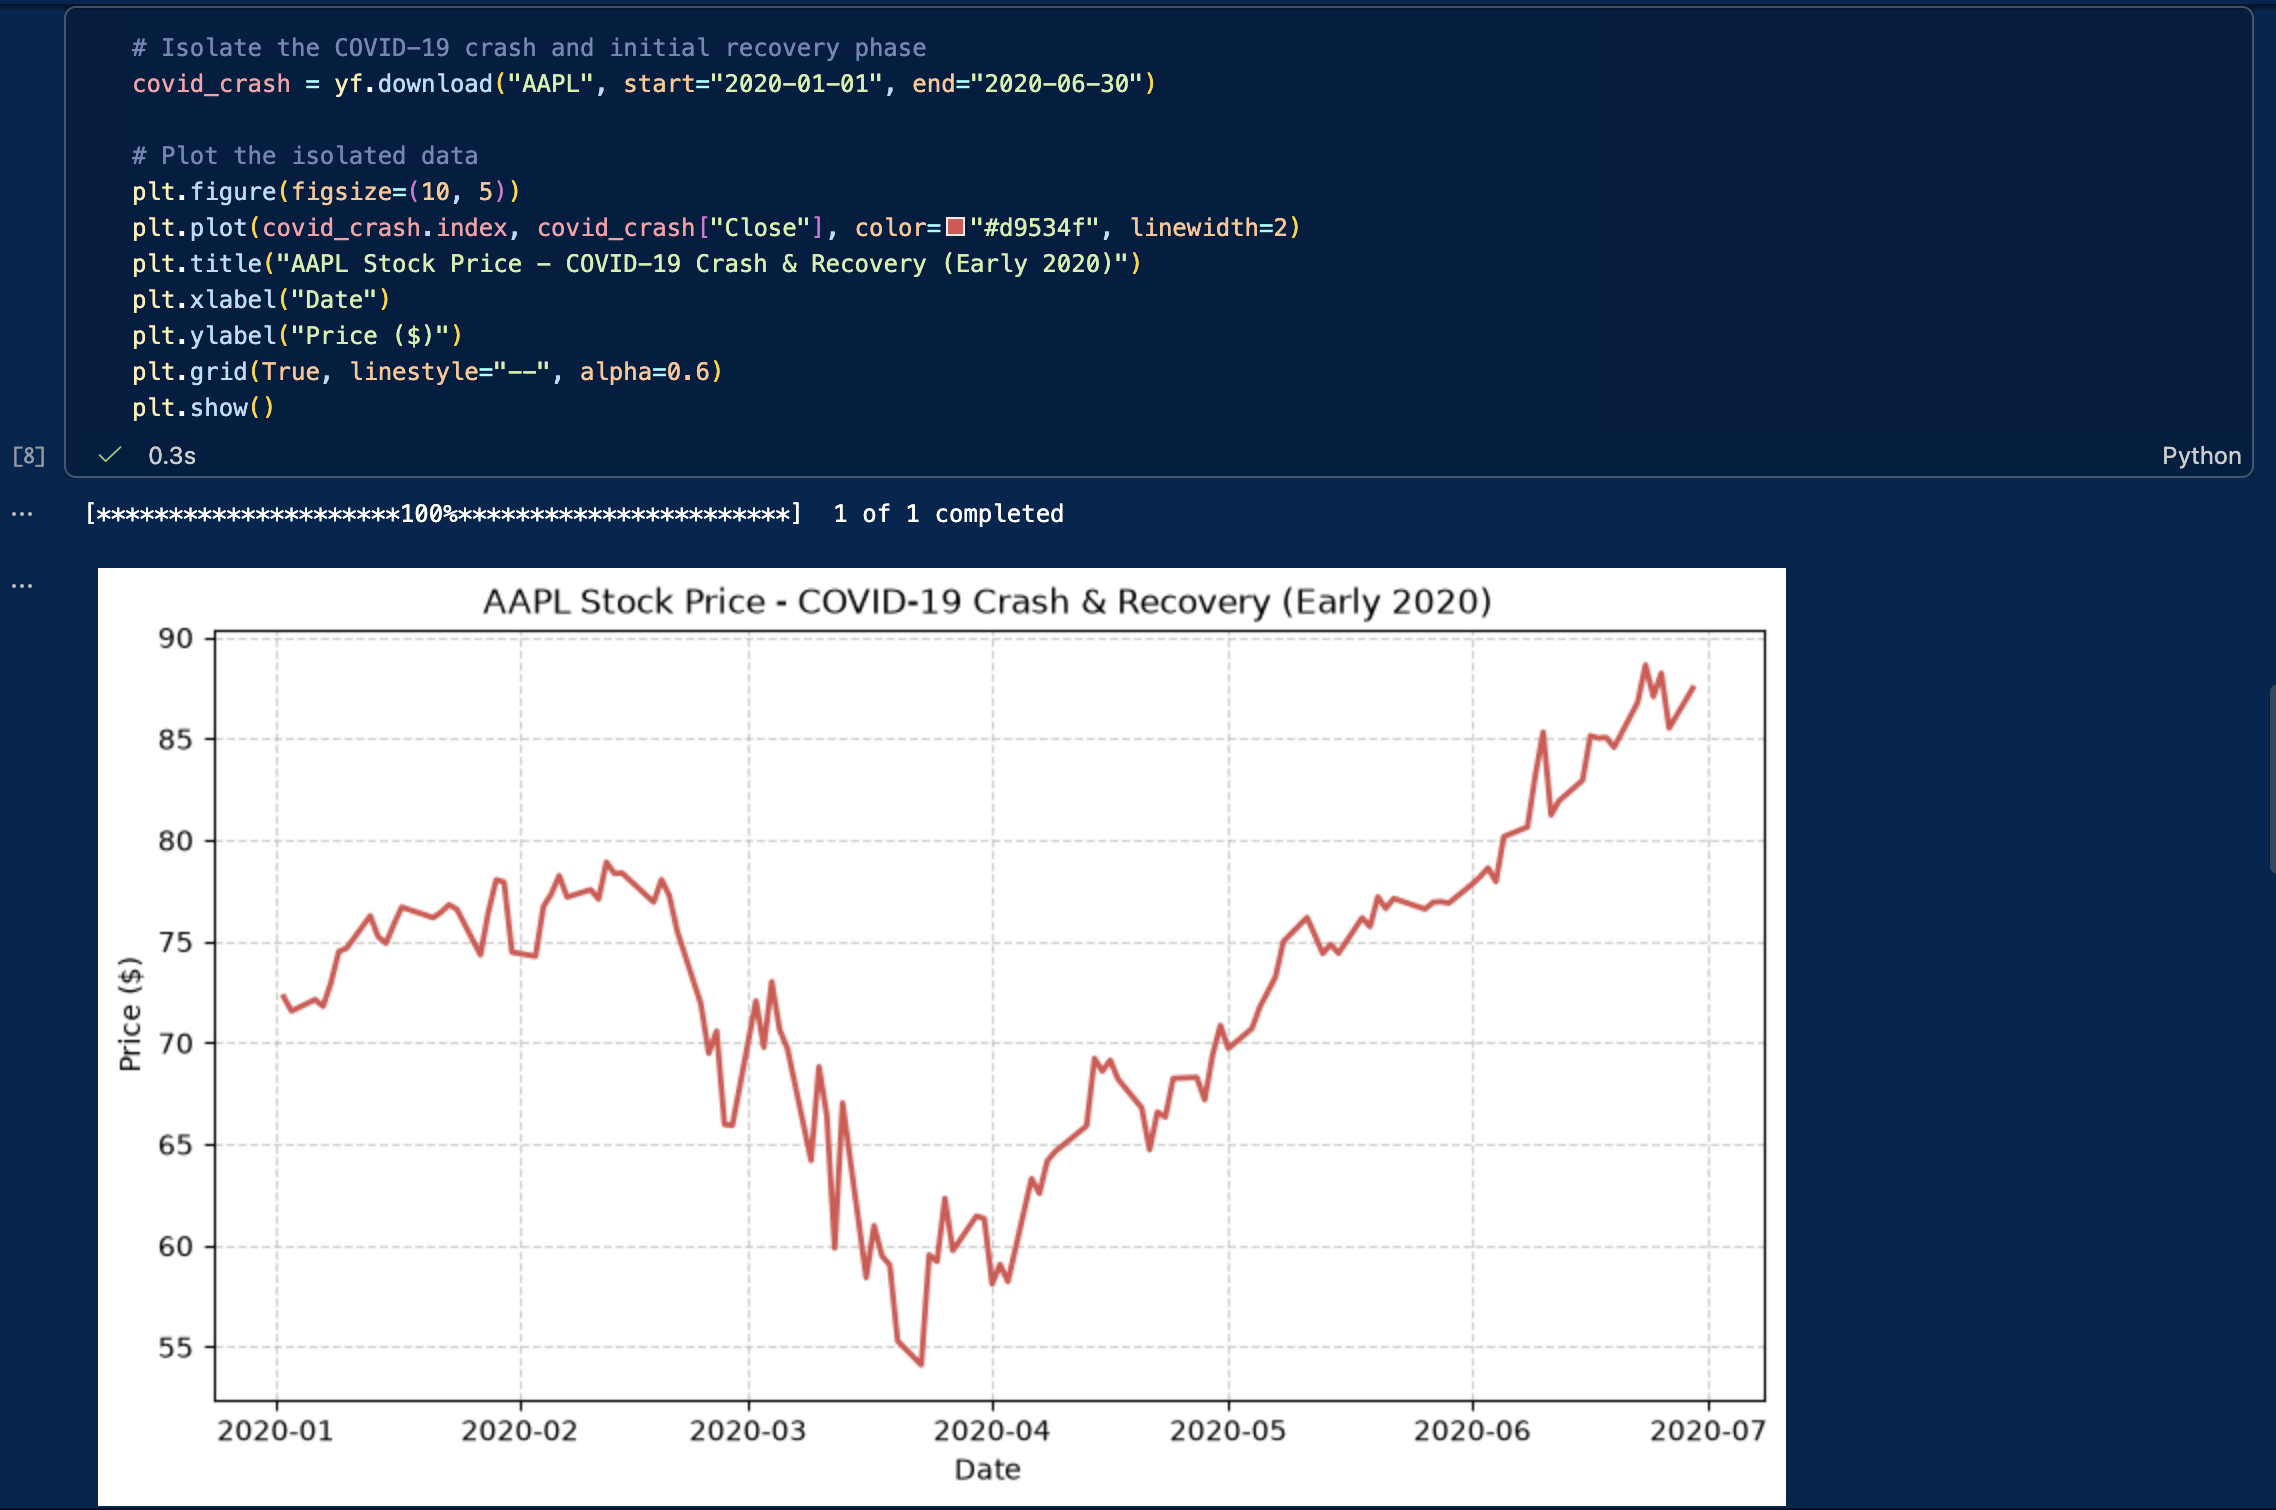
For example, analyzing the COVID-19 market crash in early 2020 offers invaluable insights into extreme volatility, liquidity crunches, and rapid V-shaped recoveries. Let’s download and plot Apple’s stock specifically during the height of the pandemic shock (January to June 2020):

# Isolate the COVID-19 crash and initial recovery phase
covid_crash = yf.download("AAPL", start="2020-01-01", end="2020-06-30")

# Plot the isolated data
plt.figure(figsize=(10, 5))
plt.plot(covid_crash.index, covid_crash["Close"], color="#d9534f", linewidth=2)
plt.title("AAPL Stock Price - COVID-19 Crash & Recovery (Early 2020)")
plt.xlabel("Date")
plt.ylabel("Price ($)")
plt.grid(True, linestyle="--", alpha=0.6)
plt.show()

The output of the previous code cell

We could use this same technique to analyze other pivotal periods, such as:

  • A central bank interest rate tightening cycle (e.g., the Fed’s 2022-2023 rate hikes)
  • The 2008 Global Financial Crisis (if analyzing older datasets)
  • Specific earnings announcement windows

Step 5: Downloading multiple stocks at the same time

Downloading multiple stocks is necessary for financial analysis that often requires comparing securities, building a portfolio, or testing trading strategies like pairs trading.

Instead of issuing separate requests for each stock (which risks hitting API rate limits or misaligning dates), it is far more efficient to fetch all tickers at once in a single batch query.

To make this practical, let’s download the data for the “Magnificent Seven”. These seven mega-cap tech companies (Apple, Microsoft, Alphabet, Amazon, Meta, Nvidia, and Tesla) have heavily dominated market capitalization and driven a massive portion of the S&P 500’s returns in recent years.

# Define the Magnificent 7 tickers
mag7_tickers = ["AAPL", "MSFT", "GOOGL", "AMZN", "META", "NVDA", "TSLA"]

# Download the closing prices for all 7 stocks simultaneously
prices = yf.download(mag7_tickers, period="5y")["Close"]
 
print(prices.head())

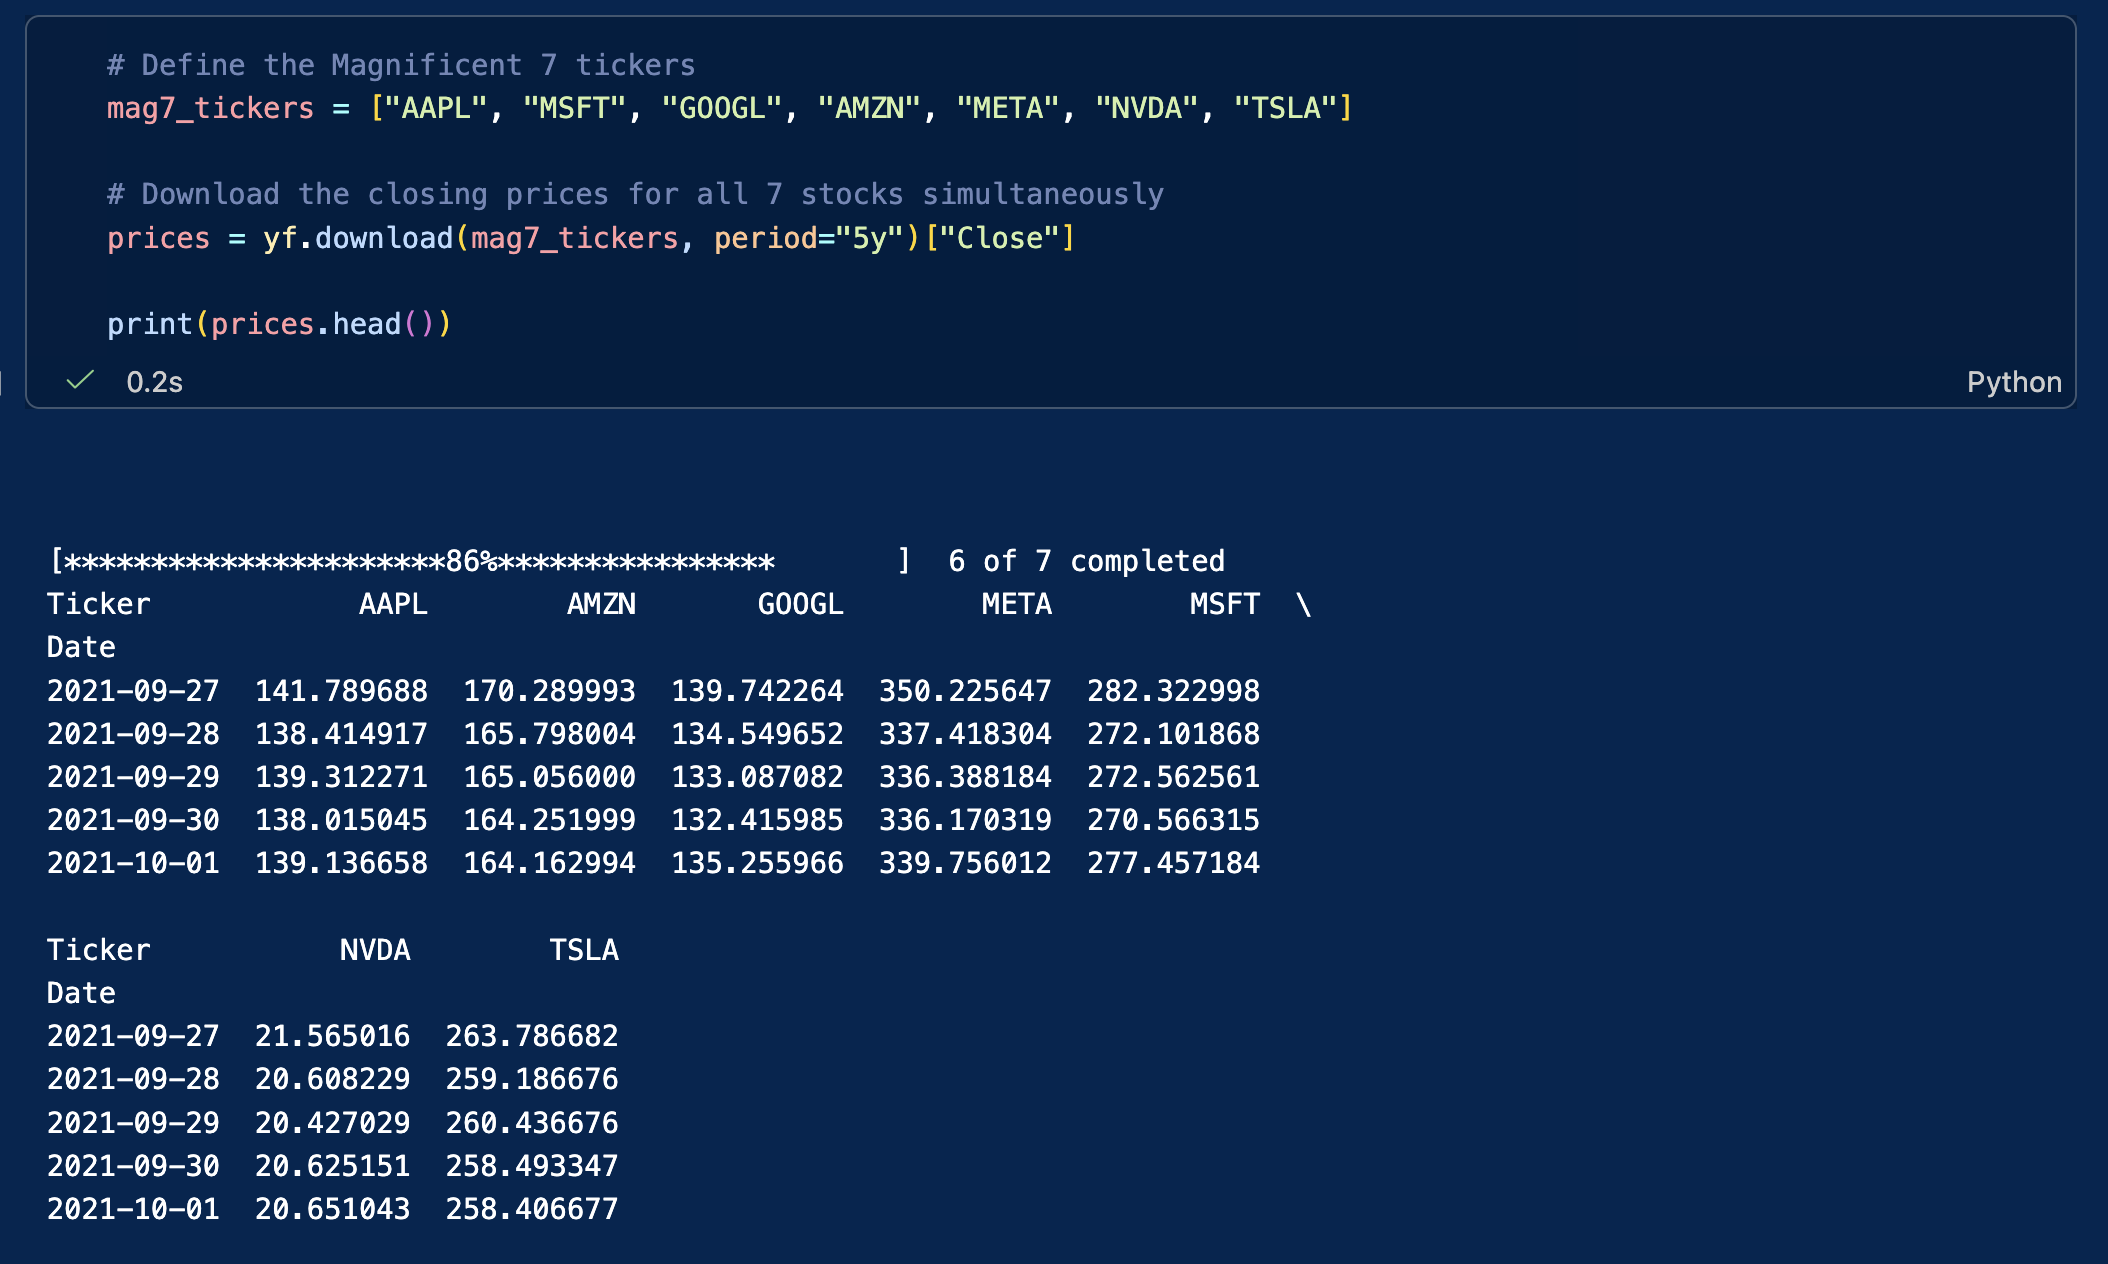
The result is now again a matrix where each column represents a stock, and each row represents a trading day.

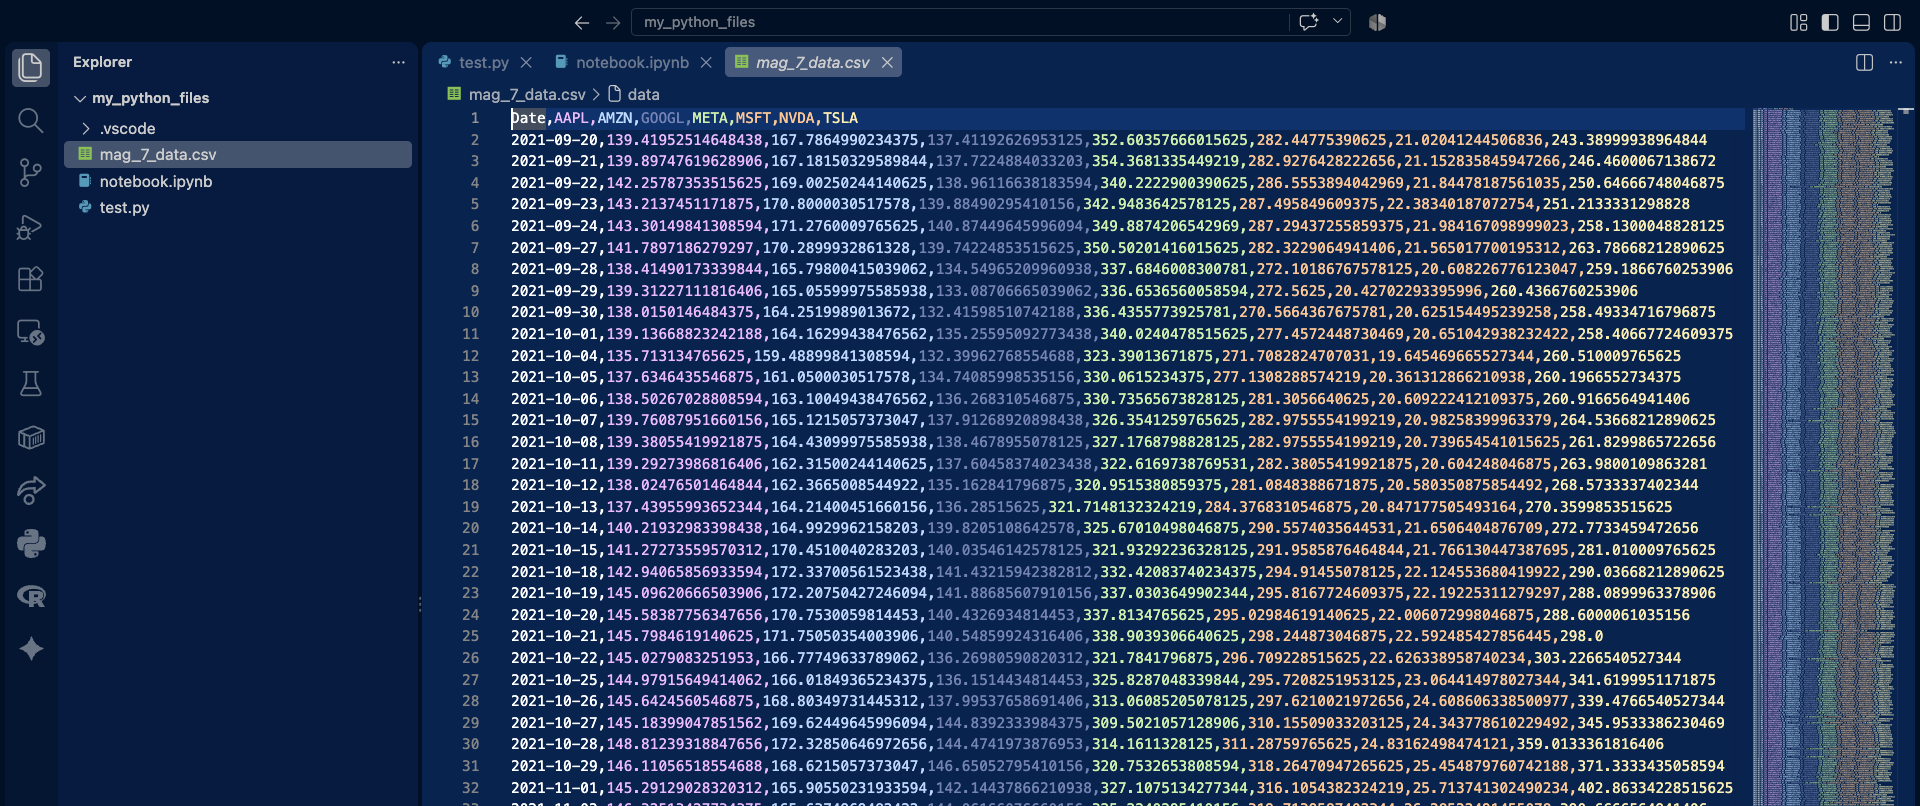
Screenshot of the output of the previous cell

This table format is ideal for portfolio analysis, benchmarking, and performance comparisons, and can be used to draw any kind of graphs.

Note that the table’s columns are displayed in two groups. Depending on the display width, Jupyter Notebook or VS Code may wrap or truncate wide DataFrames. You can export the DataFrame to a CSV file if you prefer to inspect the complete dataset in a spreadsheet application.

# save the dataframe as a csv
prices.to_csv('mag_7_data.csv')

Screenshot of the output of the previous cell

Now that you successfully downloaded your financial data, let’s see how you can clean it and then use it.

Inspecting and cleaning the dataset

Financial datasets may contain missing values (NaN) for various reasons, including differences in trading calendars, trading suspensions, listing dates, or data-provider issues. Missing observations should be identified before computing returns or risk measures. For this introductory example, we simply remove rows containing missing values. In applied financial analysis, however, the appropriate treatment depends on the source of the missing data and the objective of the analysis.

If left unaddressed, these missing data points will break your mathematical functions and severely distort your return and volatility calculations. The code below checks how many missing values exist in each column, and then removes (drops) any rows containing them. In some situations you might want to forward-fill these gaps to preserve the timeline, but dropping them is the safest thing to do for now.

# Check for missing values
print(df_aapl.isnull().sum())
# Clean missing values by dropping rows with NaNs
df_aapl = df_aapl.dropna()
# Print the first rows of the dataframe
df_aapl.head()
df_aapl.head()

A screenshot from VSC showing the output of the cleaning code cell

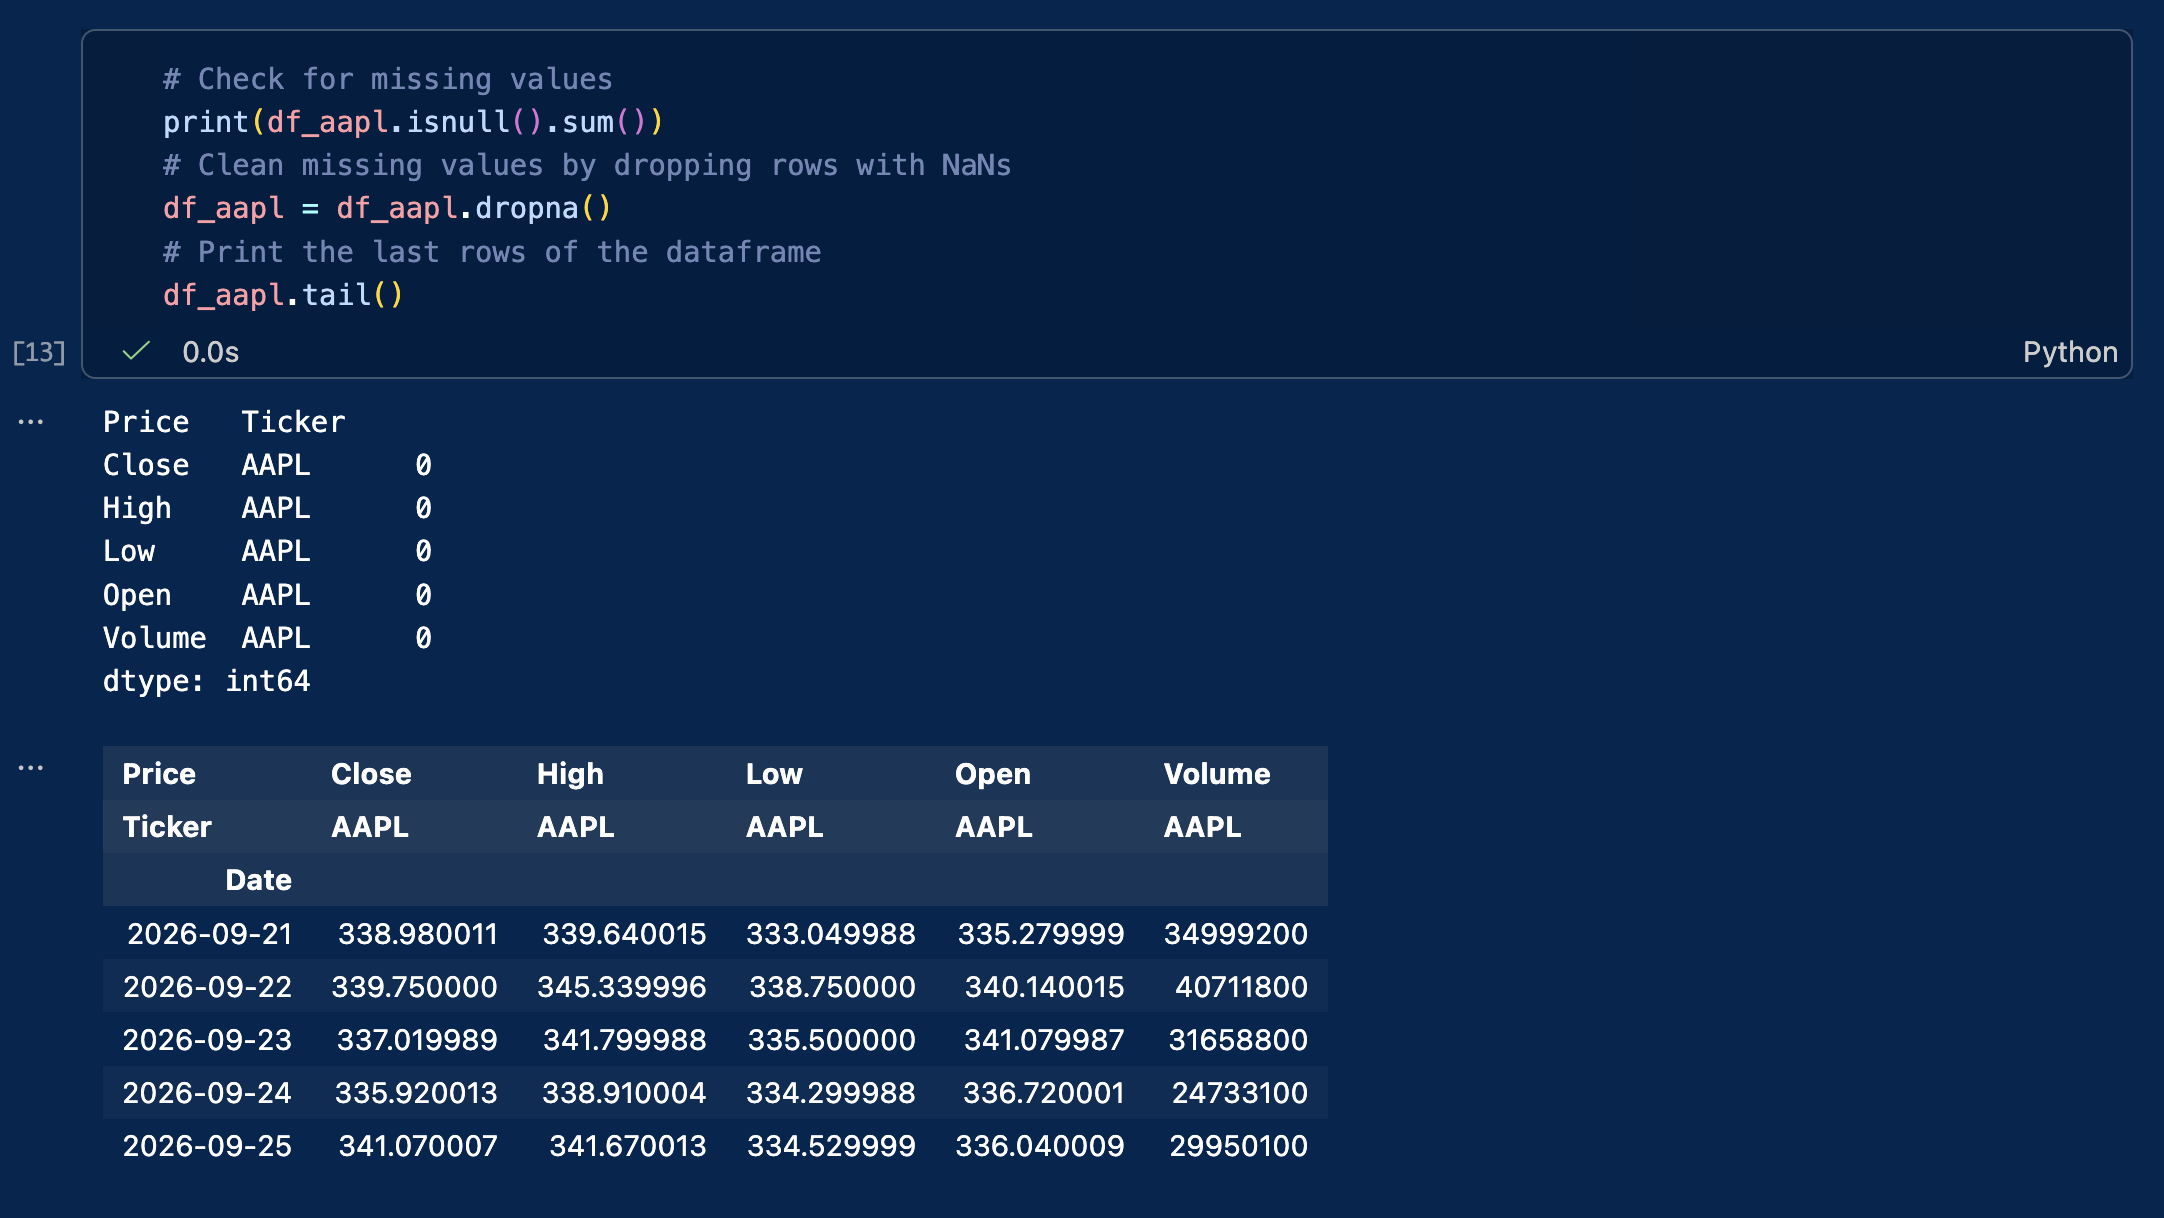
To view the last rows of the dataframe, replace head() by tail():

Output of the VSC cell when we switch to tail()

Visualizing the stock price with graphs or charts

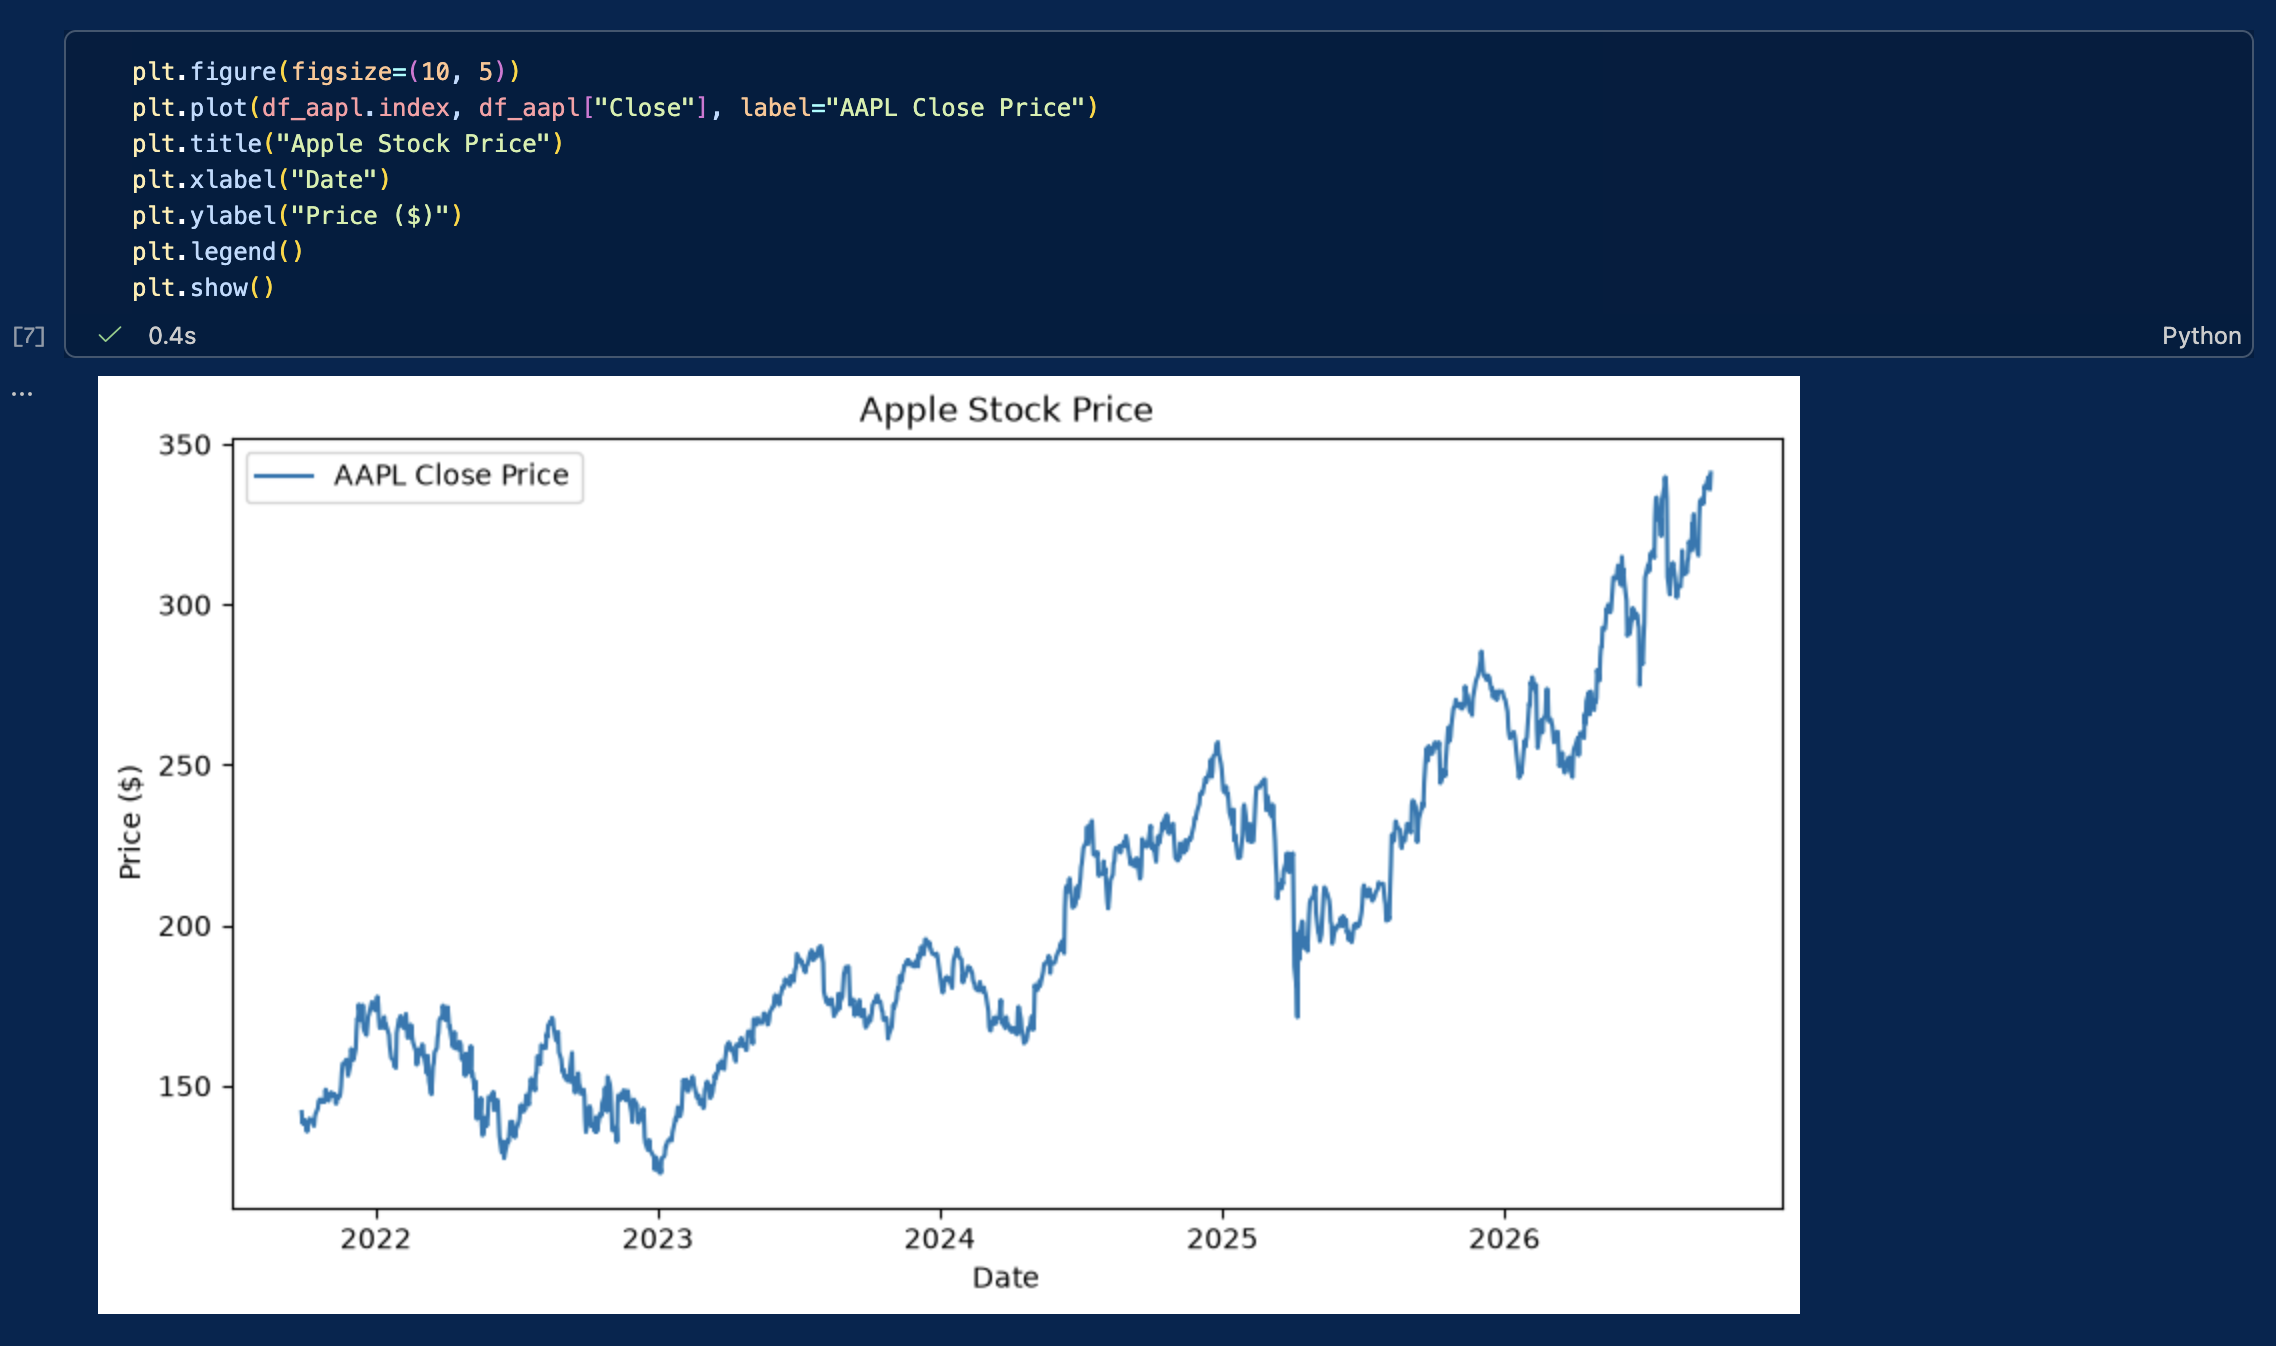
Let’s create our first graph to visualize the evolution of Apple’s stock price.

plt.figure(figsize=(10, 5))
plt.plot(df_aapl.index, df_aapl["Close"], label="AAPL Close Price")
plt.title("Apple Stock Price")
plt.xlabel("Date")
plt.ylabel("Price ($)")
plt.legend()
plt.show()

A screenshot of VSC with the stock price visualization cell output

We have now:

  • Downloaded market data from Yahoo! Finance
  • Stored and cleaned the data in a dataframe
  • Created a time-series plot to visualize stock prices

These core steps form the basis of empirical financial research and quantitative models.

Computing basic statistics & historical distributions

To evaluate stock performance and risk, we compute basic descriptive statistics for both prices and financial returns: minimum, maximum, mean, variance, standard deviation, skewness, and kurtosis. Although descriptive statistics can also be computed for price levels, risk analysis generally focuses on returns, whose distributions are more economically meaningful.

# Calculate daily percentage returns
df_aapl['Return'] = df_aapl['Close'].pct_change()

# Compute summary statistics for Price and Returns
stats_df = pd.DataFrame({
    'Metric': ['Min', 'Max', 'Mean', 'Variance', 'Std Dev', 'Skewness', 'Kurtosis'],
    'Price ($)': [
        df_aapl['Close'].min().item(),
        df_aapl['Close'].max().item(),
        df_aapl['Close'].mean().item(),
        df_aapl['Close'].var().item(),
        df_aapl['Close'].std().item(),
        df_aapl['Close'].skew().item(),
        df_aapl['Close'].kurtosis().item()
    ],
    'Daily Return': [
        df_aapl['Return'].min().item(),
        df_aapl['Return'].max().item(),
        df_aapl['Return'].mean().item(),
        df_aapl['Return'].var().item(),
        df_aapl['Return'].std().item(),
        df_aapl['Return'].skew().item(),
        df_aapl['Return'].kurtosis().item()
    ]
})

print(stats_df)

Plotting historical distributions

Histograms display the frequency distribution of prices and daily returns, helping us inspect price trends, distribution symmetry, and tail risks.

fig, axes = plt.subplots(1, 2, figsize=(14, 5))

# Price distribution
axes[0].hist(df_aapl['Close'].dropna(), bins=30, color='skyblue', edgecolor='black')
axes[0].set_title('Historical Price Distribution')
axes[0].set_xlabel('Price ($)')
axes[0].set_ylabel('Frequency')

# Return distribution
axes[1].hist(df_aapl['Return'].dropna(), bins=50, color='salmon', edgecolor='black')
axes[1].set_title('Historical Daily Return Distribution')
axes[1].set_xlabel('Daily Return')
axes[1].set_ylabel('Frequency')

plt.tight_layout()
plt.show()

Normalizing stock prices and computing returns

All stocks have different nominal prices. If Tesla trades at $350 and Nvidia at $220, it does not mean that Tesla is worth more than Nvidia or performed better.

To establish an accurate comparison across these assets, we must execute two fundamental computations:

  1. Price harmonization: we normalize all historical time series to a base index of 100, to ensure a standardized starting point.
  2. Return calculation: we compute the periodic returns to get the actual performance in % rather than the absolute variation.
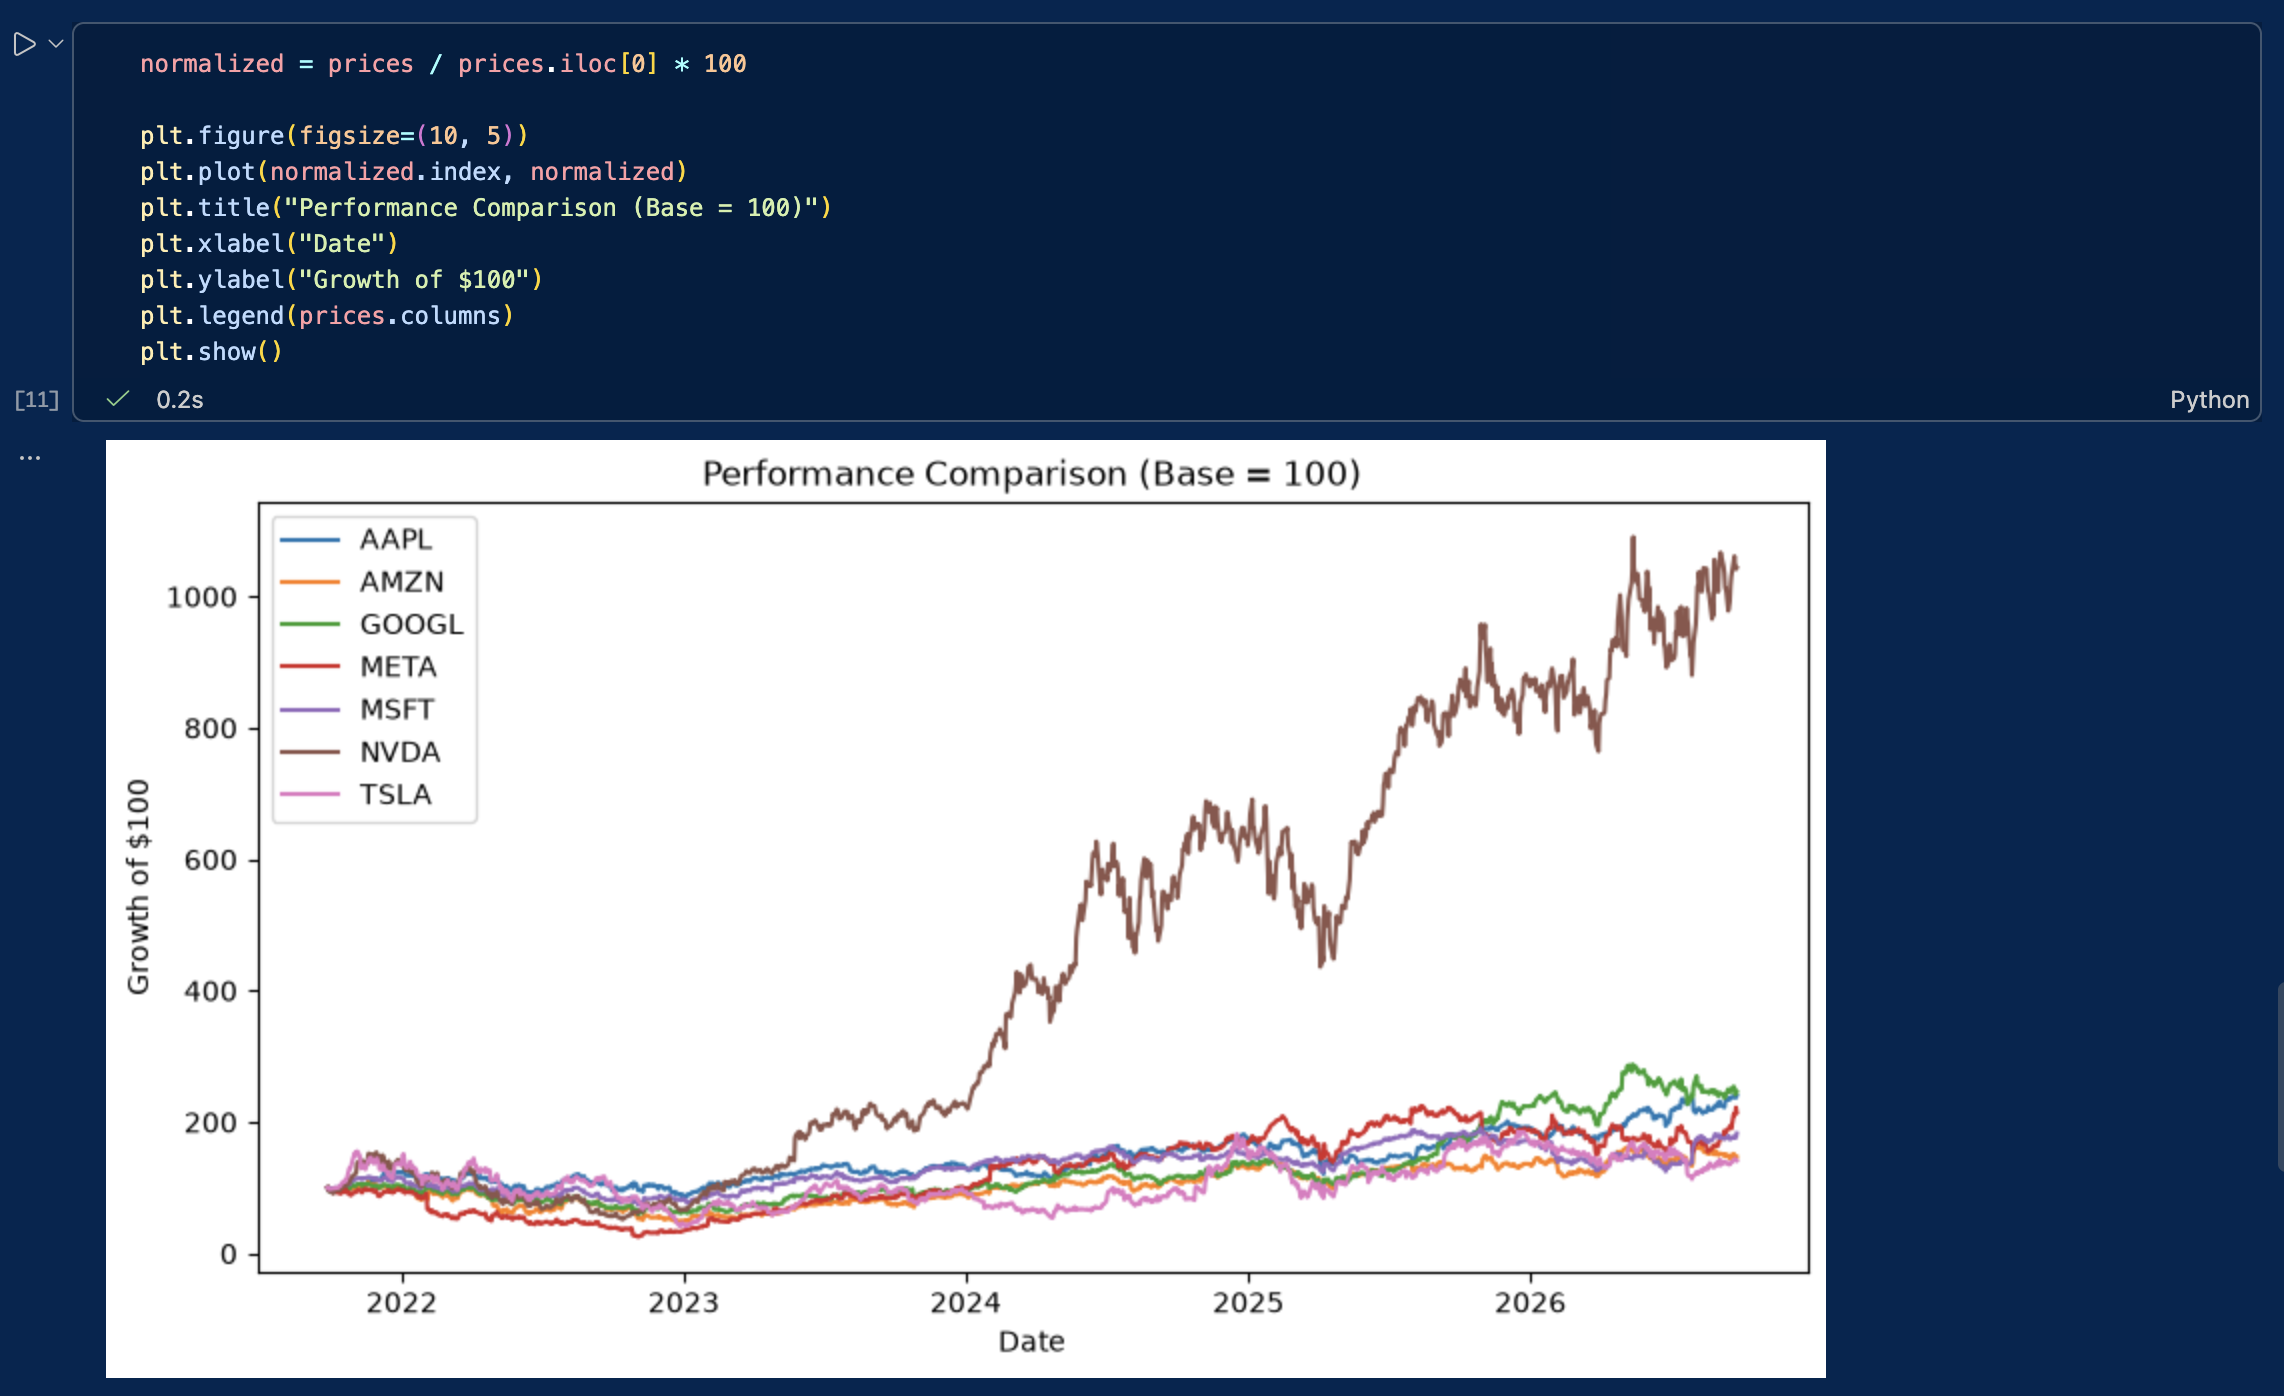
normalized = prices / prices.iloc[0] * 100

plt.figure(figsize=(10, 5))
plt.plot(normalized.index, normalized)
plt.title("Performance Comparison (Base = 100)")
plt.xlabel("Date")
plt.ylabel("Growth of $100")
plt.legend(prices.columns)
plt.show()

the output of the previous cell

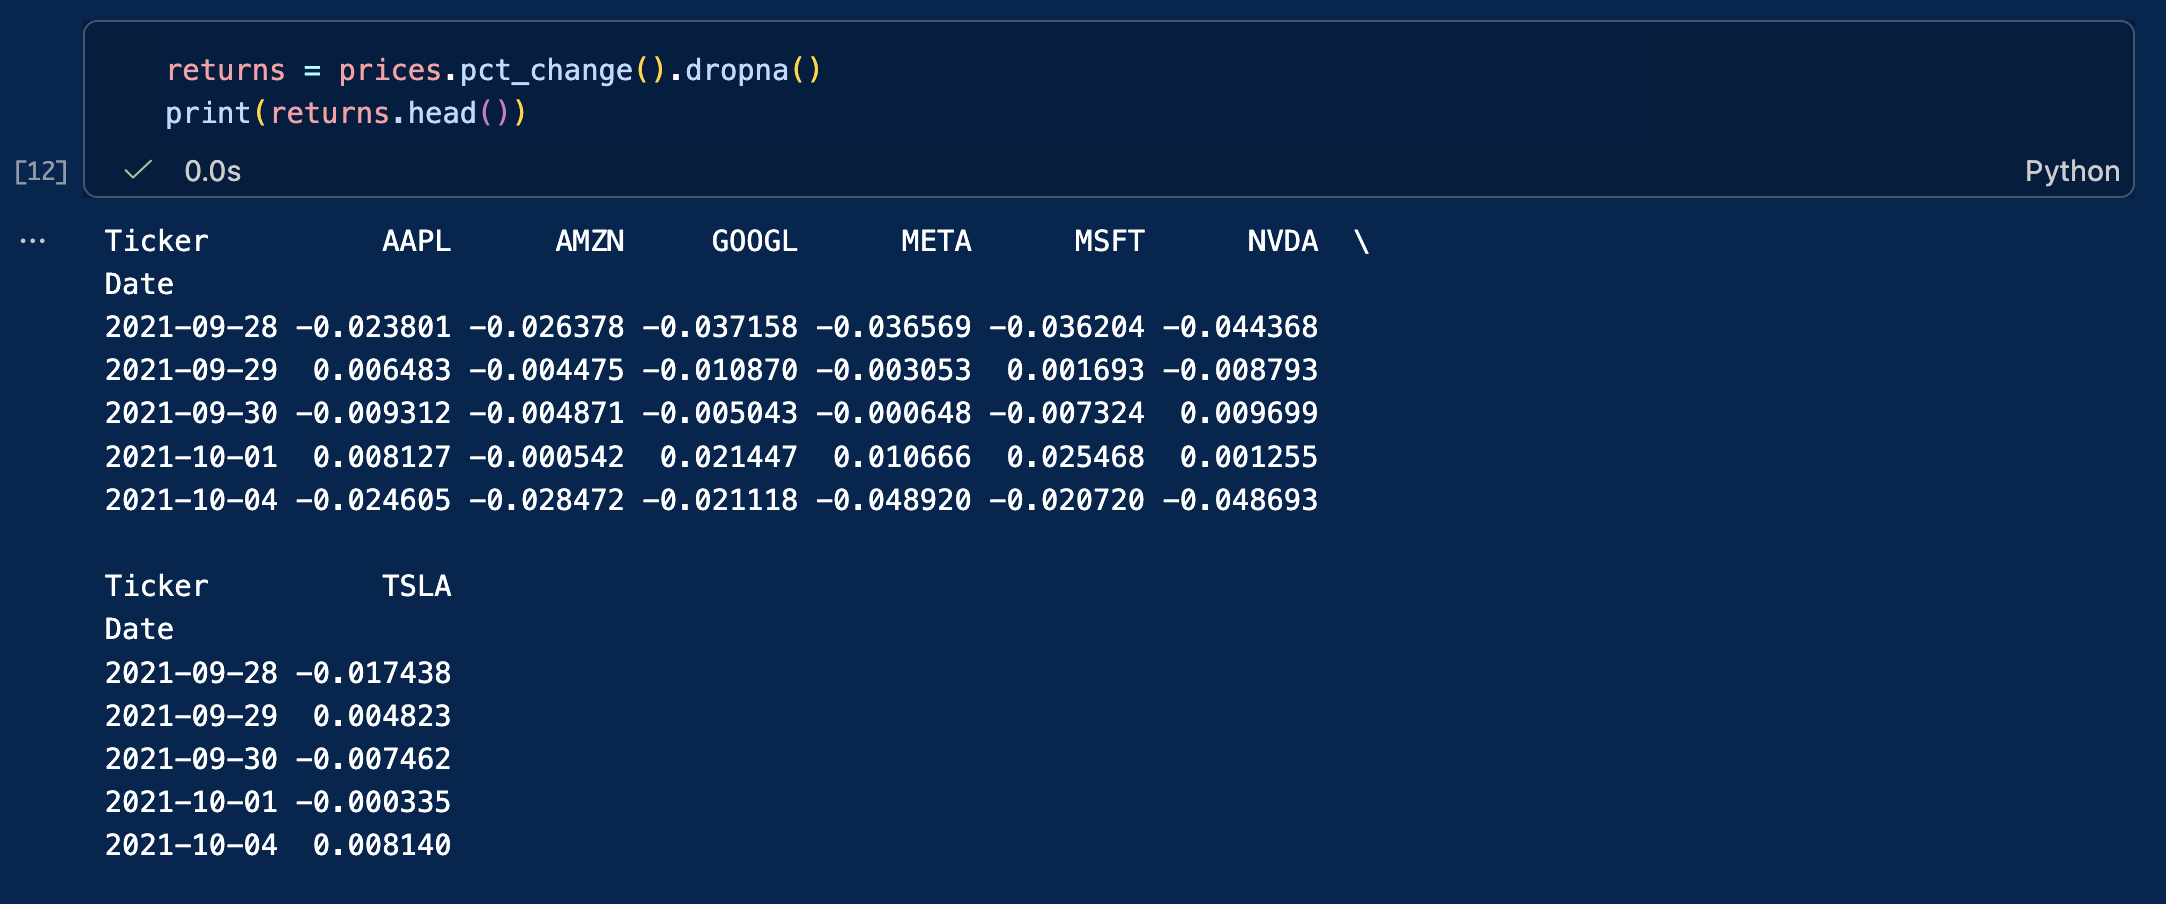
We can also compute daily returns across all stocks:

returns = prices.pct_change().dropna()
print(returns.head())

the output of the previous cell

The chart now shows how much each investment would have grown from the same starting value.

This is a standard technique used by portfolio managers and equity analysts.

Case study: the Capital Asset Pricing Model (CAPM)

In empirical finance, evaluating an individual asset requires isolating the return generated by the broader market from the return specific to the company itself. The Capital Asset Pricing Model (CAPM) provides the foundational framework to decompose this risk.

The model decomposes the return of an individual asset over a given time period into three components: the risk-free rate, a market systematic factor and a firm-specific factor. The model is expressed through the following equation:

rt = rf + β(rm – rf) + εt

Where:

  • rt is the return of the stock (e.g., Apple).
  • rf is the risk-free interest rate (e.g., the 13-week Treasury Bill, ^IRX).
  • β (Beta) represents the stock’s sensitivity to market movements (systematic risk).
  • rm – rf is the excess return of the market index (e.g., the S&P 500, ^GSPC).
  • εt (Epsilon) represents the idiosyncratic return associated with firm-specific risk not explained by the market.

By downloading these three time series simultaneously, we can calculate the stock’s Beta and isolate its firm-specific residual risk.

# Download asset (AAPL), market benchmark (S&P 500), and risk-free rate (13-week T-Bill)
market_data = yf.download(["AAPL", "^GSPC", "^IRX"], start="2022-01-01", end="2024-12-31")["Close"].dropna()

# Compute daily percentage returns for the stock and the market
returns_df = market_data[["AAPL", "^GSPC"]].pct_change().dropna()
 
# Convert the annualized risk-free yield (^IRX) to a daily rate
daily_rf = (market_data["^IRX"] / 100) / 252
returns_df["Rf"] = daily_rf
 
# Calculate the excess returns: (r_t - r_f) and (r_m - r_f)
excess_aapl = returns_df["AAPL"] - returns_df["Rf"]
excess_market = returns_df["^GSPC"] - returns_df["Rf"]
 
# Compute Market Beta: Covariance(stock, market) / Variance(market)
cov_matrix = np.cov(excess_aapl, excess_market)
beta = cov_matrix[0, 1] / cov_matrix[1, 1]
 
# Isolate Epsilon (the firm-specific residual risk)
# Rearranging the CAPM equation: epsilon = (r_t - r_f) - beta * (r_m - r_f)
epsilon = excess_aapl - (beta * excess_market)
 
print(f"Calculated Beta: {beta:.4f}")
print(f"Mean Firm-Specific Return (Epsilon): {epsilon.mean():.6f}")
print(f"Idiosyncratic Risk (Epsilon Std Dev): {epsilon.std():.4f}")

Common pitfalls

When working with market data, beginners often run into the same issues:

  • Using the wrong ticker symbol
  • Comparing stocks without normalizing prices
  • Forgetting that markets are closed on weekends and holidays
  • Failing to clean and handle missing values (NaN) in the dataset
  • Failing to check whether price series are raw or adjusted for stock splits and dividends

Overall, always inspect and clean your data before starting your analysis.

Exercises

Exercise 1: Basic data retrieval and price visualization (MSFT)

Microsoft is a mature mega-cap technology company, and a cornerstone of most global equity portfolios. Retrieving and inspecting its historical data is a perfect starting point to practice basic YFinance commands.

Using the ticker symbol MSFT, download the last five years of daily market data.

Your tasks:

  • Use the appropriate pandas functions to display the first 5 rows and the last 5 rows of the dataset to verify data integrity (checking for correct start/end dates).
  • Generate a line chart plotting the closing price over the entire 5-year period to visualize its long-term market trend.

Exercise 2: time-series extraction and volume analysis on Tesla (TSLA)

Tesla is renowned for its high historical volatility and massive retail trading interest. The 2022-2024 window was particularly eventful for growth and electric vehicle stocks, marked by shifting supply chains and a rapid rise in interest rates. Isolating this exact timeframe allows us to analyze the stock’s behavior under changing macroeconomic conditions.

Using the ticker symbol TSLA, extract the market data for the precise calendar period from January 1, 2022, to December 31, 2024 (using the start and end parameters).

Your tasks:

  • Identify the peak (highest closing price) and the trough (lowest closing price) over this period to grasp the magnitude of the stock’s price swings.
  • Calculate the average daily trading volume, a fundamental metric used by analysts to assess market liquidity and ongoing investor interest.

Exercise 3: Comparative performance and risk profiling on Chinese tech companies

Chinese technology stocks often experience unique market cycles driven by distinct domestic regulatory environments and macroeconomic factors. Using their US-listed ADRs (American Depositary Receipts), compare the performance and risk characteristics of three major players over the last five years:

  • Alibaba (BABA)
  • Baidu (BIDU)
  • PDD Holdings (PDD)

Questions:

  1. Which stock achieved the highest total cumulative return?
  2. Which stock was most volatile (highest standard deviation of daily returns)?
  3. Which one offered the best risk-adjusted profile (e.g., highest Sharpe ratio) over the period?

Download the solutions

To help you check your work and experiment further, you can download the complete Jupyter Notebook containing the full code, charts, and commentary for all exercises.

Download Solutions (.ipynb)

Once downloaded, change the file’s extension from .txt to .ipynb and open it in Visual Studio code.

What’s next?

Now that you know how to download financial data, perform basic computations, and control for market risk, you are ready to delve into advanced quantitative and corporate finance topics.

About the author

This article was written in September 2026 by Hadrien PUCHE (ESSEC Business School, Grande École Program, Master in Management, 2023-2027).

   ▶ Discover all posts by Hadrien PUCHE
How to install and run Python on your computer (a step-by-step guide)

Hadrien Puche

In finance, the ability to rapidly acquire, clean, and manipulate data is a key skill that can help you gain an edge over other students and job applicants. While Excel (with VBA) remains widely used and is sufficient for most basic financial modeling, such as a DCF valuation, Python offers far more scalability, automation, and mathematical power than Excel.

In this article, Hadrien PUCHE (ESSEC Business School, Grande École Program, Master in Management, 2023-2027) will help you to:

  • Understand the core components of a Python environment for finance
  • Choose the most secure and efficient development setup for financial data
  • Install Miniconda and manage isolated virtual environments
  • Set up Visual Studio Code (VS Code) as your primary coding workspace
  • Run a test script to download and visualize real stock market data

No computer science background is required to start using Python.

Quick vocabulary for beginners

Before we dive in, let’s demystify a few technical terms you will encounter frequently:

  • Python: A popular, high-level programming language created in 1991 by Guido van Rossum (and named after the BBC comedy series Monty Python’s Flying Circus). Today, Python is widely used in quantitative finance and data science because of its simple syntax and vast ecosystem of financial tools.
  • Library / Package: A collection of pre-written code created by other developers so you don’t have to reinvent the wheel (e.g., pandas for data tables, yfinance for downloading stock market prices).
  • Dependency: A package that another package needs in order to work properly.
  • Environment: An isolated “sandbox” on your computer containing a specific version of Python and specific libraries, preventing projects from interfering with one another.
  • IDE (Integrated Development Environment): The visual software app where you write, edit, and test your code (e.g., Visual Studio Code).
  • Extension: An add-on (like an app from an App Store) that adds extra features to your IDE.

In this first article, we will focus on helping you set up Python on your computer so that you can start learning how to use it. We will guide you step by step through setting up a professional local workspace and testing that everything is working properly. Once that is done, you will find a list of follow-up articles at the end to explore real-world financial use cases.

Choosing your development environment

A development environment is simply the ecosystem of software tools you use to write, manage, and execute your code. When selecting a workspace for Python, you have three main choices:

  • Local workspaces (like Visual Studio Code): The standard choice for finance. Running your code locally (on your own computer) gives you full control over your local file systems, execution speed, and (most importantly) data privacy. In finance, working with proprietary trading algorithms or confidential client data means you cannot upload sensitive information to unvetted third-party servers.
  • Cloud notebooks (like Google Colab): Cloud platforms are convenient for quick experiments because they require zero installation. However, they are generally unsuitable for professional financial workflows. You do not have full control over code execution or environment stability, and uploading confidential financial datasets or proprietary logic to public cloud infrastructure poses significant security and compliance risks.
  • AI-native code editors (like Cursor or Windsurf): These editors heavily integrate AI to generate code automatically. While powerful for experienced developers, relying on AI tools too early prevents beginners from learning core programming logic, syntax, and debugging skills. It is far better to understand the core mechanics manually first.

In this article, we will focus exclusively on establishing a local workspace using Visual Studio Code (VS Code),which is a widely used tool to get comfortable with professional Python coding.

We will also use Jupyter Notebooks (files ending in .ipynb). Unlike traditional Python scripts (files ending in .py) that execute the entire code at once, Jupyter Notebooks allow you to write and run code in individual “cells.” This block-by-block structure is especially powerful in finance for several reasons:

  • Isolating code: You can work on and execute specific parts of your code independently (e.g., downloading data once, then tweaking the math in a separate cell without re-downloading).
  • Immediate feedback: Data tables, charts, and outputs are displayed directly below the specific cell you just ran, and you do not have to execute the entire code each time.
  • Easier debugging: By testing your logic piece-by-piece, identifying and fixing errors becomes significantly faster.
  • Better examples, tutorials, or exercises: You can mix executable code with explanatory text and financial formulas, making it the perfect format for case studies and tutorials.

As your code grows, using a Jupyter Notebook will be more and more useful.

What you need to install (and why)

Before installing anything, let’s understand how the different components of your workspace fit together:

  • Miniconda (which includes Python & Conda): Python comes with a comprehensive standard library, but financial and data analysis typically require additional packages such as pandas, NumPy, matplotlib, and yfinance. To perform financial analysis, you need external packages/libraries like pandas or yfinance. Conda is a tool that manages these packages and isolates them into dedicated virtual environments.
    Note on Anaconda vs. Miniconda: Anaconda is a big download that comes bundled with hundreds of packages you may never use. I suggest using Miniconda because it is a lightweight version, containing only Conda and Python, allowing us to keep your setup clean and fast.
  • Virtual Environments: Why do we need them? If you install every package into one single base Python installation, different projects will eventually require conflicting versions of the same library (a “dependency collision”), causing your scripts to crash. Virtual environments keep each project’s tools safely separated.
  • Visual Studio Code (VS Code): A clean user interface where you write, edit, and debug your code. VS Code connects seamlessly to your Conda virtual environment to execute your scripts.

How the architecture works

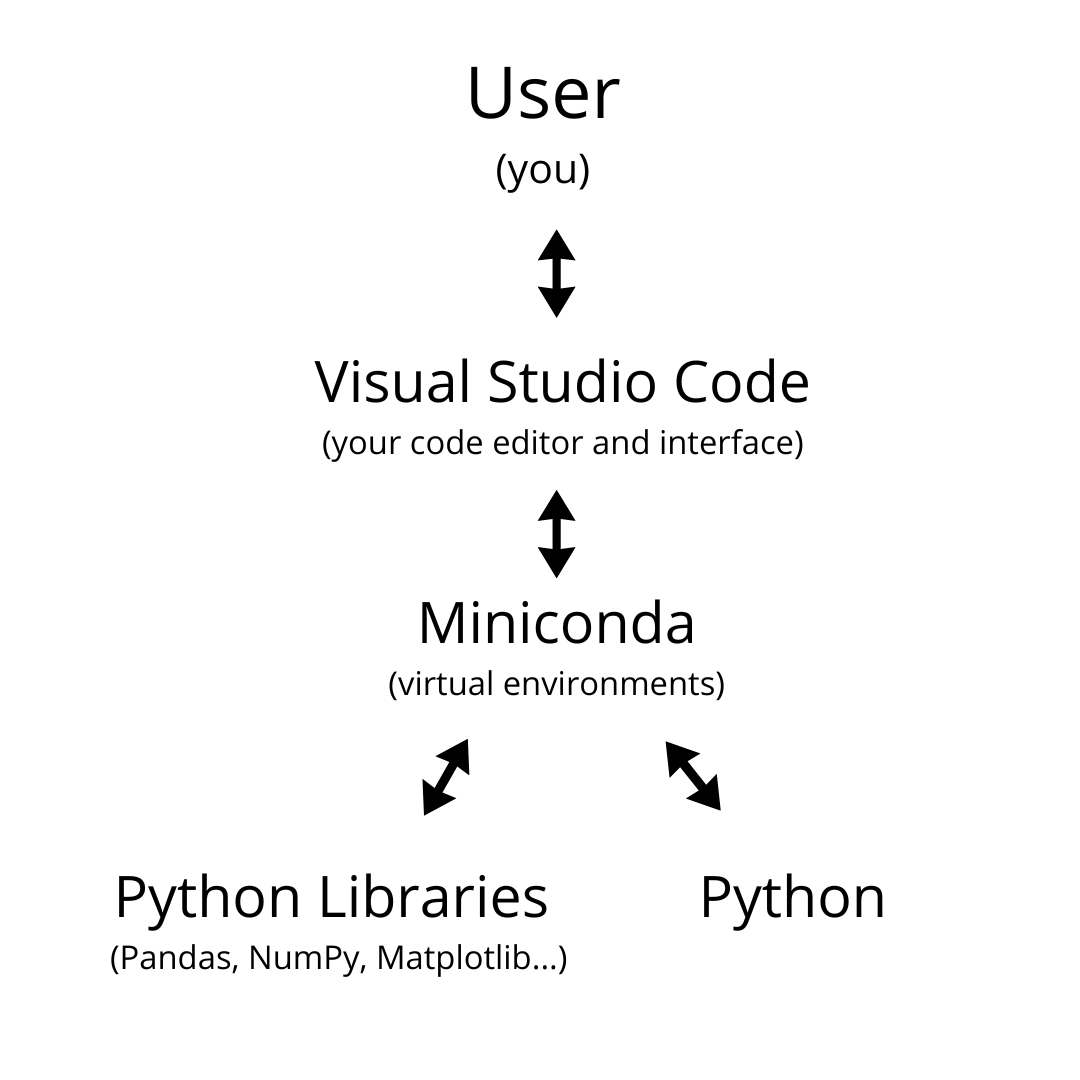
The diagram below illustrates how your development setup functions:

A graph showing the links between the user, VS Code, Miniconda, and Python.
Figure 1: How the User, VS Code, Miniconda Environment, and Python Engine interact.

  • You (the User) interact directly with VS Code to write commands and inspect results.
  • VS Code sends your code to your isolated Miniconda Virtual Environment (e.g., my_environment that you can create to store the packages that you will use in your own code).
  • Inside this environment, the Python Engine processes the math and logic, drawing upon the installed financial libraries (like yfinance and pandas).
  • The execution results (tables, charts, output logs) are sent back to VS Code for you to view.

As a fun side note: you can technically write code in almost any text editor! For a fun take on how far you could take this, check out this video.

Step-by-step installation guide

Step 1: Install Miniconda (Python + Conda)

Conveniently, downloading and installing Miniconda automatically installs Python, so this will be our first step.

Head to the official Miniconda Download Page, select the installer for your operating system (Windows or macOS), and complete the installation using the recommended default settings.

Step 2: Install Visual Studio Code and Extensions

Visual Studio Code (VS Code) will serve as your Integrated Development Environment (IDE). As a quick reminder, an IDE is the main visual software application, where you will actually write, edit, test, and debug your code. You can think of it as the central command dashboard for all your financial programming projects.

  1. Download & Install: Go to the official VS Code website, download the installer for Windows or macOS, and follow the standard installation instructions.
  2. Install Essential Extensions: Launch VS Code. Click on the Extensions icon on the left-hand Activity Bar (or press Ctrl+Shift+X on Windows / Cmd+Shift+X on Mac). Think of extensions as add-ons from an app store that give VS Code superpowers. Search for and install:
    • Python (by Microsoft) – Provides syntax highlighting, code completion, and interpreter selection.
    • Jupyter (by Microsoft) – Enables interactive execution of code cells inside .ipynb notebook files.

VS Code Extensions Marketplace showing Python extension by Microsoft
Make sure to install the official Python and Jupyter extensions in VS Code.

Step 3: Create your virtual environment via the Terminal

Now, we will create a clean, isolated Conda environment named my_environment where our financial packages will live.

  1. Open your command line interface:
    • Windows 11 / 10: Open the Start menu, search for Anaconda Prompt, and click to open it. (Alternatively, you can open Windows Terminal / PowerShell, but Anaconda Prompt automatically initializes Conda for you).
    • macOS: Open the Terminal app (press Cmd + Space, type “Terminal”, and press Enter).
  2. Run the following Conda & pip commands one by one:
# 1. Create an isolated environment named ‘my_environment’ with Python 3.11 conda create –name my_environment python=3.11 -y # 2. Activate your new environment conda activate my_environment # 3. Upgrade pip and install core financial analysis libraries pip install –upgrade yfinance pandas numpy matplotlib notebook –no-cache-dir

Pro-tip: Whenever you need to install additional packages in the future, open your terminal, activate your environment (conda activate my_environment), and run pip install [package_name].

Step 4: Connect VS Code to your environment

Now that your environment and libraries are ready, you need to tell VS Code to use my_environment to run your code.

  1. Open a workspace folder: In VS Code, go to File > Open Folder… and select or create a dedicated folder on your computer (e.g., finance_python). It does not matter where it is, you simply need somewhere to store your code files.
  2. Create your files: Click the New File icon in the Explorer sidebar to create two files:
    • test.py (.py file is to store Python code)
    • notebook.ipynb (.ipynb is the file extension name used for Jupyter notebooks)
  3. Select the Python interpreter: Open test.py. Press Ctrl+Shift+P (Windows) or Cmd+Shift+P (macOS) to open the Command Palette, type Python: Select Interpreter, and press Enter.
    • VS Code should automatically list my_environment. Click on it.
    • If it doesn’t appear automatically: Click Enter interpreter path… > Find… and navigate directly to the executable file:
      • Windows: C:\Users\YourUsername\miniconda3\envs\my_environment\python.exe
      • macOS: /Users/YourUsername/miniconda3/envs/my_environment/bin/python3
  4. Select Jupyter Kernel: Open notebook.ipynb. Click Select Kernel in the top-right corner of the window, choose Python Environments…, and select your my_environment path.

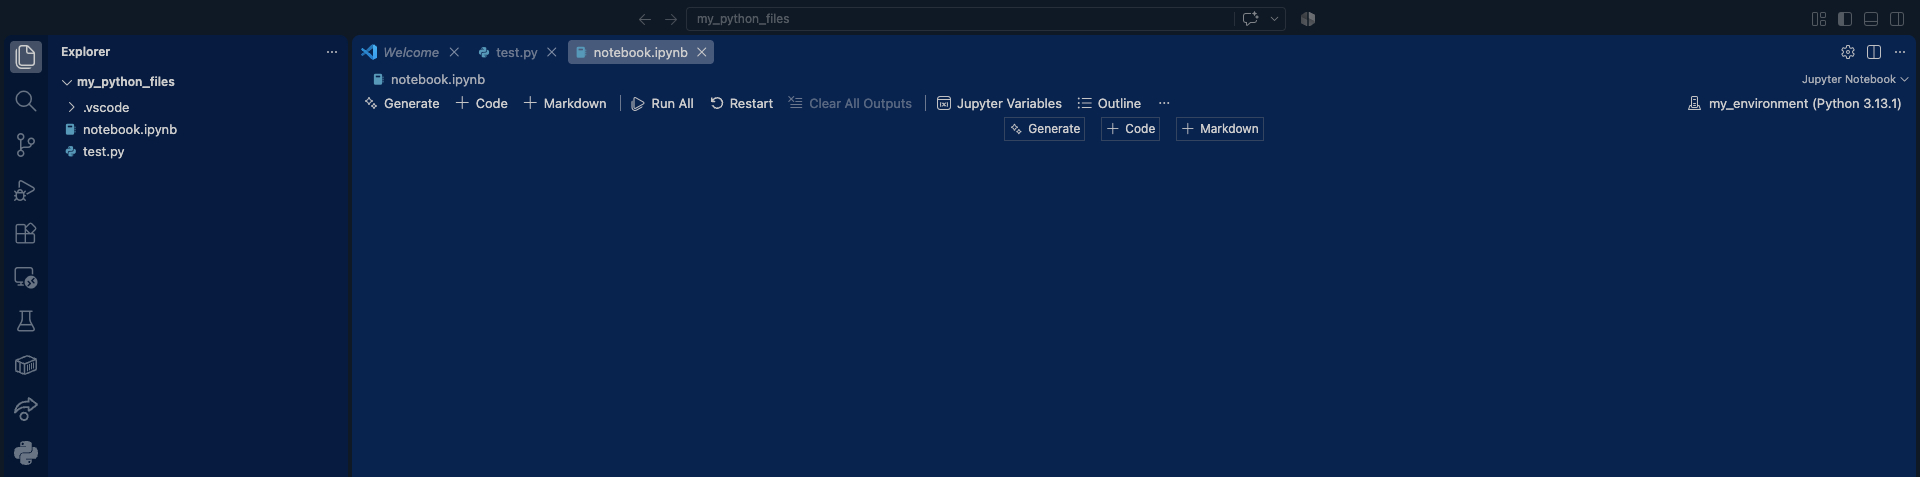
An image of the VS Code menu with notebook.ipynb and test.py created
Once this is done, your IDE should look just like this.

Quick Troubleshooting Tips:
  • “No matching commands” error: If typing Python: Select Interpreter gives no results, click inside the test.py editor window first to wake up the Python extension, or click Select Python Interpreter in the bottom-right status bar.
  • Environment missing from the list: Make sure you activated the environment in terminal at least once, or use the direct path navigation detailed above.

Testing your installation

Now that VS Code is connected to my_environment, let’s run a simple test script to confirm that our setup can successfully fetch market data and display a stock chart. Open test.py or notebook.ipynb, paste the code below, and execute it:

# Import yfinance to download stock market data directly from Yahoo Finance
import yfinance as yf

# Import matplotlib.pyplot (aliased as 'plt') to create financial charts and plots
import matplotlib.pyplot as plt

# Download historical stock data for Apple Inc. (AAPL)
print("Fetching financial data from Yahoo Finance using yfinance...")
df = yf.download('AAPL', start='2023-01-01', end='2024-01-01')

# Display the first 5 rows of the downloaded data in the terminal / output window
print("\nFirst 5 rows of AAPL market data:")
print(df.head())

# Plot historical closing prices
plt.figure(figsize=(10, 5))
plt.plot(df['Close'], label='AAPL Close Price', color='#1d4ed8', linewidth=1.5)
plt.title('Apple Inc. (AAPL) Historical Close Prices - 2023')
plt.xlabel('Date')
plt.ylabel('Price ($)')
plt.grid(True, linestyle='--', alpha=0.5)
plt.legend()
plt.show()

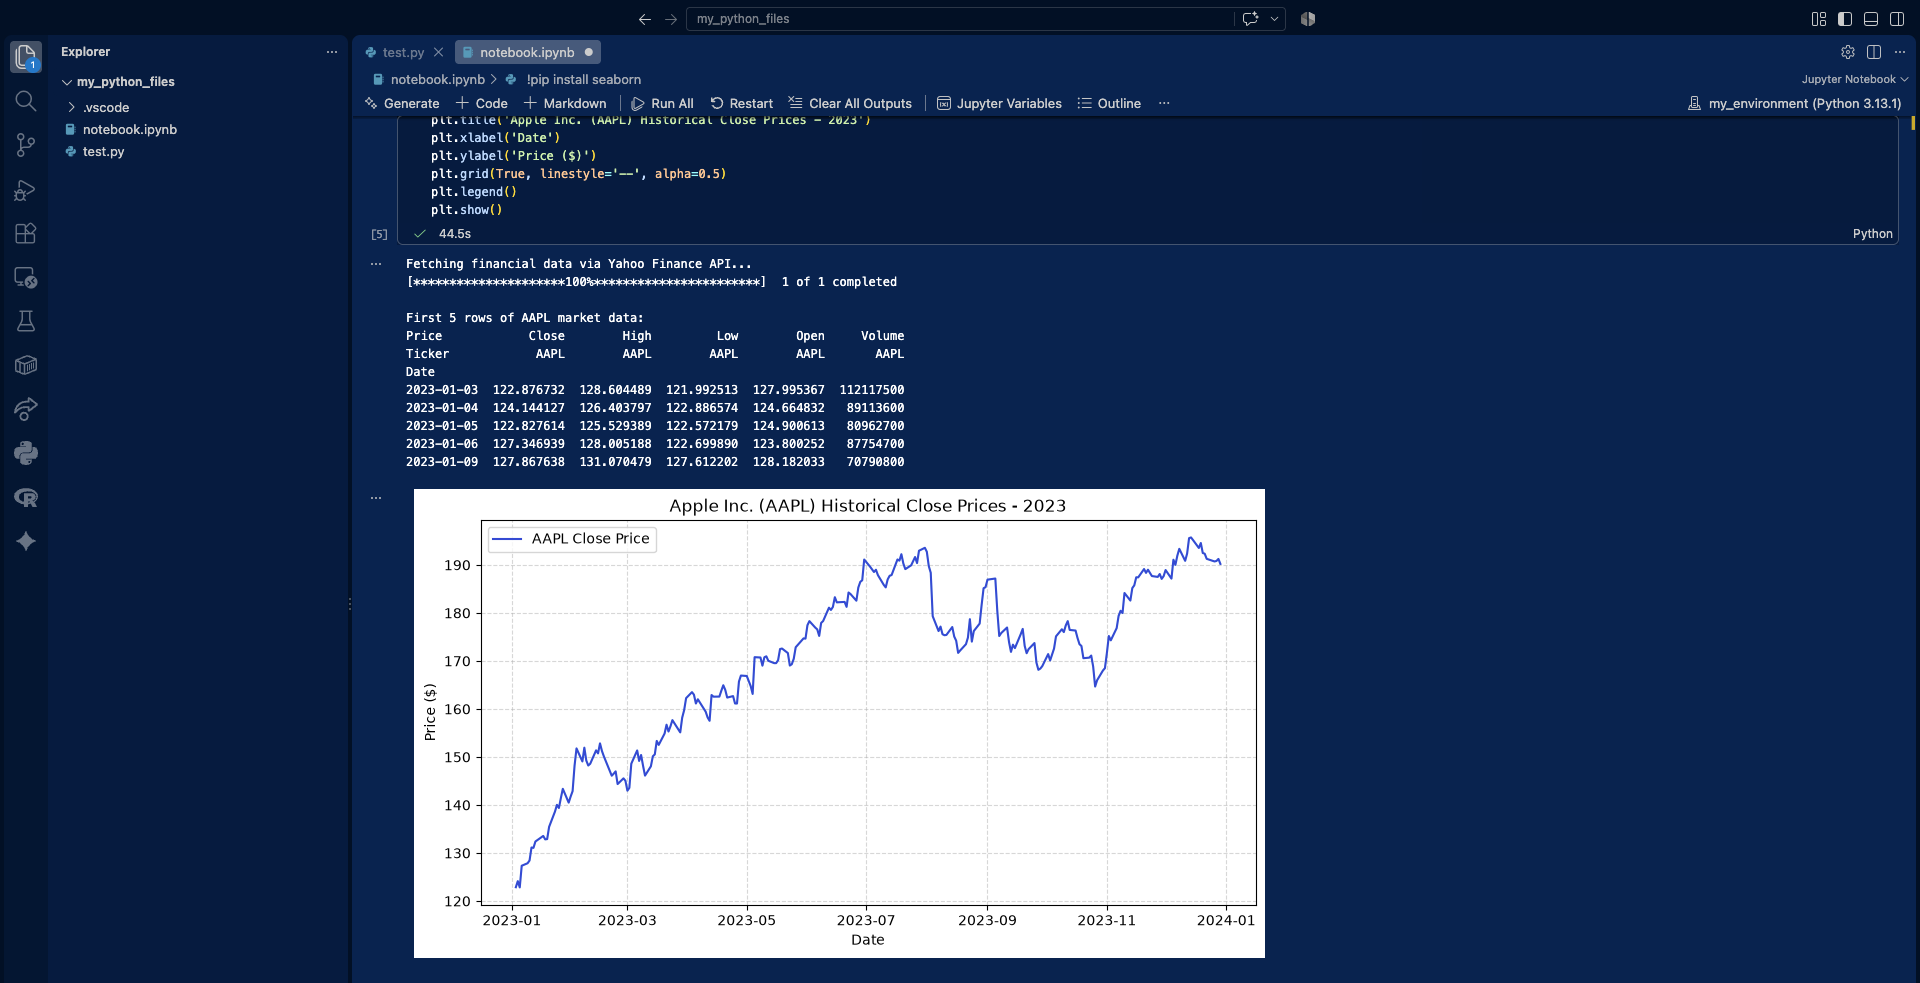
If the market dataset downloads and a clean line chart of Apple’s stock price appears, congratulations! You have successfully configured a professional, local Python environment for financial engineering.

This is how the output should look like if everything is working correctly:

An image of the VS Code menu with notebook.ipynb and test.py created

Congratulations! You have successfully configured a professional, local Python environment, ready for financial engineering

A quick tip for installing additional packages

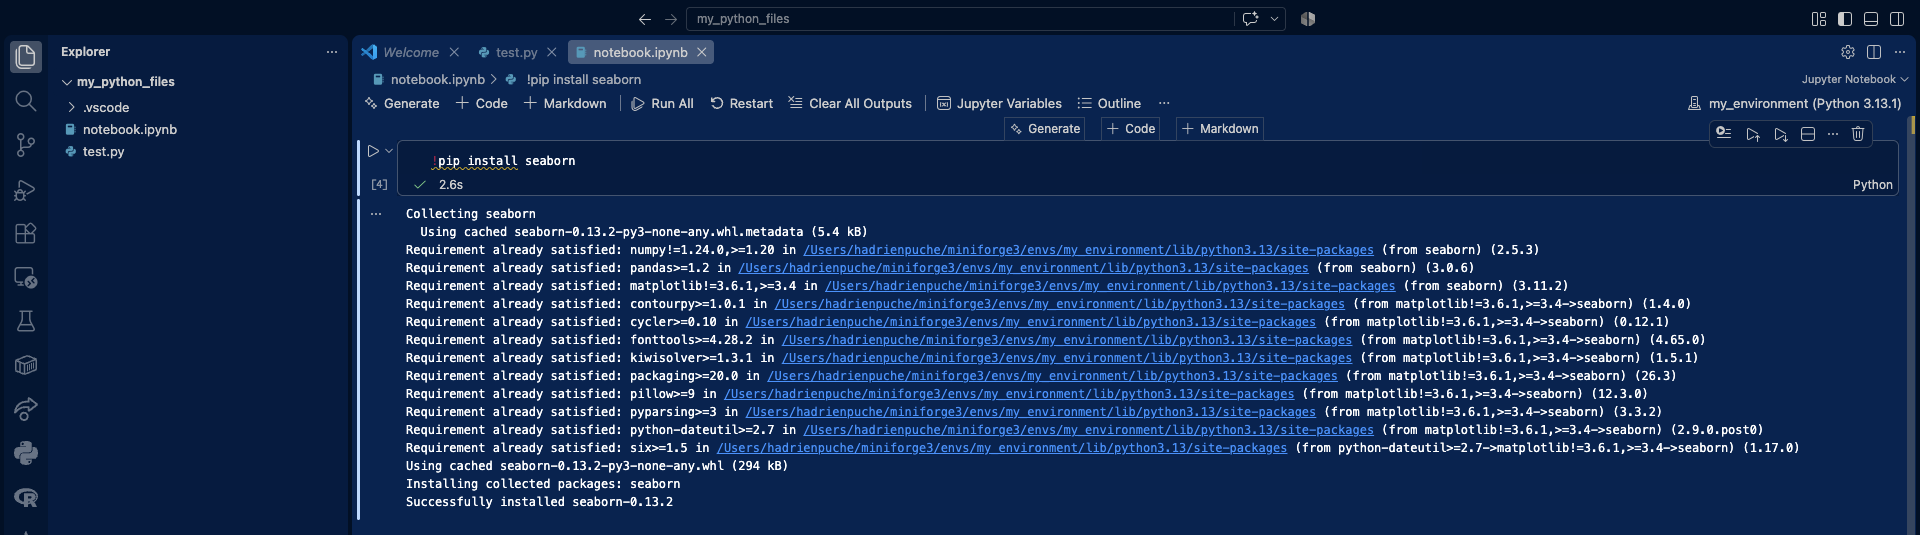
As you have seen, packages such as yfinance, matplotlib, and pandas extend Python with useful functionality for financial analysis. If you need to install an additional package while working in a Jupyter Notebook, you can use the %pip command directly in a notebook cell, provided that the appropriate Python environment is selected as the active kernel. For example, the following command installs seaborn, a high-level statistical data visualization library built on top of Matplotlib:

%pip install seaborn

An image of the VS Code menu with notebook.ipynb and test.py created

Next steps & financial use cases

Now that your environment is fully operational, you are ready to start applying Python to quantitative finance. Explore this article to learn how to use Python to download and use financial market data.

   ▶ Hadrien Puche How to download and model financial data with Python

If you are interested in programming languages and would like to learn another useful skill, explore these two articles about how you could use the programming language R to help you in your financial analysis:

   ▶ Hadrien Puche How to install and run R on your computer (A step-by-step guide)

   ▶ Hadrien Puche How to download financial data with R

About the Author

This article was written in September 2026 by Hadrien PUCHE (ESSEC Business School, Grande École Program, Master in Management, 2023-2027).

   ▶ Discover all posts by Hadrien PUCHE
“Compound interest is the eighth wonder of the world. He who understands it, earns it … he who doesn’t, pays it.” – Albert Einstein

Hadrien Puche

Why do some financial portfolios grow at an explosive rate, while others seem to stagnate? The answer often lies in a mathematical phenomenon that Albert Einstein allegedly called the “eighth wonder of the world”: compound interest.

In this article, Hadrien PUCHE (ESSEC Business School, Grande École Program, Master in Management, 2023-2027) explores the mechanics of compound interest, to help you better understand how to include this concept to your own financial strategy or investments.

About Einstein and this quote

Albert Einstein

Albert Einstein is universally recognized as the father of modern physics, famous for the theory of relativity. While his primary focus was the universe, he possessed a deep appreciation for the beauty of mathematical patterns. Although the exact origin of this specific quote is a matter of historical debate, it perfectly captures the scientific essence of wealth creation: compounding is essentially the “physics” of capital.

To Einstein, compound interest was the ultimate proof that small, consistent actions can lead to massive, universal results over time.

Analysis of the quote

The core of Einstein’s idea is that understanding compound interest is a prerequisite for investing. If you view money linearly, you see a €1,000 investment as just a fixed sum, that can earn you a couple euros every month. If you view it through the lens of compounding, you see it as a seed, with a potential to grow into a couple thousand euros over many years.

This results in the following dichotomy in terms of financial literacy:

  • “He who understands it, earns it”: the investor who knows and understand compound interest reinvest his investment earnings, and create a self-sustaining loop where investments grow exponentially.
  • “He who doesn’t, pays it”: the individual who does not understand compound interest starts taking high-interest liabilities, such as credit card debt, and does not realize that he his the one paying for someone else’s exponential returns, as compound interest due on the debt create a bleeding process that can quickly lead to insolvency.

However, while Einstein’s quote presents compounding as a binary choice (either you understand it or not), modern financial economics introduces a vital optimization constraint: the Life-Cycle Hypothesis.

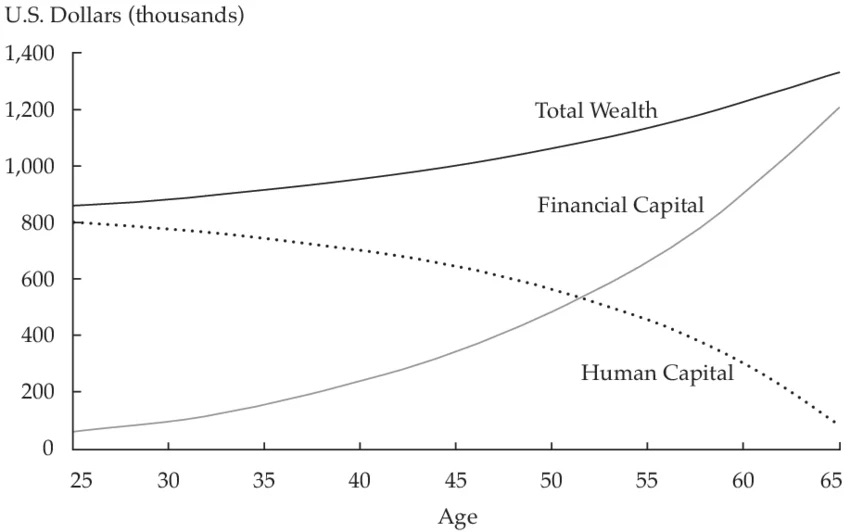
  • Early in your life, you may not have a lot of financial assets, but you do have a great “human capital” (your future earning potential).
  • As you age, your human capital converts into financial capital, as your future earning potential converts into actual earnings and financial capital.

As a result, you have to consider your total net worth as the sum of both types of capital :

Total wealth = human capital +financial capital

The key idea is that when you are young, you have a massive human capital that acts as a safety net, so you can afford to invest into high-risk high-reward assets, that will benedit the most from compounding. On the other hand, when you are older, following Einstein’s quote blindly would be a mistake : as you get closer to retirement, you should lower the risk of your financial capital, because you no longer have a human capital to replace it.

Samuelson (1969) and Merton (1969) proved mathematically that to maximize the compounding effect over time, an investor’s risk tolerance and portfolio composition must shift across the stages of life.

Ultimately, compound interest remains a neutral mathematical force; its structural impact on your life depends entirely on which side of the balance sheet you stand, and how dynamically you manage your assets across your life cycle.

My view on this quote

Einstein’s quote is a reminder that the greatest challenge in finance is not mathematics, but patience. We discussed the importance of patience in an article about the following quote from Warren Buffett: “The stock market is designed to transfer money from the impatient to the patient”. Read the full article here .

Most people fail to “earn” compound interest because they cannot endure the “boring” years, when the curve looks flat. However, if you respect the laws of physics that govern capital, you realize that you don’t need to be a genius to build wealth, you simply need to be disciplined enough to let the math do the work for you, and reach the exponential part of the curve.

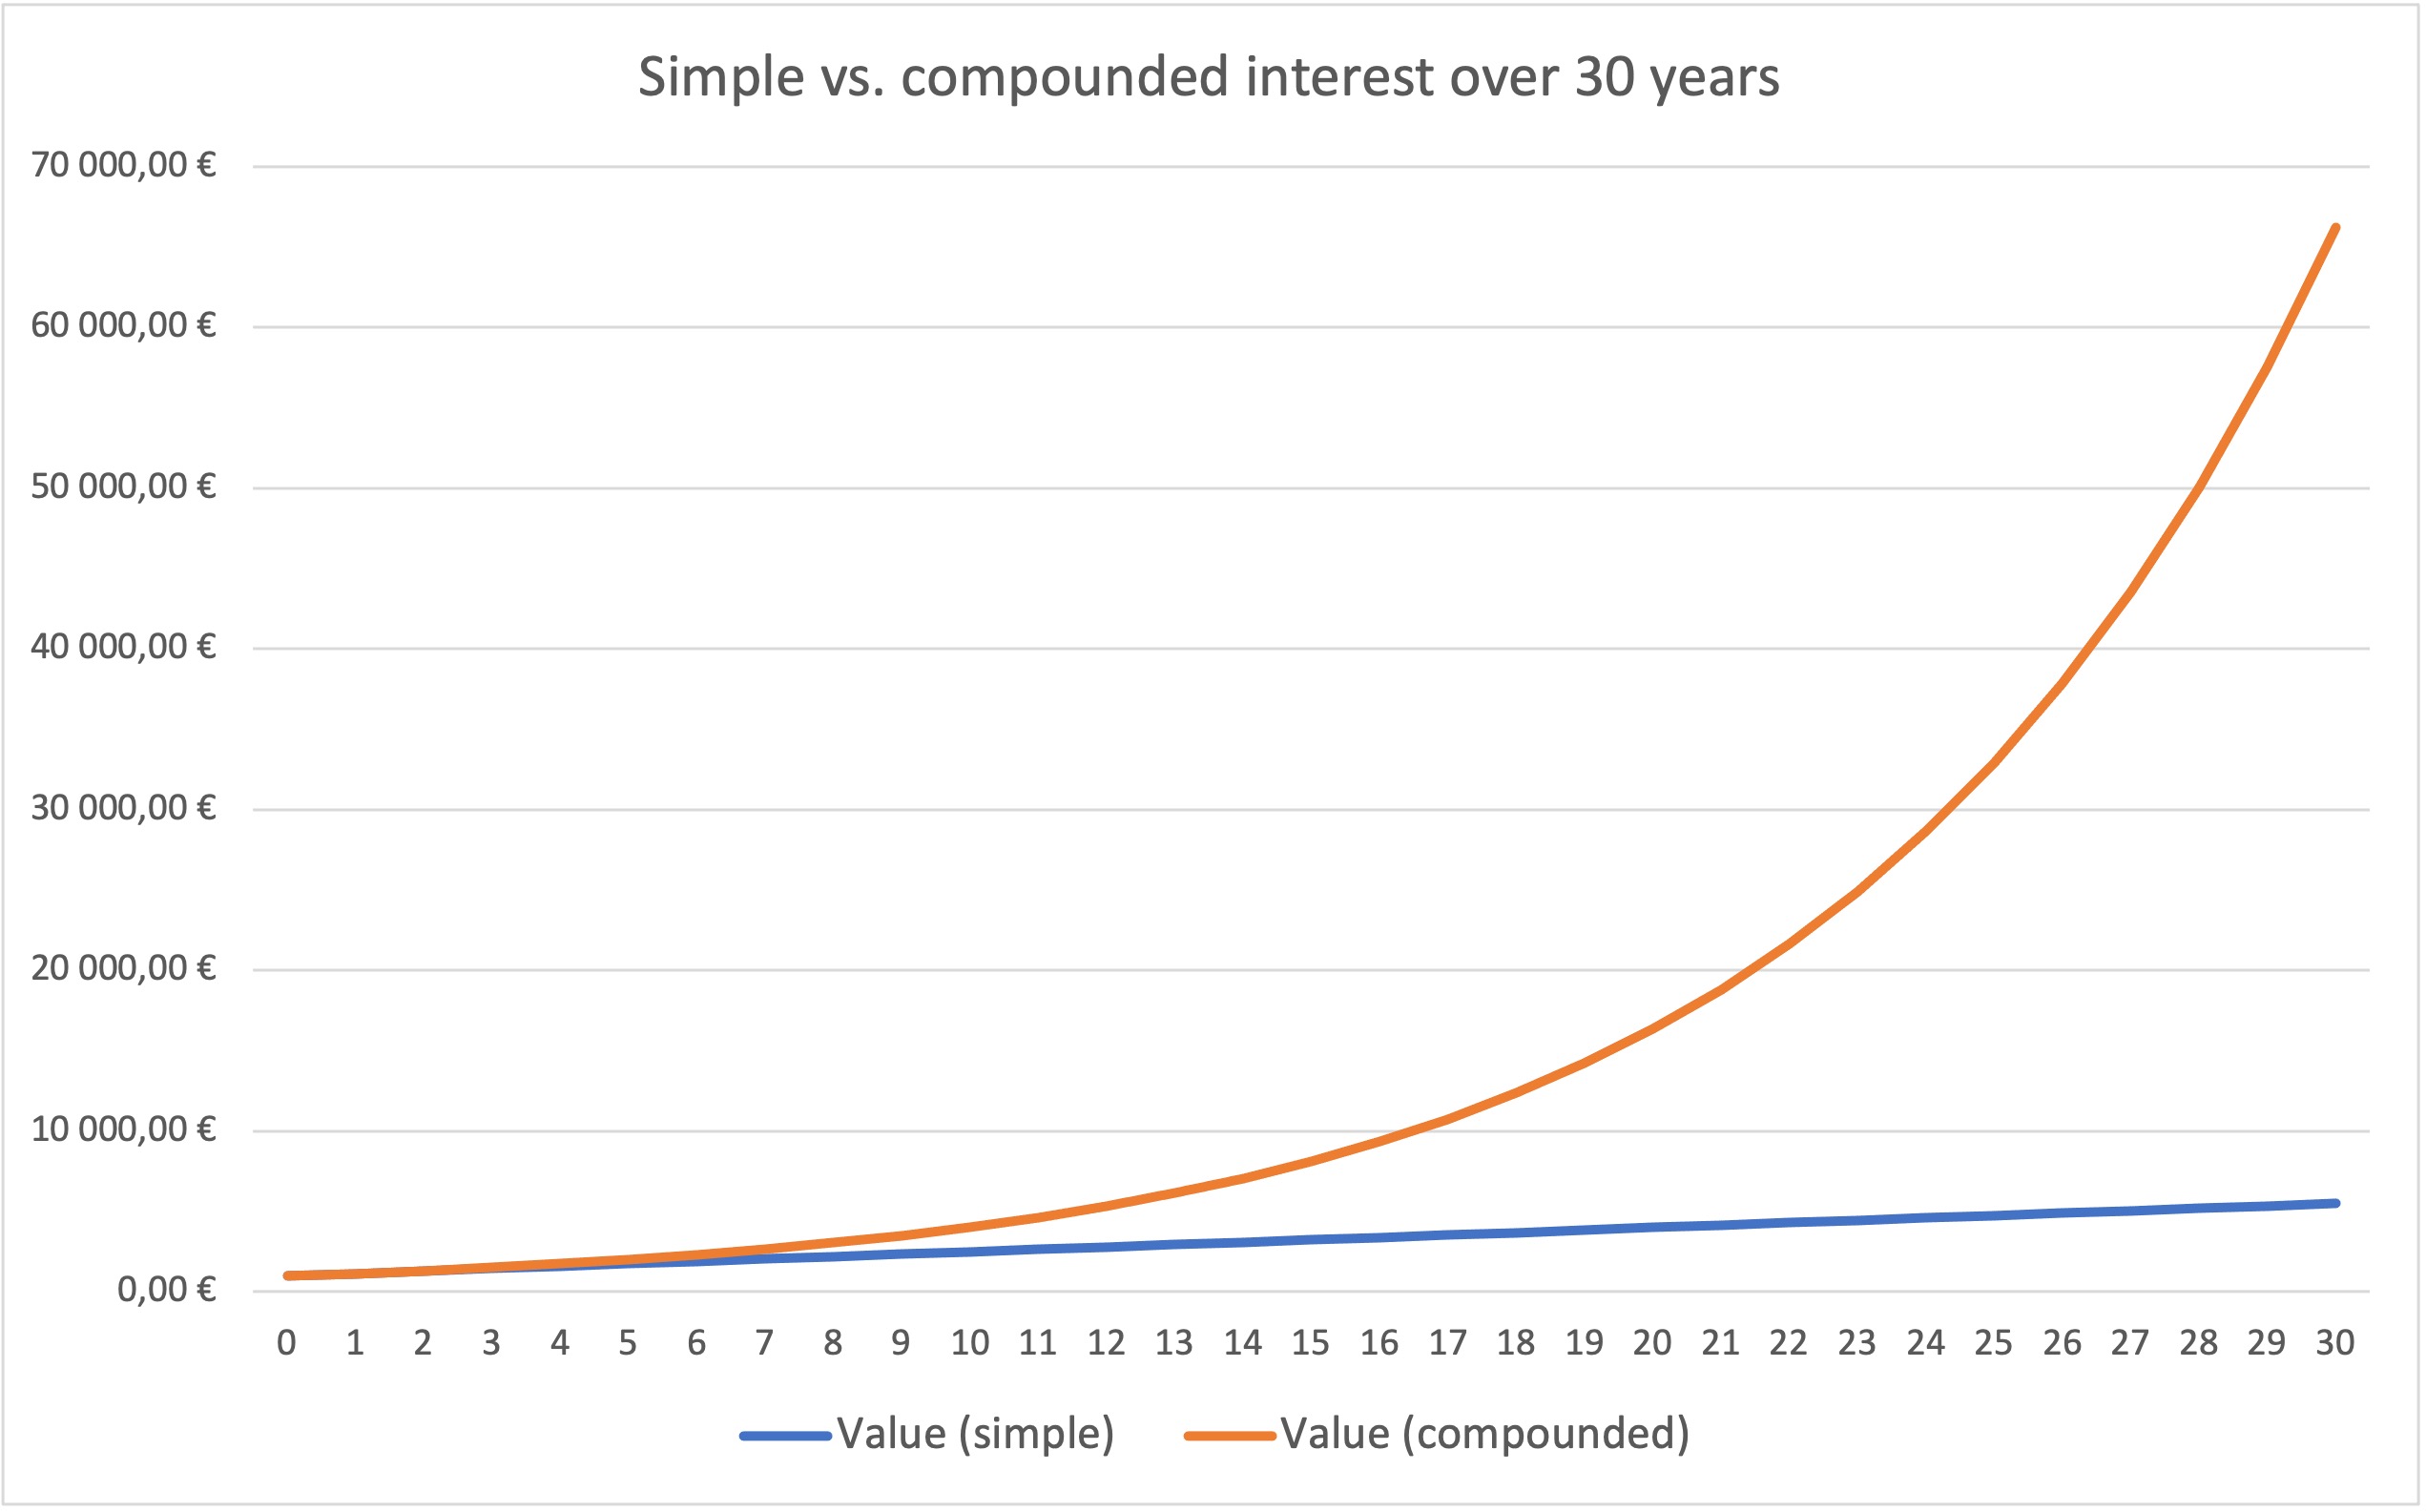
Compound interest graph

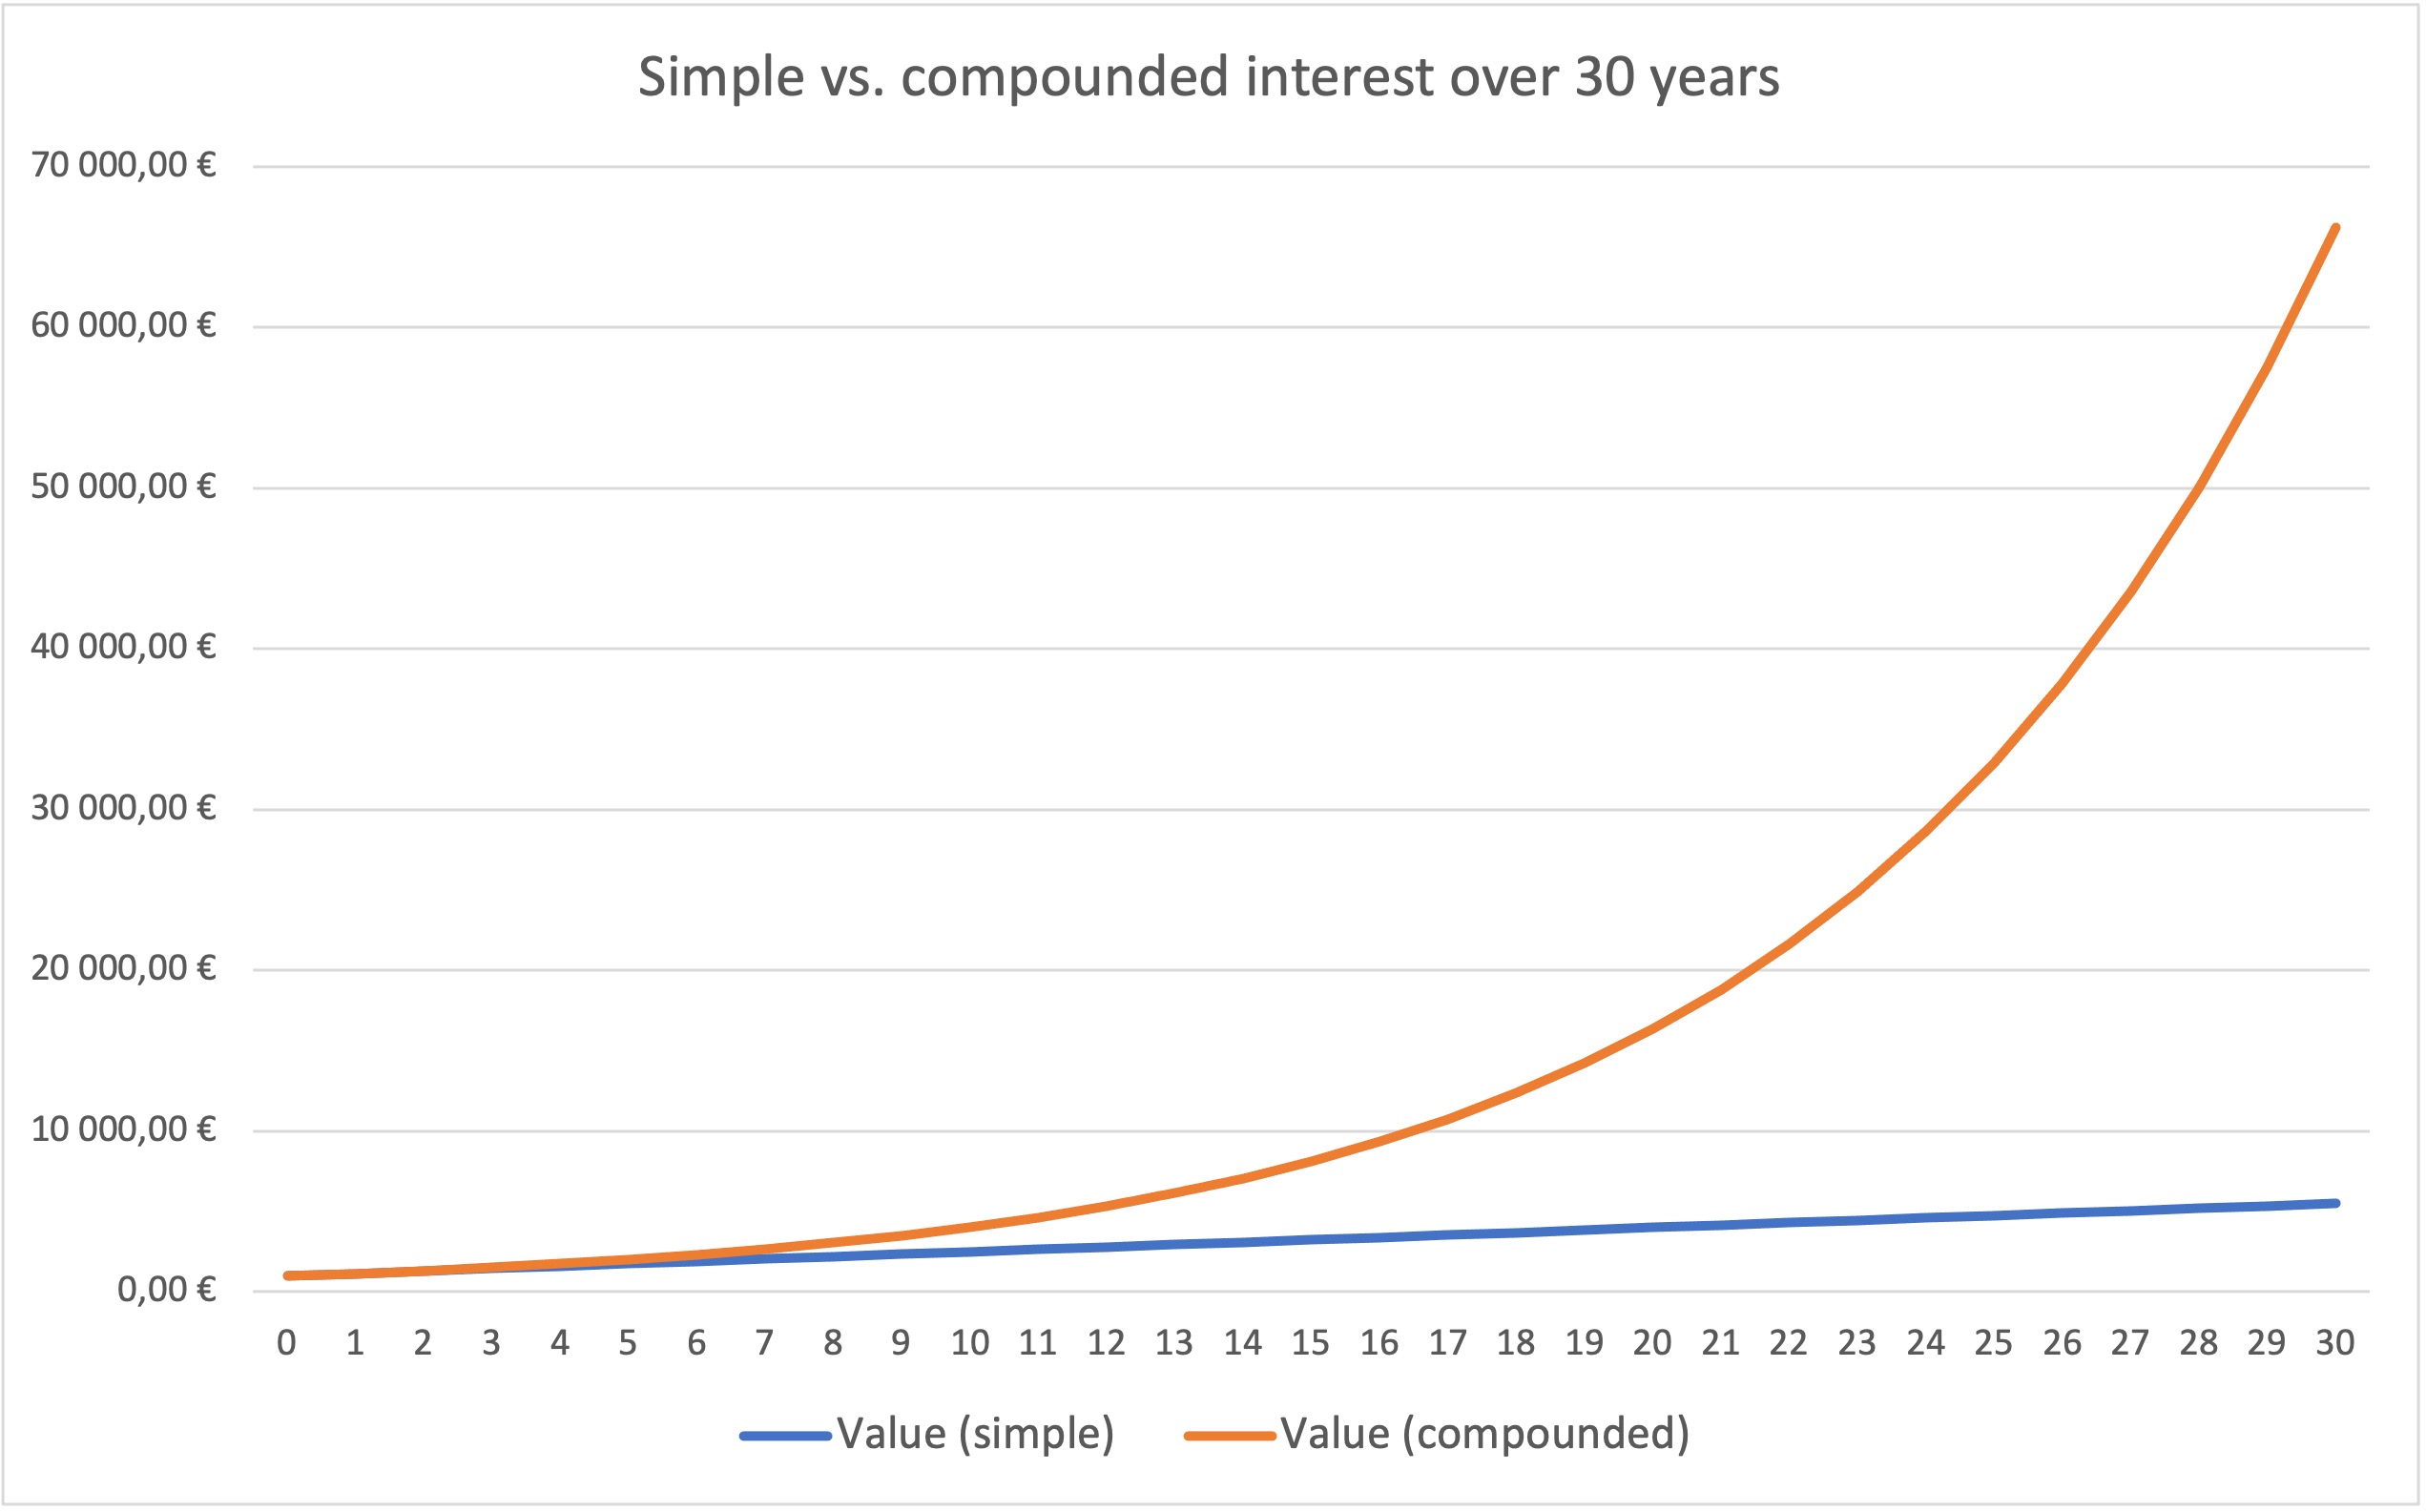
This is exactly what any compound interest curve shows : you need to wait a long time until compound interest starts making a big difference with linear one.

The math behind compound interest

To move beyond the rhetoric, we must understand the formula that governs this “wonder.” Unlike simple interest, which is calculated only on the initial principal, compound interest is calculated on the principal plus the accumulated interest of previous periods.

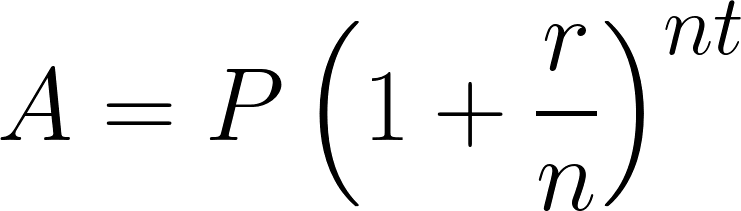
The standard formula for the future value of an investment is:

FV formula

Where:

  • A = the future value of the investment
  • P = the principal investment amount
  • r = the annual interest rate (decimal)
  • n = the number of times that interest is compounded per unit t
  • t = the time the money is invested for

The most critical variable in this equation is t (time). Because it is an exponent, time has a disproportionate impact on the final result. This is why “time in the market” is vastly superior to “timing the market.”

The number of times interest is compounded per year, n, is also important because it reflects the speed of compounding. When interest is compounded more frequently (for example, daily rather than annually), each gain is reinvested sooner and can start generating additional returns within the same year. This accelerates the growth of the investment over time.

A technical case study about the cost of delaying your investments

We are now going to follow three different individuals, that are investing for their retirement (we do not consider public pensions). They adopt three distinct behaviors:

  • The first investor is well disciplined. He invests €200 every month throughout his 40 years long career.
  • The second investor wants to retire early. To do so, he invests €500 every month, but retires after only 20 years.
  • The third investor forgets about retirement until he his 55 years old. He wants to catch-up, so he invests €1000 every month, trying to catch-up with the other two, but he only has 10 years left until retirement.

How much money can each of these three investors expect to have for their retirement, and much will they be able to spend every month when retired? Download this Excel file and answer all three questions to find out.

Financial Modeling Exercise: To calculate the exact future values and monthly retirement allowances for each scenario, you can download the simulation model here: Excel Simtrade Compound Interest Exercise .

Analysis of the results

Table from the excel file

These simulations should prove to you the following points:

  • Spending more time in the markets is much more important than investing more: Investor C invested just as much as investor B, but because he did so in 10 years instead of 20, his final monthly pension is much lower. Similarly, despite contributing in total much less than the other two, investor A’s pension ends up being the largest one by far.
  • Catching-up when you are late is almost impossible: Q3 shows that investor C would have to invest €3,576 every month for 10 years to get the same pension as investor A. In real life, this would be very difficult to achieve without a high-paying job, whereas investor A only had to put aside €200 every month…

Ultimately, this exercise proves that the “cost of delay” is not linear, but exponential. Every year of procrastination at 25 years old costs much more than a year of procrastination at 55 years old.

Related articles on the SimTrade blog

Business & Finance quotes

   ▶ All posts about Quotes

Quotes related to personal finance:

   ▶ Hadrien PUCHE Diversification is protection against ignorance – Warren Buffett

   ▶ Hadrien PUCHE In investing, what is comfortable is rarely profitable – Robert Arnott

   ▶ Hadrien PUCHE Time in the market beats timing the market – Kenneth Fisher

   ▶ Hadrien PUCHE Markets can remain irrational longer than you can remain solvent – Keynes

Quotes about time in finance

   ▶ Hadrien PUCHE Patience is bitter, but its fruit is sweet – Aristotle

   ▶ Hadrien PUCHE Most people overestimate what they can do in a year, and underestimate what they can do in ten – Bill Gates

Other resources

About the Author

This article was written in May 2026 by Hadrien PUCHE (ESSEC Business School, Grande École Program, Master in Management, 2023-2027).

   ▶ Discover all articles by Hadrien PUCHE
“The philosophy of the rich and the poor is this: the rich invest their money and spend what is left. The poor spend their money and invest what is left.” – Robert Kiyosaki

Hadrien Puche

Is wealth a result of how much you earn, how much you spend, or how much you save? When it comes to personal finance, many assume that a higher salary is the only way to get rich. However, Robert Kiyosaki, the author of Rich Dad Poor Dad, suggests that the difference isn’t in the size of the paycheck, but in the size of the spending.

In this article, Hadrien PUCHE (ESSEC Business School, Grande École Program, Master in Management, 2023-2027) discusses Kiyosaki’s famous distinction between the “rich” and “poor” mindsets and analyzes the underlying financial mechanisms.

About Kiyosaki and this quote

Robert Kiyosaki is an American personal development author and businessman, who has become a well-known figure in financial education. He is famous for his 1997 book Rich Dad Poor Dad, which advocates financial independence through investing, real estate, and starting businesses.

Kiyosaki, Rich Dad Poor Dad Source : Amazon

This quote is deeply rooted in the first lesson of his book: “The rich don’t work for money.” Through the narrative of his “Rich Dad,” Kiyosaki explains that wealthy individuals prioritize their Asset Column, buying things that put money in their pockets, before addressing their Expense Column. By “investing first,” the rich ensure their wealth grows before lifestyle inflation takes hold.

Kiyosaki, Rich Dad Poor Dad Source : Singsaver

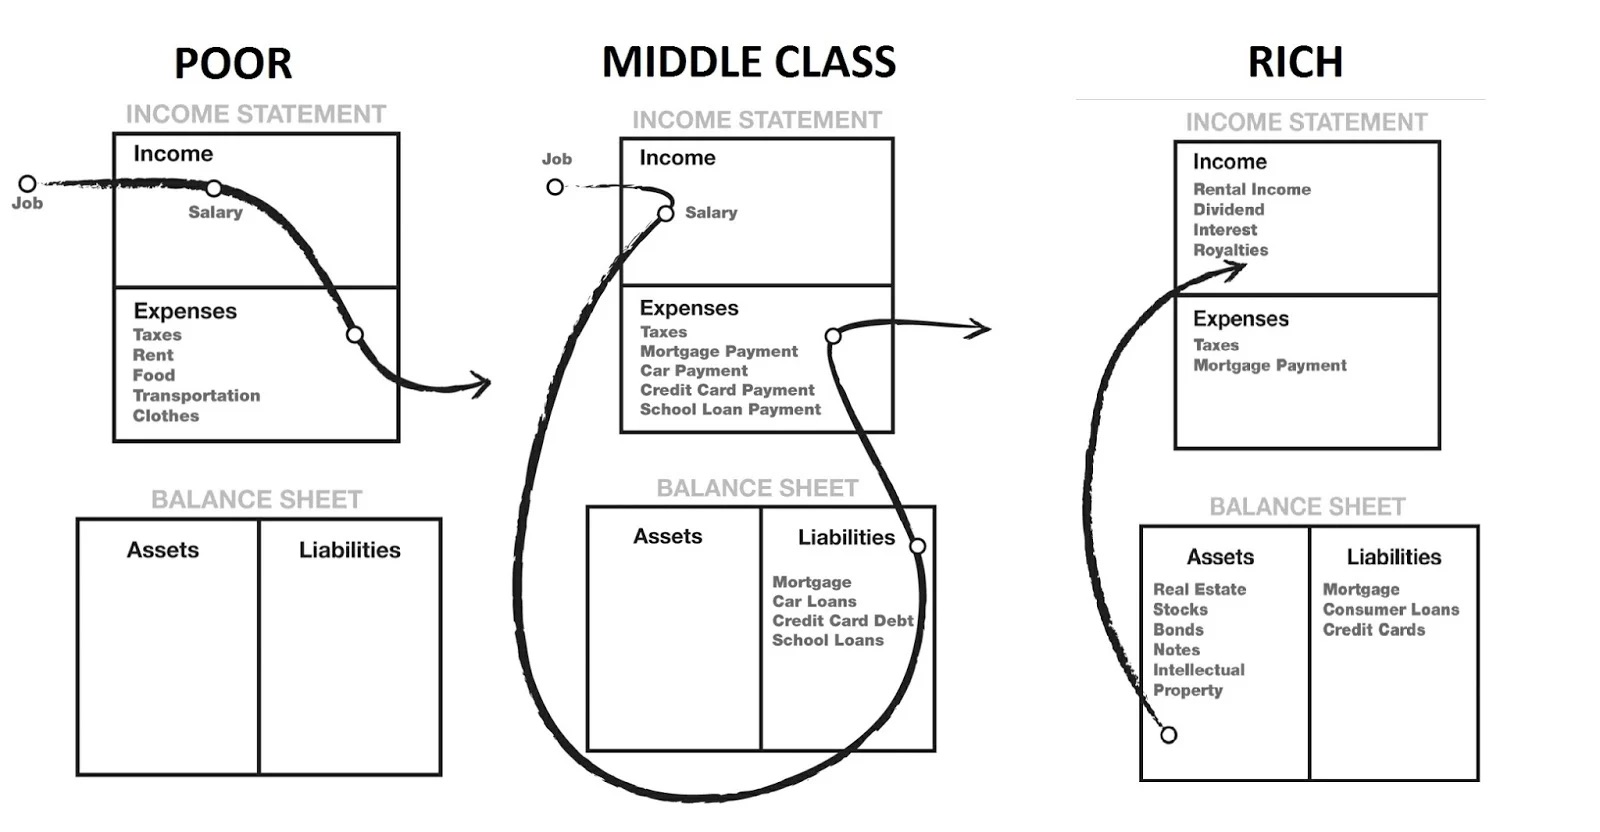
According to this framework, the distinctions are not just about the amount of money, but where it flows:

  • The Poor: their primary source of income is usually a job. This income flows directly into immediate expenses such as rent, food, and transportation. They typically possess no significant assets nor liabilities (because they can’t afford to buy any).
  • The Middle Class: like the poor, their primary source of income is a job. However, as their income rises, they often acquire what they perceive as assets but are actually liabilities (a house with a mortgage, a car with a loan, etc.). These liabilities create a cycle where a large portion of their income is diverted to debt payments before it even reaches their daily expenses.
  • The Rich: they focus on building their assets column first. Their income is primarily generated by assets such as real estate, stocks, bonds, and intellectual property. This passive income then flows into their income statement, covering their expenses and allowing for further investment back into more assets.

This visualization highlights why the “invest first” philosophy is so critical. While the middle class is often caught in a trap of working harder to pay for increasing liabilities, the rich use their income to buy things that eventually pay for their lifestyle.

It is important to note that Kiyosaki’s philosophy was heavily influenced by his mentor, the business philosopher Jim Rohn. Rohn frequently taught: “Poor people spend their money and save what’s left. Rich people save their money and spend what’s left.” Kiyosaki essentially refined this wording to emphasize “investing” over “saving,” reflecting a more aggressive approach to capital allocation.

The key difference between saving and investing is the willingness to take risks. Saving focuses on capital preservation, risk aversion and short-term liquidity, at the cost of a low yield, whereas investing means accepting risk (and / or illiquidity) in exchange for a greater return.

Analysis of the quote

The core idea behind the quote is a fundamental distinction between two different financial behaviors:

  • The ‘Rich’ behavior: invest first and then live off the rest. A rich person is someone who has reached a level of capital where they no longer have to care about the cost of daily living, so they can afford to invest the bulk of their income and spend the remaining without anxiety.
  • The ‘Poor’ behavior: live first, and then eventually invest what is left. A poor person must always address immediate survival needs first, leaving investing as a secondary (and often unreachable) goal.

However, if we look at the literal reality, the quote’s view on poor people’s behavior is quite unfair to them.

  • Statistics show that a significant portion of the population lives paycheck to paycheck (62% in the US according to PYMNTS, and 43% in France according to ADP), meaning they literally have nothing “left” after basic necessities. For them, the choice to “invest first” does not make sense at it is impossible for them to live properly and save.
  • Personal development gurus often argue that if you “think” like the rich, you will become rich. While a disciplined mindset is helpful, this quote can be seen as “unpractical” because it ignores the structural reality of low wages and the high cost of living.

Essentially, the quote is more about financial discipline than a literal description of social classes. It defines “rich” as someone who achieves freedom by making their money work for them, rather than being a slave to their expenses. It is a valuable financial lesson, even though the term ‘Poor’ would be better replaced by ‘Middle class’.

Financial concepts linked to this quote

Kiyosaki’s philosophy is a good opportunity for us to examine three key financial concepts that are linked to this quote: assets vs. liabilities, compound interest and the time value of money, and opportunity cost.

Assets vs. Liabilities

Kiyosaki’s most famous contribution is his simplified and cash-flow-centric way to define assets and liabilities. In traditional corporate accounting, an asset is broadly defined as an economic resource owned or controlled by an entity, whereas a liability is an obligation or debt owed to an external party. Under this conventional framework, a primary residence or a personal vehicle is classified as an asset because it possesses measurable intrinsic and market value.

However, Kiyosaki challenges this traditional view by narrowing the definitions down to a single variable: the direction of net cash flow.

  • An asset is strictly something that puts money in your pocket. This includes tangible and intangible holdings: rental properties, dividend-paying stocks, or a business that can run without your daily presence.
  • A liability is something that takes money out of your pocket. This often includes items that people mistakenly view as “investments”, such as a car or a primary residence. While these may have market value, they require constant outflows for monthly maintenance, insurance, and taxes without generating direct income, so Kiyosaki believes you should see them as liabilities.

This distinction is crucial, because many individuals mistakenly believe they are building wealth when they are actually accumulating liabilities, that require increasing amounts of cash flow to maintain. For a sophisticated investor, the goal is to use income to acquire assets that generate even more income, creating a self-sustaining loop.

This is the “Rich” mindset Kiyosaki is all about: you should target a life where the cashflows from your assets cover the expenses from your liabilities. This way, you no longer have to work for money, as your money is the one working for you.

Another benefit of assets is that they allow investors to multiply their returns through financial leverage. By borrowing other people’s money at a fixed borrowing rate of X%, and investing it in an income-generating asset for a return of Y%, as long as Y is greater than X, the investor captures a positive spread that maximizes their return on equity (ROE). Because Kiyosaki advises prioritizing the asset column, utilizing strategic debt becomes a primary mechanism to scale an investment portfolio far faster than organic cash savings would allow.

An important note on risk: Financial leverage is fundamentally a double-edged sword. While a positive spread ($Y > X$) exponentially accelerates wealth accumulation, leverage works both ways: it severely magnifies downside risk. If the asset’s returns fall or cash flows dry up while the mandatory debt service remains fixed ($Y < X$), the investor faces heavy financial stress, margin calls, or outright insolvency.

Compound Interest and the Time Value of Money

By “investing first,” an individual maximizes the time their money spends in the market. This is good because of one of the most important aspects of investing: compound interest.

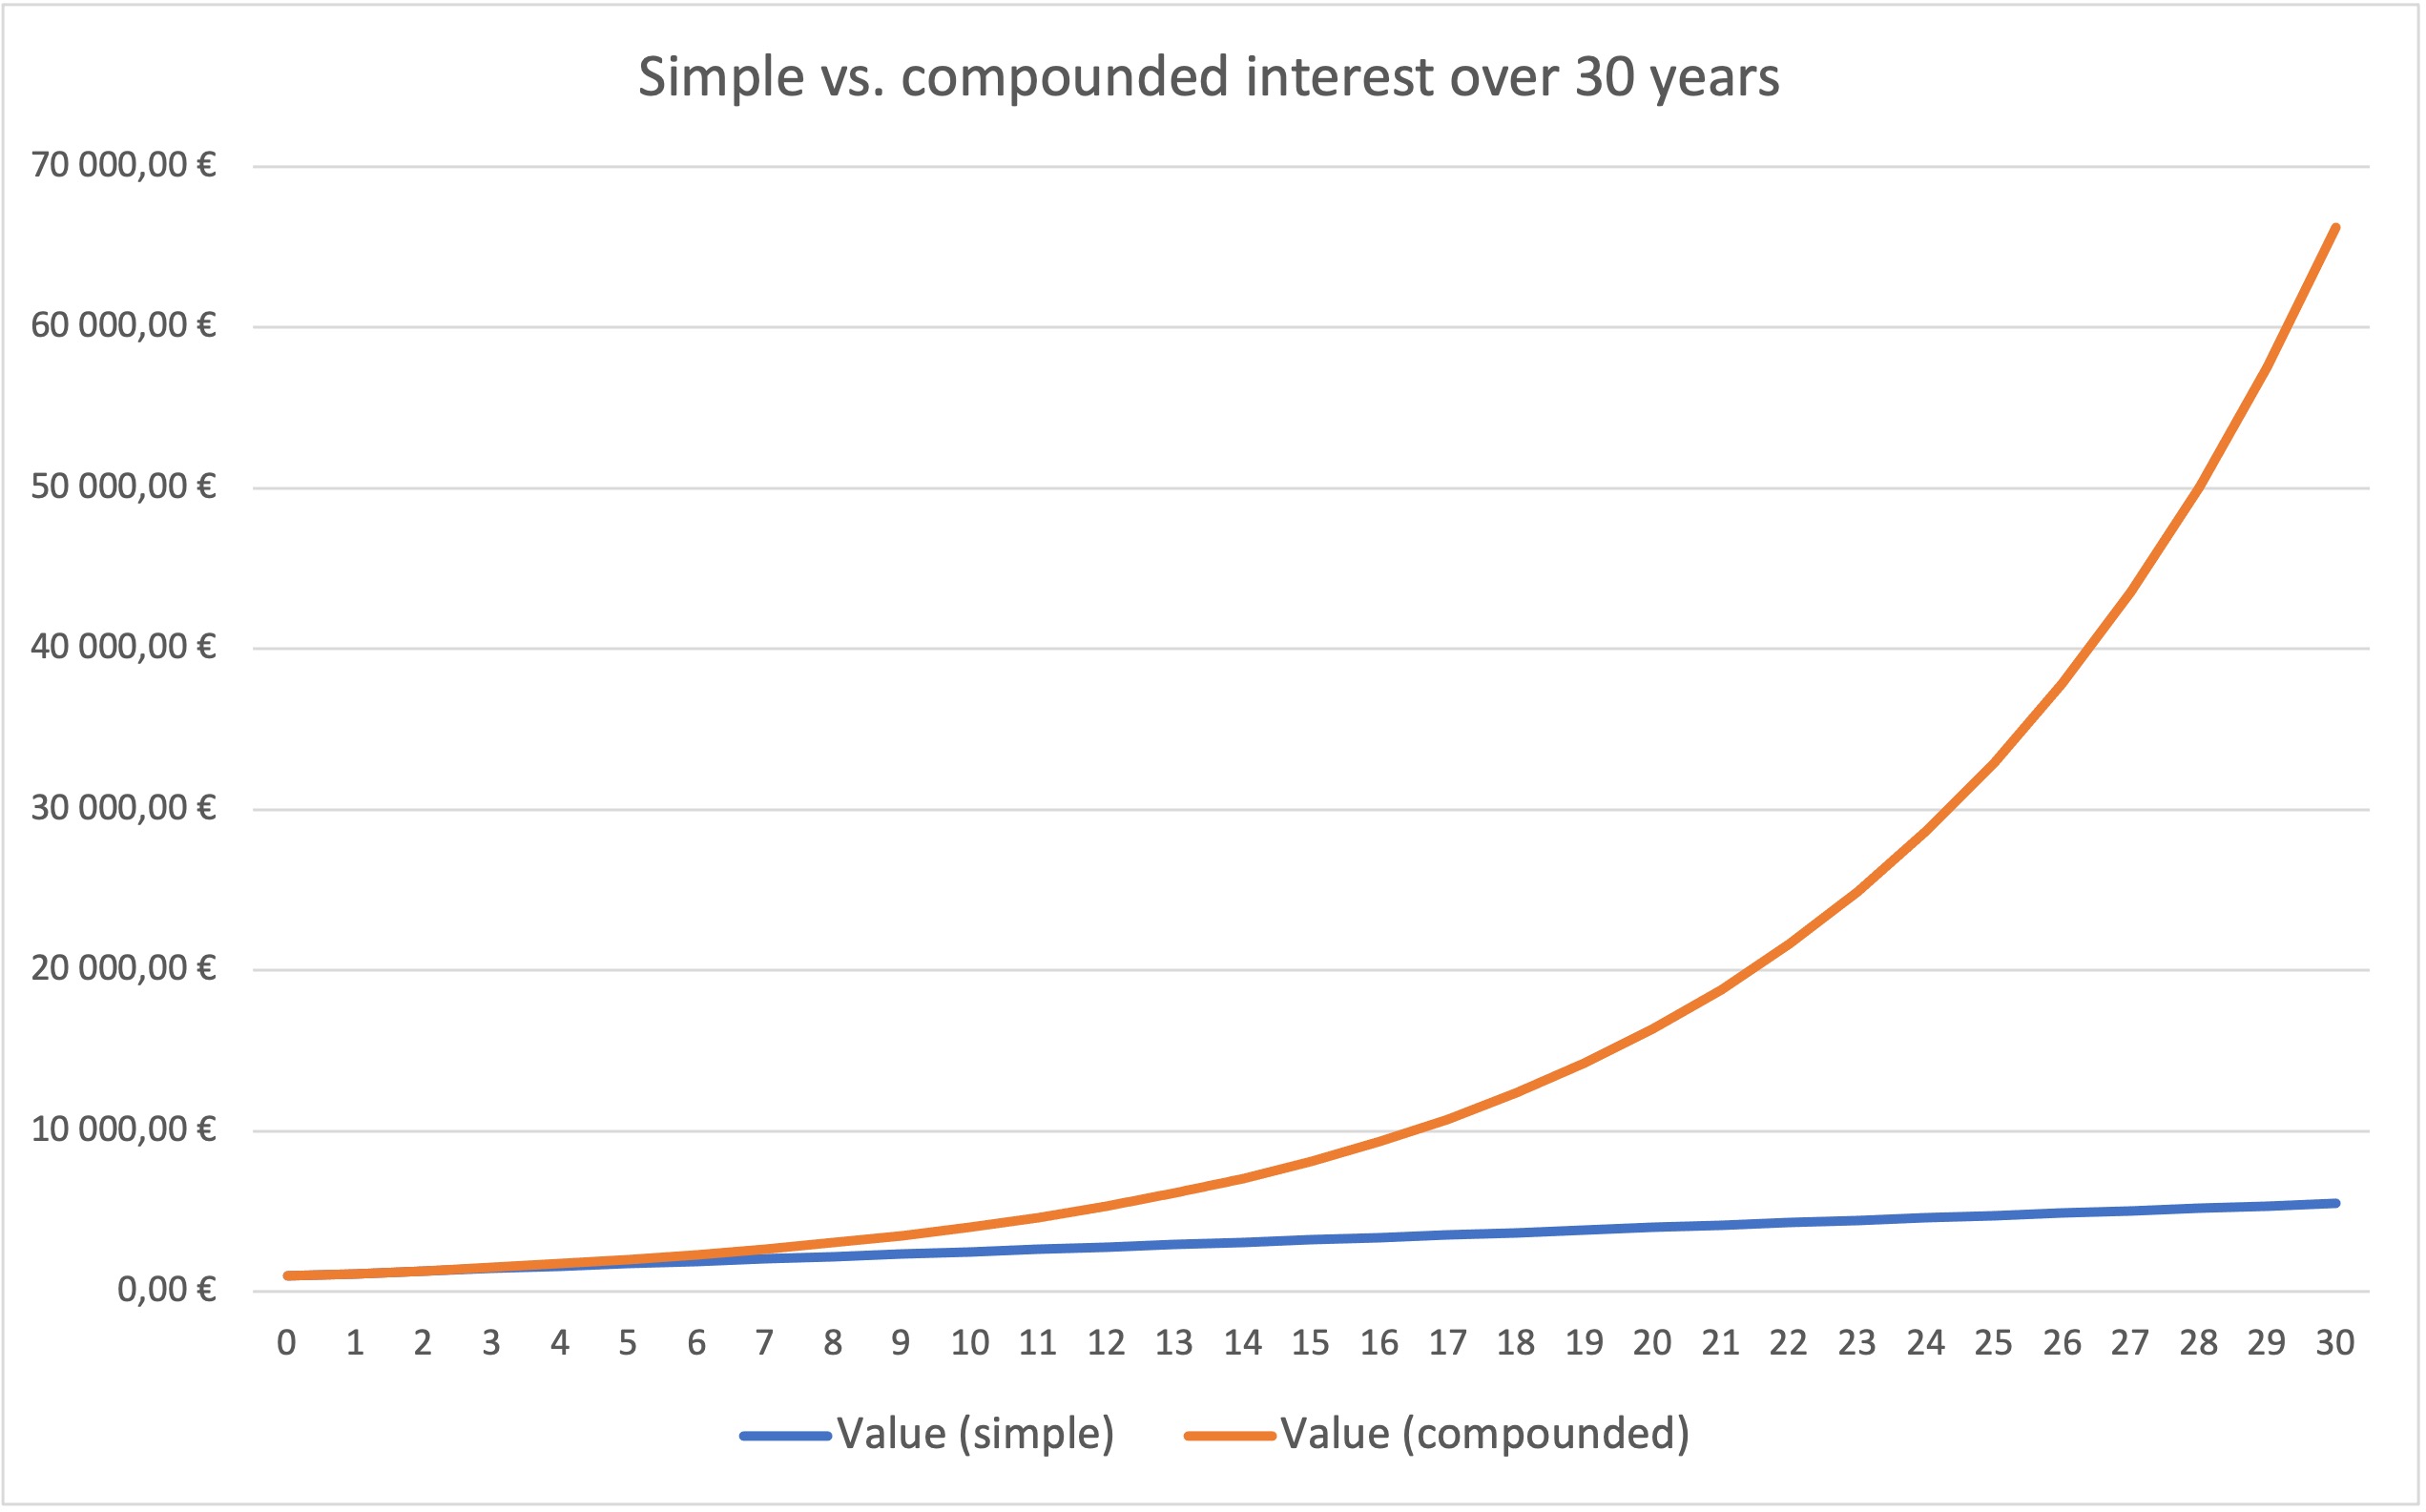
Compounding interest is the process where the returns on an investment generate returns of their own the next year, creating an exponential growth curve over time.

Cover of Rich Dad Poor Dad by Robert Kiyosaki

As you can see on this graph, compound interest leads to exponential returns, whereas simple interest only leads to linear returns over time.

Compound interest works because of another key concept: the time value of money. The idea is that a dollar today is worth more than a dollar tomorrow because of its potential earning capacity (you could invest it and have more money tomorrow).

When a poor person waits to “invest what is left”, it also means missing more years of exponential growth for the capital, as the “cost” of waiting is not linear, but compounded.

Opportunity Cost

Every euro spent on a luxury item or an unnecessary expense carries an opportunity cost with it. In finance, capital is never free; every dollar tied up in a trade or a purchase is a dollar that isn’t earning a return for you. To truly calculate the price of a purchase, you must look beyond the sticker price and consider the “future value” that capital could have achieved if invested in a “risk-free” benchmark (or a diversified portfolio).

By spending first, you aren’t just losing the money today; you are losing the future wealth that money was destined to create.

As an example: If you spend €1,000 on a new phone today instead of investing it at a 7% annual return, the “real” cost of that phone over 10 years is actually ~$1,967. Over 30 years, that single €1,000 purchase represents an opportunity cost of over €7,600. This is why disciplined investors view market prices through the lens of intrinsic value rather than social status. By prioritizing spending, you are effectively selling your future financial freedom at a premium price for a temporary luxury.

The Life-Cycle framework and the rational borrowing phase theory

In Robert Kiyosaki’s popular framework, debt is viewed through a binary lens: it is either “good” (if it directly funds income-producing assets) or “bad” (if it is used for personal consumption). However, mainstream financial economics provides a more nuanced and structurally rigorous perspective through the lens of the Life-Cycle Hypothesis.

In the foundational models developed by Robert Merton and Paul Samuelson (1969), an individual’s total lifetime wealth is split into two distinct pillars:

  • Financial Capital: All tangible, investable assets in the traditional accounting sense.
  • Human Capital: The discounted present value of all future labor income.

What makes this framework highly compelling is how it redefines early-career balance sheets. At the start of a professional life, an individual’s financial capital is typically near zero, yet their human capital is at its absolute peak. From a corporate finance standpoint, this means young professionals are not asset-poor; rather, they possess a massive, illiquid asset that they ought to leverage through a strategic borrowing phase.

Total wealth as the sum of financial capital and human capital Source : ResearchGate

Taking on early liabilities (student debt, a first mortgage…) becomes economically rational when evaluated against the aggregate of both financial and human capital. In essence, this leverage is securely collateralized by expected future labor earnings.

Conversely, a rigid adherence to Kiyosaki’s precepts would discourage taking on debt that doesn’t immediately yield cash flow. In practice, this dogmatic view would mean avoiding early leverage entirely, disincentivizing investments in one’s own education and long-term human capital.

Why should you keep this quote in mind?

This principle serves as a vital warning against lifestyle inflation. As most people progress in their careers and earn more, they instinctively increase their spending: buying a bigger house, a faster car, or more expensive clothes.

By following the “poor” philosophy of spending first, their net worth remains stagnant regardless of their salary. Keeping this quote in mind forces you to prioritize your future self over current impulses.

My view on this quote

While the quote is mostly there to motivate people, I find it to be quite unpractical in its purest form. It presents a binary choice that does not consider the nuances of daily survival. You cannot simply “act rich” to become rich; the reality of personal finance is that you must first secure your basic needs before you can even begin to consider an investment strategy.

The practicality of this mantra heavily depends on the underlying national financial culture, like how people invest for their retirement.

  • In the United States, investing in equity markets is seen as a crucial mean of wealth building, particularly when pensions are mostly built through capitalization. Because of this, it makes sense to remind individuals that they need to invest first (including for their retirement) and spend after, because if they spend everything, they won’t be able to retire.
  • On the other hand, in countries like France, where most pensions are obtained through redistribution, people can afford to ‘forget’ to invest, as it won’t have devastating consequences on their retirement.

In my opinion, the wisest strategy is to target a middle ground. Rather than blindly investing every cent and hoping you have enough left for rent (a recipe for financial stress), one should start by making a rational budget. As an example, you can first take everything you really need to spend every month (rent, food, etc.) and then split the rest between leisure and savings. This way, you can manage your lifestyle within reasonable bounds.

Ultimately, simply copying the habits of the wealthy will never guarantee an entry into the 1%. However, by being careful about how you spend, you might not immediately become “rich” in the Kiyosaki sense, but you will certainly become less poor, and it will contribute to developing an analytic rigor that may be useful in other aspects of your personal or professional life.

Related articles on the Simtrade blog

   ▶ All posts about Quotes

   ▶ Hadrien PUCHE Investing is stupid if you’re more worried about short-term volatility than long-term quality – Charlie Munger

   ▶ Hadrien PUCHE “The four most dangerous words in investing are, it’s different this time” – Sir John Templeton

   ▶ Hadrien PUCHE In investing, what is comfortable is rarely profitable – Robert Arnott

   ▶ Hadrien PUCHE “The stock market is designed to transfer money from the impatient to the patient” – Warren Buffett

Useful resources

Kiyosaki, R. T. (1997). Rich Dad Poor Dad. Warner Books.

Rich Dad Cash Flow Patterns and Wealth.

Merton, R. (1969). Lifetime Portfolio Selection under Uncertainty: The Continuous-Time Case. The Review of Economics and Statistics, 51(3), 247–257.

Samuelson, P. (1969). Lifetime Portfolio Selection by Dynamic Stochastic Programming. The Review of Economics and Statistics, 51(3), 239–246.

About the Author

This article was written in May 2026 by Hadrien PUCHE (ESSEC Business School, Grande École Program, Master in Management, 2023-2027).

   ▶ Discover all articles by Hadrien PUCHE

“October: this is one of the peculiarly dangerous months to speculate in stocks. The others are July, January, September, April, November, May, March, June, December, August and February.” – Marc Twain

Hadrien Puche

Is there ever a “safe” time to invest money in financial markets? Many investors spend their careers searching for the perfect seasonal window, waiting for “calmer” months to risk their capital, or fearing specific periods like the infamous “October effect”. However, Mark Twain, as a cynical observer of human nature, suggests that our search for a financial safe harbor in the calendar is completely pointless.

In this article, Hadrien PUCHE (ESSEC Business School, Grande École Program, Master in Management, 2023-2027) explores Twain’s satirical warning against market timing and why, for the undisciplined investor, every month is just as “peculiarly dangerous” as the others.

About Mark Twain and this quote

Mark Twain (the pen name of Samuel Clemens) was an American writer and humorist, but also a frequent (and often unsuccessful) speculator. Despite his literary success, Twain lost a lot of money on various financial bets (inventions and mining stocks), which likely fueled the irony found in his financial observations.

Marc Twain

Source: Wikipedia Commons

This specific quote originates from his novel Pudd’nhead Wilson (1894). The irony lies in its structure: he begins by singling out October as dangerous, tapping into the historical anxiety of market crashes, only to list every other month of the year as equally perilous. The message is clear: the market does not care about your calendar; it is a “psychological arena” where risk is constant.

Puddn’head Wilson

Analysis of the quote

Twain’s quote is a satirical commentary on market seasonality and the fundamental flaws of investor psychology. By breaking the quote into its two logical parts, we can better see how he dismantles the common myths of market timing.

“October: this is one of the peculiarly dangerous months to speculate in stocks.”

In this first half, Twain acknowledges the “October Effect” theory. While investors usually cite the crashes of 1907, 1929 and 1987 as evidence of this seasonal anomaly, Twain’s observation is particularly visionary as, remember, he wrote these words in 1894.

Yet, while collective fear and “animal spirits” can turn this into a self-fulfilling prophecy, there is little inherent mathematical reason why October is riskier than any other period.

“The others are July, January, September, April, November, May, March, June, December, August and February.”

This punchline targets two specific human tendencies:

  • The illusion of control: Investors often suffer from “historical bias,” searching for patterns where none exist. By labeling a specific month as “dangerous,” we falsely imply that the others must be “safe”.
  • The persistence of risk: Twain reminds us that market price movements (that can be moved by news or investors’ behavior) can exhaust your resources in April or August just as easily as in October. Financial bubbles and “manias” do not follow a calendar; they follow a cycle of displacement, euphoria, and eventually, panic.

Financial concepts linked to this quote

The three following financial concepts can help you better understand the quote and what it implies about finance: market timing vs. time in the market, the Efficient Market Hypothesis (EMH), and speculation vs. investment.

Market timing vs. time in the market

Speculators try to “time” the market by entering in “safe” months, and exiting before the “dangerous” ones. However, academic research suggests that trying to “time the market” is always suboptimal relative to spending more “time in the market”, and leads to worse returns (See Black Swans and Market Timing: How Not to Generate Alpha, Estrada, J. in the Journal of Investing).

The majority of long-term gains in stock markets occur on a small number of trading days each year, and missing just a few of those “best days” (which can happen in any month) can seriously reduce the total return.

daily returns repartition graph

Source: ReasearchGate

As you can see on this graph, most daily returns are near 0, whereas there only is a very small number of days with higher returns.

As the saying goes, “time in the market beats timing the market.” While concentration in time (timing) seeks a “free lunch,” diversification over time through long-term holding is a much more reliable path to wealth.

Check out this article to learn more about why time in the market beats timing in the market.

The Efficient Market Hypothesis (EMH)

The Efficient Market Hypothesis (EMH) suggests that markets are all rational, and instantaneously reflect all available information. If there were truly a “safe” or “dangerous” month, arbitrageurs would immediately exploit that information until the advantage disappeared. For example, if everyone knew October was dangerous and sold their stocks, prices would drop in September. Knowing that September is dangerous, they would sell the stocks in August, and prices would drop in August. Knowing that August in dangerous …

The point is that something that everybody knows about cannot be considered as an informational edge, because there is no way for you to make money over someone else who also know about it.

Overall, Twain’s quote challenges the idea that any predictable seasonal “free lunch” exists. Because the market is a “voting machine” driven by the aggregate expectations of all participants, any easily identifiable pattern is likely already priced into the current valuation.

Speculation vs. Investment

Twain specifically uses the word “speculate,” a term that in a financial context, is very different from “invest”.

  • Investment is based on disciplined fundamental analysis (examining earnings, balance sheets, management…) with the expectation of long-term value growth, regardless of short-term price volatility. An investor acts as a part-owner of a business, focusing on its intrinsic value rather than its daily market price.
  • Speculation, however, is essentially a bet on short-term price movement, often driven by market “noise,” rumors, or the “Greater Fool” theory. While an investment might be safe year-round if the underlying business quality is high, speculation is always “peculiarly dangerous” because it relies on “animal spirits” (the unpredictable human emotions and herd behavior that drive financial decisions).

The speculator is essentially a trader, trying to profit from the psychology of other participants, which makes him vulnerable to the “voting machine” nature of the short-term market. Unlike a long-term investor who can wait for a “valuation gap” to close, the speculator often faces the pressures of short selling costs, margin calls, or the lethal risk of a short squeeze. As Twain implies, this makes the speculator’s path dangerous in every month of the year, because they are not betting on the business itself, but on the timing of the crowd’s next move.

If you want something safer, all you have to do is investing instead of speculating. It will still be risky, as markets always are, but will be less risky.

Why you should always keep this quote in mind

You should see this quote as a necessary reality check against the urge to time the market. In finance, being “right” too early can lead to insolvency if the market’s irrationality outlasts your capital. This is famously discussed in the context of Keynes’s warning that markets can remain irrational longer than you can remain solvent.

Twain’s humor serves as a reminder that there is no “secret calendar” to success; the only true protection is discipline and a realistic assessment of risk.

My opinion on this quote

Twain’s core idea is absolutely right: in finance, the calendar is usually a distraction. Many retail investors wait for “the right time” to invest, only to watch from the sidelines as the market climbs over time. Statistically, studies on Dollar Cost Averaging (DCA) vs. Lump Sum Investing often show that investing immediately (Lump Sum) outperforms waiting for a dip, simply because markets tend to trend upward over time. However, DCA remains a powerful tool for the “psychological arena,” as it helps investors avoid the emotional cost of potentially entering the market at a peak.

Overall, the “danger” isn’t the month, but our own cognitive biases. Many buy when there is “euphoria” and sell when there is “panic,” regardless of whether it’s June or December. Instead of watching the calendar, we should focus on the quality of our assets and our ability to remain solvent through the inevitable periods of market irrationality.

However, I disagree with Marc Twain use of the word ‘speculate’. If your goal is to speculate and not investing, then the best months of the years should be the most dangerous ones, as they allow for more market movements and more quick profit opportunities. In that sense, for a speculator, Twain’s insights would be that October is not more profitable than the others months to speculate, not exactly what Twain intended to say, but it does show how Twain was wrong to try to speculate instead of simply investing is money in the market without thinking too much about it.

Related articles on the SimTrade blog

   ▶ All posts about Quotes

   ▶ Hadrien PUCHE Markets can remain irrational longer than you can remain solvent – Keynes

   ▶ Hadrien PUCHE Time in the market beats timing the market – Kenneth Ficher

Useful resources

Books

Twain, M. (1894). Pudd’nhead Wilson.

Malkiel, B. G. (1973). A Random Walk Down Wall Street.

Shiller, R. J. (2000). Irrational Exuberance.

Academic Research

Shleifer, A., & Vishny, R. W. (1997). The Limits of Arbitrage. The Journal of Finance, 52(1), 35-55. Available via JSTOR. (Explains why markets can stay irrational longer than an arbitrageur can remain solvent ).

Estrada, J. (2008). Black Swans and Market Timing: How Not to Generate Alpha. The Journal of Investing, 17(3), 20-34. Available via IESE Business School. (Demonstrates how missing just a few of the market’s best days can drastically reduce long-term returns).

Sharpe, W. F. (1991). The Arithmetic of Active Management, Financial Analysts Journal, 47(1), 7-9. Available via Stanford University. (Details why the average market participant must achieve the market return before fees ).

About the Author

This article was written in May 2026 by Hadrien PUCHE (ESSEC Business School, Grande École Program, Master in Management, 2023-2027).

   ▶ Discover all articles by Hadrien PUCHE

“Markets can remain irrational longer than you can remain solvent” – John Meynard Keynes

Hadrien Puche

Is it possible to be right too early? In the world of finance, the answer is often yes. We frequently assume that if our analysis is sound, and if the data is on our side, profit is inevitable. However, history is littered with brilliant minds who correctly identified a market bubble, but got crushed by the weight of markets that refused to see their truth.

John Maynard Keynes, father of modern macroeconomics, learned this the hard way in the 1920s, as he nearly went bankrupt betting against the German Mark. He discovered that even his expert theories could be steamrolled by the sheer momentum of a crowd who does not care about mathematics or economics. In one sentence, “Markets can remain irrational longer than you can remain solvent”.

In this article, Hadrien Puche (ESSEC Business School, Grande École Program, Master in Management, 2023-2027) explores the limits of arbitrage, and why timing is just as important as being correct.

About Keynes and this quote

John Maynard Keynes
John Maynard Keynes
Source : Cambridge

John Maynard Keynes (1883–1946) was a British economist. In his 1936 work, The General Theory of Employment, Interest, and Money , he argued that aggregate demand (the total spending in an economy) is its primary engine of growth. He observed that during crises, a “liquidity trap” can occur, where individuals and businesses hoard cash, causing a cycle of stagnation that the “invisible hand” of the free market fails to fix without external intervention.

Another central pillar of his theory is the idea of “Animal Spirits,” the human emotions and instincts that drive financial decisions. Keynes argued that because the future is uncertain, investment is guided more by waves of optimism or pessimism than by cold calculation. To counter all of this, Keynes advocated active fiscal policy: governments should use deficit spending to stimulate demand. His focus was on short-run intervention, famously remarking that “in the long run, we are all dead.”

While the quote “Markets can remain irrational longer than you can remain solvent” is frequently linked to him, its true origin is a matter of historical debate. Some credit A. Gary Shilling, an American financial analyst who has claimed paternity of the phrase since the early 1970s.

Analysis of this quote

This quote is above all a warning against the limits of arbitrage.

Being right about, for example, a bubble, such as the Dutch tulip mania (1636) or the dot-com (2000), is irrelevant if you cannot survive the journey to the correction. A market can remain detached from reality for years, during which three specific pressures act against the contrarian investor:

  • Capital constraints and margin calls: if you short a stock at $100 because it is “irrationally” high, and it climbs to $200, your broker will ask for more collateral. If you cannot provide it, your position will be liquidated at a massive loss, even if you are just days ahead of the eventual crash.
  • Opportunity cost: tying up capital in a “correct” bet that takes five years to materialize can be devastating; losses incurred from inflation and missed gains in other sectors may outweigh the final profit of the trade.
  • Momentum and “animal spirits”: irrationality is frequently self-reinforcing. When prices rise, more and more less sophisticated investors enter the market, creating momentum that pushes valuations even further from fair value, and crushing those betting on a return to sanity.

The term ‘solvent’ in the quote is very important. It is about the investor’s ability to stay alive (at a financial level). In finance, being insolvent is almost the same as being dead. The market does not have to be rational on your timeline; it only has to stay irrational long enough to exhaust your resources.

The GameStop (GME) Short Squeeze

The 2021 GameStop saga remains the most violent modern illustration of Keynes’s warning. From a fundamental perspective, analysts were “right”: the company was a struggling brick-and-mortar retailer with a declining business model and falling revenues. However, “animal spirits” fueled by social media created a decoupled valuation where the stock price surged by over 2,700% in weeks.

This irrationality triggered a short squeeze, a technical phenomenon where rising prices force short sellers to buy back shares to cover their positions. This involuntary buying creates a self-reinforcing loop: the more short sellers exit to limit losses, the higher the price climbs, triggering further margin calls. This had lethal solvency consequences: hedge funds like Melvin Capital, despite their sound fundamental thesis, were caught in a liquidity squeeze. They were crushed not by being wrong about the company, but by being insolvent before the market’s timeline aligned with their own. This example highlights the brutal reality of timing: a short position has a “bleeding” cost that fundamental truth cannot always outrun.

Financial concepts linked to this quote

This quote is a perfect opportunity to go deeper into three financial concepts that you may find useful to know more about: short selling, the Efficient Market Hypothesis (EMH) and the time value of money and opportunity cost.

Short selling

To bet against an “overpriced” market, you can short sell something. If we keep the example of stocks, the idea is that you can borrow one Tesla share from someone, and then sell this share on the open market. If the price drops as you planned, you buy back the share for cheaper and give it back to its original owner, and pocket the difference (minus a borrowing fee for whoever owned the share).

Unlike buying a stock, where your risk is limited to your initial investment (the stock can’t be worth less than 0), shorting carries theoretically infinite risk, because there is no ceiling on how high a price can climb.

Short selling explanation
Source : IG Group

But maintaining a short position is not a passive endeavor; it is a “bleeding” process characterized by several layers of costs and pressure:

  • Stock borrow fees: shorting requires you to borrow shares from a lender. In highly speculative or “hard-to-borrow” markets, the interest rates on these loans can spike significantly, eroding your potential profits every day the market refuses to correct.
  • Dividend liability: if the company you are shorting pays a dividend, you need to pay this amount out of your own pocket to the person you borrowed the shares from.
  • The short squeeze risk: as an irrational market climbs, short sellers may be forced to buy back shares to cover their losses, creating even more buying pressure. If too many investors short-sold the stock, if they all want to buy back their positions at the same time, and if not enough shares are available on the market, prices can suddenly surge to absurd levels. This is what we discussed earlier with the GameStop example.

The Efficient Market Hypothesis (EMH) vs. the Keynesian reality

The Efficient Market Hypothesis (EMH) suggests that markets are always rational and instantaneously reflect all available information. Under this framework, there should not be any bubble in the market, because arbitrageurs would immediately correct any deviation from the “fair value”. Keynes’ quote serves as a direct challenge to this theory: it suggests that while markets should be rational, they are frequently driven by “animal spirits”; the human emotions and herd behavior that makes people take irrational decisions.

This creates a dangerous environment where the fundamental value remains decoupled from the market price for extended periods. This divergence is sustained by two primary factors that the EMH often overlooks:

  • Noise trading: Many participants buy based on trends, rumors, or social proof rather than data. This “noise” creates a momentum that rational analysis cannot easily break.
  • The “Greater Fool” theory: some (if not many) investors do not buy assets because they believe they are buying at a good price, but because they expect to be able to resell them at awhat we talked earlier higher price to someone else. Check out this article to see the example of NFTs.

Time Value of Money & Opportunity Cost

Identifying a 10% mispricing in the market is only half the work; you also need to actually profit from it. This means committing capital, and in finance, capital is never free. Every dollar tied up in a trade is a dollar that isn’t earning a return elsewhere. This means your trade must not only be “correct,” but it must also clear a specific hurdle rate to be considered a success.

  • The risk-free benchmark & opportunity cost: in a rational portfolio, the baseline for any investment is the risk-free rate (typically the yield on 10-year treasury bonds for US investors, or German bunds for EU investors). If the risk-free rate is 3% per year, you need to earn significantly more than an annualized 3% on any given trade to justify the risk of not simply sitting in “safe” government debt.
  • Time-adjusted returns: a practical way to see if your trade actually generated a real return is to use proper discounting through the present value formula. It allows you to calculate what a future sum of money (what you will have after the trade) should be worth to you today, to better compute your time-adjusted returns:

PV Formula

As a final example, if you identify a 10% mispricing today, but it takes you four years for the market to correct while the risk-free rate is 3%, your “safe” alternative would have grown to roughly 112.5% of your initial capital. By making only 10%, you have technically lost 2.5% in relative wealth, despite being “right” about the market’s irrationality.

My view on this quote

In addition to the structural limits of arbitrage, this quote serves as a stark reminder of the dangers of leverage. Whether through margin accounts or derivatives, leveraging capital allows you to trade as if you had a much larger balance; however, this acts as a double-edged sword that multiplies both gains and losses.

Because markets can stay irrational for an indefinite period, leverage significantly accelerates the path to insolvency. The market does not have to become rational on your specific timeline—or even at all. This becomes particularly dangerous when market irrationality persists longer than your loan agreement, your margin maintenance requirements, or your hedge fund mandate allows.

We see this frequently in highly speculative assets like cryptocurrencies or stocks with high price-to-earnings ratios, such as Palantir, MicroStrategy, or Tesla. You might be fundamentally correct that a specific valuation is a fantasy, but if you use borrowed money to bet against it, you are playing a high-stakes game. The house (the market) only needs to stay irrational one day longer than you can afford to pay your interest or meet your collateral calls.

Why should you keep this quote in mind?

For students, this is a vital warning against hubris. In your career, you will often see things that don’t make sense. You will be tempted to bet against them. But remember the following principles:

  • Risk management is key: never assume being “right” protects you from being “broke.” Always consider the possibility of being wrong for a very long time.
  • The market is a voting machine: in the short run, it doesn’t matter what the “fair value” is; what matters is what the average investor thinks. You most likely cannot sway the vote alone.
  • Solvency is survival: the most successful professionals are not those who are the most “right,” but those who are still standing when the correction finally arrives.

Ultimately, Keynes’ warning reminds us that the market is a psychological arena as much as a mathematical one. Surviving irrationality is the only way to eventually profit from the rationality.

Related posts on the SimTrade blog

Quotes

▶ All posts about Quotes

   ▶ Hadrien PUCHE “The stock market is designed to transfer money from the impatient to the patient.” – Warren Buffett

   ▶ Hadrien PUCHE The market is never wrong, only opinions are.” – Jesse Livermore

   ▶ Hadrien PUCHE “The four most dangerous words in investing are, it’s different this time.” – John Templeton

Financial techniques

   ▶ Ian DI MUZIO Leverage in LBOs: How Debt Creates and Destroys Value in Private Equity Transactions

   ▶ Raphaël ROERO DE CORTANZE Gamestop: how a group of nostalgic nerds overturned a short-selling strategy

   ▶ Lang Chin SHIU The “lemming effect” in finance

Useful resources

Academic research

Shiller, R. J. (2000) Irrational Exuberance. Princeton: Princeton University Press.

Keynes, J. M. (1936) The General Theory of Employment, Interest, and Money. London: Macmillan.

Shleifer, A., Vishny, R. W. (1997) The Limits of Arbitrage The Journal of Finance, 52(1) 35-55.

Other resources

YouTube Video Fear the Boom and Bust: Keynes vs. Hayek – The Original Economics Rap Battle!.

About the Author

This article was written in April 2026 by Hadrien PUCHE (ESSEC Business School, Grande École Program, Master in Management, 2023-2027).

   ▶ Discover all articles by Hadrien PUCHE

“Diversification is protection against ignorance. It makes little sense if you know what you are doing.” – Warren Buffett

Hadrien Puche

In any asset management class, students are taught that diversification is a key to unlock mathematically optimal risk-adjusted returns. However, Warren Buffett, one of the world’s most successful investors, would beg to disagree: to him, “diversification is protection against ignorance. It makes little sense if you know what you are doing.”

In this article, Hadrien PUCHE (ESSEC Business School, Grande École Program, Master in Management, 2023-2027) discusses Buffett’s challenge to modern portfolio theory, and explains why, for a sophisticated investor, concentration may sometimes also be an option.

About Warren Buffett and this quote

Warren Buffett is the chairman and CEO of Berkshire Hathaway, a multinational holding company, that he transformed over the years into a conglomerate businesses (Geico, dairy queen…) and large equity stakes in listed companies (Coca-Cola, Apple…). He is widely considered the most successful value investor in history. He is known for his discipline, long-term perspective, and his ability to distinguish between market price and intrinsic value. This specific quote originates from his 1993 annual shareholder meeting, where he addressed the difference between a “know-nothing” investor and a “know-something” investor.

Warren Buffett

Source : CNBC

This also suggests that the reason Buffett said that isn’t to give a valuable lesson to investors, but to convince them that instead of looking for diversification and investing themselves, they should entrust their money to Berkshire Hathaway, because they have the informational edge to overperform a simply well-diversified portfolio.

Analysis of the quote

The core of Buffett’s idea is that risk is not a statistical measurement of price volatility, but rather a function of knowledge. If you have three companies you know perfectly (meaning you understand their business model, their management, and their competitive moat) then adding a fourth company “at random” just to diversify will actually increase your overall probability of loss.

Having more diversified portfolios lead to two critical issues:

  • The dilution of quality: your best investment idea is, by definition, better than your tenth best idea. By adding more stocks, you are moving away from your highest-conviction choices toward relatively more mediocre ones, watering down the potential returns of your portfolio.
  • Knowledge risk: spreading your attention across too many holdings dilutes your ability to monitor each one perfectly. You are more likely to miss a fundamental change in a business if you are tracking fifty companies instead of five.

Essentially, diversification only reduces risk when you add an asset you know nothing about to a portfolio of other assets you know nothing about. It is a great tool for the “ignorant” (in the financial sense) to protect themselves from a total wipeout, but it is a “downgrade” for anyone with a true informational edge.

Financial concepts linked to this quote

To better understand this tension between concentration and diversification, we can look at three key concepts that are very important to modern finance.

Modern Portfolio Theory (MPT) & Diversification

In every finance textbook, Modern Portfolio Theory (MPT) is presented as the “only free lunch” in investing. It suggests that by holding a large number of non-correlated assets, an investor can eliminate “idiosyncratic risk” (the risk specific to a company), leaving only the systematic risk of the market.

The Capital Market Line (CML) represents the most efficient combinations of the risk-free asset and the market portfolio. As shown in the graph below, every point on this line offers the highest possible (expected) return for a specific level of risk, effectively defining the “best” available trade-off. In the world of MPT, any portfolio falling to the right of this line is sub-optimal, while the area to the left remains mathematically unreachable.

The capital market line

However, MPT focuses almost entirely on the mathematical “co-variance” of stock prices rather than the underlying business quality. Buffett’s quote acts as a philosophical counter-weight to this academic standard: he suggests that MPT is a defensive tool, designed for those who cannot identify intrinsic value. If you cannot tell a good business from a bad one, MPT is your best protection; but if you can, it is nothing more than a constraint.

The Kelly Criterion

While MPT seeks to minimize variance, the Kelly Criterion seeks to maximize the growth of wealth. Originally developed by John Kelly at Bell Labs, this formula determines the optimal size of a series of bets based on the probability of success and the “edge” the bettor has.

Kelly criterion formula

Unlike the MPT, which would suggest a small allocation to any single stock to keep the portfolio “balanced,” the Kelly Criterion supports heavy concentration. It suggests that when the odds are heavily in your favor, the “bet” should be significantly larger, and can represent a significant portion of your capital. It is the mathematical foundation for the “betting big” philosophy that Buffett has applied throughout his career at Berkshire Hathaway.

Market Imperfection and Information Asymmetry

The Efficient Market Hypothesis (EMH) assumes that all information is already reflected in stock prices. However, Buffett’s success is built on the reality of market imperfections. For an investor to have a true edge, there must be a gap in how information is processed. If you spend hundreds of hours studying a specific niche, you may identify a ‘valuation gap’ that the average market participants missed. But you can’t do this work on all industries and all assets. Because of that, concentration allows you to maximize the financial value of that specific information.

Diversification, by contrast, “washes away” that hard-earned advantage, by blending your good insights with the general noise of the market average.

My view on this quote

While the logic of concentration is mathematically sound, its execution faces a major practical limit: intellectual honesty. To apply Buffett’s philosophy, you need to understand if you are yourself one of the professional managers who can overperform, or a simple retail saver who should go to diversification for protection against your own ignorance.

For an individual investor: humility as a strategy

For the vast majority of retail investors, diversification remains the “wisest default.” The “ignorance” Buffett mentions is not pejorative, but simply a realistic assessment of the time and resources one can dedicate to market analysis. Without a professional informational edge, concentration can often lead to a martingale trap, where an investor doubles down on loosing positions, based on an emotional conviction that the market is wrong and refusal to accept defeat. For this group, Modern Portfolio Theory (MPT) is not a constraint, but a necessary safeguard.

The institutional management problem

For an aspiring asset manager, the reality is a bit more complex, and highlights a structural paradox in the industry, where career incentives are more towards diversifying a portfolio than making a small number of concentrated bets.

  • Career risk versus absolute risk: If a concentrated portfolio underperforms, the manager risks being “wrong alone” and losing their job. If a diversified portfolio fails, they are “wrong with the crowd,” and no one will really consider that the loss is their responsibility.
  • The “closet indexing” trap: To minimize tracking error, many professionals choose the safety of the average. However, Buffett’s logic suggests that if you are not prepared to know your holdings better than the rest of the market, you are merely charging active management fees for a passive result, effectively selling the “market average” at a premium price.

Buffet’s call to invest with berkshire hathaway

Finally, we must consider context behind Buffett’s rhetoric. As we already stated, by framing diversification as a “protection against ignorance,” he is not just teaching finance, but also subtly positioning Berkshire Hathaway as the ideal destination for capital. He encourages investors to recognize their own limitations and, instead of buying a “know-nothing” index, to entrust their wealth to a firm that possesses the rare informational edge required to concentrate effectively. In essence, this quote is also a good lesson in brand positioning: it justified Berkshire Hattaway’s market concentration as the key to overperforming the market.

Why should you keep this quote in mind?

This principle forces you to ask a fundamental question: “Do I have a true edge, or am I just guessing?” If you are a student or a retail investor, recognizing your own ignorance is the first step toward safety. Diversification is your best friend when you are learning.

However, and this is where Buffett’s spirit is very important, if you want to achieve extraordinary results, you must first develop the analytical rigor to know your investments better than the rest of the market. Knowing the “average” only gets you the “average” return.

Related posts on the SimTrade blog

Business & Finance quotes

   ▶ All posts about Quotes

   ▶ Hadrien PUCHE Price is what you pay, value is what you get – Warren Buffett

   ▶ Hadrien PUCHE The stock market is designed to transfer money… – Warren Buffett

Useful resources

Academic research

Kelly J. L. Jr. (1956) A New Interpretation of Information Rate, Bell System Technical Journal 35(4) 917–926.

Markowitz, H. (1952) Portfolio Selection, The Journal of Finance 7(1): 77-91.

Sharpe W.F. (1991) The Arithmetic of Active Management, Financial Analysts Journal 47(1) 7-9.

Business resources

Buffett, W.E. Berkshire Hathaway Shareholder Letters

S&P Global. SPIVA Scorecards

About the Author

This article was written in April 2026 by Hadrien PUCHE (ESSEC Business School, Grande École Program, Master in Management, 2023-2027).

   ▶ Discover all articles by Hadrien PUCHE

“Time in the market beats timing the market.” – Kenneth Fisher

There are two primary approaches to investing in the stock market. Some market participants adopt a trading-oriented strategy; they believe that financial gains depend on their ability to predict the evolution of the market (when to enter and when to exit), or in other words, they try to time the market. Other market participants favor a long-term investment approach: they expect their investments to compound over 10 or 20 years, by spending as much time in the market.

Time in the market vs. timing the market is a classic debate in the investment world. Kenneth Fisher had a very strong opinion on this debate. To him, “Time in the market beats timing the market”. The duration on an investment (the time in the market) is a significantly better factor of success for your investments that the quality of your attempts to optimize entry and exit points (timing the market).

For the vast majority of market participants, the effort to outmaneuver daily fluctuations is not just difficult, but a statistically losing game.

Hadrien PUCHE

In this article, Hadrien PUCHE (ESSEC, Grande École Program, Master in Management, 2023-2027) explores the behavioral and financial foundations of Fisher’s principle, analyzing why the “cost of being out” can often exceed the risks of staying in through market cycles.

About Kenneth Fisher and the quote

Kenneth Fisher

Source: Fisher Investments
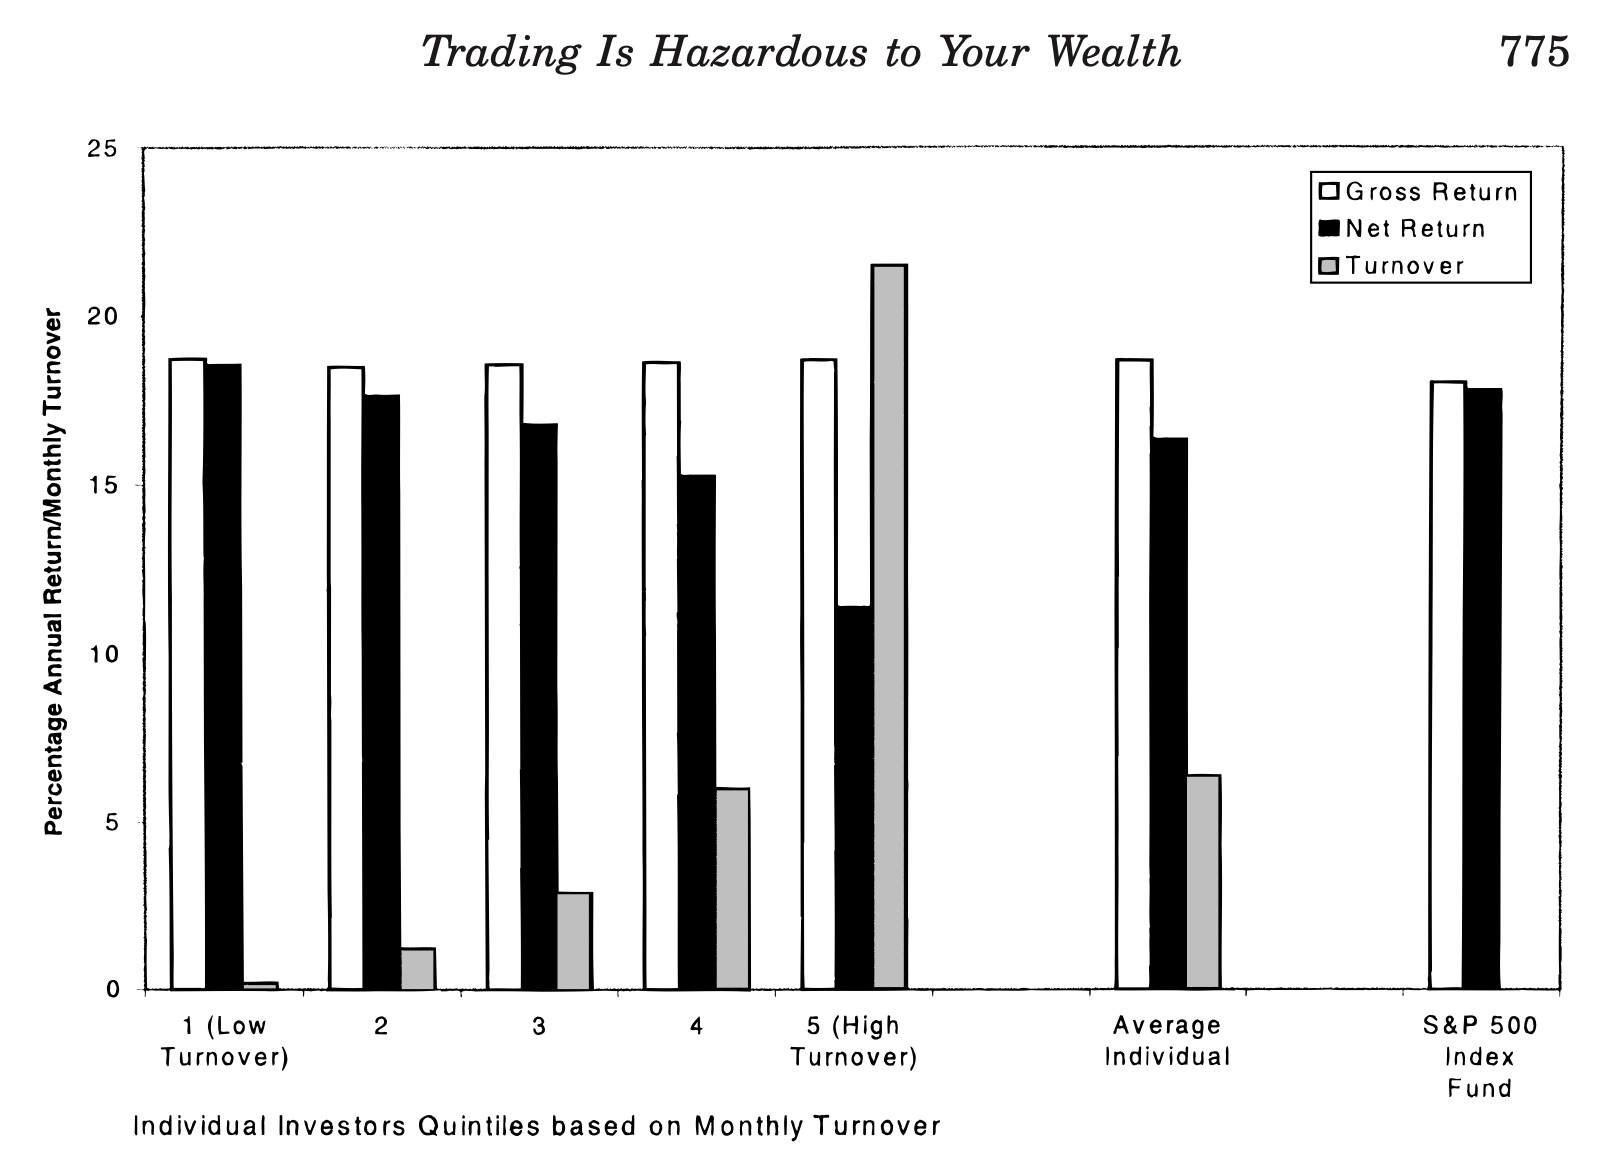
Kenneth Fisher is a billionaire investment analyst, who founded Fisher Investments. He also is a long-time columnist for Forbes. He is well known for his contributions to investment theory, particularly in popularizing the use of the Price-to-Sales ratio. Throughout his career, Fisher has been a vocal critic of the “market timing” fallacy, arguing that most investors hurt their returns by trying to avoid downturns.

This quotes originates from a 2018 USA Today article where Kenneth Fisher wrote :

“Even the greatest investors are wrong maybe a third of the time. But here’s some good news: You don’t need perfect timing to achieve marvelous returns. Time in the market beats timing the market – almost always.”

Analysis of the quote

The fundamental question every investor face is: How to invest? While the allure of “buying low and selling high” sounds simple, executing it consistently is nearly impossible. Fisher’s quote highlights that the market is not a puzzle to be solved daily, but a vehicle to be ridden over years.

“Timing the market” requires two perfect decisions: knowing exactly when to get out and exactly when to get back in. “Time in the market,” conversely, requires only one decision: to start. By staying invested, you capture the total return of the market, including dividends and the recovery phases that follow volatility. Fisher’s principle suggests that the “missed opportunity” of being on the sidelines is the greatest risk of all.

Furthermore, Fisher’s insight also implies that an investment’s duration is very often more important than the yield. Too many investors are obsessed over finding the best “alpha” (a few extra percentage points of return) but forget about duration. A moderate return sustained over decades will always outperform a spectacular return that gets interrupted all the time.

Similarly, another thing to consider is the heavy “cost of inaction” that comes with searching for the perfect entry point. By waiting for the ideal market conditions or trying to identify the absolute best opportunities, you are losing time (and therefore compounding); a cost that is rarely justified by the improved entry point.

Three Financial Concepts Linked to the Quote

We now introduce three financial concepts that are related to this quote, and that you may find useful to understand the mechanics behind Fisher’s principle: the long-term drivers of the market growth, the danger of missing the “Best Days”, and the Dollar Cost Averaging (DCA) to find a good compromise between timing and time.

The long-term drivers of the market growth

To understand why “time in the market” works, we have to look at what actually drives the market’s long-term upward trajectory. Unlike a casino, the stock market is a vehicle for productive capital, and its growth is fueled by fundamental economic forces:

  • GDP Growth & Corporate Earnings: As the global economy expands and companies become more efficient, they generate higher profits. Over decades, stock prices tend to track this fundamental growth in value.
  • Inflation: Since stocks represent ownership in real assets and businesses, they act as a natural hedge. As prices for goods and services rise, nominal corporate revenues and asset values follow suit.
  • The Equity Risk Premium: This is the “extra” return investors demand for choosing stocks over “risk-free” assets like government bonds. To earn this premium, you simply have to be present.

By staying in the market, you aren’t just “hoping” for a rise; you are capturing the compounding effect of global productivity and inflation.

The danger of missing the “Best Days”

When it comes to the statistical distribution of the market returns, it is important to understand that it is highly skewed, with the bulk of annual gains often concentrated in a handful of trading sessions. This concentration creates a massive “cost of being out” for any investor that happens to miss such days.

The figure below shows the distribution of the returns on the S&P 500 index compared to the estimated normal distribution. What matters here is that the S&P500 distribution has much fatter tails than the normal ones; meaning that very high and very low returns happen more than one would expect with a normal distribution.

Figure 1. Distribution of the returns on the S&P 500 index
Distribution of markets returns for the S&P500
Source: Seeking Alpha

The issue with these fatter tails is that missing a small number of high-returns days can be catastrophic for an investor’s terminal wealth. Historically, missing just the 10 best days in a decade is enough to cut an investor’s total return by half, and missing the best 30 days end can turn the returns negative, even in a bull market.

The paradox of the “Time in the Market” is that these “best days” usually occur within weeks or days of the “worst days.” By trying to avoid the worst days, many also miss the best days, and this is where the true opportunity cost lies. The only proven way to make sure that you are present for the best days is to stay invested through the worst ones

DCA: The Compromise Between Timing and Time

Let’s say you have €10,000 today, and you want to invest them in the market. You do not want to “time the market” and want instead to spend “time in the market”. However, you are facing the “entry dilemma”: should you go all-in now or wait for a better price in a few days?

Going all-in (Lump Sum investing) means immediate exposure, but it can make many investors uncomfortable. To make it easier and more manageable, many investors choose to rather do a Dollar Cost Averaging (DCA): investing their money progressively at set intervals (monthly, weekly, etc.).

The DCA approach is psychologically attractive, because it removes the paralysis that comes with the fear of “buying the top.” If the market drops the day after your first investment, you actually benefit by buying the next “tranche” at a lower price. However, financial literature suggests a different reality.

Most academic research, including the study by Brennan, Li, and Torous (2005), argues that Lump Sum investing outperforms DCA roughly 75% of the time. This is because markets have a positive “expected return” (they go up more often than they go down). By holding cash on the sidelines to “average in,” you are essentially betting against the market’s natural upward trajectory.

Brennan’s core argument is that “Dollar-Cost Averaging just means taking risk later.” By choosing DCA, you aren’t avoiding market risk; you are simply delaying your full participation in the market’s growth. The “cost” of this delay is often higher than the benefit of potentially catching a lower entry price.

So why do so many professionals still recommend DCA?

The choice is ultimately a psychological one. While a Lump Sum is mathematically superior, it carries a high “regret risk.” If an investor puts €10,000 in on Monday and the market crashes on Tuesday, they might panic and sell everything, violating Fisher’s principle of staying in the market. DCA acts as a behavioral bridge: it may yield slightly lower returns on average, but it ensures the investor actually stays the course.

Ultimately, the “best” strategy is the one that prevents you from exiting the market prematurely. How much stress do you feel at the idea of a short-term loss? If that stress leads to bad decisions, the “insurance” provided by DCA is well worth the mathematical trade-off.

Why you should always keep this quote in mind

Fisher’s perspective extends far beyond financial advice. It is a reminder that in most cases, in both your personal and professional life, consistency matters more than intensity. While the modern world often rewards the pursuit of the “perfect” moment, this mantra suggests that the duration of your efforts is a far more reliable predictor of success than the timing of your actions.

At its core, this quote is a reminder that time will always be your greatest asset. You may not always secure the highest yields, or the most prestigious returns in the short term, but as long as you maintain a longer presence, the cumulative effect of being active will eventually outweigh the benefits of a single, well-timed move.

Consider your own professional career. As a student, your immediate returns may not be that great, and you may fail at “timing the market” by not landing the perfect role in the perfect company in your first attempt. But as long as you spend more “time in the market” (by building skills, networking, gaining experience…), you will eventually reach your objectives.

There is also a significant (and often overlooked) cost to trying too hard to find the perfect opportunities. When you obsess over timing, you risk analysis paralysis and the exhaustion of your mental capital. Sometimes the most strategic move is to accept the path currently before you, proceed with discipline, and allow the future to unfold. By focusing on your tenure rather than your timing, you trade the stress of the unknown for the certainty of cumulative growth.

In the long run, the most successful individuals are rarely those who waited for the wind to be perfect; they are those who kept their sails up regardless of the weather. By internalizing this quote, you adopt a mindset that values patience as a form of hidden strength, ensuring that your capital (both financial and intellectual) has the necessary room to breathe, and expand.

Related Posts on the SimTrade Blog

   ▶ All posts about Quotes

   ▶ Hadrien PUCHE “The stock market is designed to transfer money from the impatient to the patient” – Warren Buffett

   ▶ Hadrien PUCHE “Price is what you pay, value is what you get” – Warren Buffett

Useful resources

Fisher Investments Market Commentary. Insights from Ken Fisher’s firm on why staying the course matters.

Academic literature

Fama E.F. (1965) Random Walks in Stock Market Prices, Financial Analysts Journal, 21(5), 55-59.

Brinson G.P., L.R. Hood, and G.L. Beebower (1986) Determinants of Portfolio Performance, Financial Analysts Journal, 42(4), 39-44.

Brennan M.J., F. Li, and W.N. Torous (2005) Dollar-Cost Averaging Just Means Taking Risk Later, Review of Finance, 9(4), 509–535.

About the Author

This article was written in February 2026 by Hadrien PUCHE (ESSEC Business School, Grande École Program, Master in Management, 2023-2027).

   ▶ Discover all articles by Hadrien PUCHE

“Investing is stupid if you’re more worried about short-term volatility than long-term quality.” – Charlie Munger

Investing is often a battle with our own emotions. We see prices rise sharply and crash just as fast, and this can lead to very bad investment decisions. However, Charlie Munger’s wisdom comes once again handy, to remind us to avoid overlooking at prices all day-long, because “Investing is stupid if you’re more worried about short-term volatility than long-term quality”.

Hadrien PUCHE

In this article, Hadrien PUCHE (ESSEC Business School, Grande École Program, Master in Management, 2023-2027) explores why Munger’s wisdom serves as a welcome reminding of the difference between short-term price and long-term value.

Charlie Munger: the architect of quality investing

Charlie Munger
Charlie Munger
Source : Fortune

Charlie Munger (1924–2023) was far more than a mere lieutenant to Warren Buffett; he was the primary intellectual catalyst who shifted Berkshire Hathaway’s strategy away from the traditional “cigar butt” school of Benjamin Graham. While Graham sought “fair businesses at a great price,” Munger convinced Buffett of the immense power found in “great businesses at a fair price”. The 1989 Letter to Shareholders is particularly famous for the “Mistakes of the First Twenty-Five Years” where Munger’s influence is clear.

He achieved this by integrating a multidisciplinary framework (incorporating insights from psychology, biology, and physics) to decode the complexities of the financial world, ultimately arguing that the quality of a business is the only reliable engine for long-term wealth.

It has to be said that there is no record of Charlie Munger saying these exacts words, but it does summarize well his investment philosophy.

An analysis of this quote

Munger’s philosophy rests upon the bedrock observation that the stock market operates as a “weighing machine” in the long run, even if it behaves like a “voting machine” in the short term. He famously dismissed the academic obsession with volatility as a proxy for risk, arguing instead that a twenty-percent drawdown is not a “loss” unless the investor is forced to sell, or if the fundamental earning power of the business has permanently deteriorated. Real risk, in the Munger school of thought, is defined strictly as the permanent loss of capital (the inability to recover one’s initial investment), which has almost no correlation with the standard deviation of daily price movements.

Furthermore, Munger recognized that investors are often their own worst enemies, due to “loss aversion” (a biological vestige of our evolutionary past where a declining stock price triggers a “fight or flight” response). He suggested that if an individual lacks the temperament to ignore these short-term signals, they are effectively paying an “emotional tax” that prevents them from reaching the higher echelons of compounding.

Indeed, the first rule of compounding is to never interrupt it unnecessarily; by reacting to volatility, investors often liquidate high-quality assets during temporary market drawdowns, effectively resetting their exponential growth clock and sacrificing future prosperity.

Financial concepts related to the quote

This quote reminds me of a few very interesting financial concepts that you may be interested in.

The flaw with Beta in the modern portfolio theory

In the world of academic finance (specifically within the Capital Asset Pricing Model, or CAPM), risk is mathematically defined as Beta (β), which measures the sensitivity of an asset’s returns relative to the broader market.

As a reminder, the CAPM expresses the expected return of an asset as a function of the risk-free rate, the beta of the asset, and the expected return of the market. The main result of the CAPM is a simple mathematical formula that links the expected return of an asset to these different components. For an asset i, it is given by:

CAPM risk beta relation

Where:

  • E(ri) represents the expected return of asset i
  • rf the risk-free rate
  • βi the measure of the risk of asset i
  • E(rm) the expected return of the market
  • E(rm)- rf the market risk premium.

The risk premium for asset i is equal to βi(E(rm)- rf), that is the beta of asset i, βi, multiplied by the risk premium for the market, E(rm)- rf.

In this model, the beta (β) parameter is a key parameter and is defined as:

CAPM beta formula

Where:

  • Cov(ri, rm) represents the covariance of the return of asset i with the return of the market
  • σ2(rm) the variance of the return of the market.

However, Munger viewed this as a fundamental intellectual error. From an analytical standpoint, if a company’s intrinsic value remains stable while its price drops significantly, the “risk” (the probability of overpaying) has actually decreased, even though the “volatility” (the Beta) has technically increased.

For the rational investor, volatility should be viewed as a provider of liquidity and favorable entry points rather than a threat. When the market overreacts to macro-economic data or geopolitical tension, it creates a “Rationality Gap” where high-quality firms are temporarily mispriced. Munger argued that those who can remain stoic during these periods are the ones who capture the “premium of patience.”

In essence, while the academics are busy calculating standard deviations, the Munger-style investor is busy calculating whether the business’s ability to generate cash remains intact.

”A
What really matters for Charlie Munger is to buy the stock when it is underpriced, and selling it when it is overpriced. Source: Elearnmarkets Blog

ROIC, and the dynamics of the “Economic Moat”

For Munger, “Quality” was not a vague descriptor but a quantifiable financial phenomenon centered on one main metric: Return on Invested Capital (ROIC). The formula is elegant in its simplicity:

ROIC = NOPAT ÷ Invested Capital

Munger observed that over a forty-year holding period, a stock’s total return will inevitably converge toward its ROIC. Crucially, for value to be created, this ROIC must be higher than the Weighted Average Cost of Capital (WACC). If you hold a business that earns six percent on its capital for decades—barely matching its cost of capital—you will ultimately earn a six percent return, regardless of whether you bought it at a “bargain” or a “fair” price. Conversely, if a business earns eighteen percent on capital, the positive spread over its WACC creates a compounding effect that will eventually dwarf any initial valuation premium you paid.

However, high ROIC is a magnet for competition, which is why Munger prioritized companies with a “Economic Moat.” This refers to a structural barrier (such as the brand equity of Coca-Cola, the network effects of Alphabet, or the high switching costs of Microsoft) that prevents competitors from eroding those high returns. Without a moat, the spread between ROIC and WACC is merely a temporary state before mean-reversion takes hold. Therefore, analyzing a business involves a deep dive into its competitive advantages to ensure that its high ROIC is sustainable over decades, and not just over a few quarters.

Time Arbitrage and Tax Efficiency

One big advantage that an individual investor has over a professional fund manager is the concept of “Time Arbitrage.” Most institutional managers are constrained by quarterly benchmarks, and the pressure to avoid “tracking error” (falling behind the index), which forces them to react to short-term volatility to protect their career longevity. However, by extending the time horizon to ten or twenty years, an investor exit this hyper-competitive arena where most traders operate, and enters a space where patience is the primary competitive edge.

This long-term orientation also creates a significant (yet often overlooked) financial benefit: tax efficiency. By refusing to sell during volatile periods, the investor avoids triggering capital gains taxes, which allows the “unpaid taxes” to remain within the investment, and compound for free.

As Munger frequently noted, the “big money” is found in the waiting. By minimizing turnover, you maximize the terminal value of your portfolio, by ensuring that the engine of compounding is never throttled by unnecessary friction or tax leakage.

My opinion on this quote

In my view, this quote is a very interesting take on financial rationality. It is a rejection of the “noise” that defines modern electronic trading. What I find most compelling is Munger’s insistence that volatility is not a hazard, but rather the price of admission for superior returns (a concept many students struggle to internalize when they first encounter the volatility-centric models of academic finance).

To me, Munger is arguing that the market is often a theatre of the absurd where prices decouple from reality due to human emotion; therefore, the only logical response for a serious investor is a disciplined focus on the structural integrity of the business (the quality) rather than the erratic pulse of the stock price.

I believe that the “stupidity” Munger refers to is the intellectual laziness of letting a falling price dictate your perception of a business’s value. It is far easier to look at a chart and feel fear, than it is to dig into a 10-K filing to verify the Return on Invested Capital (ROIC), or the durability of a competitive advantage. By prioritizing quality over volatility, we are essentially choosing to be owners of productive assets rather than gamblers on price movements; and this shift in perspective is, in my opinion, the single most important transition a young financier can make.

Why should this quote matter to you

Whether you aspire to work in Asset Management, Private Equity, or Equity Research, Munger’s perspective is a vital toolkit for professional survival. In the institutional world, you will be constantly bombarded with requests to explain “why the market is down today” or “why a portfolio company underperformed this month.”

If you focus on these short-term “wiggles” in the data, you risk becoming a mere weather reporter. Understanding Munger allows you to move beyond superficial queries and focus on the real metrics: the cash flow margins, the structural moat, the capital allocation of management…

The “ROIC” of your career path

This principle transcends stock picking and applies directly to your own professional trajectory. Think of your career through the lens of Investment vs. Volatility:

  • Career Volatility: These are the temporary setbacks: a tough performance review, a project that stalls, or a hiring freeze. If you overreact to this volatility, you risk making impulsive “trades” with your career that interrupt your progress.
  • Career Quality: This is the compounding value of your technical skills, your network, and your intellectual rigor. These are the assets that generate a high “Return on Invested Capital” (ROIC) for your time and effort.

In finance, the most dangerous mistake you can make is interrupting a compounding process unnecessarily. By prioritizing the “long-term quality” of your professional output over the “short-term noise” of the job market, you ensure that you are building a career that is structurally sound and capable of weathering any economic storm.

Related posts

Quotes

   ▶ All posts about Quotes

   ▶ Hadrien PUCHE “The big money is not in the buying and selling, but in the waiting.” – Charlie Munger

   ▶ Hadrien PUCHE “The market is never wrong, only opinions are.” – Jesse Livermore

Financial techniques

   ▶ Saral BINDAL Historical Volatility

   ▶ Jayati WALIA Capital Asset Pricing Model (CAPM)

   ▶ Youssef LOURAOUI Markowitz Modern Portfolio Theory

   ▶ Youssef LOURAOUI Beta

Useful resources

Kaufman, P.D. (2005) Poor Charlie’s Almanack: The Essential Wit and Wisdom of Charles T. Munger, Third Edition, Virginia Beach, VA: Donning Company Publishers.

Buffett W.E. Berkshire Hathaway Shareholder Letters Omaha, NE: Berkshire Hathaway Inc.

Frazzini A., D. Kabiller, and L.H. Pedersen (2013) Buffett’s Alpha, Working paper.

About the Author

This article was written in February 2026 by Hadrien PUCHE (ESSEC Business School, Grande École Program, Master in Management, 2023-2027).

   ▶ Discover all articles by Hadrien PUCHE

“The market is a continuously unfolding process of discovery.” – Peter Steidlmayer

Financial markets move every second, reacting to every new piece of information, every financial statement, every geopolitical event. Prices rise, fall, move too far, come back again, and for anyone observing from the outside, this constant motion can easily appear chaotic.

Yet, behind this apparent disorder lies a deeper structure, a logic shaped by the continuous exchange between buyers and sellers who negotiate and adjust their positions in real time.

Hadrien PUCHE

In this article, Hadrien PUCHE (ESSEC Business School, Grande École Program, Master in Management, 2023-2027) explains why Peter Steidlmayer’s quote is so meaningful.

Peter Steidlmayer and the origin of market profile

Peter Steidlmayer
Peter Steidlmayer
Source : Profile trading

Peter Steidlmayer is known above all as the creator of the Market Profile methodology, introduced at the Chicago Board of Trade in the early 1980s. His goal was both simple and ambitious: to provide market participants with a clearer understanding of where the market was “accepting” value, rather than simply where prices happened to appear on a linear chart.

The quote that defines his philosophy first gained prominence in his seminal work:

“The market is a continuously unfolding process of discovery. Price is not value in itself, but the market’s best guess at a given moment. Only through the passage of time, with sufficient volume at a given range, can value be established.”

— Peter Steidlmayer, Markets and Market Logic: Trading and Investing with a Sound Understanding and Approach (1986).

Until this publication, most analysis focused on time-based charts that displayed the sequence of prices but said little about the intensity of trading at each level. Steidlmayer added a decisive dimension by incorporating Volume at Price, revealing how the market behaves like a continuous auction. Buyers and sellers negotiate, the market explores different levels, and value emerges where transactions cluster and where time confirms acceptance.

The quote takes its meaning directly from this framework. For Steidlmayer, markets discover value in the same way an auction settles a fair price: not through a single print, but through repeated interaction. A sudden spike tells us very little; it is merely a “probe.” But when the market spends time around a certain level with significant volume, it offers a reliable indication of Accepted Value.

To learn more about market profiles, check out this article by Michel Verhasselt on Market Profiles.


The graph below presents Steidlmayer’s market price distribution. The curve is constructed by dividing the trading session into equal time intervals (typically 30 minutes) and recording each price level traded during every interval. Each instance of a price occurring within a given bracket is labeled a Time Price Opportunity (TPO). The distribution is then formed by aggregating the total number of TPOs at each price level across the session, thereby producing a time-weighted empirical distribution of prices. Under conditions of relative balance between supply and demand, this process often yields a bell-shaped profile. In this framework, price discovery exhibits an ordered structure: the central region of the curve (characterized by a high concentration of TPOs) reflects sustained trading activity and temporary equilibrium, commonly interpreted as the market’s most accepted estimate of fair value. Conversely, the tails correspond to price levels traversed quickly, signaling rejection, imbalance, and potential disequilibrium (often associated with emotional trading).

The distribution curve of prices, a way to estimate the actual value of an asset

Analysis of the Quote

“The market is a continuously unfolding process of discovery” captures the very essence of Steidlmayer’s thinking. By framing the market this way, he reminds us that it is not a static mechanism but a living process in perpetual motion. Prices are not definitive statements of value; they are temporary judgments, mere snapshots of the market’s collective opinion at one precise moment.

Price reflects the most recent consensus, influenced by news, emotion, and short-term liquidity. It is the market’s best guess, but never its final conclusion. True value, on the other hand, does not reveal itself instantly. It appears gradually through the accumulation of transactions that demonstrate where participants genuinely agree. This requires sufficient volume and visible acceptance to prove that a broad set of participants (and not just a few aggressive traders) concurs on a price level.

This distinction explains why short-term volatility often expresses emotion more than fundamentals. In contemporary terms, price discovery is fast and exploratory, while value discovery is slow, deliberate, and shaped by consensus. This is what Warren Buffet meant when he said “Price is what you pay, value is what you get”.

Understanding that the market is a “continuously unfolding” conversation helps investors remain focused on the durable signal of value rather than reacting to the transient noise of price.

Three Financial Concepts Linked to the Quote

Market microstructure and auction theory

Financial markets operate in many ways like auctions. Buyers raise their bids, sellers adjust their offers, and the market constantly seeks the level at which both sides find balance. This is the essence of Market microstructure, the study of how a market’s participants and their behavior determine the price of an asset. Just like in an auction, participants negotiate in real-time, until the highest price someone is willing to pay and the lowest price someone is willing to sell meet.

Steidlmayer’s vision aligns perfectly with the principles of market microstructure: during periods of uncertainty, the market enters a “discovery” phase, where prices move rapidly and vertically to find new participants. This is the market effectively “probing” for the limits of supply and demand, in a continuously unfolding process of discovery.

When a price is found, the market stops moving vertically and starts moving horizontally, spending more time at a specific level to facilitate the maximum amount of trade. These consolidation areas are visual representation of agreement. It shows that the market has stopped searching and has found a temporary equilibrium where both buyers and sellers are satisfied with the price.

”Graph
As you can see here, the price moves in a range until a market event causes an auction. When an appropriate price is found, the market resumes moving in a new range again. Source : Jump trading.

Liquidity

Liquidity plays a decisive role in determining whether a price reflects genuine value or merely a temporary distortion. In finance, liquidity is defined as the ability to buy or sell an asset quickly without significantly affecting its price. It is a multi-dimensional concept, analyzed through several key components:

  • Tightness: Refers to the cost of a transaction, typically measured by the width of the bid-ask spread.
  • Depth: The volume of orders available at various price levels above and below the current market price.
  • Breadth: The number and diversity of market participants, indicating a wide range of interests.
  • Resiliency: The speed at which prices recover to “fair value” after a large, potentially disruptive trade.

In Steidlmayer’s framework, a price level reached on minimal volume is considered “unfair” or an outlier; it tells us very little because it lacks the support of the broader market. On the other hand, a price level traded repeatedly with strong participation speaks with far more authority. It indicates that a large number of participants have agreed on this price, and that is therefore “fair”.

This is why professional investors rely on measures such as the Volume Weighted Average Price (VWAP), the volume profile, and value area boundaries. These tools help separate the meaningful “signal” of institutional conviction from the surrounding “noise” of retail emotion. In essence, price is the discovery mechanism, but volume is the validation.

Without volume, a price movement is a mere suggestion; with volume, it becomes a confirmed consensus of value.

Market efficiency

The quote also relates to the Efficient Market Hypothesis (EMH), which suggests that asset prices reflect all available information. There are three distinct forms of market efficiency:

  • Weak form: Assumes that current prices reflect all information contained in past prices and trading volumes, meaning technical analysis cannot consistently produce excess returns.
  • Semi-strong form: Assumes that prices adjust instantly to all publicly available information, such as earnings announcements or economic data.
  • Strong form: Assumes that prices reflect all information, including private or insider information, according to which price should always equal value.

Steidlmayer proposes a more nuanced and realistic vision: markets are constantly searching for value, and they do not find it immediately. Because the “process of discovery” is driven by human participants with varying expectations, the market often overshoots or undershoot its true value before settling into a new equilibrium.

Mean reversion of a price over time
We can clearly see the market’s propensity for emotional excess, where price extends far beyond fair value before reverting to the mean. These oscillations prove that price discovery is a non-linear process driven by temporary imbalances in supply and demand. Source: dailypriceaction.com

This concept is essential for students. It explains why markets may be broadly efficient over long horizons, but still display irrational behavior in the short term. These “inefficiencies” are not market failures, but proof that the discovery process is in action.

By understanding that the current price is a search (and not a final answer), an investor can remain calm when the market overreacts, knowing that prices will eventually pull back towards the established value area.

My opinion on this Quote

I believe this quote offers a very accurate description of market behavior. It captures, with remarkable clarity, the difference between instantaneous price and durable value. What I find particularly compelling is the way it reframes volatility as part of the market’s natural process of exploration (rather than a source of confusion).

This perspective encourages patience, and reinforces the idea that investors should focus on context and ranges rather than individual specific prices.

However, it is important to nuance this perspective in the context of today’s modern markets. Steidlmayer’s logic was developed in the 1980s, long before the dominance of High-Frequency Trading (HFT) and algorithmic execution. Today, the “process of discovery” often happens in milliseconds, particularly on large cap stocks. While the fundamental principles of auction theory still apply, the transition from price to value is now much faster.

Despite this technological shift, the core lesson remains: the market is a conversation, and even if that conversation is now partly led by machines, the ultimate consensus still requires time and volume to establish true value.

Why should this quote matter to you ?

This quote is a good way of adding an additional level of complexity to your understanding of how markets truly function. Understanding the market’s process of discovery helps better understand markets movements, distinguish noise from genuine information, and avoid reacting impulsively to volatility. It teaches you to appreciate the essential roles of time, liquidity, and volume in revealing value, in order to make better decisions.

Ultimately, this quote conveys a profound lesson. The market is more of a conversation than a verdict, a continuous exchange of perspectives that gradually converges toward value. For any student who hopes to approach markets with discipline and understanding, mastering this idea is both a practical and an intellectual advantage.

Related posts

Famous quotes about valuation

   ▶ All posts about Quotes

   ▶ Hadrien PUCHE “Price is what you pay, value is what you get” – Warren Buffett

   ▶ Hadrien PUCHE “The stock market is filled with individuals who know the price of everything, but the value of nothing.” – Philip Fisher

Other famous quotes

   ▶ Hadrien PUCHE “The big money is not in the buying and selling, but in the waiting.” – Charlie Munger

   ▶ Hadrien PUCHE “Don’t look for the needle in the haystack. Just buy the haystack.” – John C. Bogle

About market profile

   ▶ Michel VERHASSELT Market profiles

   ▶ Michel VERHASSELT Difference between market profiles and volume profiles

   ▶ Michel VERHASSELT Trading strategies based on market profiles and volume profiles

   ▶ Raphael TRAEN Volume-Weighted Average Price (VWAP)

Useful resources

Steidlmayer P.J. and K. Koy (1986) Markets and Market Logic: Trading and Investing with a Sound Understanding and Approach, Porcupine Press.

Steidlmayer P.J. and S.B. Hawkins (2003) Steidlmayer on Markets: Trading with Market Profile, John Wiley & Sons, Second Edition;

TPO versus Volume Profiles

Trader Dale Volume Profile vs. Market Profile – What Is The Difference? YouTube video

About the Author

This article was written in February 2026 by Hadrien PUCHE (ESSEC Business School, Grande École Program, Master in Management, 2023-2027).

   ▶ Discover all articles by Hadrien PUCHE

“The stock market is designed to transfer money from the impatient to the patient.” – Warren Buffett

Financial markets move with a constant rhythm, shaped by news, expectations, and the psychological impulses that influence investors every day. Prices advance, decline, accelerate suddenly, or pause without warning, and to the untrained observer this flow can seem arbitrary or even irrational. This can make it hard for investors to resist the urge of buying or selling their positions quickly.

This quote from Warren Buffett is a warning against it: markets reward those who remain disciplined and focused, while those who act hastily often pay a price for their impatience. The market is not hostile, but it is unforgiving towards impulsive behavior.

Patience allows an investor to benefit from the long-term effect of compounding, and from the natural tendency of solid businesses to grow over time, while impatience often leads to emotional decisions and unnecessary losses.

For students discovering finance, this idea is essential: long term thinking matters far more than reacting to every fluctuation, and why understanding the difference between noise and fundamentals is the foundation of intelligent investing.

About Warren Buffett and the context around this quote

Warren Buffett
Warren Buffett
Source : Forbes

Warren Buffett, often referred to as the Oracle of Omaha, is widely considered one of the most successful investors in history. His approach, inspired by Benjamin Graham and refined over decades, rests on a simple yet profound principle: invest in high quality businesses, pay a fair or attractive price, and allow time to do the work.

Buffett always emphasized the behavioral dimension of investing. He understood that markets are driven not only by numbers and earnings reports but also by the emotions of millions of individuals. His quote emerges from this observation. In his view, wealth tends to move from those who chase quick gains toward those who maintain a steady and patient perspective. Investors who panic in downturns or who jump rapidly from one trend to another often lose sight of the enduring value behind the companies they own, while patient investors remain focused on long term fundamentals and benefit accordingly.

The quote therefore illustrates a philosophy that has guided Buffett’s entire career: patience is not a passive posture but an active discipline that allows value to reveal itself over time.

Analysis of the quote

When Buffett says that the market transfers money from the impatient to the patient, he is not describing a mechanical rule but rather a behavioral reality. Impatient investors tend to react to fear, enthusiasm, fashionable narratives and short-term price movements. They buy when something is rising, they sell when it is falling, and they allow emotion to replace judgment.

Patient investors do the opposite: they base their decisions on analysis, intrinsic value, and long-term expectations. They endure volatility, because they understand that markets move in cycles, and that temporary declines often have little to do with the underlying quality of a business.

This distinction explains why timing the market is so difficult. Prices fluctuate for countless reasons, many of which are unrelated to value. Without patience, investors risk entering at euphoric peaks and exiting at fearful lows. With patience, they allow compounding, earnings growth, and valuation discipline to work slowly but steadily in their favor.

Financial concepts linked to the quote

To understand why the market favors the patient, we must look at the structural and psychological mechanics that reward those who remain calm.

Compounding: why time is your most important asset

The most powerful tool available to an investor is compounding, a process where the returns on your capital begin to earn their own returns.

However, compounding is not a linear process; it is exponential. In the early stages, progress often feels slow and invisible, which is where many “impatient” investors make the mistake of quitting or changing strategies. To benefit from the “snowball effect,” an investor must possess the patience to endure these quiet early years so that the math can eventually reach its explosive later stages.

A graph showing the difference between simple and compounded interest
As you can see on this graph, compounded interest becomes trully impressive only after quite a long time.

To better understand the power of compounding, download this excel file and try to play around with the interest rate.

Download the Excel file to learn more about how compounding works

Every time an investor reacts to market volatility by selling or switching positions, they effectively stop their compounding clock. This “stop-and-go” approach is costly; by exiting the market out of fear, you don’t just avoid potential losses : you also forfeit the most explosive days of growth that often follow a downturn.

Since the market is nearly impossible to time perfectly, the most reliable path to wealth is not “timing” the market, but maximizing your time in the market.

The hidden cost of action bias

In nearly every aspect of life, effort correlates with reward: working harder, studying more, or practicing longer typically yields better results. However, the stock market operates under a different logic: it punishes excessive activity.

This counter-intuitive reality is best captured by the action bias, a powerful psychological urge to react to every market fluctuation or news headline by adjusting one’s portfolio.

The consequences are financially tangible : each impulsive trade incurs friction costs : brokerage fees, commissions, capital gains taxes… . Over time, these small deductions compound themselves into a significant drag on returns.

Studies, such as the landmark research by professors Brad Barber and Terrance Odean titled “Trading Is Hazardous to Your Wealth,” consistently show that the most active investors typically underperform simpler strategies. By analyzing thousands of accounts, they discovered that the most frequent traders earned significantly lower returns (by a margin of several percentage points) than those who simply stayed the course.

Investors who trade more end up with lower returns
Source: Barber, B. M., & Odean, T. (2000).

This happens because attempts to “time” the market or avoid perceived risks often lead investors to miss crucial recovery periods. In doing so, they effectively turn off their compounding engine at precisely the wrong moment, proving that in the market, activity is often the enemy of performance.

Patience, therefore, isn’t just about waiting; it’s the profound discipline of knowing when to do nothing. It means resisting the innate human desire to act when faced with uncertainty, and trusting the long-term compounding process.

For students, understanding action bias is crucial. True control in investing often comes from emotional restraint, not constant intervention, and you should always remain calm when others panic.

Diversification: don’t put all your eggs in the same basket

Patience is not merely a test of willpower; it also requires a properly structured portfolio, as it is far easier to remain calm when your entire financial future does not depend on a single outcome. This is where diversification (the practice of spreading investments across various companies, sectors, geographies, and asset classes) becomes a psychological necessity.

By ensuring you aren’t “putting all your eggs in one basket,” you replace the high-stakes anxiety of gambling with the steady reliability of participating in global economic growth.

Diversification therefore is important as an emotional safety net. If you concentrate your wealth into a single “trendy” stock and its price collapses, your natural instinct will be fear, which often leads to selling at the worst possible time. On the other hand, by diversifying your portfolio through an index fund, the failure of one company can be offset by the success of others. This limits the risk of a permanent loss of capital, and helps view market storms as temporary noise rather than a disaster.

A graph representing the overall risk of a portfolio as a function of the number of positionsIncreasing the number of securities in a portfolio reduces unnecessary risk, limiting the risk of excessive fear for the investor
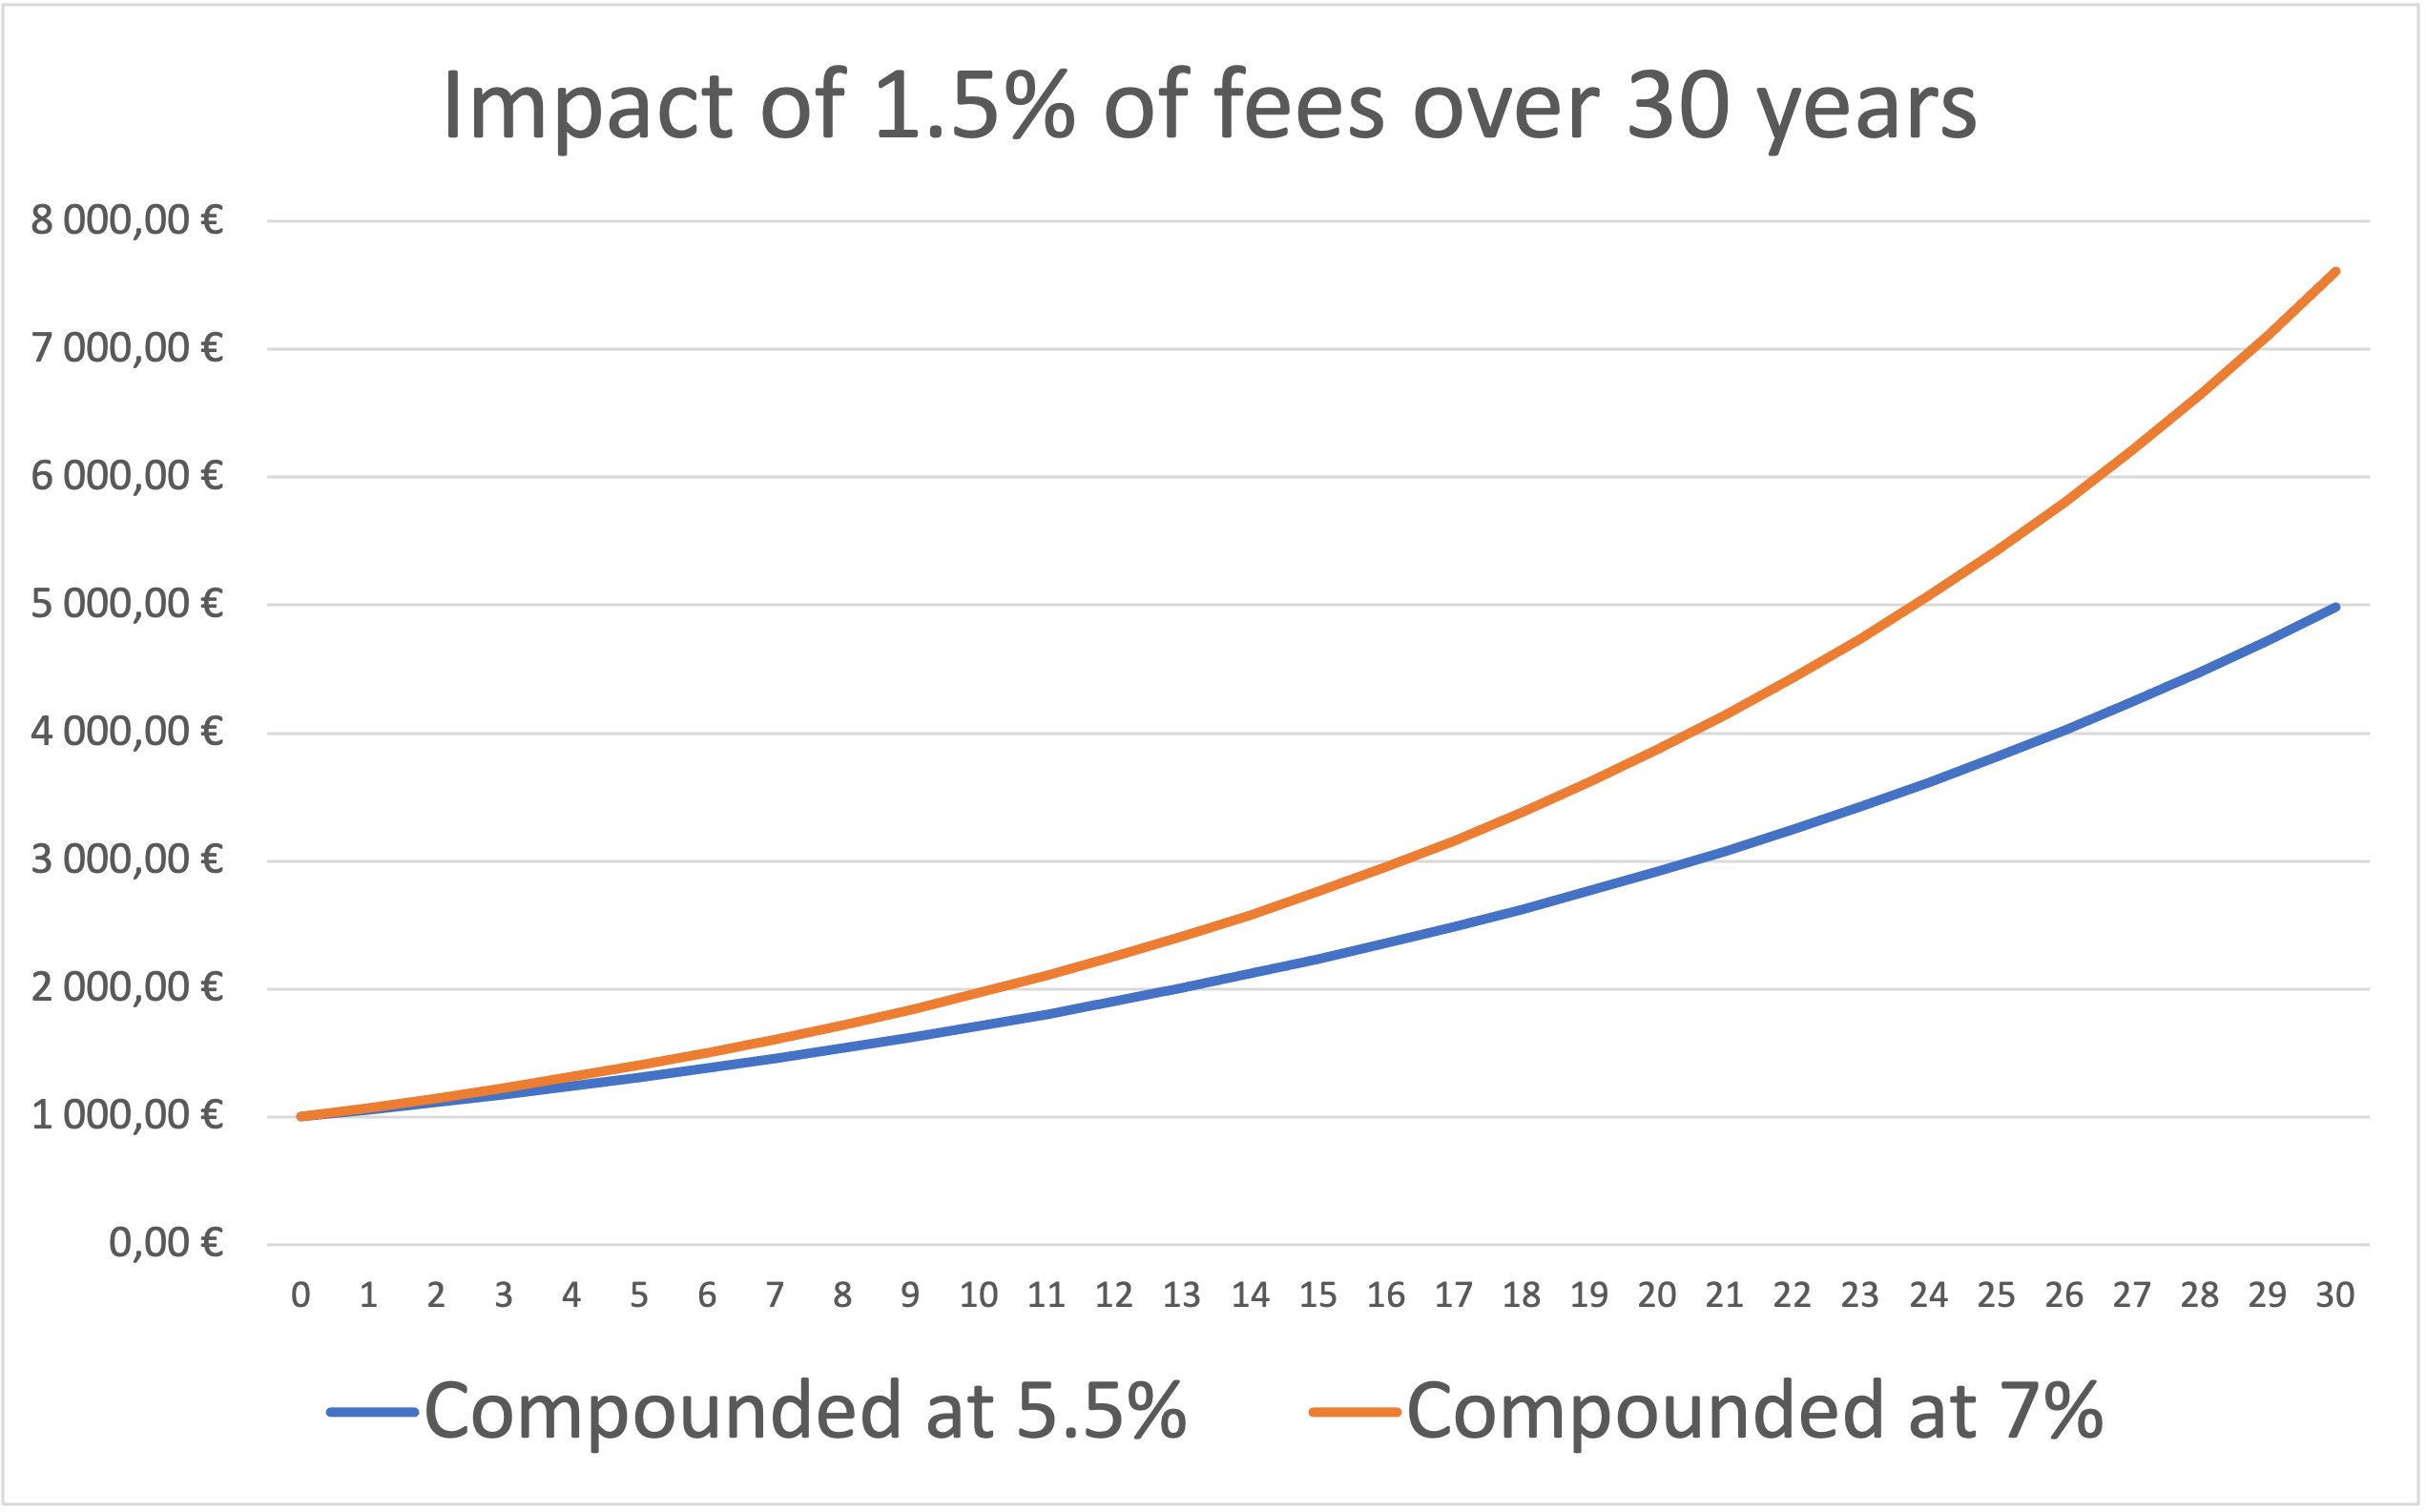

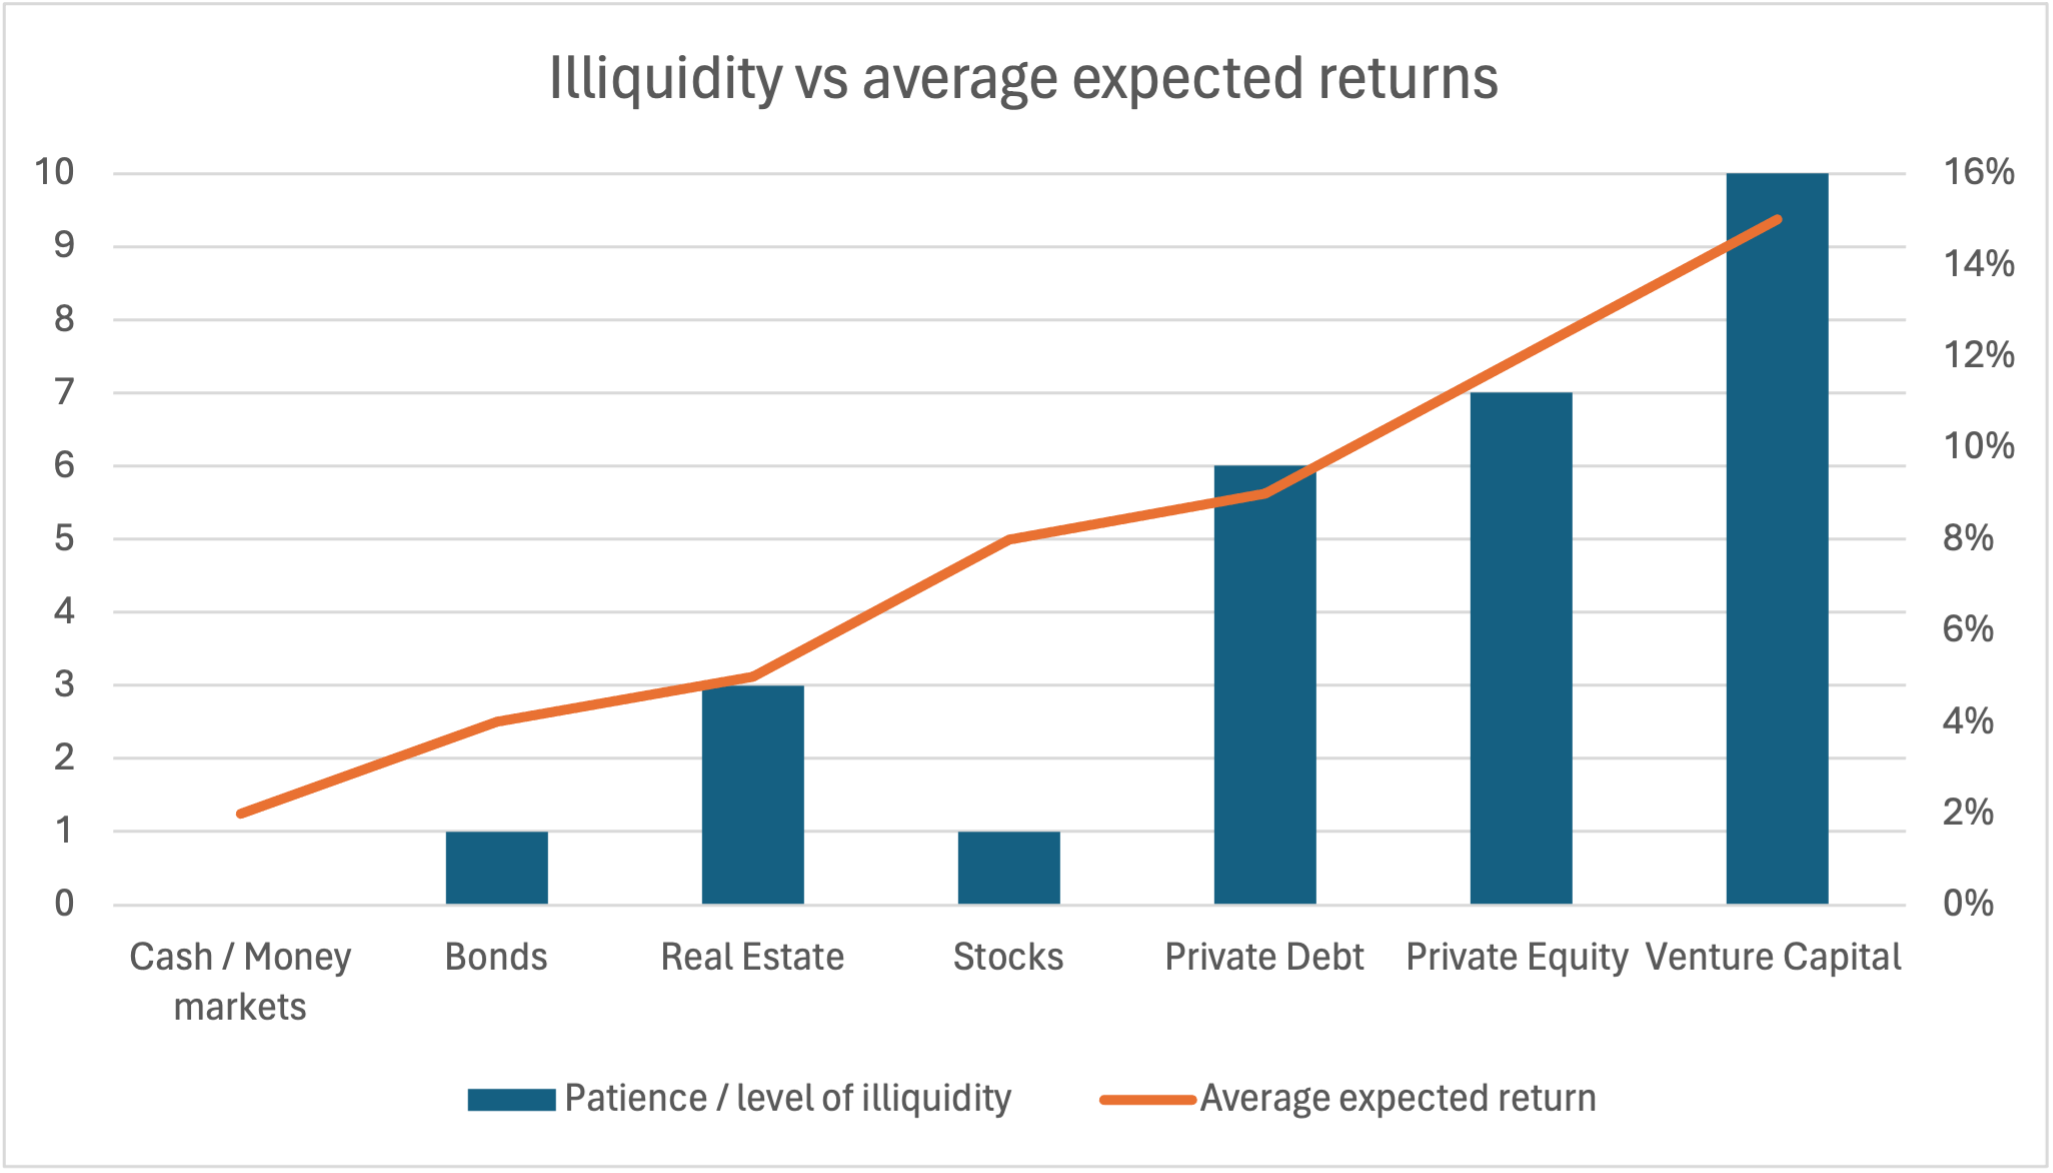
The arithmetic of active management (Sharpe’s Law)

While Buffett focuses on the behavior of the investor, Nobel Laureate William Sharpe focuses on the math of the market. In his paper The Arithmetic of Active Management, Sharpe presents a simple, undeniable logic:

  • Before costs, the average active manager must earn the same return as the market (the passive benchmark). The market return is the average of all manager’s returns, so it makes sense that the average manager’s return must be the market return.
  • After costs (management fees, trading commissions, bid-ask spreads), the average active manager must underperform the average passive manager, because they have to bear higher costs.

This is not a matter of opinion, but a mathematical certainty. Passive investors hold the market at a very low cost, when active investors, as a group, hold the same stocks but pay high fees to analysts, traders, and managers who try to “beat” each other.

The impact of fees: the “silent killer” of compounding

Fees are the ultimate enemy of the patient investor. If the market returns 7% and an active fund charges 1.5% in fees, the investor only keeps 5.5% every year.

But over 30 years, that 1.5% difference doesn’t just reduce your return by 1.5%: that lost money is never allowed to compound, and because of this, your final wealth will by much lower.

graph of the difference in returns between a 5.5% compounding and a 7% compounding

As Sharpe argues, active management is a “zero-sum game” before costs, but a “negative-sum game” after costs for the participants involved.

My opinion on the quote

I believe this quote captures one of the most essential truths in investing: behaviour matters just as much as analysis. Patience is not a simple virtue, it is a true competitive advantage. In a world where information circulates instantly and where impatience is encouraged by constant market noise, choosing to remain calm and long term oriented becomes a rare and valuable discipline.

Buffet’s perspective also helps reinterpret market volatility. Rather than seeing it as a threat, patient investors see it as an opportunity to accumulate quality assets at reasonable prices. Impatient investors, on the contrary, allow volatility to dictate their actions, which often leads to regret. For students, understanding this psychological dimension is essential because it prepares them for the realities of financial markets where noise is constant and conviction must be earned.

Why you should care about this quote

This quote is about avoiding impulsive reactions to short term movements, being able to distinguish between emotion and information, and to appreciate the slow and steady nature of compounding. It emphasizes the importance of discipline, valuation, and long term thinking, and it reveals why the greatest investors often seem remarkably calm in the face of market turbulence.

Ultimately, Buffett’s quote reminds us that markets reward patience not by coincidence but by design. They favor those who stay focused while others are distracted, those who think in years rather than in minutes, and those who allow value to express itself with time. For any student aspiring to navigate markets with intelligence and serenity, this is a principle worth integrating into your financial education.

Related posts

Famous quotes

   ▶ All posts about Quotes

   ▶ Hadrien PUCHE “Price is what you pay, value is what you get” – Warren Buffett

   ▶ Hadrien PUCHE “Patience is bitter, but its fruit is sweet.” – Aristotle

   ▶ Hadrien PUCHE “The big money is not in the buying and selling, but in the waiting.” – Charlie Munger

Asset management

   ▶ Youssef LOURAOUI Active investing

   ▶ Youssef LOURAOUI Passive investing

Useful resources

Academic research

Barber, B. M. & Odean, T. (2000) Trading Is Hazardous to Your Wealth: The Common Stock Investment Performance of Individual Investors. The Journal of Finance, 55(2), 773–806.

Barberis, N. & Thaler, R. (2003) A Survey of Behavioral Finance. Handbook of the Economics of Finance, 1B, 1053–1128.

Odean, T. (1999). Do Investors Trade Too Much? The American Economic Review, 89(5), 1279–1298.

Sharpe, William F. (1991). The Arithmetic of Active Management. Financial Analysts Journal, 47(1), 7–9.

Business resources

Buffett W.E. Berkshire Hathaway Shareholder Letters Omaha, NE: Berkshire Hathaway Inc.

Schroeder A. (2008) The Snowball: Warren Buffett and the Business of Life. New York: Bantam Books, 2008.

About the Author

This article was written in February 2026 by Hadrien PUCHE (ESSEC Business School, Grande École Program, Master in Management, 2023-2027).

   ▶ Discover all articles by Hadrien PUCHE

“The big money is not in the buying and selling, but in the waiting.” – Charlie Munger

In an era dominated by instant trading for individuals, high-frequency trading firms, ever-faster market infrastructures, and social-media-driven market narratives, patience has become an underrated virtue.

Hadrien PUCHE

In this article, Hadrien PUCHE (ESSEC Business School, Grande École Program, Master in Management, 2023-2027) comments on Charlie Munger’s famous quote about the role of patience and discipline in long-term investing, and what it teaches us about the power of compounding, temperament, and time.

About Charlie Munger

Charlie Munger (1924–2023) was the long-time vice chairman of Berkshire Hathaway, and Warren Buffett’s closest business partner for over 50 years. Munger profoundly influenced Buffett’s philosophy, steering him toward buying high-quality businesses and holding them for the long run.

Munger’s wisdom combined principles from psychology, economics, and philosophy to form a timeless view of markets and human behavior.

Charlie Munger
Source: Wikimedia Commons

About the quote

“The big money is not in the buying and selling, but in the waiting.”

This quote is one of Charlie Munger’s most enduring lessons, though its origins date back to the 1923 classic Reminiscences of a Stock Operator by Jesse Livermore. Munger adopted and popularized this wisdom throughout his career, most notably during the Berkshire Hathaway annual shareholder meetings, to explain the firm’s extraordinary success.

The quote encapsulates the essence of long-term investing: wealth is not built through frequent market timing, but through the quiet power of patience and compounding. Munger and Buffett repeatedly emphasized that the most successful investors are not those who move the fastest, but those who possess the “temperament” to sit still when the rest of the market is acting impulsively.

Ultimately, this principle suggests that time, rather than timing, is the real driver of wealth creation. In Munger’s view, “waiting” is an active strategy. It is the disciplined choice to let your initial thesis play out without the interference of market noise or emotional reactions.

Analysis of the quote

This quote highlights a key principle of investing: activity is not the same as value creation. Many investors confuse motion with progress, feeling the urge to trade constantly in response to news, trends, or short-term price fluctuations.

Munger’s philosophy reminds us that wealth is not “generated” by the act of trading; it is accumulated by letting compounding do its work, a process that rewards patience and conviction far more than speed. Charlie Munger’s observation, “The first rule of compounding is to never interrupt it unnecessarily,” distills decades of investing wisdom into a single principle: long-term wealth creation depends less on brilliance than on consistency and emotional endurance.

Every time an investor exits a position due to short-term fear or a desire to “lock in” small gains, they “reset” the clock and sacrifice the exponential growth that occurs in the final years of a holding period. Furthermore, frequent activity creates “leakage” through trading costs and taxes, which act as a constant drag on returns.

In essence, Munger’s rule is a call for consistency over cleverness, emphasizing that compounding rewards time and temperament, qualities far rarer and more valuable than momentary flashes of insight.

Financial concepts related to the quote

I present below three financial concepts: the power of compounding, opportunity cost and value of inactivity, and the patience premium of investor behavior.

The Power of Compounding

Compounding is the process by which returns themselves begin to generate further returns: a self-reinforcing cycle of growth. Its effect is exponential rather than linear: small, steady gains, that accumulate dramatically over time.

For instance, at a 10% annual return, an investment of 100 grows to 110 after one year, 259 after ten years, and 1,745 after thirty years. The formula for the future value Vf is:

Vf = Vi × (1 + ρ / n)n × t

Where ρ (rho) is the interest rate and n is the number of times that interest is compounded every year. The key variable is time (t): the longer the compounding process continues uninterrupted, the greater the growth. Interruptions through withdrawals or frequent trading can significantly reduce the ultimate value of the investment.

Opportunity Cost and the value of inactivity

In behavioral and financial terms, opportunity cost is what one sacrifices by choosing one action over another. Many investors mistakenly equate activity with progress, yet frequent transactions often lead to higher costs, taxes, and emotional errors. As Buffett and Munger emphasize, strategic inactivity (allowing quality investments to compound) is often the most effective decision one can make.

The “Goalkeeper Syndrome”: A Lesson from the Pitch

This tendency to favor motion over stillness is driven by action bias. A study by Bar-Eli et al. (2007) on elite soccer goalkeepers found that while goalkeepers have the highest probability of stopping a penalty by staying in the center of the goal, they only do so 6.3% of the time. In over 93% of cases, they dive to the left or right.

This “Goalkeeper Syndrome” is best explained by Daniel Kahneman’s Norm Theory (Thinking, Fast and Slow, 2011). Kahneman demonstrates that humans feel more intense regret when a bad outcome results from an action than from an inaction—unless the action is the norm.

In the goalkeeper’s case, jumping is the social norm. If a goal is scored while the keeper stands still, they appear to have “done nothing,” which is socially and emotionally harder to bear. If they dive and miss, they have “tried.” For investors, this creates a dangerous paradox. In the investment industry, “activity” is often the norm. A fund manager who does nothing during a market shift risks being seen as lazy or incompetent. By “diving” into a new trade, they protect themselves from the intense regret of being wrong while being inactive.

Recognizing this bias is essential for any finance professional. True discipline lies in knowing when to act, and having the courage to stay in the center of the net when everyone else is jumping.

The Patience Premium and Investor Behavior

Behavioral finance demonstrates that human psychology often works against long-term success. Biases like overconfidence, loss aversion, and herd behavior push investors to buy high and sell low. The ability to stay rational when others panic — to maintain conviction in one’s analysis rather than react to market noise — creates a powerful advantage.

This discipline produces what can be called a patience premium: higher long-term returns earned simply by avoiding costly mistakes. As Warren Buffett summarized, “The stock market is a device for transferring money from the impatient to the patient.”

Private equity provides a practical illustration of the patience premium. Investments in private companies are typically illiquid for many years, forcing investors to maintain a long-term perspective. This “forced patience” comes with a reward: private equity funds historically deliver higher returns than public markets, reflecting both the illiquidity premium and the benefits of disciplined, long-term value creation.

Illiquidity vs average expected returns graph
In general, more illiquid investments offer higher expected returns, as investors are compensated for the additional illiquidity risk. Note: Values are illustrative.

Beyond the financial premium, illiquidity serves as a vital behavioral guardrail. In public markets, the ability to sell an asset instantly makes it far easier to succumb to panic during market turbulence. You cannot “panic sell” an asset that you cannot sell quickly. By removing the option for impulsive exits, illiquid structures protect investors from their own emotional reactions, ensuring that compounding is never interrupted unnecessarily.

My opinion about this quote

I believe this quote captures one of the hardest truths in investing: sometimes the most profitable action is to do nothing. In today’s world of trading apps, meme stocks, and 24-hour market news, patience feels almost countercultural. Investors are constantly nudged to act, reacting to every headline or social media hype. Yet, this very activity often erodes long-term returns.

One concrete way to see this principle in action is through passive investing. Actively managed funds exist with the goal of outperforming their benchmark indexes, yet studies like SPIVA (S&P Indices Versus Active) show that most fail to do so over long periods. For instance, over 10-year periods, roughly 80% of U.S. equity funds underperformed the S&P 500 index.

underperformance rates over time SPIVA
This SPIVA graph illustrates that most actively managed funds underperform their benchmark index over the long term, highlighting the advantage of passive investing.

However, this debate between active and passive management leads us to a fascinating theoretical tension: the Grossman-Stiglitz Paradox. If every investor followed the “sweet fruit” of passive investing because it is statistically superior, the market would cease to function properly and make active investment worth it again.

The paradox, formulated by Sanford Grossman and Joseph Stiglitz in 1980, suggests that markets cannot be perfectly efficient. If a market were perfectly efficient (meaning all information is already reflected in the price), no one would have an incentive to spend time uncovering new information. But if no one uncovers information, the market becomes inefficient. Therefore, the market must remain “efficiently inefficient”: it requires active managers to do the “bitter” work of research, even if they often fail to beat the index, so that passive investors can enjoy the “sweet” ride of a mostly accurate market price.

Yet, the lesson is clear: staying invested in a broadly diversified index often beats trying to “time” the market. The patient investor harnesses compounding without the friction of trading costs, taxes, and emotional mistakes. As Munger famously noted, “the big money is not in the buying and selling, but in the waiting.” It’s not about inactivity for its own sake; it’s about informed, disciplined inactivity.

Why should you be interested in this post?

Beyond investing, this quote is about cultivating a mindset of patience, discipline and rational thinking that can separate successful individuals from the crowd. Mastering the art of waiting will give you an edge, no matter which industry you desire to work in.

Careers, skills, and personal growth all compound like investments; building expertise takes time. Quick wins may feel gratifying, but long-term impact comes to those who embrace patience and persist through the quiet, unglamorous work that others sometimes avoid.

Related posts

   ▶ All posts about Quotes

   ▶ Hadrien PUCHE “The stock market is filled with individuals who know the price of everything, but the value of nothing.” – Philip Fisher.

   ▶ Hadrien PUCHE “Most people overestimate what they can do in a year and underestimate what they can do in ten.” – Bill Gates

   ▶ Hadrien PUCHE “Patience is bitter, but its fruit is sweet.” – Aristotle

Useful resources

Berkshire Hathaway’s website: www.berkshirehathaway.com

Munger, Charlie. Poor Charlie’s Almanack, 2005.

Buffett, Warren. Berkshire Hathaway Shareholder Letters.

Kahneman, Daniel. Thinking, Fast and Slow, 2011. (especially Chapter 32 on regret and norm theory).

Bar-Eli, M., Azar, O. H., Ritov, I., Keidar-Levin, Y., & Schein, G. (2007) Action bias among elite soccer goalkeepers: The case of penalty kicks. Journal of Economic Psychology, 28(5), 606-621.

About the Author

This article was written in January 2026 by Hadrien PUCHE (ESSEC Business School, Grande École Program, Master in Management, 2023-2027).

   ▶ Discover all articles by Hadrien PUCHE

“Patience is bitter, but its fruit is sweet.” – Aristotle

Waiting is never easy. In life, at work, and certainly in finance, we are naturally drawn to quick outcomes and instant gratification. This preference for immediacy is built into our psychology, a leftover from a time when obtaining resources in the present meant survival.

This is why the quote resonates so strongly. It expresses a universal tension between the comfort of the present and the rewards that arrive only through the passage of time. The analogy with food captures the idea beautifully: most of us choose what tastes good now, such as a sugary treat or a risky trade, instead of what will benefit us later, like a healthy meal or a disciplined investment. Markets consistently reward discipline, yet human nature urges us toward the immediate emotional release provided by action.

Hadrien PUCHE

In this article, Hadrien PUCHE (ESSEC, Grande École Program, Master in Management, 2023-2027) comments on Aristotle’s famous quote about the discipline required for long-term success.

Aristotle

Aristotle
Source: Wikimedia Commons

Aristotle was one of the most influential thinkers in ancient Greece and a foundational figure of Western philosophy. Born in the fourth century BCE in Stagira, he studied under Plato and later tutored Alexander the Great. He founded the Lyceum, emphasizing careful observation and reason across logic, ethics, and metaphysics.

In ethics, Aristotle focused on character development through deliberate practice. He believed virtues like patience are not natural gifts, but habits formed through repeated disciplined actions. This connects directly with long-term investing, which rewards consistent behaviors and emotional mastery. While the quote is often misattributed, its message stands at the center of successful investing: the true test is not intelligence, but emotional endurance.

Analysis of the Quote

This quote encompasses the central tension in investing: the difficulty of the present versus the reward of the future. In markets, patience is an active discipline. It requires staying invested through volatility and resisting popular trends. These moments of discomfort represent the “bitter” side of patience.

The “sweet fruit” is compounding—a force that transforms small, consistent gains into extraordinary outcomes. It only rewards those who give it time. Legendary investors like Buffett, Lynch, and Munger insist that patience, not genius, accounts for their success. The investor who endures temporary discomfort for long-term clarity exercises patience exactly as Aristotle would have understood it.

Short term vs long term trends
Short-term variations matter less than the long-term average trend. Source: Wikimedia Commons.

Historical Failures of Patience

History shows that impatience fueled many financial catastrophes. During the 17th-century **Tulip Mania**, prices soared as traders flipped bulbs for quick profits, only to see the market collapse in days. The same pattern repeated in the **South Sea Bubble** and the **Dot-Com Bubble**, where speculation displaced fundamentals. Across these episodes, short-term excitement overshadowed long-term thinking, turning promising opportunities into costly lessons.

Financial Concepts Tied to the Quote

Time Horizon: The Power of μ over σ

Having a long time horizon allows investors to rely on fundamentals rather than hype. Quantitatively, this is the battle between the expected return ($\mu$) and volatility ($\sigma$). While market prices are dominated by $\sigma$ (random swings) in the short term, the long-term outcome is driven by $\mu$ (intrinsic growth).

Probability of loss depending on time

Viewing decisions through a 10 or 20-year perspective reframes downturns as opportunities. This is due to time diversification: as the holding period ($t$) expands, the annualized volatility decreases at a rate of $1/\sqrt{t}$. Time reduces the “noise,” making the fundamental $\mu$ eventually overwhelm the temporary $\sigma$.

Risk and Reward Balance

Patience does not remove risk, but it improves emotional endurance. Impatient investors often understand risk in theory but panic when it appears on a statement, leading to selling at the worst time. Patient investors focus on long-term goals, allowing time to work as a risk management tool.

Opportunity Cost and the Value of Inactivity

In behavioral finance, opportunity cost is what one sacrifices by choosing one action over another. Many investors mistakenly equate activity with progress, yet frequent transactions lead to higher costs and taxes. Buffett and Munger emphasize that strategic inactivity is often the most effective decision.

This tendency to favor motion is driven by action bias, or the “Goalkeeper Syndrome.” A study by Bar-Eli et al. (2007) found that goalkeepers have the highest probability of stopping a penalty by staying in the center of the goal, yet they do so only 6.3% of the time. They dive because the regret of “doing nothing” feels worse than the regret of a failed action. This carries over to investment management, where investors churn portfolios during volatility just to feel in control.

My Opinion in a Modern Context

This quote is especially relevant today. Trading apps encourage activity, and social media amplifies FOMO (Fear of Missing Out). In this environment, patience is a competitive advantage. Successful investors are often not the smartest, but the most consistent. In a world that rewards speed, the courage to wait becomes rare and extremely valuable.

Why This Quote Should Matter to You

Patience isn’t just a pleasant virtue; it’s a tool that shapes results. Whether building a career or managing finances, patience allows you to:

  • Make thoughtful choices grounded in clarity rather than impulse.
  • Avoid stress-driven errors.
  • Stay aligned with long-term goals despite short-term distractions.

Related Posts on the SimTrade Blog

   ▶ All posts about Quotes

   ▶ Hadrien PUCHE “Most people overestimate what they can do in a year…” – Bill Gates

   ▶ Hadrien PUCHE “Price is what you pay, value is what you get” – Warren Buffett

Useful resources

Aristotle. Nicomachean Ethics. Translated by Terence Irwin. Hackett Publishing, 1999.

Bar-Eli, M., Azar, O. H., Ritov, I., Keidar-Levin, Y., & Schein, G. (2007). Action bias among elite soccer goalkeepers: The case of penalty kicks. Journal of Economic Psychology, 28(5), 606-621.

Kindleberger, Charles P., and Robert Aliber. Manias, Panics, and Crashes. Palgrave Macmillan, 2011.

Mackay, Charles. Extraordinary Popular Delusions and the Madness of Crowds. Wordsworth Editions, 1995.

About the Author

This article was written in January 2026 by Hadrien PUCHE (ESSEC Business School, Grande École Program, Master in Management, 2023-2027).

   ▶ Discover all articles by Hadrien PUCHE

“The stock market is filled with individuals who know the price of everything, but the value of nothing.” – Philip Fisher

Hadrien Puche

Financial markets are filled with numbers that move every second, yet many investors miss the most important insight: true value often lies hidden beneath the surface of the price.

In this article, Hadrien Puche (ESSEC, Grande École, Master in Management, 2023-2027) comments on this quote by Philip Fisher, who reminds us that understanding a stock’s price does not equal understanding the business it represents.

About Philip Fisher

Philip Fisher
Philip Fisher
Source: Banco Carregosa

Source : Banco Carregosa

Philip Fisher was one of the most respected investors of the twentieth century, and a true pioneer of growth investing. His book Common Stocks and Uncommon Profits (1958) profoundly influenced generations of investors, including Warren Buffett. Fisher was known for his focus on long-term thinking, innovation, and the qualitative aspects of companies, such as the quality of their management and their ability to grow sustainably, rather than on short-term market fluctuations.

Fisher wanted to emphasize that many players focus only on fleeting gains. Many market participants look only at short-term movements. They react to price changes, trends, and market noise, trying to profit quickly without ever questioning what those prices truly represent. They know the numbers, but they ignore the narrative and substance behind them.

By contrast, value-oriented investors, a movement beautifully illustrated by Benjamin Graham and his work The Intelligent Investor, seek to understand the fundamentals. They analyze business models, competitive advantages, and long-term prospects. They recognize that real wealth creation comes not from anticipating market swings, but from identifying companies that generate lasting value over time.

Analysis of the Quote

Most people active in financial markets are obsessed with prices. They can quote them instantly, track them in real time, and build strategies around them. Yet, few take the time to understand the real worth of what they are trading. They follow market sentiment and aim for short-term profits, often ignoring the bigger picture.

At his time, by “individuals”, Philip Fisher mostly meant individual investors. Nowadays, whilst financial institutions play a much larger role in financial markets, it’s very interesting to see that it still applies to many of them. Just like individuals in the past, and despite being much more aware of this issue, they too focus mostly on momentum and very short-term price signals over in-depth fundamental analysis. Ask a trader to price any derivative, and he will do so without ever even trying to understand the quality of the underlying asset.

True investors think differently. They are less concerned with what the market says today and more interested in what a company will be worth in five or ten years. They try to connect numbers with meaning, and prices with fundamentals. Fisher’s quote is a warning against superficiality, and a call to think independently, with patience and perspective.

Economic and Financial Concepts Related to the Quote

We can now introduce four financial concepts that are related to the quote, and that are interesting for you to understand.

1 – Financial Markets and Capital Allocation

At their core, financial markets exist to efficiently allocate capital between those who need it and those who can provide it. There are mostly two kind of capital markets :

  • The primary market allows companies to issue new stocks or bonds to raise fresh capital (fundraising).
  • The secondary market (the stock exchanges like NYSE or Euronext) allows these securities to be traded among investors.

These two markets are intrinsically linked: the valuation on the secondary market (the price investors are willing to pay) determines the ease and cost for a company to raise funds in the primary market.

The NYSE trading floor
Source: NBC News

In theory, market prices should reflect all available information about an asset’s value. However, in practice, markets are influenced by emotion, speculation, and herd behavior, leading to what economist Robert Shiller termed “irrational exuberance.”

When investors focus only on short-term price movements, markets lose their function as efficient resource allocators. Instead of financing innovation and productive activity, they become driven by speculation and volatility.

Fisher’s quote is therefore a reminder that the health of financial markets depends on the ability of participants to look beyond immediate prices and evaluate the long-term value of what they are trading.

2 – Intrinsic Value vs. Market Price

The distinction between intrinsic value and market price lies at the heart of investing. The market price represents what buyers and sellers agree upon at a given moment. It fluctuates constantly, influenced by supply, demand, and investor psychology. Intrinsic value, on the other hand, is the true economic worth of an asset, based on fundamentals such as earnings potential, discounted cash flows, and long-term growth prospects.

Fisher, like Graham, believed that markets often misprice securities in the short term. The wise investor’s role is therefore to identify when the market price diverges from intrinsic value, and to act accordingly. This requires patience, analysis, and a willingness to go against the crowd.

This idea resonates particularly in the context of private companies and Private Equity. When a private equity firm buys a public company to take it private, it is often because it perceives a significant intrinsic value that the public market, obsessed with prices and quarterly results, has ignored or underestimated. By delisting it from the Stock Exchange, the firm can focus on long-term value creation, away from the pressures of public trading. The transaction itself is a materialization of the conviction that the market has confused price with value.

3 – Fundamental Analysis versus Technical Analysis

Fundamental analysis is the process of determining a company’s intrinsic value by studying its financial statements, business model, and broader environment. It involves assessing profitability, growth potential, competitive positioning, and management quality. Fisher elevated this approach by emphasizing qualitative aspects: how innovative a company is, how it treats employees, and what it is currently planning for the future.

In contrast, technical analysis focuses exclusively on studying past price movements and trading volumes to anticipate future market trends. It relies on charts, indicators (like moving averages or the RSI), and patterns to identify entry and exit points. The technical analyst knows the price perfectly, but the foundation of their strategy is that history (the price) repeats itself, without requiring an understanding of the fundamental “why” of the business.

Example of a technical analysis on the IBM stock
Example of a technical analysis

Fundamental analysis delves into balance sheets and income statements to construct a valuation (the value), while technical analysis interprets graphical signals and market statistics to determine the probable direction of the price. Fisher’s quote is a direct critique of this latter approach, as it completely dissociates price from its underlying economic reality.

4 – Active versus Passive Asset Management

Fisher’s opposition between price and value also resonates in a frequent debate in the asset management industry : active versus passive investing.

– Active management is based on the conviction that superior analysis can “beat the market” by precisely identifying undervalued (more value than price) or overvalued assets. Active managers, like Fisher, are the direct inheritors of the quest for intrinsic value.

– Passive management (index funds, ETFs) adopts a radically different approach. Instead of seeking value, it accepts the market price and aims to replicate an index’s performance. It is based on the Efficient Market Hypothesis, where prices are generally “fair.”

In a way, the passive investor only cares about the average price, and never looks at the underlying value of what he is buying. On the other hand, for an active investor, price is only a starting point of a reflection that must somehow lead to a good understanding of value.

My Opinion on this Quote

This quote immediately brings to mind the 2008 financial crisis. At the time, banks and investors were trading increasingly complex financial products (such as mortgage-backed securities and other structured instruments) whose complexity made it hard, if not impossible, to understand what they were actually made of. Everybody knew their price, but few questioned their real value. The result was a global collapse, driven by overconfidence and a lack of due diligence by many.

Finance should serve as a tool to support economic growth, and channel capital towards the most productive projects. But instead, it is too often turned into a casino, where speculation replaces understanding and greed overrides prudence. Fisher’s quote reminds us that financial markets should serve society, not the other way around.

Why Should You Be Interested in this Post?

Because Fisher’s insight remains as relevant today as it was decades ago. Whether you are investing, studying finance, or simply following the markets, remember that prices only tell part of the story. Always take the time to understand what lies beneath them: the business, the people, the ideas.

Knowing the price is easy. Understanding the value is not.

Related posts on the SimTrade blog

   ▶ All posts about Quotes

   ▶ Learn about the Tracking Error and its application to ETFs

   ▶ “Price is what you pay, value is what you get”. Warren Buffet

Useful Resources

Fisher, P. (1958). Common Stocks and Uncommon Profits. New York, NY: Harper & Brothers.

Graham, B. (1949). The Intelligent Investor. New York, NY: Harper & Brothers.

Buffett, W. E. (1977–present). Annual Letters to Shareholders of Berkshire Hathaway Inc. Omaha, NE: Berkshire Hathaway Inc.

About the Author

This article was written in January 2026 by Hadrien PUCHE (ESSEC Business School, Grande École Program, Master in Management, 2023-2027).

   ▶ Discover all articles by Hadrien PUCHE

“The four most dangerous words in investing are, it’s different this time.” – John Templeton

Financial markets are filled with stories of bubbles, crashes, and periods of extreme optimism or pessimism. Yet human nature remains surprisingly constant, as we are prone to believe that “this time is different.” Sir John Templeton’s famous quote reminds investors that historical patterns, lessons, and cautionary tales are often ignored in the face of conviction, novelty, or excitement.

In this article, Hadrien Puche (ESSEC, Grande École, Master in Management, 2023 / 2027) comments on this quote, exploring why believing that history will not repeat itself can be one of the most dangerous biases in investing.

Hadrien Puche

About Sir John Templeton

Sir John Templeton
Sir John Templeton
Source: John Templeton Foundation

Sir John Templeton was a legendary investor and philanthropist, renowned for his disciplined approach to value investing, a strategy that involves seeking out companies, markets or assets that are deeply undervalued compared to their true long term potential. Rather than following the crowds, value investors analyze the fundamentals of companies (earnings, balance sheets, management…) to make investment decisions.

Born in 1912 in the United States, he built a global investment career by seeking opportunities where others saw only risk. In 1939, at the outbreak of WW2, he borrowed money to buy shares when the market was at its lowest, including shares in 34 bankrupted companies, only 4 of which turned out to be worthless. In 1954, he founded the Templeton Growth Fund, a diversified mutual fund that sought bargains in depressed markets around the world.

Although the exact origin of this quote is unclear, it reflects Templeton’s belief that market cycles tend to repeat themselves. Investors often dismiss historical lessons when conditions seem unprecedented. In periods of optimism, they believe innovation or policy changes make downturns impossible. But Templeton argued this mindset is even more dangerous during crises: each time recession, war or financial turmoil hits, people insist the situation is entirely different from past downturns and ignore proven patterns of recovery. This leads to panic selling and missed opportunities at the moment of greatest long term value. Markets may change, but human psychology and systemic risks tend to repeat in predictable ways.

Analysis of the quote

At the heart of Templeton’s statement lies a timeless observation about human behavior. Investors frequently convince themselves that new technologies, policies, or financial instruments render past risks irrelevant. They see bubbles in real time but rationalize them as unique and unrepeatable events.

This attitude is perilous. By assuming “it is different this time,” investors often take excessive risk, neglect proper analysis, and overvalue assets. History shows that the same patterns, including leverage, speculation, overconfidence, and panic, tend to recur regardless of the era or instrument. The global financial crisis of 2008, the dot com bubble of 2000, and the 1929 crash illustrate the consequences of ignoring these lessons.

Templeton’s advice is simple yet profound. Treat each investment with humility, respect historical precedents, and avoid the hubris of believing novelty exempts you from risk. Recognizing that “this time” may not be different is not a rejection of innovation or change. It is an acknowledgment of patterns, limits, and the laws of risk.

Economic and financial concepts related to the quote

Market cyclicity

Financial markets naturally tend to move in cycles. Bull markets are followed by corrections; recessions are followed by recoveries. This inherent cyclicity explains why Templeton’s warning is so critical: periods of euphoria are often followed by downturns regardless of how unique the circumstances appear.

This cyclical pattern is most vividly illustrated by the formation of financial bubbles; situations where asset prices rise far above their intrinsic value due to speculation and excessive optimism. Investors frequently underestimate these cycles when past trends have been unusually profitable. For example, during the dot com boom, many believed that technology’s growth would render traditional valuation metrics irrelevant. The result was a speculative bubble followed by a sharp market correction.

As documented by economist Charles P. Kindleberger in his classic work, Manias, Panics, and Crashes: A History of Financial Crises, these bubbles follow a predictable, recurring pattern.

Stages of a market bubble

He argued that financial crises typically progress through phases of displacement, boom, euphoria, and eventually distress and panic. By ignoring history and assuming that novelty exempts them from these fundamental laws, investors risk participating in the formation and painful bursting of the bubble.

Understanding market cyclicity encourages investors to remain vigilant, diversify their holdings, and respect the natural flow of markets even when conditions seem unprecedented.

The Tranquility Paradox and Minsky’s Hypothesis

The tranquility paradox describes a simple but dangerous human habit: when the economy feels stable for long enough, we start believing that this stability will last forever. Rising markets, low volatility, and strong indicators give investors a sense of comfort. They begin to assume that risk has disappeared, that the system is safer than ever, and that the future will look just like the present.

This mindset is exactly what Templeton warned against, and it sits at the center of economist Hyman P. Minsky’s Financial Instability Hypothesis. Minsky’s core idea is counterintuitive: periods of stability create the conditions for instability. In other words, stability is not the end of risk, it’s the beginning of the next one.

The graph below illustrates this dynamic. When things look calm for long enough, investors slowly shift from safe financing to riskier forms, without even realizing it.

Graph of the Minsky moment

Minsky identified three stages:

  • Hedge financing, the safe zone: Cash flow covers both interest and principal.
  • Speculative financing, the risky zone: Cash flow covers interest only; principal is rolled over.
  • Ponzi financing, the danger zone: Cash flow covers neither interest nor principal. Survival depends on continuous borrowing or rising asset prices.

Over time, more and more activity moves into those speculative and Ponzi stages, pushing the system closer to what Minsky called a Minsky Moment, the sudden realization that debts can’t be serviced, asset values drop, confidence collapses, and panic selling begins.

This is the heart of the paradox: calm markets create overconfidence, overconfidence leads to excessive risk taking, and excessive risk taking triggers the crisis. Understanding this pattern helps investors maintain discipline, stay cautious during good times, and avoid falling for the seductive idea that “this time is different.”

Historical bias in personal finance

Templeton’s warning is not limited to market professionals; personal finance and long term investing are equally susceptible to the belief that history will not repeat itself. This risk is rooted in historical bias, a cognitive shortcut where many individuals assume that high past returns on stock indexes, real estate, or other assets will continue indefinitely, often ignoring the possibility of lower future growth or structural changes in the economy.

This bias, a form of extrapolation bias, can be highly dangerous in retirement planning, risk allocation, and portfolio construction. Relying solely on historical equity returns may lead to severe overestimation of future wealth and underestimation of risks during periods of low growth or inflation.

As articulated by economist Burton Malkiel in A Random Walk Down Wall Street, the historical record provides valuable context, but it must not be treated as a definitive forecast. Malkiel’s work supports the idea that, in an efficient market, all available information is already reflected in current prices, meaning past price movements hold no predictive power for the future.

Therefore, Templeton encourages reflection: a disciplined investor balances cautious optimism about the future with a realistic understanding of historical realities, recognizing that past performance of market indexes does not guarantee future results.

My opinion about this quote

Templeton’s insight is essential for both students and seasoned professionals. It serves as a reminder that neither euphoria nor fear should dictate investment decisions. Markets will always fluctuate, and history often rhymes if it does not repeat exactly.

However, it is also true that sometimes conditions are different, and excessive caution can prevent individuals from capitalizing on genuine opportunities. Innovation, technological change, and macroeconomic shifts can justify deviations from historical trends. The challenge lies in distinguishing between real novelty and wishful thinking.

In personal finance, this principle is particularly relevant. Many investors assume that past returns on broad indexes such as the S&P 500 are a reliable guide for the future. Structural changes, low interest rates, and demographic shifts may produce different outcomes.

Market performance of the SP500 over 30 years and different crises

Although global stock markets have historically recovered after crises, this cannot be taken as definitive evidence that they will always do so in the future.

Balancing historical awareness with flexibility and critical thinking is the essence of sound investing.

Why should you be interested in this post?

Templeton’s warning is not only a lesson in investing. It is a lesson of humility, discipline, and critical thinking. Believing “this time is different” can blind both students and professionals to risks, patterns, and opportunities. Studying history, understanding cycles, and acknowledging psychological biases improves decision making in finance and beyond.

Whether you are building a portfolio, analyzing market trends, or planning for the future, this insight encourages you to respect the lessons of the past while remaining vigilant and adaptable.

Related posts

Useful resources

Investment Wisdom & Discipline

These resources provide practical advice on long term, non emotional investing and avoiding market fads.

  • Templeton, John. The Templeton Plan.
  • Malkiel, Burton G. A Random Walk Down Wall Street.

History of Financial Crises

These essential books and papers explain why markets crash and the patterns those crises follow.

  • Kindleberger, Charles P. (1978). Manias, Panics, and Crashes: A History of Financial Crises.
  • Minsky, Hyman P. (1992). The Financial Instability Hypothesis, Working Paper No. 74, Jerome Levy Economics Institute.

Market Psychology & Valuation

These sources examine the role of human behavior, psychology, and valuation issues in speculative bubbles.

  • Shiller, Robert. Irrational Exuberance.
  • Blanchard, Olivier J., and Mark W. Watson. (1982). “Bubbles, Rational Expectations and Financial Markets.”
  • Tirole, Jean. (1982). On the Possibility of Speculation under Rational Expectations, Econometrica, 50(5) 1163–1181.

About the Author

This article was written in December 2025 by Hadrien PUCHE (ESSEC Business School, Grande École Program, Master in Management, 2023-2027).

   ▶ Discover all articles by Hadrien PUCHE

“It’s not whether you’re right or wrong that’s important, but how much money you make when you’re right and how much you lose when you’re wrong.” – George Soros

Hadrien Puche

In financial markets, everyone wants to be right. The temptation to make accurate predictions, about earnings, interest rates, recessions, or stock prices, is universal. But as George Soros reminds us, accuracy alone is meaningless. What truly matters is how much you profit when you’re right, and how much you lose when you’re wrong.

This quote challenges one of the deepest misconceptions in trading: the belief that success depends on predicting the future. In reality, trading success mostly depends on risk management, position sizing, and the discipline to adjust when the market proves you wrong.

About George Soros

George Soros
Warren Buffett
Source: EU

George Soros (born in 1930) is a Hungarian-American investor and philanthropist. He founded Soros Fund Management, a global macro hedge fund known for making large, directional bets across currencies, bonds, equities, and commodities.

Soros became globally famous in 1992 when he “broke the Bank of England” by shorting the British pound, a trade widely reported to have earned over $1 billion.

The European Exchange Rate Mechanism (ERM) was created to stabilize European currencies ahead of the future monetary union by keeping exchange rates within narrow fluctuation bands. When the UK joined, it agreed to maintain the pound within this band, but entered at a rate that many considered overvalued.

Seeing this imbalance, George Soros spent months building a large short position against the pound. On “Black Wednesday” in 1992, the British government failed to defend the currency through interest-rate hikes and interventions, forcing a devaluation. Soros reportedly earned over $1 billion and became known as “the man who broke the Bank of England.”

Not all of Soros’s trades were successful. In 2016, he reportedly lost close to $1 billion after wrongly predicting that markets would fall following Donald Trump’s election.

Beyond trading, Soros developed the theory of reflexivity, which argues that markets are shaped by feedback loops between perceptions and fundamentals. His philosophy emphasizes uncertainty, adaptability, and the psychological drivers behind market behavior.

The context behind this Quote

This quote is not actually from Soros. It comes from Stanley Druckenmiller—Soros’s former chief strategist—in The New Market Wizards (1994). Druckenmiller explains that the most important lesson he learned from Soros was not the importance of being right, but of structuring trades so that being right pays off and being wrong costs little.

Book cover of the new market wizards

The quote therefore reflects Soros’s investment philosophy: markets cannot be predicted with certainty, so success depends more on managing risk than on forecasting.

This mindset is foundational to modern risk management and a key reason Soros is considered one of the most influential investors of the past century.

Analysis of the Quote

The quote captures three essential ideas:

  • asymmetric returns
  • risk management
  • intelligent position sizing

Being right doesn’t matter unless it pays. For example, even if you forecast Nvidia’s earnings perfectly, you may still fail to profit because:

  1. You may not have any position.
  2. Your position may be too small.
  3. The market may behave irrationally.
  4. Losses on other trades may outweigh this one win.

This is the essence of risk management: structuring positions so that winners meaningfully contribute to performance while losers remain contained.

Let’s introduce three key financial ideas that relate to this quote.

1. Diversification and Position Timing

Even if your analysis is correct, the market might not react as expected, or not at the right time. This is where the distinction between trading and investing matters.

Soros’s quote speaks the language of trading: position sizing, timing, and controlling downside on each bet.

Investing, by contrast, relies less on precise timing and more on diversification, which reduces exposure to unpredictable events and smooths returns across different regimes.

Mathematically, diversification lowers portfolio variance because asset returns are imperfectly correlated. Even when individual positions behave unpredictably, a well-constructed portfolio can achieve far better risk-adjusted results than any single trade. In that sense, diversification plays a similar role for investors as stop-losses and disciplined position sizing do for traders: it manages the impact of being wrong.

The following graph illustrates how adding more independent positions reduces overall portfolio risk.

A graph representing the overall risk of a portfolio as a function of the number of positions

2. Avoid cutting winners to reinforce losers

This behavioral trap affects most investors. Soros’s approach is the opposite:

  • cut losing positions quickly
  • let winners run

Yet, due to loss aversion (as formalized by Kahneman & Tversky (1979) in Prospect Theory), investors often do the reverse:

  • sell winners too early
  • hold losers too long

This pattern is well-documented in the literature. Shefrin & Statman (1985) termed it the disposition effect: the systematic tendency to “sell winners too early and ride losers too long.” The emotional discomfort of realizing a loss often outweighs the rational need to exit a bad position.

Momentum works partly for this reason. Rising prices attract reluctant investors who delayed selling their winners, amplifying trends; meanwhile, stubbornly held losers can drift downward for longer than fundamentals alone would justify.

3. Quantitative trading: the power of averaging out

Quantitative trading is built on making many small, systematic bets with a positive expected value. The goal is not to win every trade, but to win more (or bigger) on average.

This is the practical application of the idea that:

  • being right occasionally with large wins
    is more valuable than
  • being right frequently with small gains.

This also echoes Jesse Livermore’s famous line: “The market is never wrong, only opinions are.” (link)

My view on this quote

One limitation of Soros’s statement is that it implicitly assumes the reader is an active trader. In reality, today’s markets are dominated by algorithms, quantitative models, and high-frequency strategies, an environment in which most individuals are unlikely to outperform professional traders. For traders, Soros’s point is straightforward: you will often be wrong, so what matters is how you size positions and manage risk when you are.

At a literal level, the quote may also seem paradoxical: you cannot know in advance which trades will be winners or losers. But the message isn’t about prediction, it’s about discipline.

This distinction becomes especially clear when you contrast trading with investing.

  • Traders live in a world of short-term uncertainty and constant position adjustments, where the asymmetry between gains and losses determines survival.
  • Investors, on the other hand, think in years, not minutes. They rely less on timing and more on letting fundamentals and compounding work over time. For them, the “how much you lose when you’re wrong” part translates into diversification, staying invested, and avoiding irreversible mistakes rather than optimizing each individual decision.

Seen this way, Soros’s line applies to both groups, just at different scales: traders manage outcomes trade by trade; investors manage them across decades. Either way, the principle holds: success depends less on being right and more on controlling the cost of being wrong.

Why should you care about this quote ?

The lesson is not about predicting markets or mastering sophisticated position sizing. The deeper message is:

  • Don’t rely on being right.
  • Structure your trades so that mistakes are limited and successes compound.

A diversified ETF strategy naturally achieves this.
In cap-weighted indices:

  • winners grow in weight
  • losers shrink, limiting their impact
  • the portfolio trends with long-term market growth

This simple, robust approach aligns with Soros’s philosophy: control the downside, let the upside work.

Related Posts

Useful Resources

  • Soros, George (1987). The Alchemy of Finance. Soros explains reflexivity, asymmetry of payoff, and his macro-trading framework.
  • Schwager, Jack (1994). The New Market Wizards. Contains Stanley Druckenmiller’s interview where the famous quote originates.
  • The Disposition to Sell Winners Too Early and Ride Losers Too Long: Theory and Evidence — Hersh Shefrin & Meir Statman (Journal of Finance, 1985, 40(3), 777–790).
  • Kahneman, D., & Tversky, A. (1979). Prospect Theory: An Analysis of Decision under Risk. Econometrica, 47(2), 263–291.

To learn more about Soros’s famous 1992 British pound trade:

  • Eichengreen, Barry & Wyplosz, Charles (1993). “The Unstable EMS.” A leading academic analysis of why the European Exchange Rate Mechanism (ERM) became vulnerable and how the 1992 crisis unfolded.
  • Bank of England (1993). Report on the Withdrawal of Sterling from the ERM. Official institutional account of the events surrounding Black Wednesday.

About the Author

This article was written in 2025 by Hadrien Puche (ESSEC, Grande École Program, Master in Management – 2023–2027).

“In investing, what is comfortable is rarely profitable.” – Robert Arnott

Hadrien PUCHE

In this article, Hadrien PUCHE (ESSEC Business School, Grande École Program, Master in Management, 2023-2027) comments on Robert Arnott’s famous quote, exploring how it relates to risk-taking, behavioral biases, and the mindset required to achieve consistent, long-term performance.

About Robert Arnott

Robert Arnott
 Robert Arnott
Source: Research Affiliates

Robert D. Arnott (born 1954) is an American investor, researcher, and entrepreneur. He is the founder and chairman of Research Affiliates, a firm known for its pioneering work on smart beta and alternative indexing strategies. Arnott has written extensively on asset allocation, portfolio construction, and factor investing, often challenging traditional assumptions about market efficiency.

Throughout his career, Arnott has emphasized that the best investment opportunities emerge when investors are willing to leave their comfort zone, particularly when markets are volatile, sentiment is negative, and uncertainty dominates.

Analysis of the quote

When Arnott says, “In investing, what is comfortable is rarely profitable,” he highlights a fundamental paradox of financial markets: comfort and profit rarely coexist.

Comfort comes from stability, familiarity, and consensus. Yet, markets reward those who act rationally in uncomfortable moments; those who buy when others sell and remain calm when others panic. Profitable investing often requires doing what feels counterintuitive.

However, this quote does not promote reckless risk-taking. Instead, it reminds us that genuine investment opportunities often arise in periods of uncertainty and fear, when prices deviate from intrinsic value. Success lies in maintaining discipline and conviction when others lose theirs.

Moreover, this insight resonates with Frank Knight’s distinction between risk and uncertainty. While risk can be measured and priced, true uncertainty is unknowable and unpredictable. Investing in moments of discomfort often means confronting this unmeasurable uncertainty, and taking opportunities when most investors hesitate.

Case study: March 2020 – Investing during the Covid crisis

Between February and March 2020, the S&P 500 index fell by more than 30% as investors panicked and rushed to sell their holdings. However, those who bought stocks during the downturn (or even simply stayed invested) saw the market recover to new highs within just a few months. The real losses came not from the crash itself, but from panic selling at the worst possible moment.

To better understand why the market reaction was so violent during this period, it is useful to look at the VIX index, often referred to as the “fear gauge” of financial markets. The VIX measures expected volatility based on S&P 500 option pricing, and it tends to spike when uncertainty and investor anxiety rise.

In the graph below, which compares the performance of the S&P 500 and the VIX over the 2020 Covid market crash, we can clearly see how moments of market stress correspond to sharp increases in the VIX.

S&P500 and VIX index in 2020

The S&P 500 declines at the same time the VIX surges, illustrating the sharp rise in market fear and uncertainty.
Source: TradingView

Economic / Financial concepts related to the quote

I present below three financial concepts: the risk–return tradeoff, the psychology behind discomfort, and contrarian investing and market cycles.

1 – The risk–return tradeoff

Arnott’s quote connects directly to the risk–return tradeoff, a cornerstone of modern portfolio theory (Harry Markowitz, 1952). The principle is simple but powerful: higher expected returns are only possible when investors accept higher levels of risk.

In quantitative terms, risk is often measured by metrics such as volatility (the standard deviation of returns) or the Value at Risk (the expected maximum loss that could occur on a given period). Assets with higher volatility tend to offer higher average returns to compensate investors for the uncertainty they bear.

This relationship is evident across asset classes: equities have historically outperformed bonds, and small-cap or emerging market stocks have outperformed large, stable firms, precisely because they are riskier and therefore less “comfortable” to hold.

Money MarketsBonds (20Y TB)Equities (S&P 500)
Historical returns3.3%5.7%10.3%
Historical volatility0.1 to 1%10%15 to 20%
These are the average historical returns and volatility of the main asset classes over the past century.
Source: “Long-Term Performance”, Martin Capital, and CFA Institute.

Those who prioritize comfort, by investing in stable, low-volatility assets such as government bonds or blue-chip stocks, may achieve safety but at the cost of limited upside. In contrast, investors willing to face volatility intelligently, through diversification, disciplined portfolio construction, and long-term perspective, can capture higher returns over time.

Ultimately, discomfort is not a flaw of investing, but rather the price of better returns. As every investor learns sooner or later, there is no reward without risk, and no performance without volatility.

This relationship between risk and return is often illustrated by the efficient frontier: as investors take on more risk (measured by the volatility of returns), the expected long-term return increases. The graph below shows this fundamental tradeoff, highlighting how low-risk assets typically offer modest returns, while higher-risk assets provide the potential for superior performance.

Graph of performance against risk

2 – The psychology behind discomfort

Arnott’s insight aligns closely with behavioral finance, particularly Daniel Kahneman and Amos Tversky’s concept of loss aversion. The idea is that the pain of losing is psychologically about twice as powerful as the pleasure of gaining.

The chart below illustrates this asymmetry: while gains produce only a moderate rise in satisfaction, losses trigger a disproportionately strong emotional reaction, shaping many irrational investment decisions.

Losses hurt people more than gains make them feel good

This bias makes investors instinctively avoid risk, even when it offers potential rewards.

In financial markets, this aversion to loss often translates into herd behavior: investors seek comfort in doing what others do, buying overvalued assets during booms and selling undervalued ones during downturns. While this may feel safe in the short term, it systematically destroys value over time.

Legendary investors such as Warren Buffett and Howard Marks have long warned against this mindset: “Be fearful when others are greedy, and greedy when others are fearful.” True comfort in markets is often a sign of danger, not safety.

A good example is the dot-com bubble of 2000. At the time, investing in fast-growing tech stocks felt like the comfortable and obvious choice, as prices seemed to rise endlessly. Yet when the bubble burst, it became clear that this comfort had been an illusion, and that discomfort, not consensus, is where opportunity truly lies.

3 – Contrarian investing and market cycles

Arnott’s quote also resonates with the philosophy of contrarian investing: the art of going against prevailing market sentiment. It means buying when fear dominates and selling when euphoria prevails.

As Minsky explains in his Financial Instability Hypothesis, periods of stability paradoxically encourage increasing risk-taking, as market participants move from hedge finance to speculative and then Ponzi finance. This endogenous dynamic inevitably leads to points of fragility where confidence collapses. Kindleberger, in Manias, Panics, and Crashes, provides empirical illustration: markets swing from euphoria to distress, from boom to bust, before stability gradually returns and the cycle begins anew.

The chart below visually maps this emotional cycle, highlighting how investor psychology typically evolves from euphoria to panic and back to optimism.

Market emotions cycles graph

The most profitable opportunities often emerge during moments of maximum discomfort: recessions, crises, or market panics, when prices are depressed but fundamentals remain sound. As Sir John Templeton famously said, “The time of maximum pessimism is the best time to buy.”

However, acting against the crowd is far from easy. It requires not only analytical conviction but also emotional discipline, the ability to stay rational when everyone else reacts emotionally. This mental resilience is what separates long-term investors from speculators driven by short-term noise.

My opinion about this quote

I find Arnott’s statement particularly relevant, at a time when social media and short-term performance metrics dominate investor psychology. Platforms such as X (Twitter), Reddit, or TikTok amplify herd behavior by rewarding consensual views rather than conviction. True investment success requires patience, analytical thinking, and the ability to tolerate discomfort.

To me, this quote extends beyond finance: it reflects a mindset of resilience and independence, valuable in career decisions, entrepreneurship, and life in general, because growth rarely happens in comfort zones.

Why should you be interested in this post?

This quote provides a timeless reminder for students and young professionals: comfort is the enemy of progress.

The rise of AI-driven trading, quantitative strategies, and passive investing has made markets appear more predictable and automated. This can create new forms of comfort, a belief that algorithms or index funds can replace human judgment. However, Arnott’s message reminds us that critical thinking, curiosity are still needed to outperform others.

As Arnott’s principle suggests, growth rarely happens in comfort zones. Whether in markets, careers, or personal development, long-term success comes from embracing uncertainty intelligently, and finding opportunity where others see discomfort.

Related posts on the SimTrade blog

   ▶ All posts about Quotes

   ▶ Youssef LOURAOUI Asset allocation techniques

   ▶ Youssef LOURAOUI Smart Beta strategies: between active and passive allocation

   ▶ Youssef LOURAOUI Markowitz Modern Portfolio Theory

Useful Resources

Business Books

  • Graham, B. (1949). The Intelligent Investor: A Book of Practical Counsel (Rev. ed.). Harper & Brothers.

Academic Articles

  • Arnott, R. D. (2003). The Fundamental Index: A Better Way to Invest. Financial Analysts Journal, 59.
  • Arnott, R. D. (2005). The Most Dangerous Equation. Financial Analysts Journal, 61.
  • Kahneman, D., & Tversky, A. (1979). Prospect Theory: An Analysis of Decision under Risk. Econometrica, 47(2), 263–291.
  • Markowitz, H. (1952). Portfolio Selection. The Journal of Finance, 7(1), 77–91.

Classic Economic & Finance Works

  • Kindleberger, C. P. (1978). Manias, Panics, and Crashes: A History of Financial Crises. New York: Basic Books.
  • Minsky, H. P. (1992). The Financial Instability Hypothesis. Working Paper No. 74, Jerome Levy Economics Institute.

About the Author

This article was written in November 2025 by Hadrien PUCHE (ESSEC Business School, Grande École Program, Master in Management, 2023-2027).

   ▶ Discover all articles by Hadrien PUCHE

“Most people overestimate what they can do in a year and underestimate what they can do in ten.” – Bill Gates

In a world that often focuses on immediate results and instant gratification, it can be easy to overlook how regular effort accumulates into long-term impact.

This quote by Bill Gates reminds us that human ambition and effort are most effectively realized over extended periods of time. Planning ahead, embracing patience, and committing to consistent action are the keys to achieving extraordinary outcomes.

Hadrien PUCHE

In this article, Hadrien PUCHE (ESSEC, Grande École, Master in Management, 2023-2027) reflects on this quote, exploring how it applies not only to personal growth but also to finance, and especially investing.

About Bill Gates

Bill Gates
Bill Gates
Source: Wikimedia Commons

Bill Gates is a co-founder of Microsoft and one of the most influential entrepreneurs of the late twentieth and early twenty-first century. Beyond his contributions to technology, he is widely recognized for his philanthropy through the Bill and Melinda Gates Foundation, which focuses on global health, education, and poverty reduction. Gates has often spoken about vision, long-term planning, and the accumulation of effort over time.

“Most people overestimate what they can do in a year and underestimate what they can do in ten.”
Bill Gates

The quote is widely attributed to Bill Gates, although its true authorship is uncertain. What matters, however, is that Gates has consistently demonstrated through his work in technology and philanthropy how sustained effort and strategic planning can produce results that far exceed initial expectations.

Analysis of the quote

The central insight of this quote is that time magnifies effort. People often approach challenges with a short-term mindset, setting goals that are ambitious for a short period but fail to consider the compounding effect of consistent action. This makes them unable to reach these goals, leading to potential failure, whereas small steps over ten years can accumulate to produce extraordinary results.

This bias toward short-term thinking is prevalent in many areas of life, from career planning to investing. Individuals overestimate what they can accomplish quickly, which can lead to frustration when immediate goals are not met. Simultaneously, they underestimate what can be achieved over a decade, missing opportunities for growth, learning, and accumulation of value.

In finance, this mindset manifests in impatience with investments or ventures that require time to mature. In personal development, it is reflected in the failure to adopt habits that pay dividends over the long term. Gates’ quote is a reminder that extraordinary achievements are rarely the product of sudden effort. They are the result of consistent, incremental progress compounded over years.

This idea of long-term, incremental effort resonates closely with Malcolm Gladwell’s The Tipping Point: How Little Things Can Make a Big Difference. Gladwell explains how small, consistent actions or seemingly minor events can accumulate over time until they trigger a dramatic, outsized effect: the “tipping point.”

Economic and financial concepts related to the quote

I present below three financial concepts: compound interest, investment horizons, Strategic planning and time diversification.

Compound interest

The concept of compound interest is perhaps the most direct financial parallel to Gates’ insight. In investing, the growth of wealth is not linear: returns earned on investments generate additional returns over time, producing an exponential effect. Individuals who understand and leverage compound interest can turn modest contributions into significant wealth over decades, whereas those who focus on immediate gains often miss the cumulative benefits. Gates’ quote captures this principle in human effort and strategic planning, emphasizing that patience and consistency are more powerful than short bursts of activity.

This is why Einstein famously called compound interest the “eighth wonder of the world”.

Simple vs Compound Interest
Source: the author.

To better understand compounding, download this excel file and try to play around with the interest rate.

You can download the Excel file provided below, which contains the calculations of EBITDA for Carrefour.

Download the Excel file.

Investment horizons

Successful investing often relies on a long-term perspective. Markets can be volatile in the short term, but sustained investment in fundamentally sound assets typically produces growth over extended periods. Investors who overreact to short-term fluctuations may underperform by frequently buying and selling, while those who commit to a long-term strategy benefit from the power of time. Gates’ insight mirrors this approach.

From a financial standpoint, this is also a question of μ vs σ: in the short run, market movements are dominated by σ (sigma; volatility), which makes returns unpredictable and often discouraging. But over longer horizons, μ (mu; the average expected return) becomes more visible, and the noise of volatility fades relative to the trend. In other words, the longer you stay invested, the more likely the underlying growth of the market (and not short-term fluctuations) will determine your outcome.

Simple vs Compound Interest
Source: internet.

As you can see on this graph, the S&P 500 index tends to perform well on the long run and always recover from times of crisis.

Just as how small investments compound over many years, consistent effort in personal or professional life produces results far greater than what is visible in a single year.

Strategic planning and time diversification

In economics and business, strategic planning means looking beyond immediate gains and considering how decisions will play out over multiple years or even decades. Investments in areas such as research and development, employee training, or infrastructure rarely pay off right away. Yet, as these efforts accumulate, they can create lasting competitive advantages, foster innovation, and drive long-term profitability.

A similar logic applies in finance through time diversification. Short-term market fluctuations can be unpredictable, but the longer an investor stays committed to a well-constructed portfolio, the greater the chance that temporary volatility smooths out and long-term growth prevails.

Gates’ quote captures the essence of both ideas: meaningful results (in business, investing, or personal development) come not from quick wins but from sustained effort and the willingness to think further ahead than the next quarter or the next year.

My opinion about this quote

This quote feels especially relevant today, as the pace of technological change accelerates with the rise of artificial intelligence and other innovations. Society is not accustomed to this level of speed, which can distort our perception of what is achievable. While there is a temptation to believe that technological advances will produce massive change within just a few years, Gates’ quote reminds us to temper optimism with realistic expectations. In reality, it often takes considerable time for firms to integrate new technologies and realize meaningful productivity gains, as seen with the adoption of the internet and, more recently, with AI.

This dynamic is clearly illustrated in the graph below, known as the Gartner Hype Cycle. This framework describes the typical pattern of expectations surrounding new technologies. When a breakthrough such as generative AI emerges, public enthusiasm and media attention often inflate expectations far beyond what is achievable in the short term. As a result, we tend to overestimate the immediate impact of the innovation.


However, as the technology progresses through the different phases of the cycle (from initial excitement to disillusionment, and eventually to maturity), its long-term transformative potential becomes clearer. The Gartner Hype Cycle helps explain why we so often underestimate what a technology can achieve over a decade, even while exaggerating what it can achieve in its first year.

 Gartner Hype Cycle
Source: Gartner.

The Gartner Hype Cycle, illustrates the typical progression of expectations around new technologies.

At the same time, the quote encourages reflection on long-term potential. Even if technologies develop more slowly than expected, incremental improvements over a decade can still lead to transformative outcomes. The lesson is to maintain both patience and vigilance, avoiding the extremes of overconfidence or neglect.

This principle also applies to personal finance and life planning. Many people set short-term goals and become frustrated when progress seems slow. Yet, the cumulative effect of consistent action, thoughtful saving, learning, or skill development often surpasses what we anticipate in the first year. By recognizing the value of long-term effort, individuals can better allocate resources, set meaningful goals, and make decisions that pay off over time.

In professional contexts, such as career progression or entrepreneurship, the quote is equally valuable. Building a company, developing expertise, or pursuing innovation rarely produces instant results. Sustained effort, compounded knowledge, and consistent decision-making are what lead to exceptional achievements over the long term.

Why should you be interested in this post?

Bill Gates’ quote is a reminder to plan thoughtfully, embrace patience, and recognize the exponential power of effort. While no one can predict the future with certainty, adopting a long-term perspective allows individuals to maximize the impact of their actions and investments.

This insight is particularly relevant for students and young professionals. You do not need a detailed plan for the next ten years, but considering the direction of your efforts and making incremental progress can dramatically improve outcomes over time. Recognizing the gap between short-term overestimation and long-term underestimation fosters discipline, focus, and resilience in both personal and financial decisions.

Whether applied to investing, professional development, or personal goals, this quote encourages a mindset that values consistency, foresight, and the compounding power of effort. Understanding this principle allows individuals to avoid the pitfalls of impatience while harnessing the opportunities presented by sustained dedication.

Related posts on the SimTrade blog

   ▶ All posts about Quotes

Useful resources

Gates, B. (2021) How to Avoid a Climate Disaster: The Solutions We Have and the Breakthroughs We Need, Penguin Random House.

Graham, B. (1949) The Intelligent Investor: A Book of Practical Counsel, New York: Harper & Brothers.

Malkiel, B. G. (2019) A Random Walk Down Wall Street: The Time-Tested Strategy for Successful Investing, 12th Edition, New York : W. W. Norton & Company.

Gladwell M. (2000) The Tipping Point: How Little Things Can Make a Big Difference, Boston, MA: Little, Brown and Company.

About the Author

This article was written in November 2025 by Hadrien PUCHE (ESSEC Business School, Grande École Program, Master in Management, 2023-2027).

   ▶ Discover all articles by Hadrien PUCHE