In this article, Jules HERNANDEZ (ESSEC Business School, Global Bachelor in Business Administration (GBBA), 2021-2025) writes about structured products, the different types of products sold to institutional and retail investors. This article aims to introduce structured products, explore their various types, and explain how these instruments are engineered by structurers. This article will also study the so-called Greeks, which are used by traders after the issuance of these products.
What is a structured product ?
A structured product is a type of financial investment whose return is tied to the performance of one or more underlying assets and defined by pre-specified features and scenarios. It is not a simple buy-and-hold portfolio in equities and bonds, but rather a customized investment instrument created by combining multiple financial products to achieve a particular risk-return profile (we will explore in detail, in further sections, how these combinations are built). According to BNP Paribas Wealth Management, in an article written the 27/07/2021, structured products can be broadly defined as “a savings or investment product where the return is linked to an underlying asset with pre-defined features (maturity date, coupon dates, capital protection level …)”. These instruments belong to the category of non-traditional investment strategies and are typically constructed by packaging together a bond, one or more underlying assets, and financial instruments such as derivatives. “It can serve as a tool for portfolio diversification and an alternative to traditional investments”, according to an article written on the Société Générale France Website by Yaël Eljarrat-Ouakni, Head of Structured Products offerings at Societe Generale Private Banking France. What makes structured products distinctive is that their payoff is conditioned on market outcomes rather than simply the passage of time. The return an investor receives (whether it involves coupon payments, principal protection, or participation in underlying asset performance) is determined at the product’s launch and depends on how the reference markets evolve relative to the conditions set in the product’s terms. In essence, structured products are tailor-made solutions that allow investors to express specific market views or achieve particular investment goals while defining the precise risk and return mechanics in advance. However, because they combine multiple financial instruments and scenarios, these products are considered more sophisticated than traditional securities and require careful understanding before investment.
Main parameters of a structured product
A structured product is defined by a set of key parameters that determine its payoff structure and risk-return profile. Each product has different settings that are tailored to the risk-return ratio wanted by the investor. The main components are the following:
Underlying asset
Each structured product is linked to an underlying asset whose performance determines the product’s payoff. The underlying can be a single stock, an equity index, a basket of shares, an interest rate, a credit entity, a commodity, or a currency pair. All asset classes can be underlying assets of a structured product. Some structured products may also be linked to a combination of two or more underlying assets. For instance, a product can be indexed on a basket of equities, such as Apple, Microsoft, and Tesla. More complex structures may even combine different asset classes, for example providing exposure to both a single stock and an interest rate, such as Apple and the French 10-year government bond yield (OAT 10Y). The characteristics of the underlying, such as volatility or correlation (in the case of a basket of two or more assets), and overall market conditions, play a key role in determining the product’s pricing, risk profile, and potential return. The nature of the underlying is therefore a central element in understanding the behavior of a structured product.
Coupons
Similarly to a bond, a coupon is the pre-agreed (before the product is bought) potential income paid to the investor during the life of the structured product. They may be fixed or conditional, and in many structures, they are paid only if the underlying remains above a predefined barrier on specific observation dates. The level of coupons offered depends on several market factors, including volatility of the underlying, interest rates, maturity, dividends in case of a stock or index underlying, and the level of protection embedded in the structure. We will see later in further details how these factors impact the level of the coupon.
Maturity
Maturity is the predetermined date on which the structured product expires, and its final payoff is calculated. It may range from short-term (around one year) to long-term (up to ten years or more). Any capital protection mechanism typically applies only at maturity. Certain products also include early redemption features, such as autocall mechanisms, which allow the product to terminate before its scheduled maturity if specific market conditions are satisfied.
Capital protection level
The capital protection level defines the extent to which the initial investment is protected at maturity. Protection may be full, partial, or conditional upon the underlying not falling below a specified barrier. If the protection condition is breached, the investor may be exposed to partial or total loss of capital. This parameter is fundamental, as it largely determines the downside risk embedded in the product. We will explore later why this protection matters and how by reducing the capital protection, an investor can increase its coupon.
Observation frequency
Observation frequency refers to how often the product’s conditions are assessed. Observations may occur annually, semi-annually, quarterly, monthly, or even daily, depending on the structure. Coupon payments, barrier monitoring, and early redemption triggers are evaluated on these predefined dates. For instance, the frequency of observation affects the probability of coupons being paid and the likelihood of early redemption.
Issuer
A structured product is issued by a financial institution, typically a bank. The most known issuers on the market are JP Morgan, Goldman Sachs, BNP Paribas and Société Générale. In France, a study from SRP Investors are therefore exposed to issuer credit risk, meaning that the repayment of capital and any coupons depends on the issuer’s financial strength and ability to meet its obligations. In the event of issuer default, investors may incur losses regardless of the performance of the underlying asset. Assessing the creditworthiness of the issuer is therefore essential.
Liquidity conditions
Liquidity conditions refer to the ability to sell the structured product before maturity. Although many issuers usually provide secondary market pricing under normal market conditions, liquidity is not guaranteed. The product’s market value before maturity can fluctuate significantly due to changes in the underlying asset, volatility, interest rates, and credit spreads. As a result, exiting early may lead to gains or losses that differ substantially from the payoff expected at maturity.
The different families of products
Capital growth products
Capital growth products are structured products designed primarily to enhance the value of the initial investment at maturity rather than to generate regular income during the life of the product. Returns are typically paid at maturity and depend on the performance of the underlying asset according to predefined participation rates, leverage factors, or payoff formulas. These products may offer full or partial capital protection, or they may provide enhanced upside participation in exchange for limited or conditional downside protection. They are generally suitable for investors seeking medium- to long-term capital appreciation and who do not require periodic income. Most of these products bear the name of “Athena products” and usually have autocall features, which we’ll explain in further sections.
Yield products
Yield or income products are designed to generate regular conditional coupons during the life of the investment. These coupons are typically paid periodically (for instance, quarterly, or annually) if certain market conditions are met. The income offered is usually higher than traditional fixed-income instruments because investors accept conditional and additional downside risk. In many cases, capital is only protected if the underlying asset does not breach a predefined barrier at maturity. Common examples of yield products are Phoenix products or reverse convertibles, which we will explain in further sections.
Main Types of Structured Products
This section will now explore what are the different types of structured products issued by banks. Many standardized products exist, and we will explore the main ones.
Autocall
Autocallable notes (often simply called “Autocalls”) are structured products that offer conditional coupons and include an automatic early redemption feature. On predefined observation dates, if the underlying asset trades at or above a specified level (the autocall barrier), usually the strike of the underlying, the product is redeemed early, and the investor receives the nominal amount plus the accrued coupon. As a reminder, the strike price is the price at which the underlying asset trades when the structured product is issued. The strike price is often expressed as a percentage of the initial level, which is always 100, representing the initial level set at inception. If the underlying does not trade above the strike level at the observation date, e.g. 90, the product continues until the next observation date or until maturity. Autocalls are among the most widely distributed structures in Europe. According to the AMF report “Markets and Risk Outlook” of 2025, “The most common structure for structured products distributed in Europe, as in the rest of the world, is the autocall” and “In France, in 2024, autocalls accounted for almost two-thirds of the structured products distributed.”
Let’s illustrate this product with a concrete example. Consider a retail investor purchasing an autocall linked to LVMH stock. The product has a 5-year maturity, pays an annual coupon of 5%, and features an autocall barrier set at 100% of the strike price. Additionally, the investor opts for capital protection at 50%, which limits potential losses in adverse scenarios. The three scenarios below demonstrate the possible outcomes under different market conditions.
Bullish Scenario : Early redemption of the product
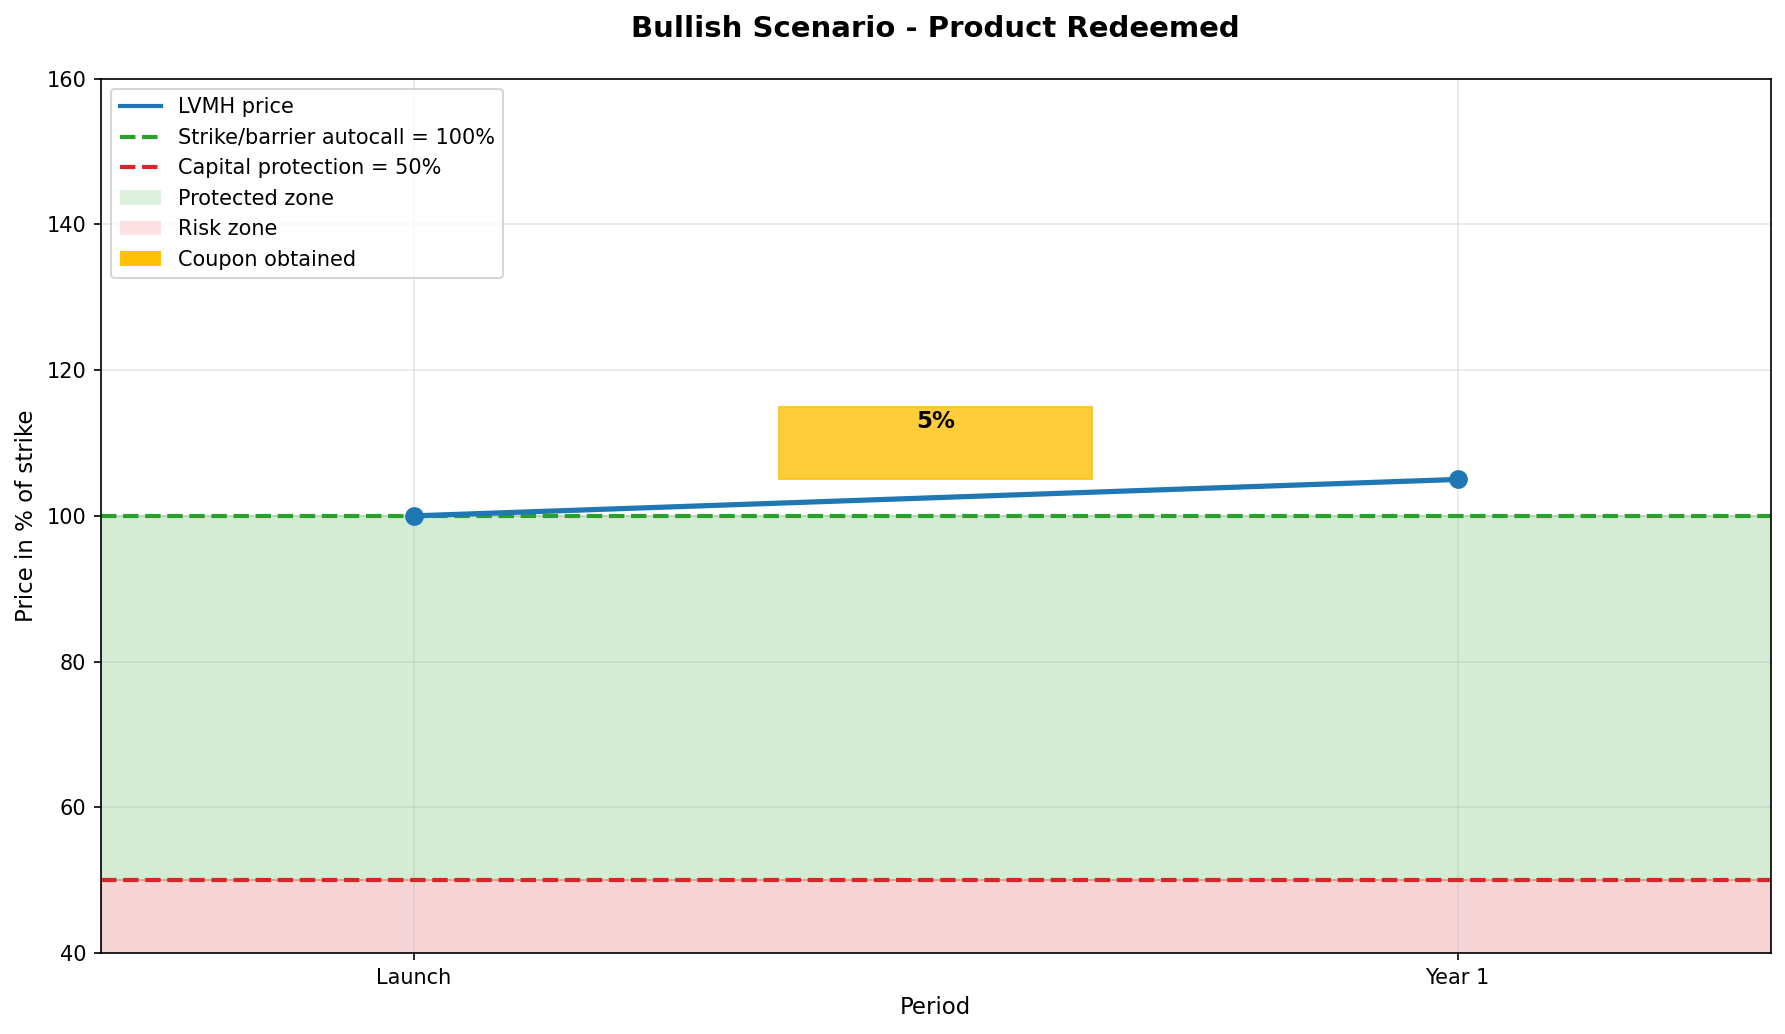
In this first scenario, thanks to favorable market conditions, the price of LVMH at the year 1 observation date is above its initial level. As a result, the product is redeemed early, and the investor receives both the coupon and the nominal.
Bearish Scenario
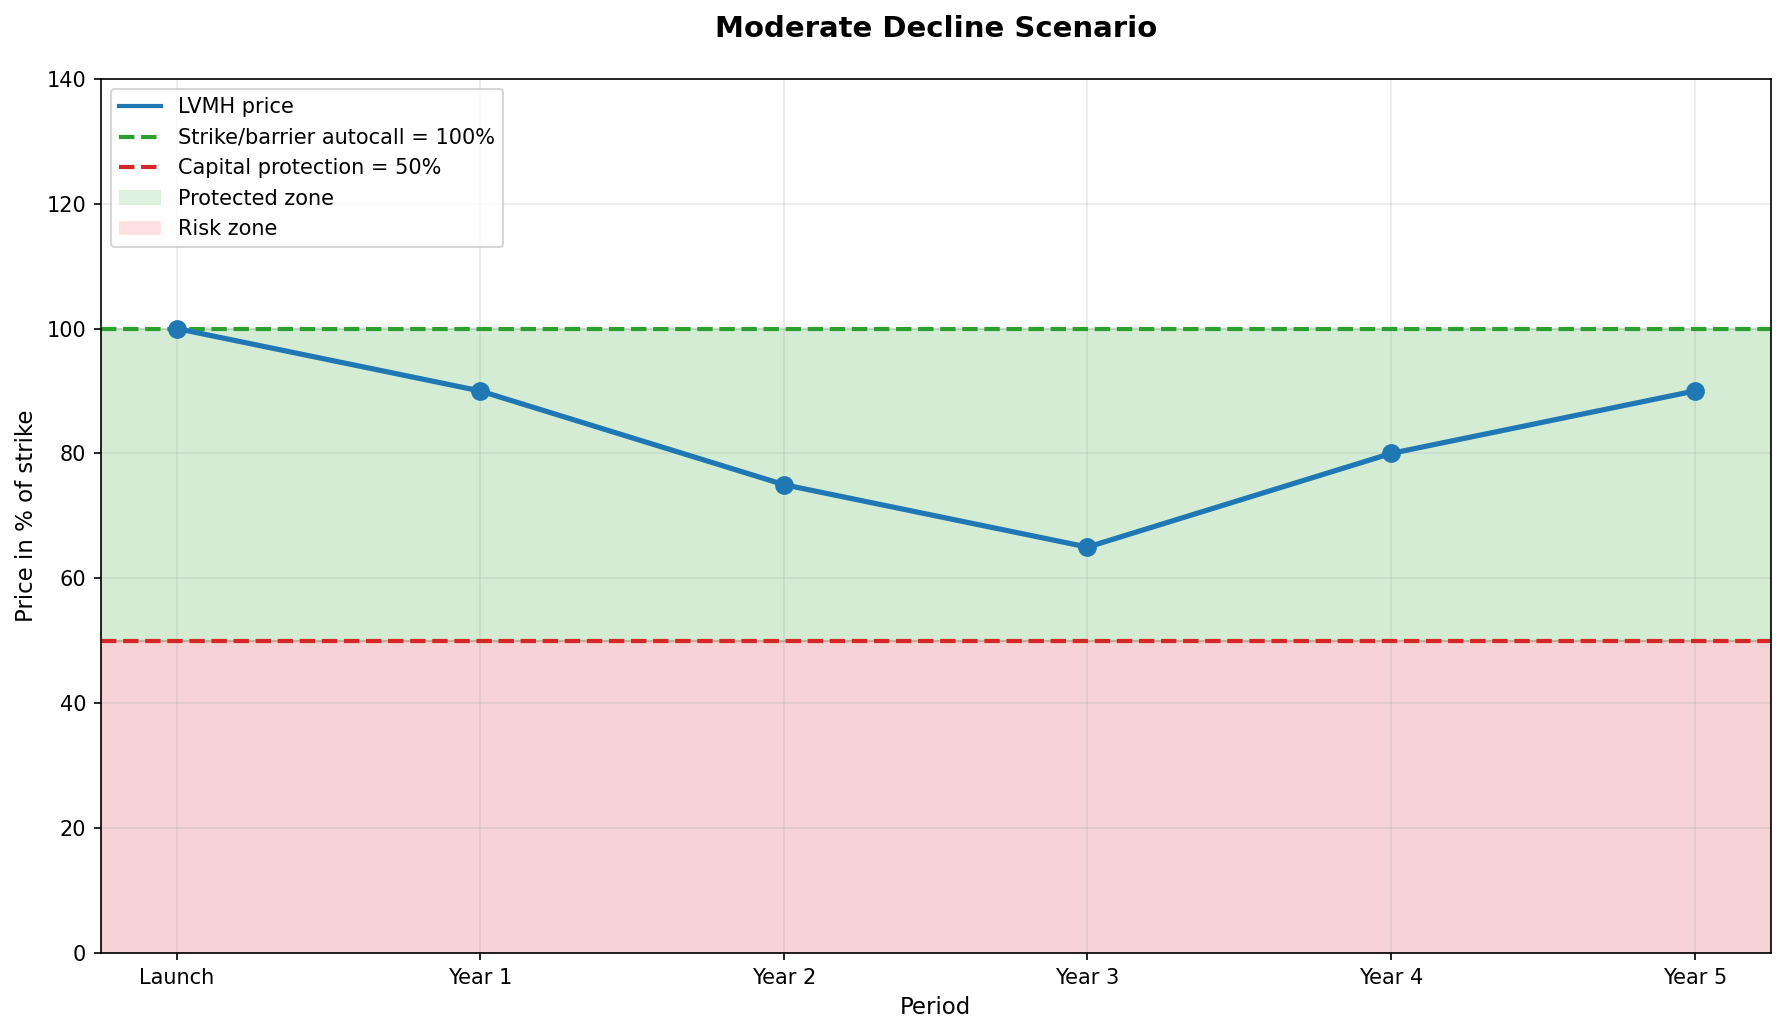
In this scenario, the market conditions didn’t allow an early redemption of the product, because the price of LVMH decreased. Since the product wasn’t redeemed, no coupon was paid. However, at maturity, since the price of LVMH is still within the “capital protected zone, the investor receives back the full nominal of his investment.
Market crash Scenario : The capital is at risk
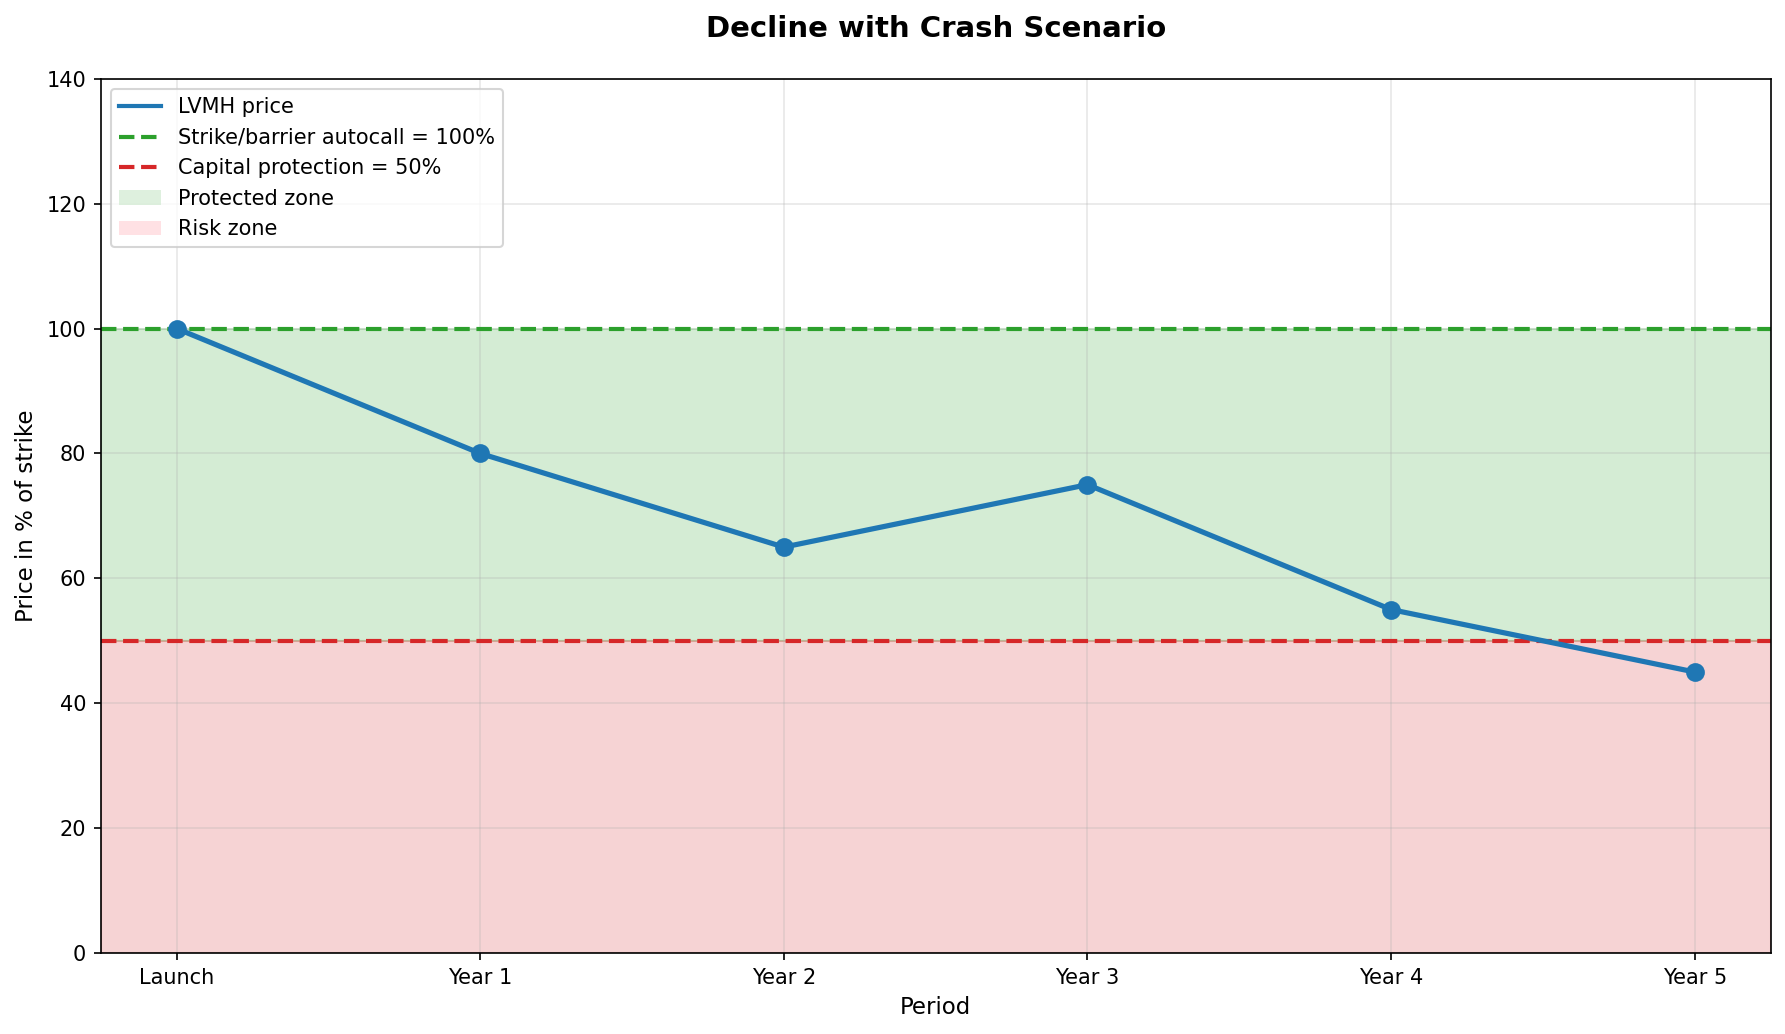
The worst scenario happened for the investor. The price of LVMH dived, and it reached a price below the 50% capital protection barrier. Therefore, the investor did not receive any coupon and the investor suffered a loss of capital. At maturity, in this example, the price of LVMH observed at maturity was 45%, therefore the investor only got 45% back of his initial investment.
Worst of products
“Worst of” structured products are linked to a basket of underlyings, and their performance is determined by the worst-performing asset in the basket. Imagine a worst of product with 3 underlying assets, Apple, Microsoft, Amazon. At observation date, we will take into consideration for the payment of the coupon (and the autocall feature if the product is a Autocall worst of) the least performative asset. For instance, if Apple is at 70% of the strike, Microsoft at 80% and Amazon at 65%, only Amazon’s performance will be taken into account. While this structure allows for higher coupon payments due to increased risk, it also significantly raises downside exposure because capital protection and coupon conditions depend on the weakest underlying. It is in the investor’s interest to select a basket of underlyings whose correlation is as close as possible to 1. Ideally, all the assets should move in the same direction. A correlation of -1 would be completely detrimental to the investor since if one stock performs well, the other stock has a high probability of opposite performance. Some banks also issue “Best of” products which are less risky, because the underlying taken into account is, here, the strongest asset, reducing therefore the risk probability.
Bearish products
Bearish products are designed for investors with a negative or moderately bearish market view. In simpler words, the investor is going against the market, betting the market will go down. In these structures, coupons or early redemption may be triggered if the underlying remains below or declines toward certain predefined levels. They allow investors to monetize a non-bullish market scenario while still embedding conditional risk protection mechanisms. These products are not common, but for certain investors those can be interesting for tactical diversification or hedging positions.
Phoenix products
Phoenix products are income-generating structured products that pay periodic conditional coupons, often featuring an autocall barrier. However, unlike standard autocalls, coupon payments do not necessarily require early redemption. Coupons may accumulate and be paid later if conditions are subsequently met. At maturity, all the coupons accumulated are paid and the capital is refunded if the underlying is not below the capital protection barrier. Phoenix structures are widely used in private banking for investors seeking regular yield.
To illustrate this kind of products, let’s imagine the following product : a Phoenix product index on the NVIDIA stock is bought by an investor with the following parameters: a 5-year maturity, a coupon of 5%, an autocall barrier set at 100% of the strike, a coupon barrier of 70%, and a capital protection barrier set at 50%. The three scenarios below demonstrate the possible outcomes under different market conditions.
Bullish Scenario : Early redemption of the product
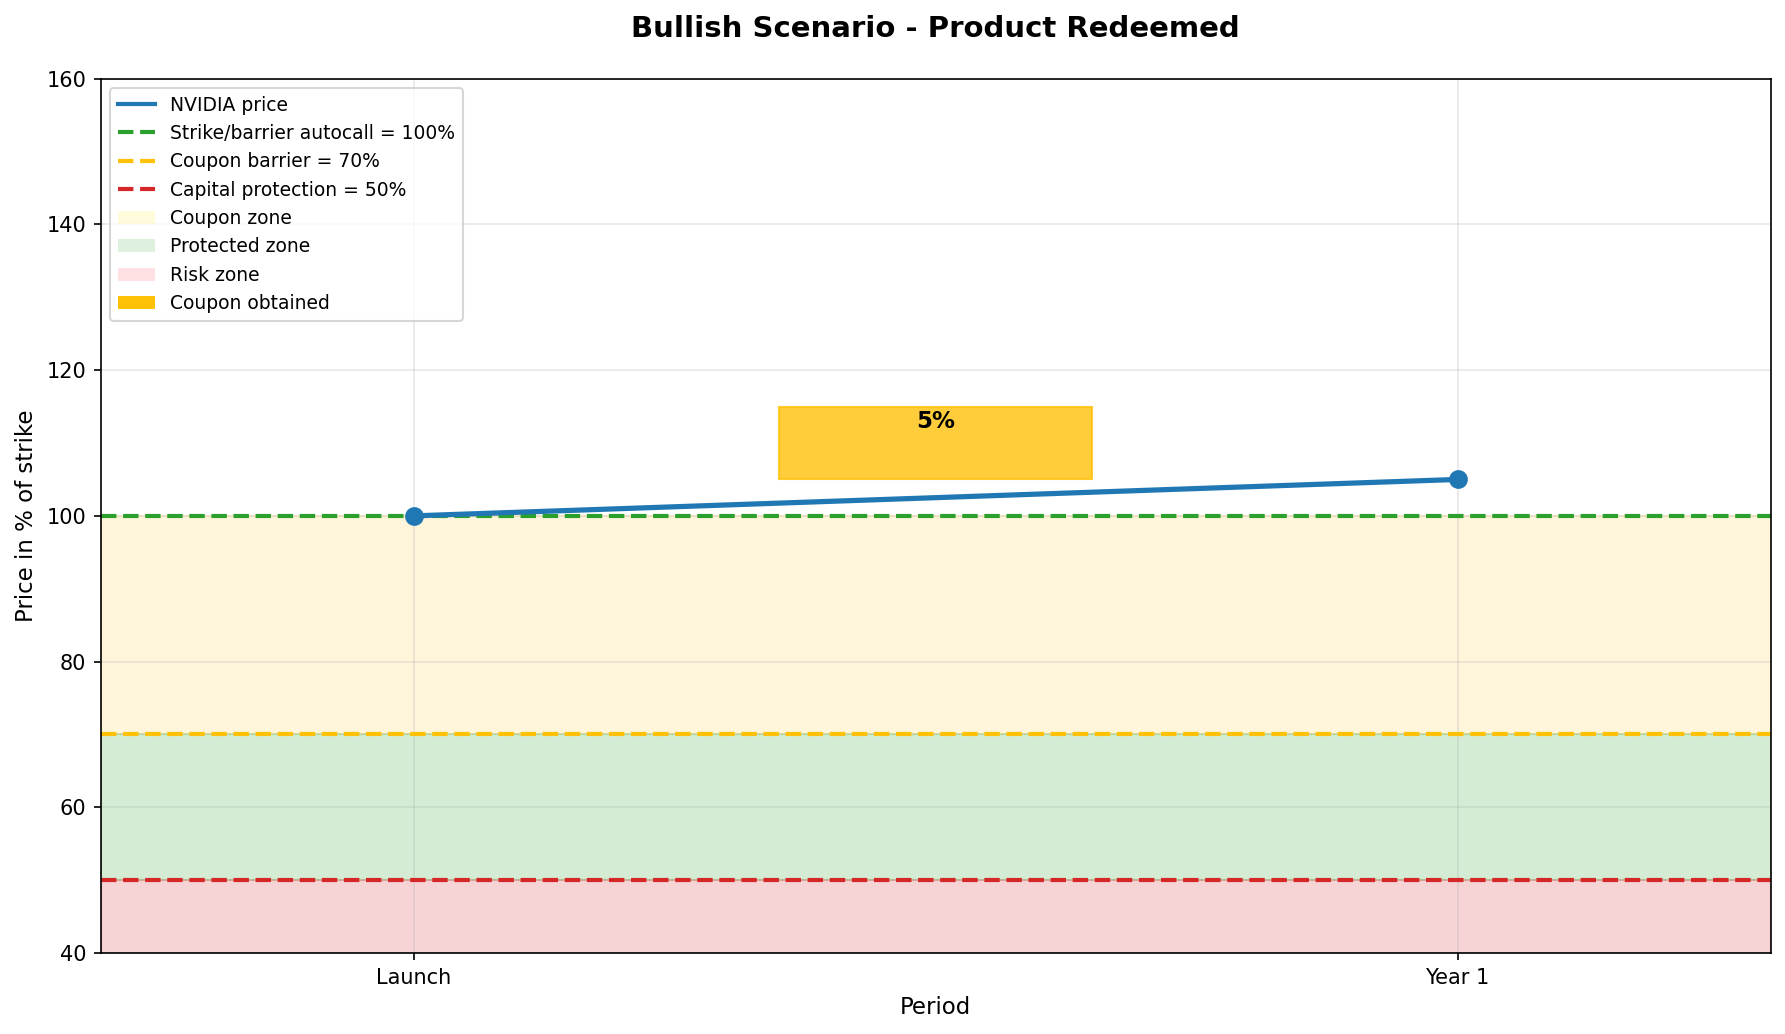
In this first scenario, thanks to favorable market conditions, the price of NVIDIA at the year 1 observation date is above its initial level. As a result, the product is redeemed early, and the investor receives both the coupon of 5% and the nominal.
Bearish Scenario
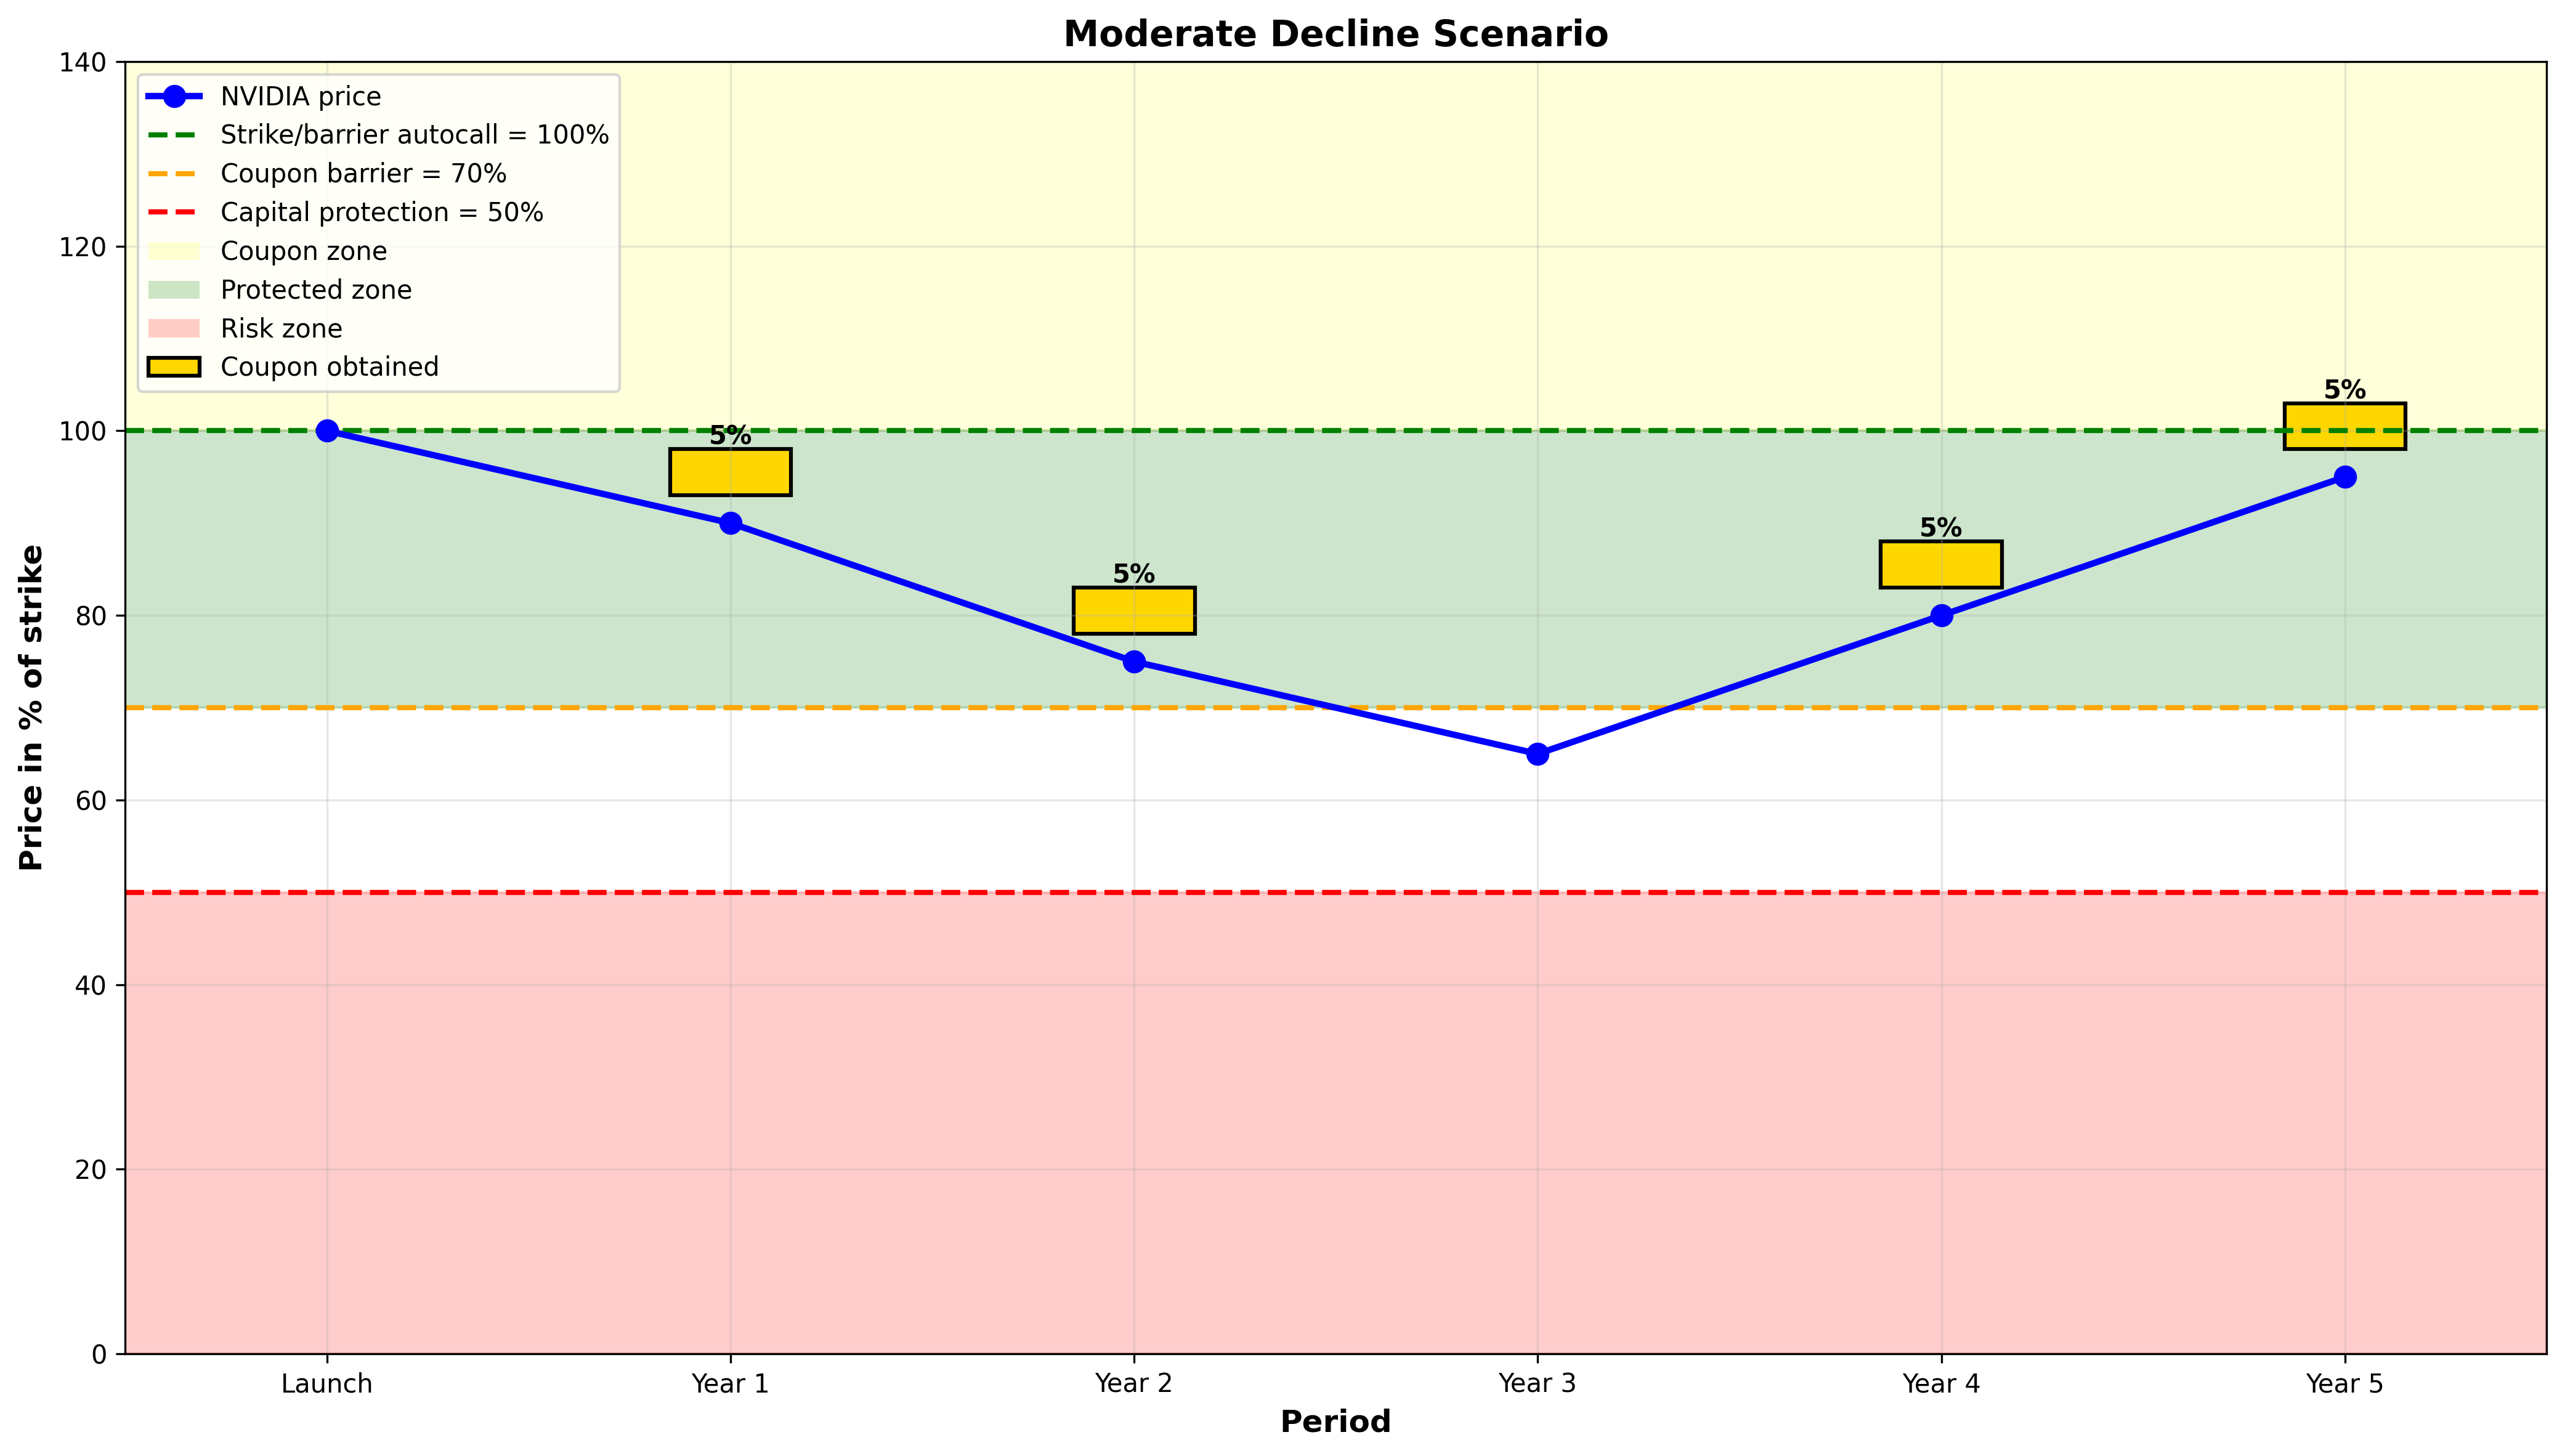
In this scenario, the market conditions did not allow for early redemption of the product, because the price of NVIDIA decreased. However, the investor still received 4 out of 5 available coupons, since the price of NVIDIA lied above the coupon barrier every year except at the year 3 observation date. At maturity, even if NVIDIA is trading at 95% if its initial level, the entire nominal is totally refunded to the investor, thanks to the capital protection barrier. Therefore, in this scenario, at maturity, the investor received 120% of its initial investment.
Market crash scenario
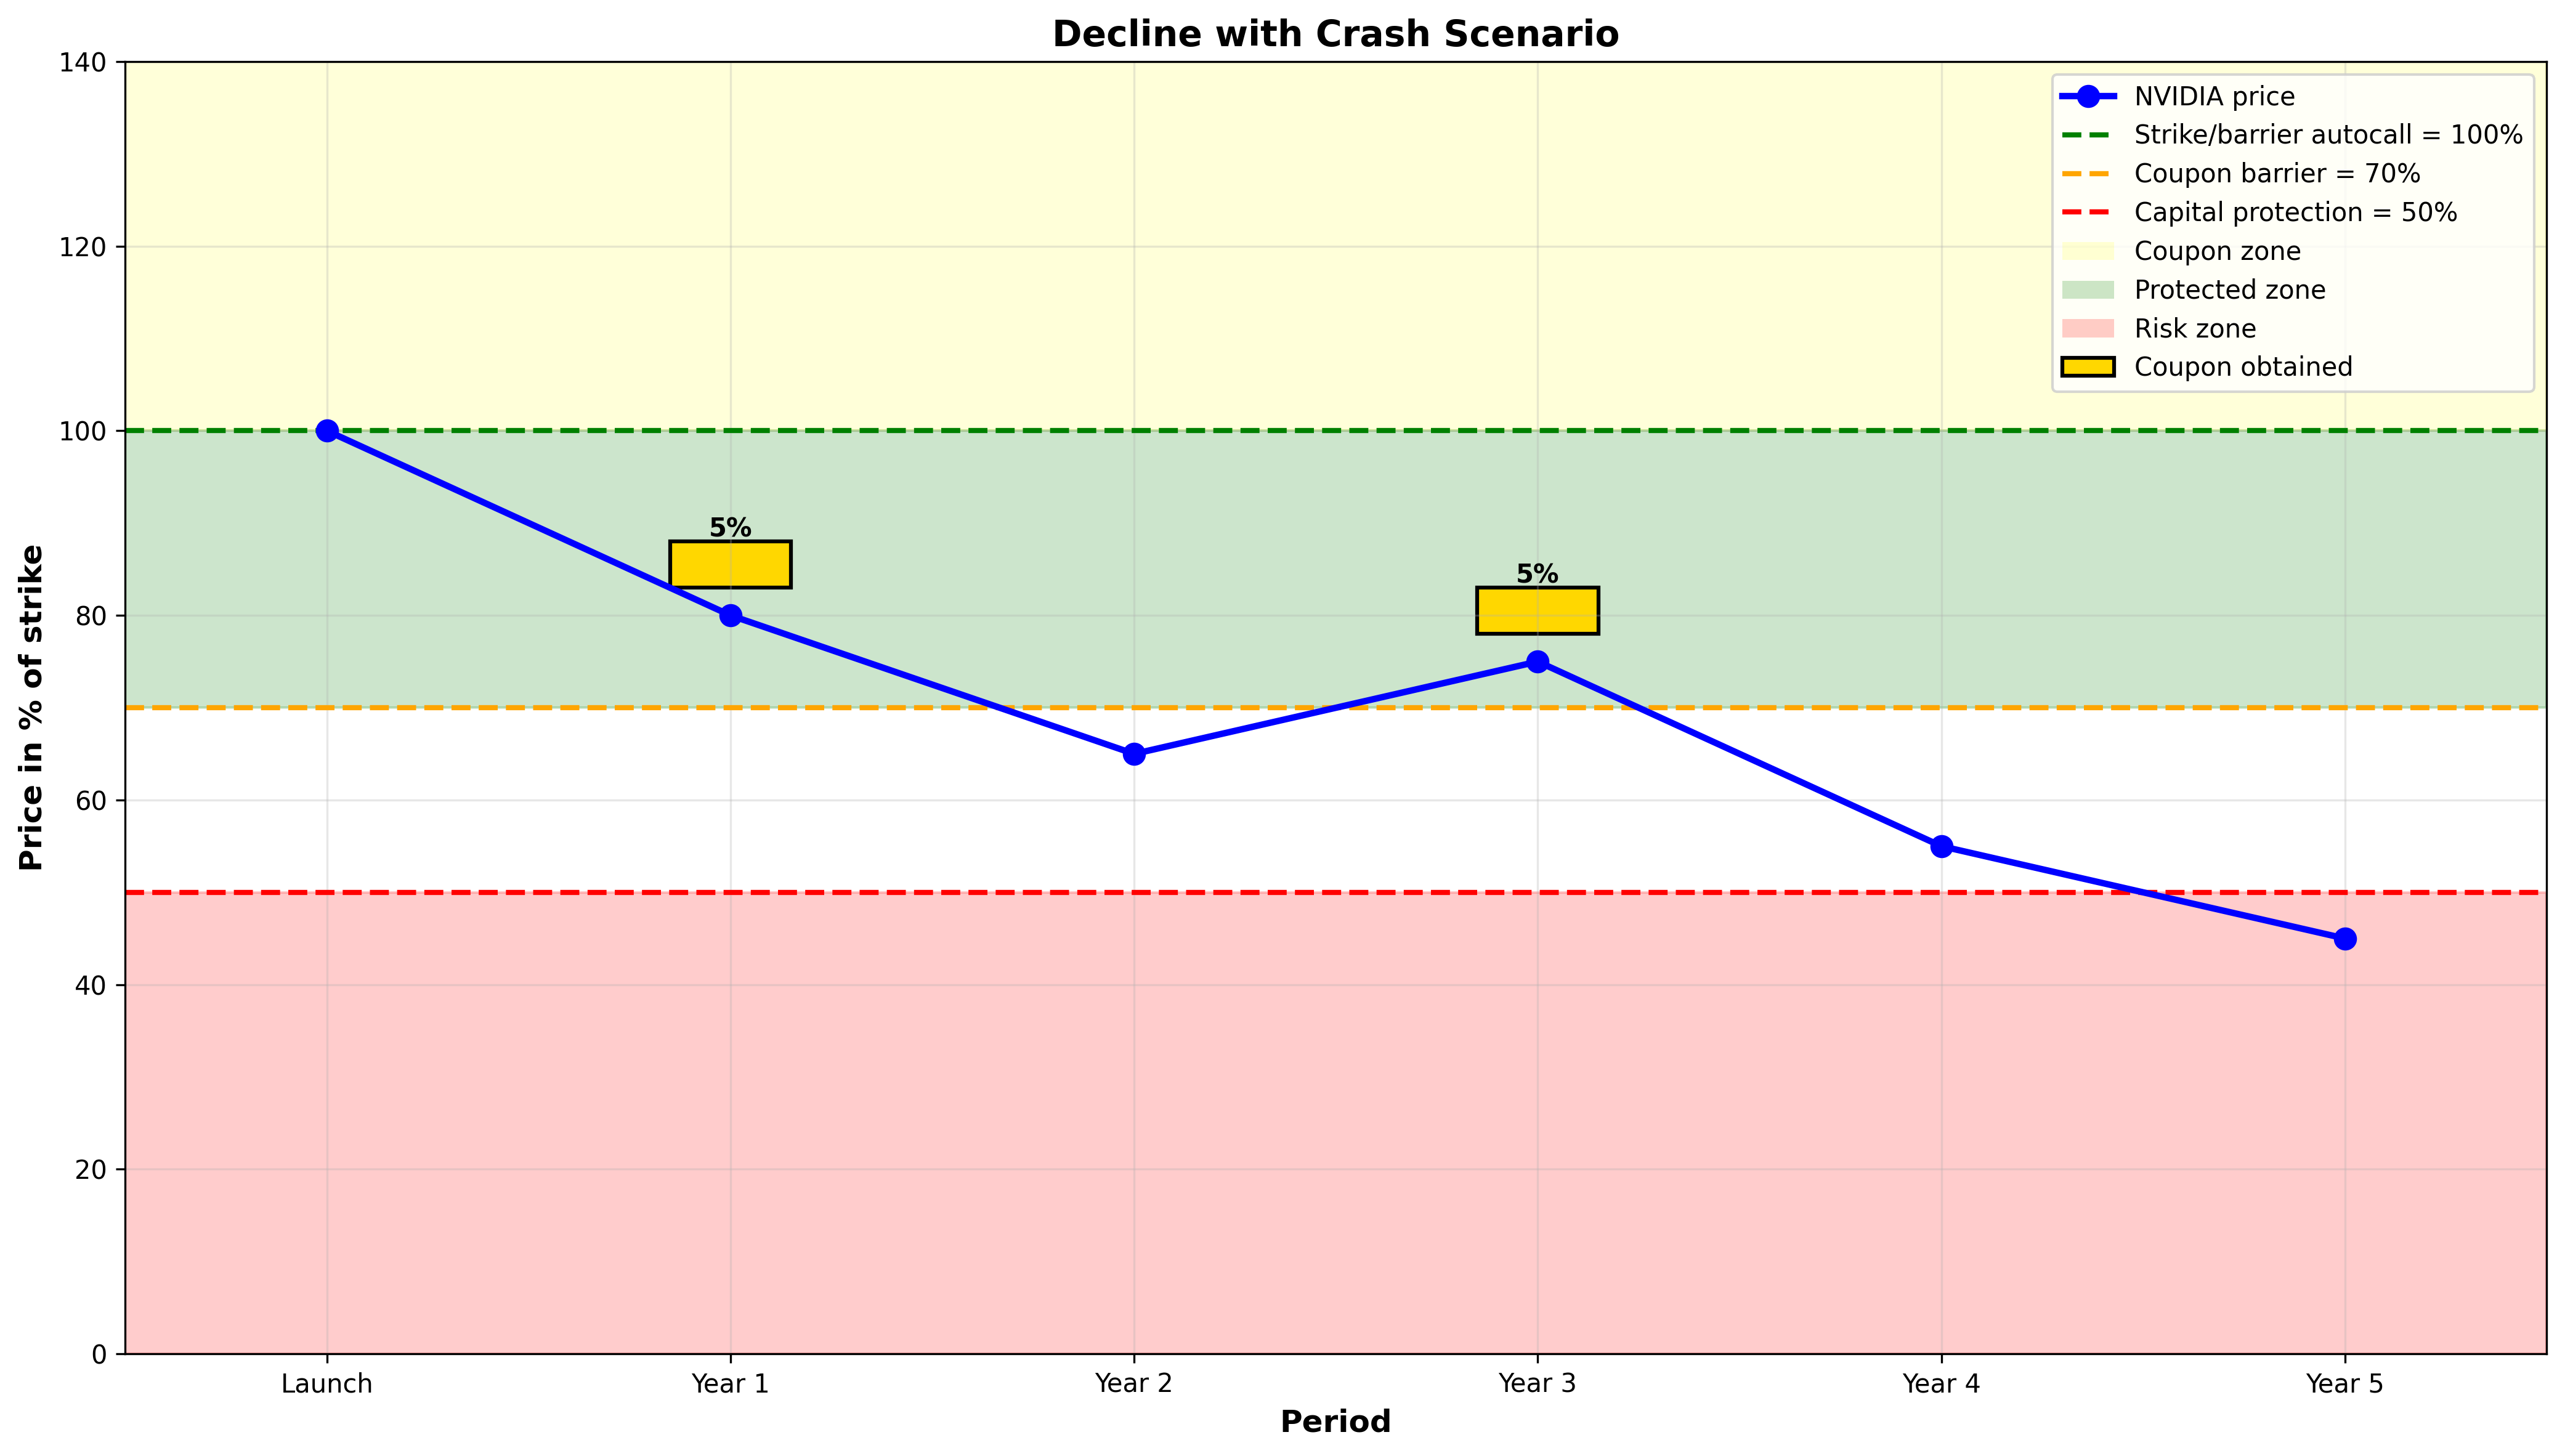
The worst scenario happened for the investor. The price of NVIDIA dived to 45% of its initial level, a price below the 50% capital protection barrier. Here, we can observe that, despite this tremendous decline, two coupons were still paid to the investors (at year 1 and year 3). However, in this example, the price of NVIDIA observed at maturity was 45%, therefore the investor only got 45% back of his initial investment. Therefore, at maturity, the investor received 45% (adjusted nominal) + 10% (coupons) = 55% of its initial investment. The investor suffered a significant loss of capital.
Credit Linked Note (CLN)
Credit Linked Notes are structured products that provide exposure to the credit risk of one or several reference entities. Instead of being primarily linked to equity performance, CLNs are tied to the occurrence of predefined credit events (such as default or restructuring). Investors receive enhanced yield in exchange for assuming the credit risk of the reference entity. If a credit event occurs, the investor may suffer partial or total loss of capital depending on the recovery rate. On a more technical point of view, in the case of a CLN, the investor is selling Credit Default Swaps (CDS) to finance the coupon he’s supposed to receive if no credit default occurs. These CLN can be linked to more than one company and are tools commonly used for yield enhancement and credit diversification strategies.
Reverse Convertible
Reverse convertibles are yield-enhancement products that offer high fixed coupons in exchange for conditional exposure to the downside of an underlying asset. In these products, regardless of the performance of the underlying asset, the coupon will always be paid. But, on the other hand, if the underlying falls below the capital protection barrier, repayment may occur in shares (or at a value linked to the underlying’s final level), leading to potential capital loss. Otherwise, if the underlying remains above a predefined strike or barrier at maturity, the investor receives full nominal repayment. Therefore, these products always run until maturity. Depending on the maturity, the investor is taking an illiquidity risk (this risk is associated with every type of structured products, even if there might be liquidity conditions that can allow the investor to sell his position on a secondary market).
Let’s illustrate this product with a real example. Consider a retail investor purchasing a reverse convertible linked to Apple stock. The product has a 5-year maturity and pays an annual coupon of 5%. Additionally, the investor opts for capital protection at 70%, which limits potential losses in adverse scenarios. The three scenarios below demonstrate the possible outcomes under different market conditions.
Bullish Scenario
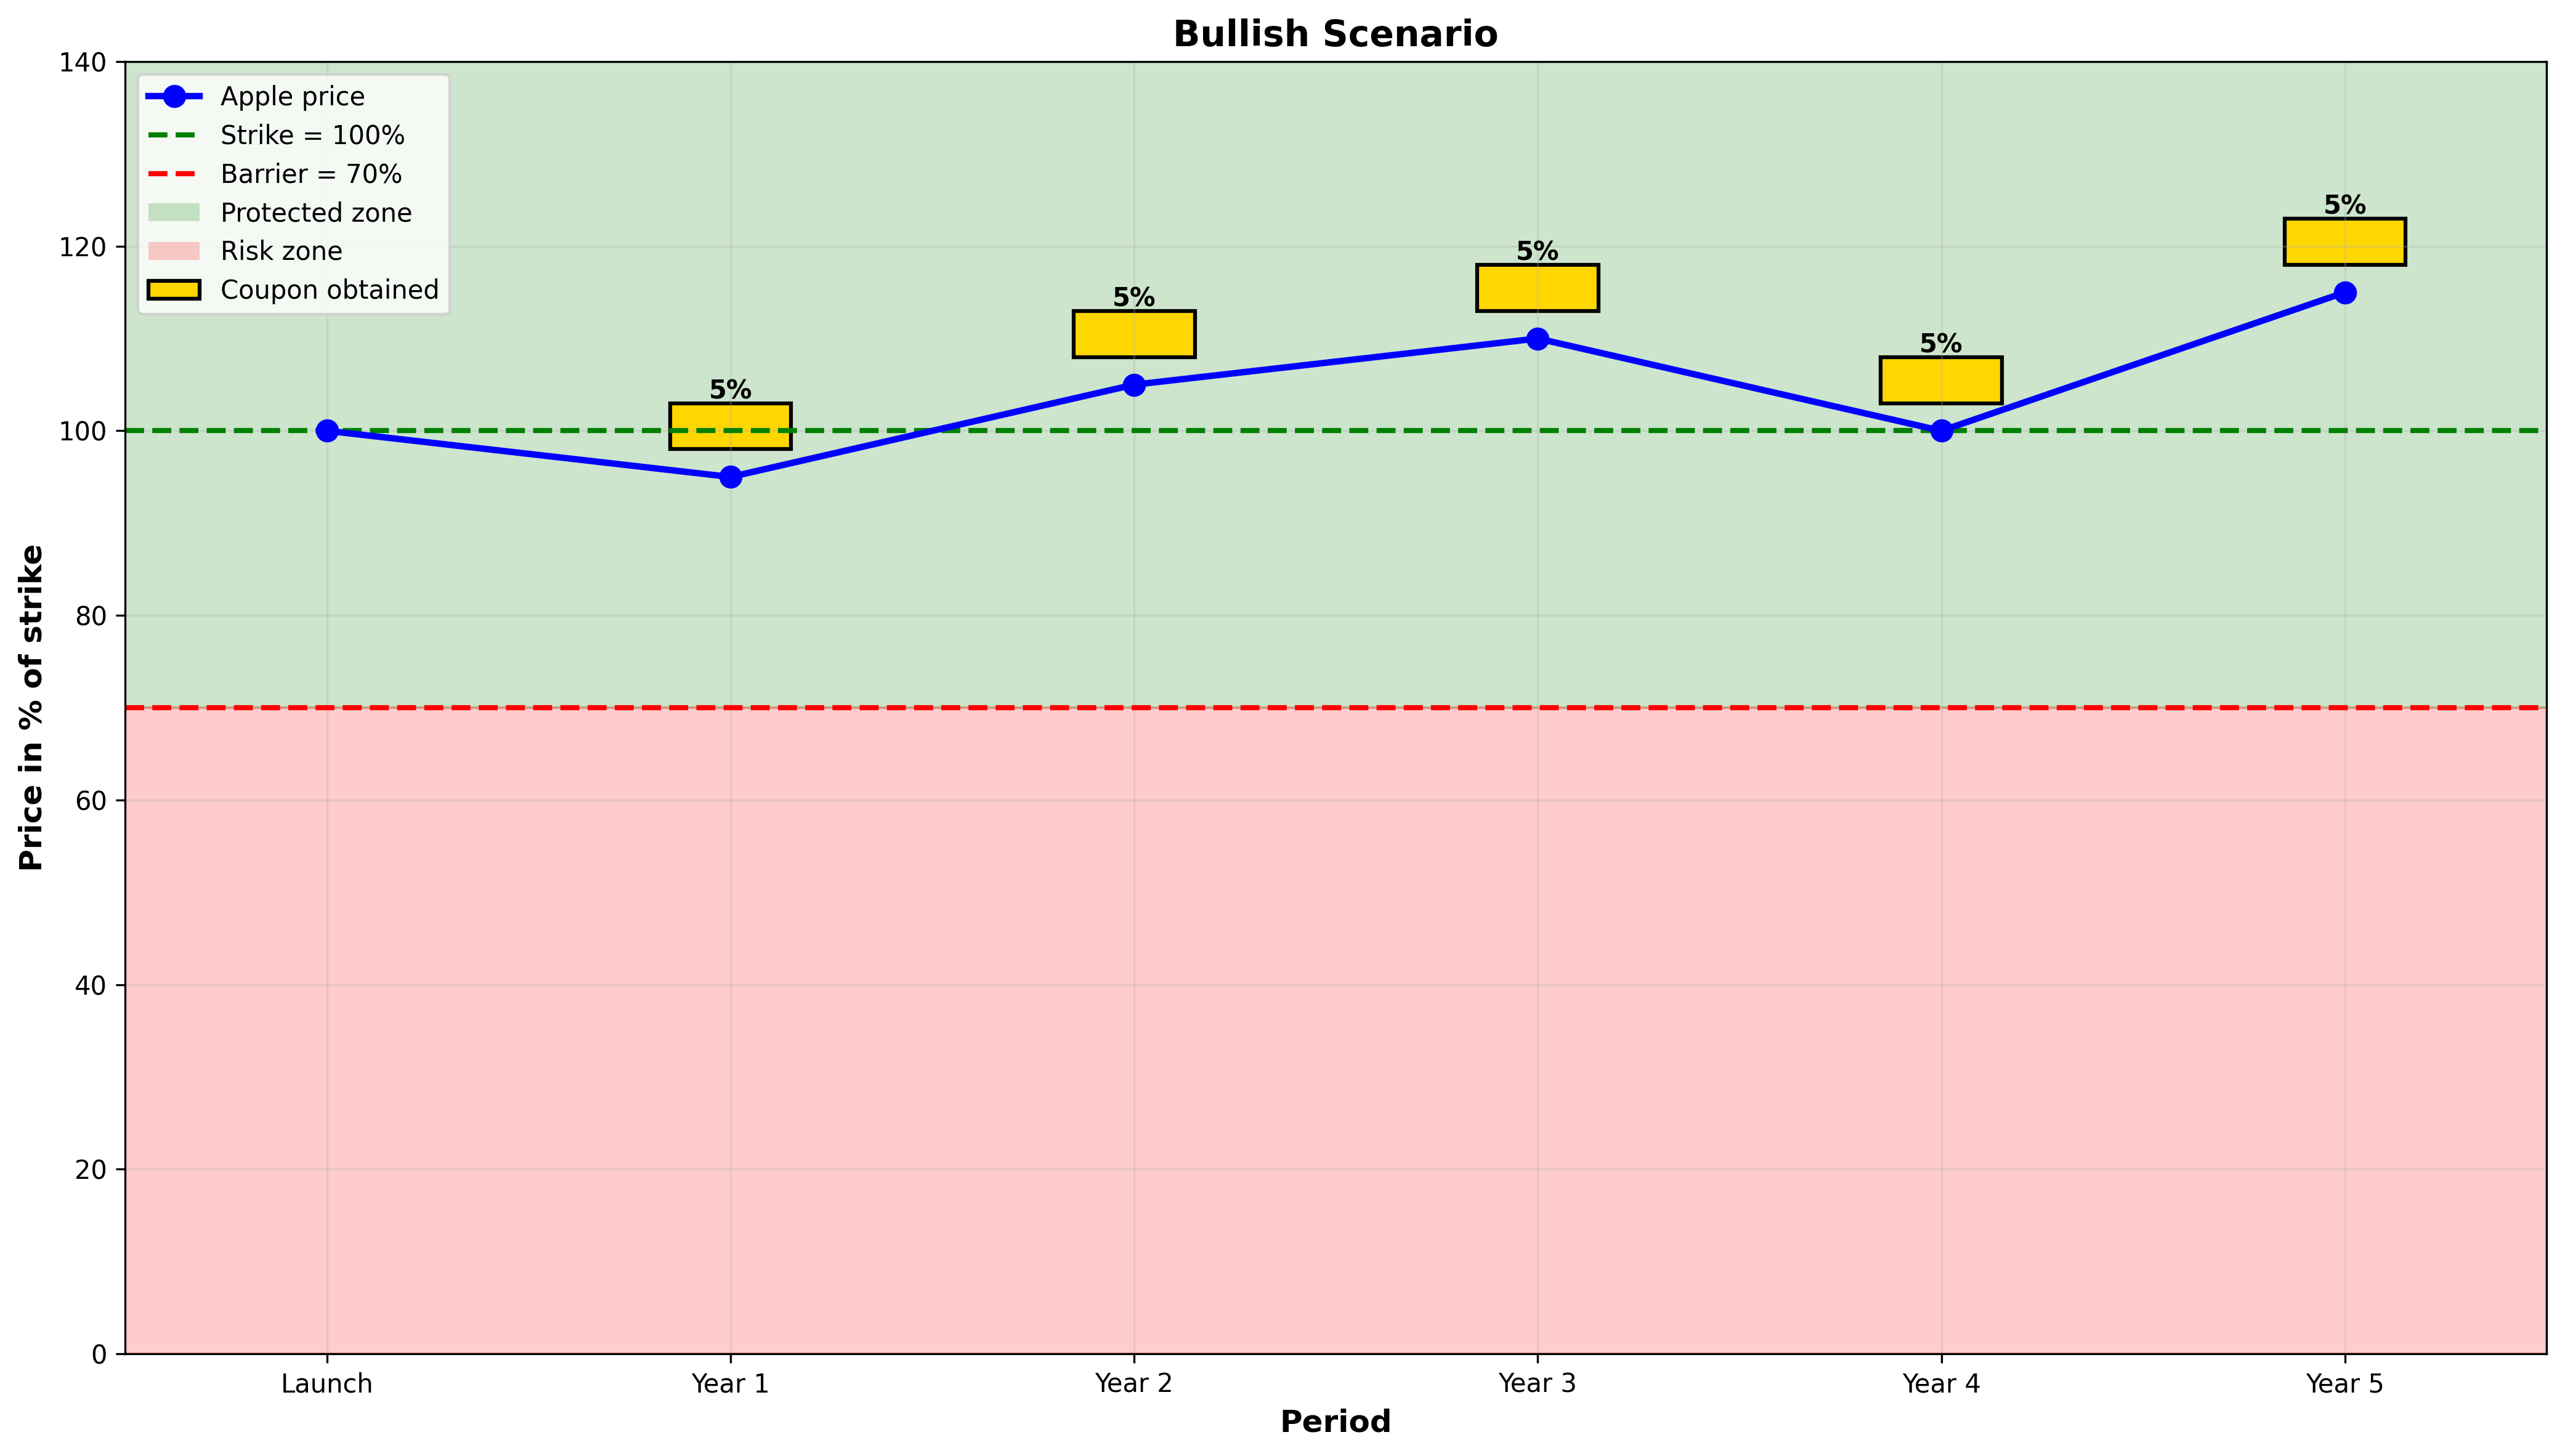
In this first scenario, the investor received the 5 coupons and its initial investment since the price of Apple is trading at maturity at a higher level than at the inception of the product. Therefore, in this case, the investor has received, at maturity, 125% of its initial investment.
Bearish Scenario
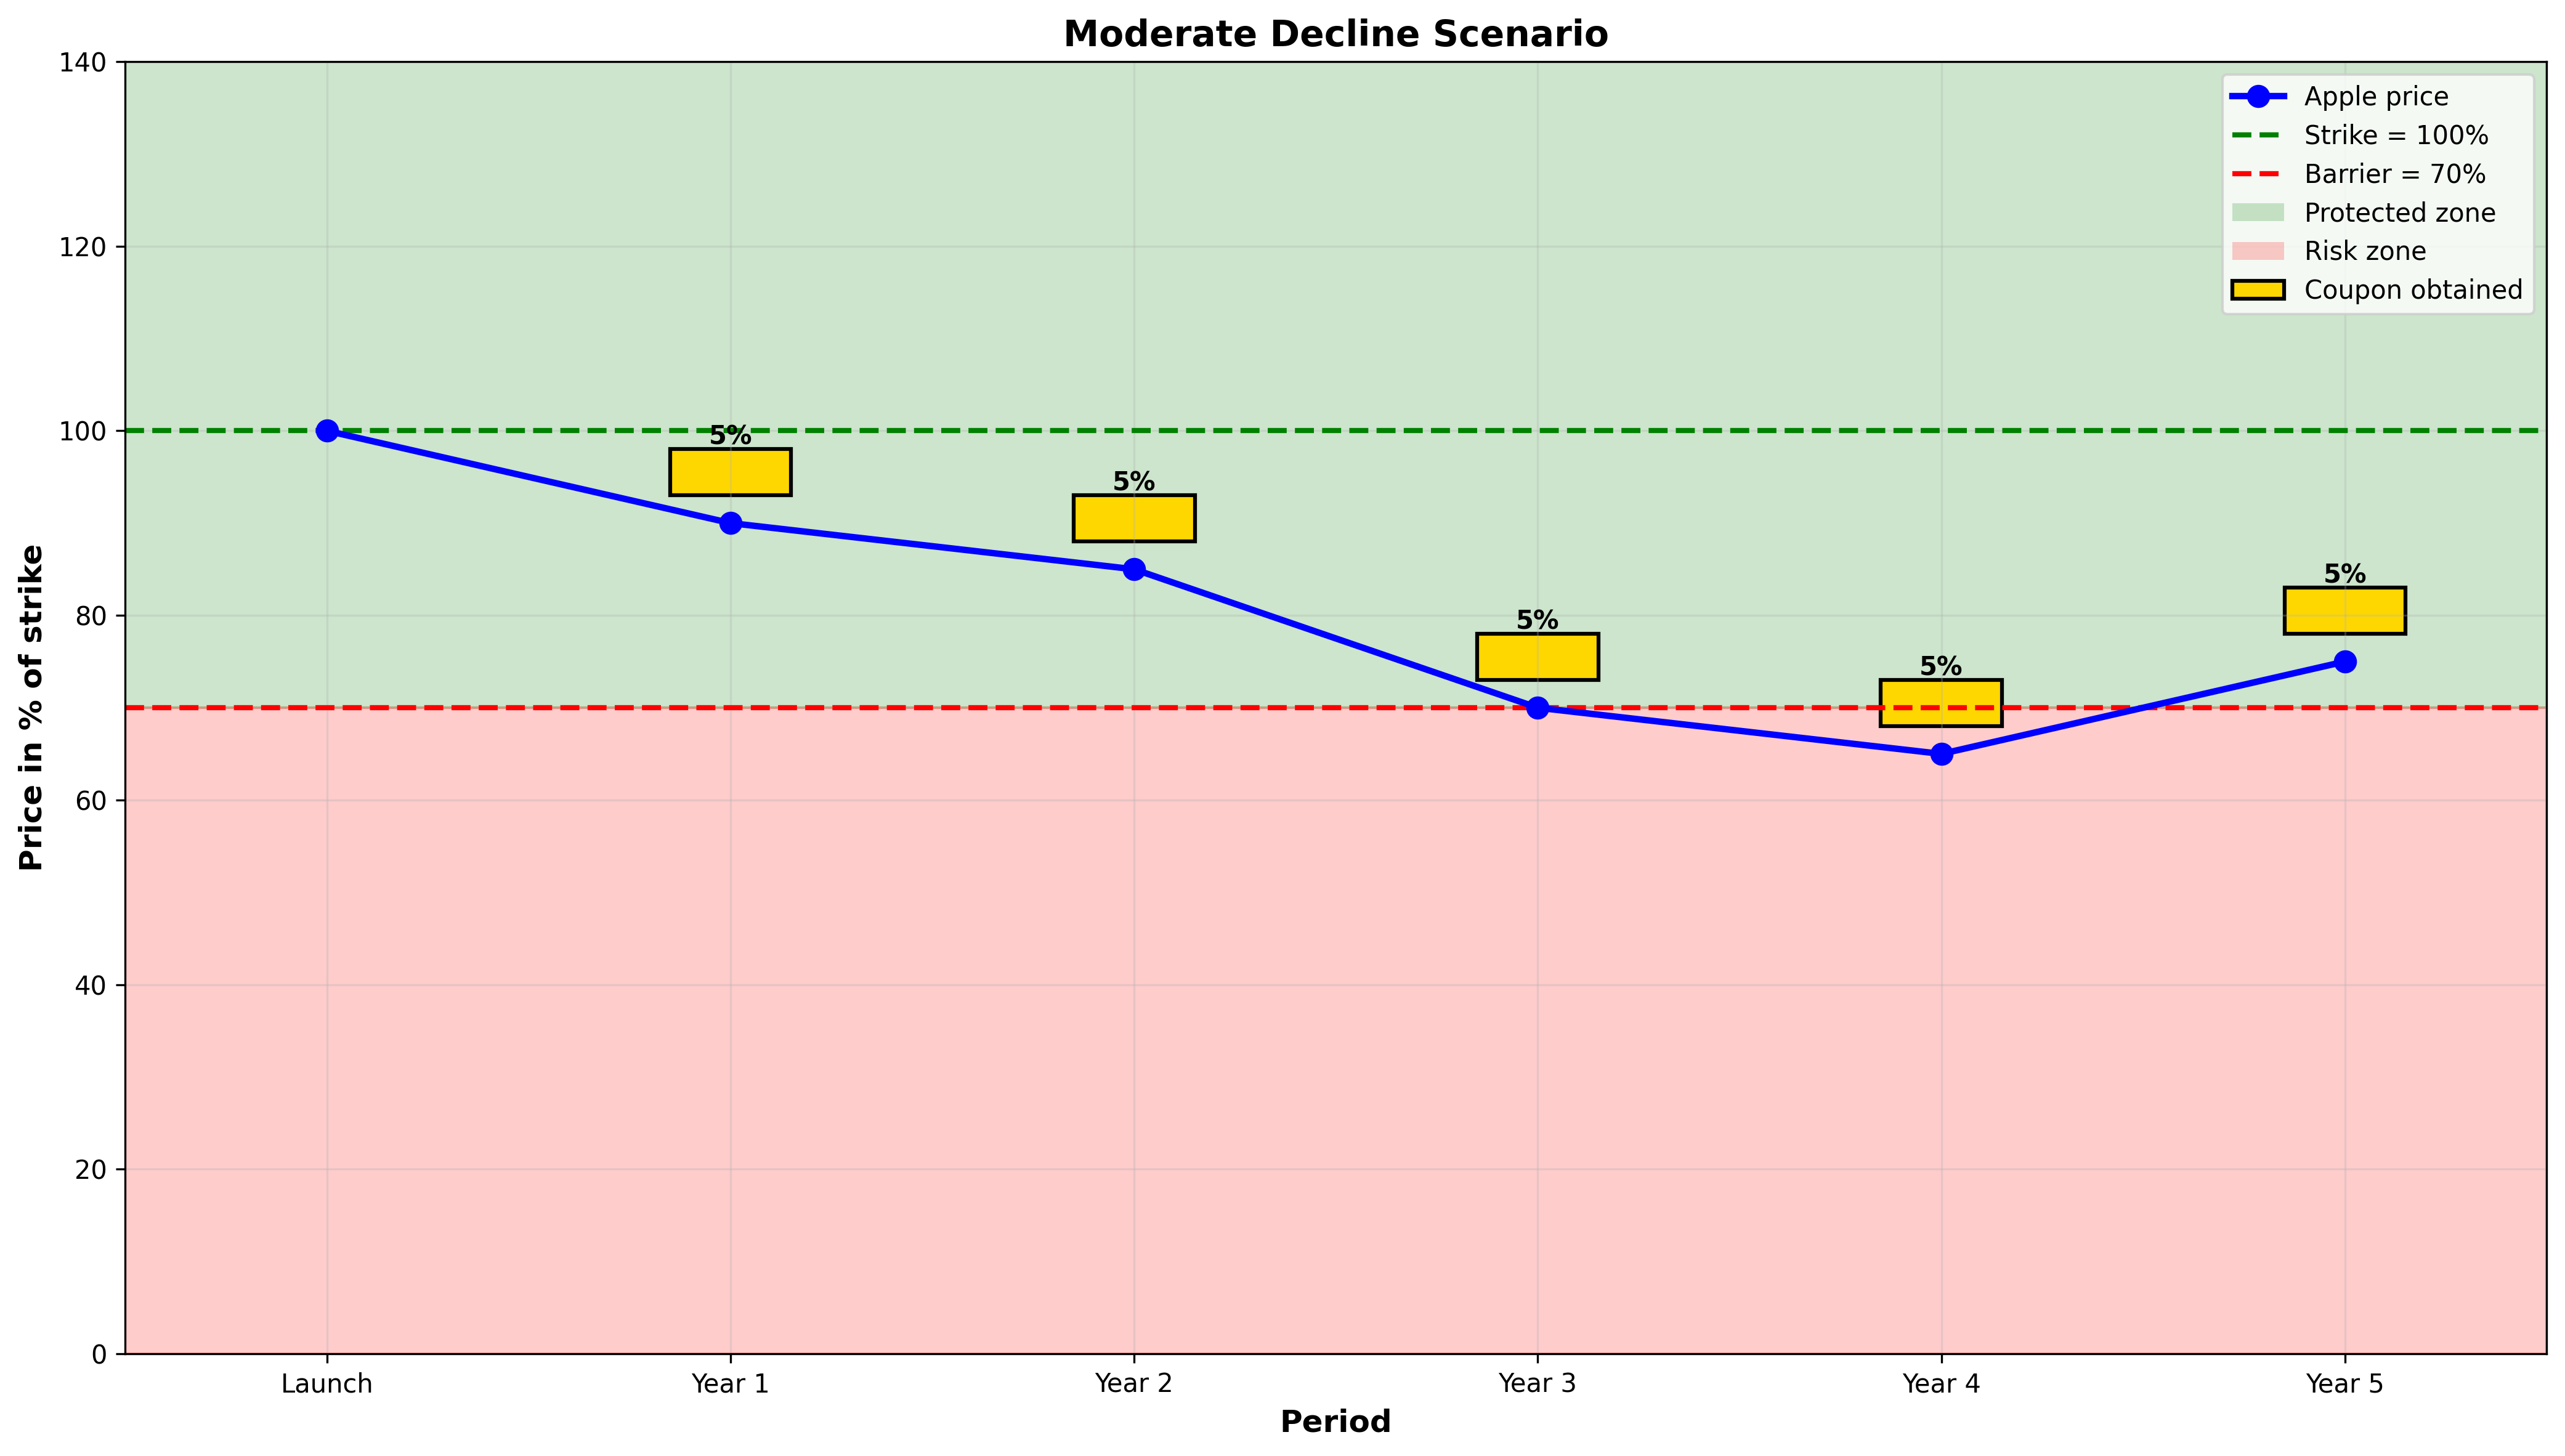
In this second scenario, all coupons have been paid to the investors and the investor received here also, at maturity, its full investment since the price of Apple, ended above the capital protection barrier of 70%. Therefore, in this case, the investor has received, at maturity, 125% of its initial investment.
Market crash scenario
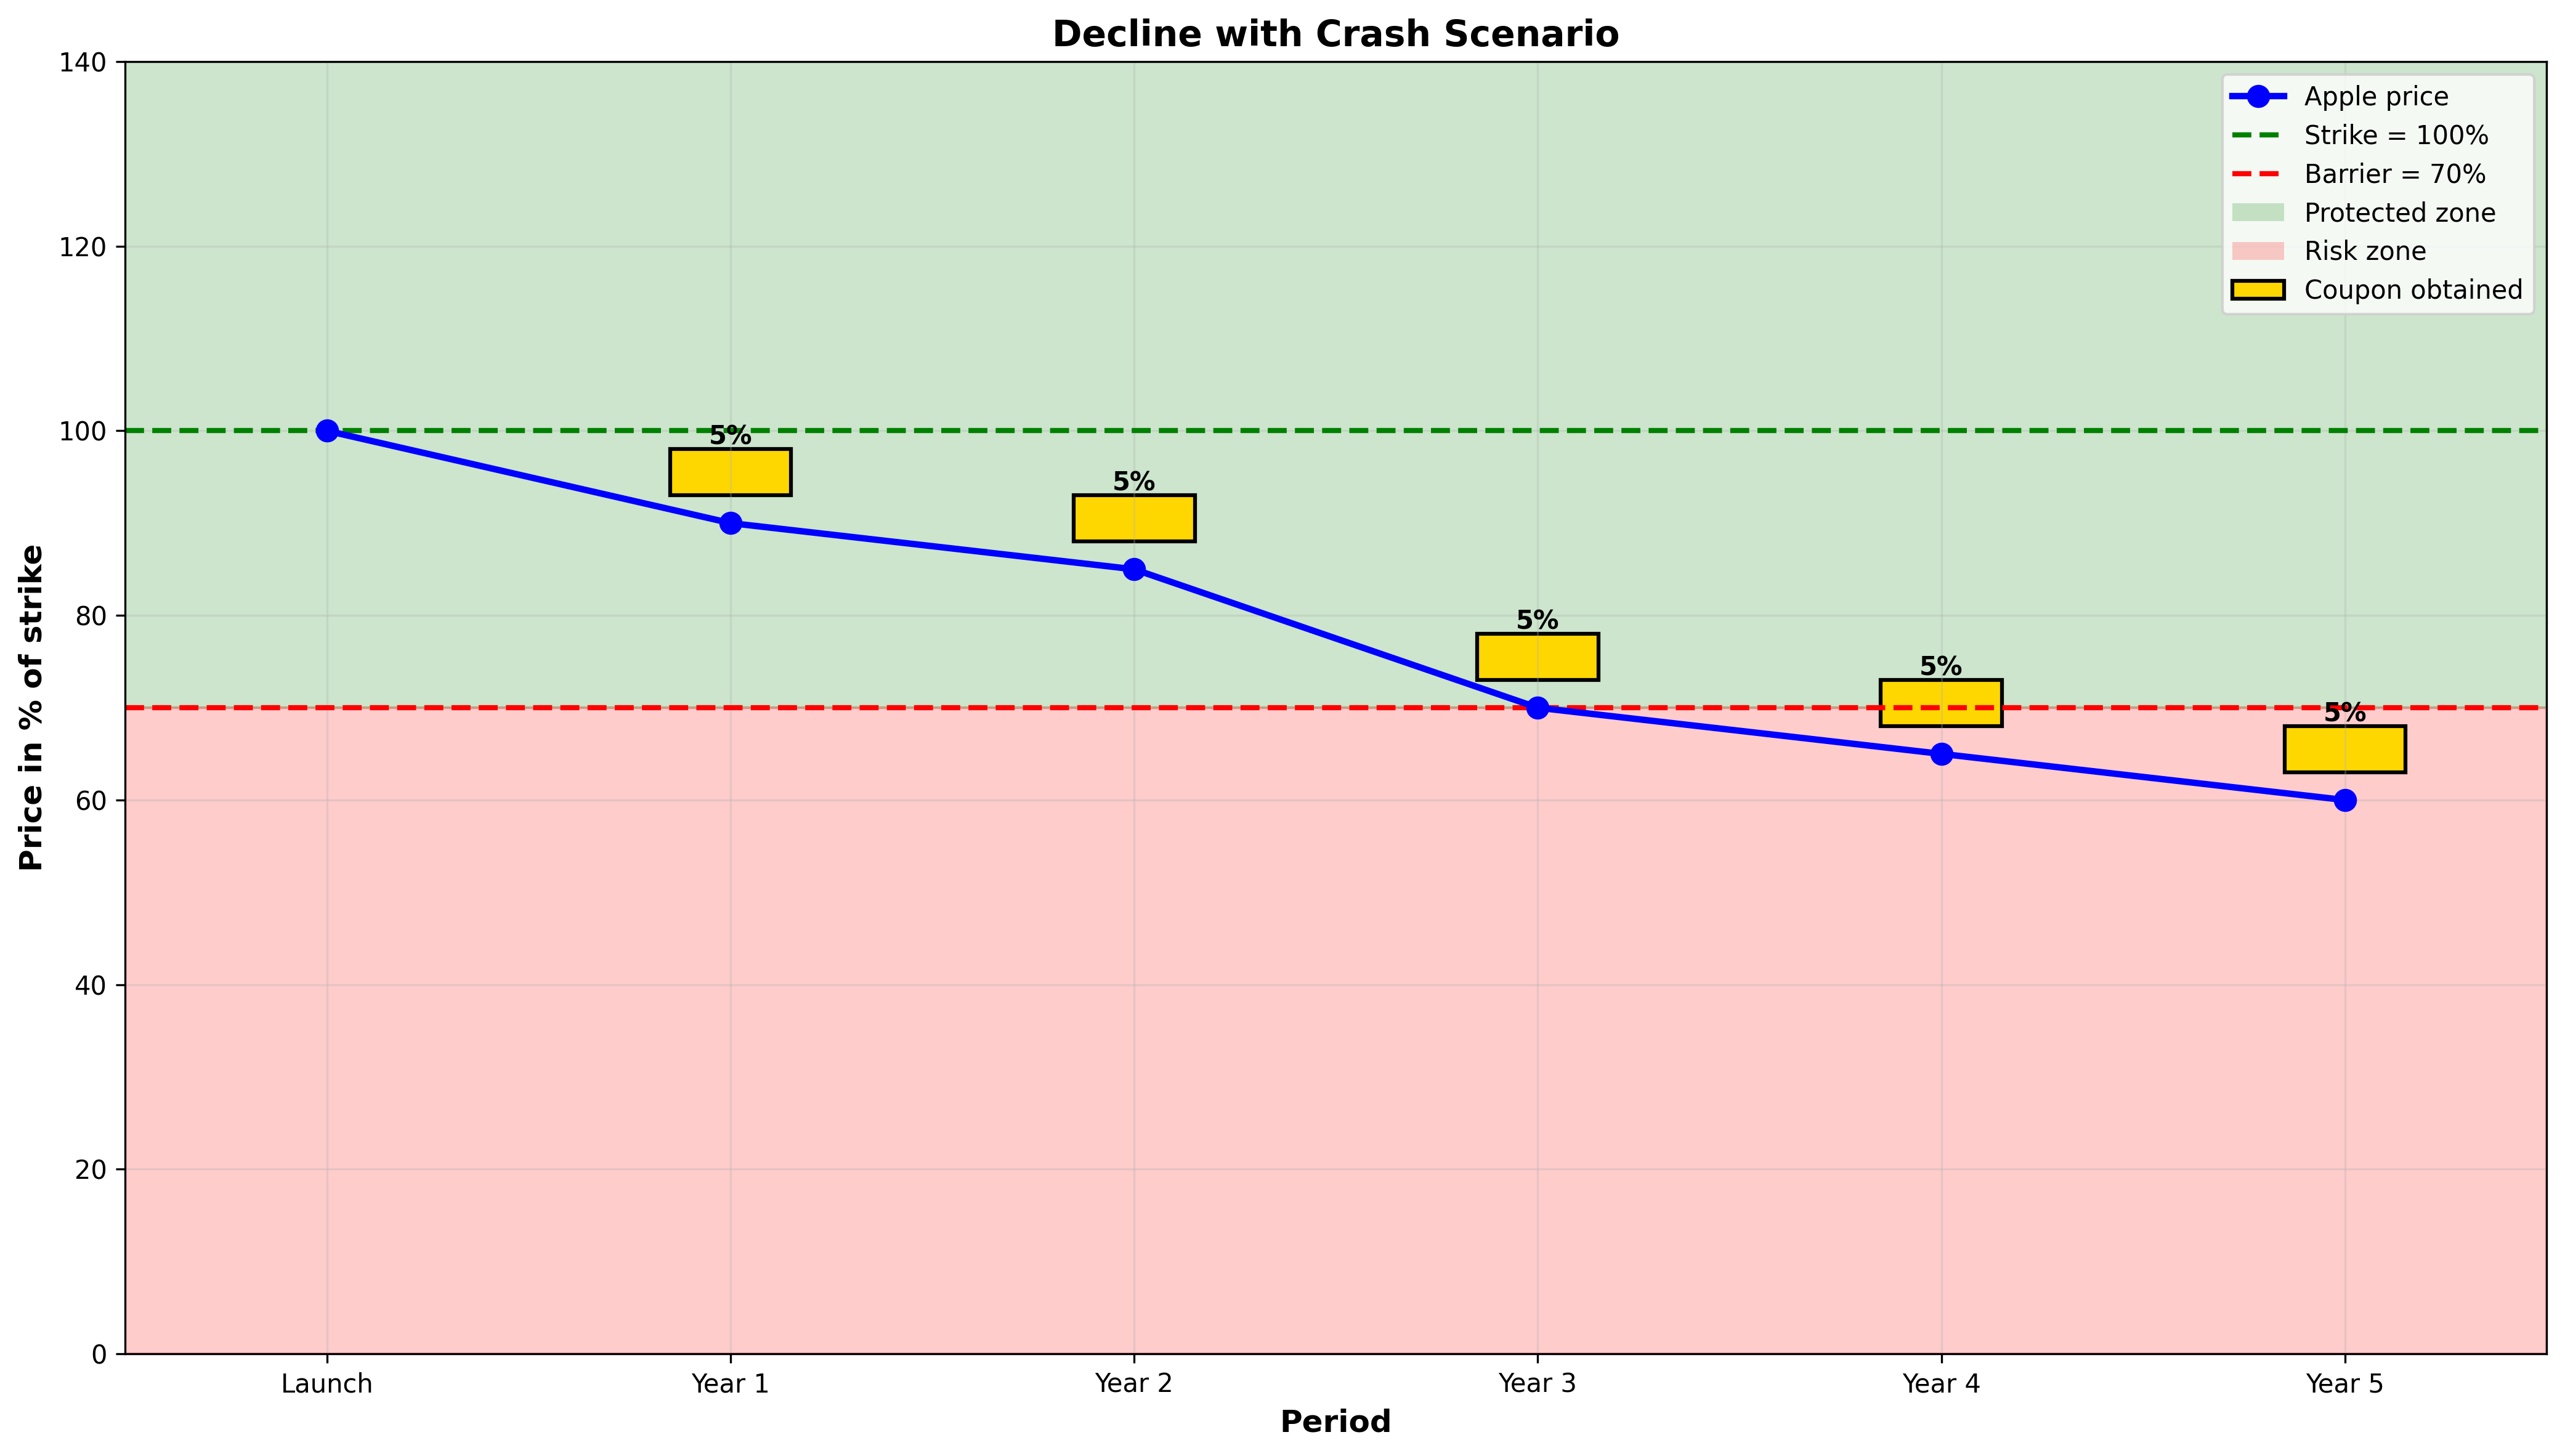
The worst scenario happened for the investor. The price of Apple was trading at maturity at 60% of the initial level. Therefore, as always, all the coupons were paid, but the investor suffered a loss of capital of 40%. Indeed, only 60% of the nominal was refunded to the investor since the price of Apple ended below the capital protection barrier. Therefore, in this case, the investor has received, at maturity, 60% (adjusted nominal) + 25% (coupons) = 85% of its initial investment.
Key features of structured products
Structured products are engineered using specific mechanisms that shape their risk-return profiles. By playing with the parameters, we’ll explore in this section, an investor is able to shape an ideal product, that replicates its market view. By tailoring these mechanisms, an issuer can adjust the risk/return ratio of a structured product. Overall, taking more risks means greater coupons for the investor (as always, if the conditions for payment are met).
Capital protection barriers
A capital protection barrier is a predefined level of the underlying asset below which the investor may incur a loss of capital. If the underlying never breaches this barrier during its observation period (or at maturity, depending on the structure), the investor can benefit from full or partial protection of their initial investment. Barriers are usually expressed as a percentage of the initial underlying level (set at 100). For instance, if a structured product sets a capital protection barrier at 70%. This means that, at maturity, if the underlying lies below this barrier, the investor will suffer a capital loss, proportional to how deep he is. If the underlying is trading at 65% of the strike at maturity, the investor will lose 35% of its invested capital. Otherwise, if the underlying asset closes at 71%, the entirety of the nominal invested will be repaid to the investor.
Investors should understand that the lower the capital protection barrier, the “safer” the investment, and therefore the lower the coupon offered. Conversely, the higher the capital protection barrier, the riskier the product becomes, as the probability of incurring a capital loss increases, and accordingly, the higher the coupon offered. It is also possible to remove all kinds of capital protection, but this rarely the case since it offers full exposure to the underlying asset and is therefore very risky.
Total capital protection
Total capital protection means that the investor’s principal is guaranteed at maturity regardless of the performance of the underlying. In fully capital-protected products, the investor will receive at least the nominal amount back at maturity. The products with this feature are considered “safe”, but the investor bears a huge illiquidity risk depending on the maturity. Even though he can exit the product under certain liquidity circumstances but recall that these conditions are not always in favor of the investor. The issuer is not willing to lose money by providing these exit possibilities. Therefore, exiting a structured before maturity goes almost always with a discount.
Decrement indices as underlying
This feature is one the most complex features of structured products and is very often misunderstood by investors, but also by wealth managers. This feature is extremely risky as the Central Bank of Ireland tried to warn investors but also finance professionals with a letter in March 2023 to warn about these decrement indices. A decrement index is a type of financial index that gradually decreases by a fixed amount at regular intervals, such as daily, monthly, or annually. Often, this fixed reduction represents dividends paid by the underlying stocks or a pre-specified amount chosen by the index provider. Essentially, the index is designed to drift downward over time in a predictable way. To price a structured product, the issuer (the bank and its traders/structurers) must anticipate two parameters, the risk-free rate and the expected dividends of the underlying in case of a stock or an index. The issue with dividends is that their level is uncertain. They are rarely stable, and companies decide to adjust it depending on their results or their financing needs. This uncertainty makes the anticipation of the dividends really complex for structurers and this uncertainty must be paid by the investors. What offer the banks to avoid the investor to “pay” this uncertainty is to anticipate these dividends by decreasing by a fixed amount. The coupon for the investor becomes therefore more interesting for the investor but the investment becomes significantly riskier. As a matter of fact, let’s imagine that an investor buys a product linked to the European Stoxx 50 (SX5E), with a decrement of 5% yearly. Each year, 5 points will be removed from the performance of the SX5E. This reduction increases a lot the probability that, at maturity, the underlying asset lies under the capital protection barrier.
Autocall barriers
Autocall barriers are features used in every autocall products. An autocall barrier is a trigger level set for early redemption. On each observation date, if the underlying asset’s price is at or above this barrier, the product is redeemed early and the investor receives the nominal amount plus an accrued coupon. If the barrier is not reached, the product continues until the next observation date or maturity. The probability of early redemption is influenced by volatility, time to maturity, barrier level, and observation frequency. Lower volatility increases the likelihood that the underlying remains near its initial level and therefore increases the probability of being called. Higher observation frequency increases the number of opportunities for redemption. Lower autocall barriers raise the probability of early termination but reduce the coupon that can be offered, as the option budget must reflect the increased likelihood of payout.
Degressive or step-down barriers
Degressive barriers (also called step-down barriers) are barrier levels that decrease over time according to a predetermined schedule (not to be confused with decrement, which is totally different). This feature can affect coupon barriers and/or autocall barriers. This mechanism makes it easier for the product to maintain capital protection or coupon conditions as time passes, since the barrier getting lower, it becomes less risky for the investor and easier to get the coupon even if the underlying has a negative performance. Step-down features are commonly used to balance downside protection with attractive coupon levels.
Leveraged products
Leveraged products amplify the exposure to the underlying’s performance. Instead of offering a one-for-one participation in gains or losses, they provide a multiple (e.g., 2×) of the underlying’s movement above or below a certain level. Leveraged structures can offer higher potential returns but also involve significantly greater risk and complexity, especially in volatile markets. These investments are highly risky and are not common in France or in Europe due to legislation.
Memory effect
The memory effect is a feature found in some structured products, particularly Phoenix, where missed coupon payments can be “remembered” and paid later if conditions are subsequently met. For example, if the product fails to meet the coupon condition on one observation date but satisfies it on subsequent dates, the investor may receive the accumulated unpaid coupons at that later time. This mechanism enhances the probability of ultimately receiving the anticipated income. This feature makes the product less risky and therefore reduces the amount of the coupon.
Technical composition of a structured product: What’s behind the scene?
Structured products may appear complex, but from a financial engineering perspective, most of them can be broken down into two fundamental building blocks: a fixed-income component and a derivatives component. Understanding this decomposition is key to understanding pricing, risk, and payoff mechanics. The fixed-income component corresponds to a zero-coupon bond, and the derivatives component is made of one or multiple options.
Zero-coupon bond
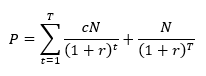
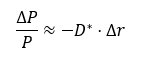
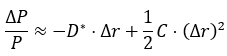
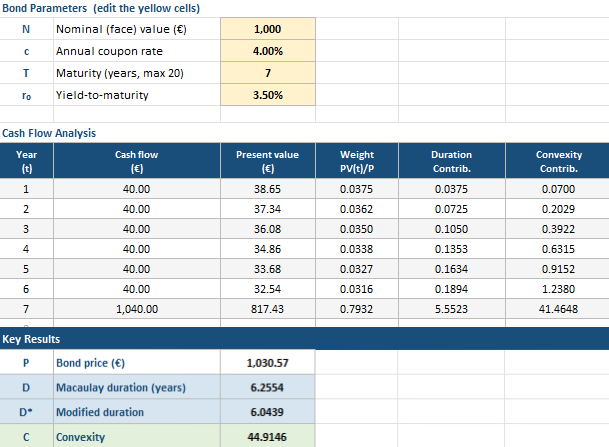
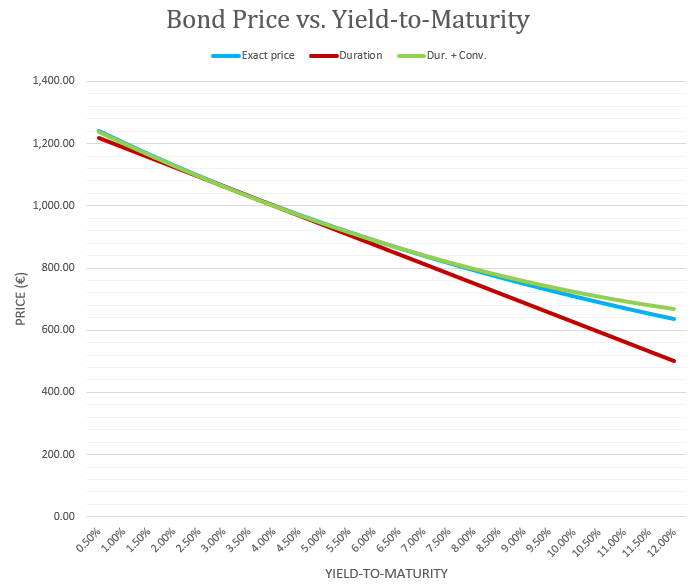
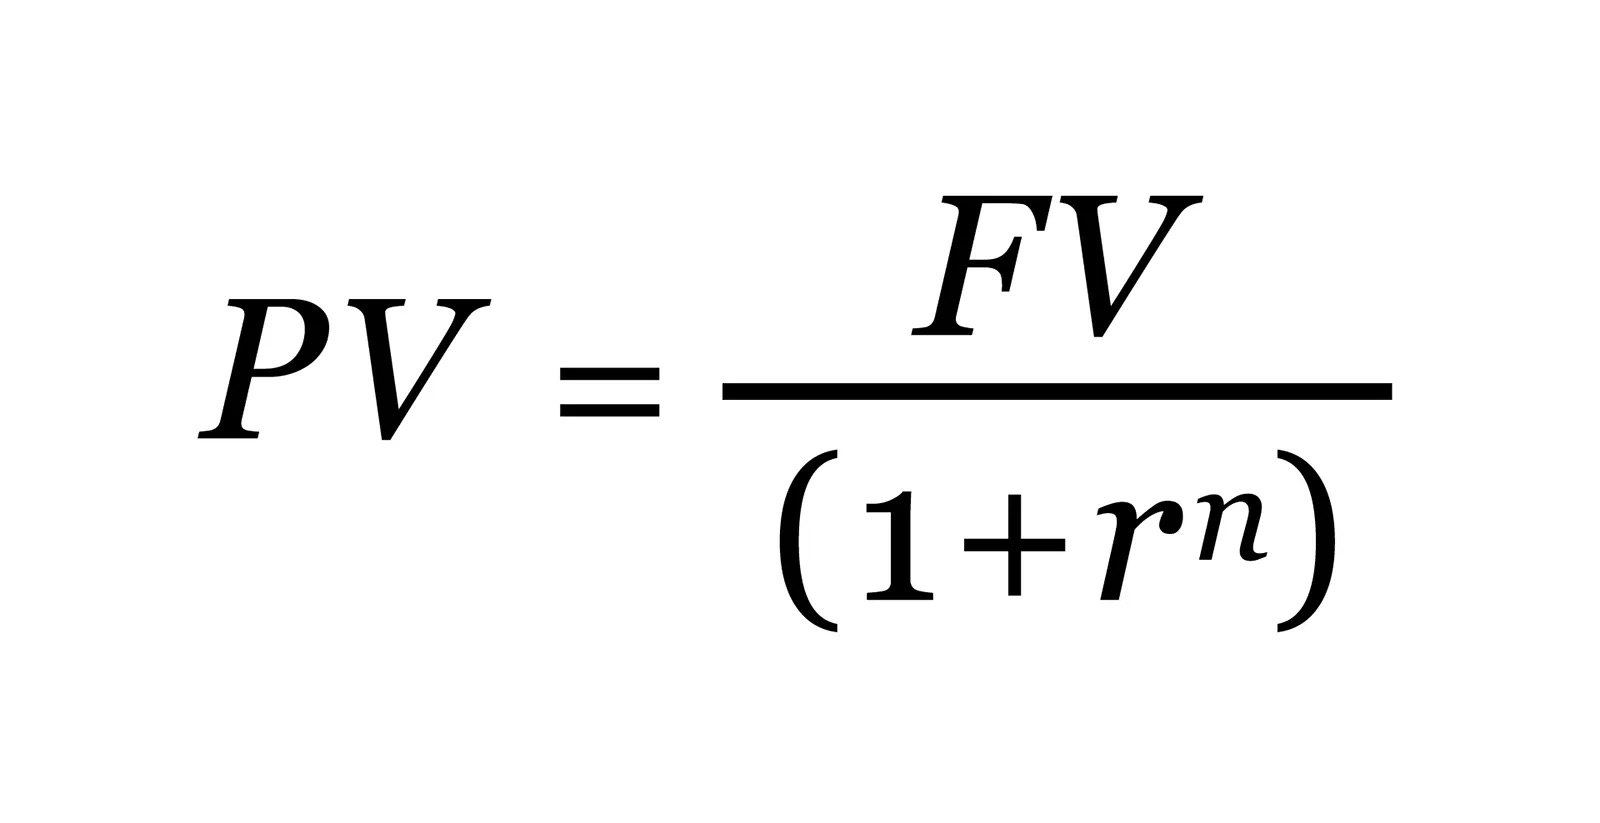
The zero-coupon bond is the capital preservation engine of the structured product. To build a structured product, a zero-coupon bond is purchased at a discount and repays its full nominal value at maturity. In structured products, part of the investor’s initial capital is allocated to buying a zero-coupon bond issued by the bank. If held until maturity, this bond grows back to the nominal amount, thereby ensuring full or partial capital protection (depending on the structure). For example, if interest rates are positive, the issuer does not need to invest 100% of the investor’s capital to guarantee 100% repayment at maturity. A portion (say 85–95%) may be sufficient to secure the nominal amount at maturity, because when a zero-coupon is bought, it is bought a discount. Indeed, the formula for this instrument is as follows: PV = N/(1+r)T, with N, the nominal, r, the interest rate, T, the number of years, while PV is the present value or simply the price. For example, if interest rates are 3% and maturity is five years, the issuer needs approximately 86.3% of the invested capital to guarantee repayment of 100 at maturity. The remaining 13.7% constitutes the option budget that will finance the derivative component of the structure. This simple discounting mechanism explains why the interest rate environment plays a crucial role in structured product design. When interest rates are high, the present value of the guaranteed capital is lower, leaving a larger budget to purchase optionality. Conversely, in a low-rate environment, capital protection becomes more expensive, reducing the amount available to enhance coupons or upside participation. Moreover, the longer the maturity, the cheaper the bond. This allows the investor to have a greater budget for the other component, that shapes the payoff. The bigger budget for the options you have, the greater your coupon can be.
Finally the investor has to remember that the zero-coupon bond is not necessarily a risk-free investment. Since the issuer of the bond is the bank that also issues the structured product, the investor bears the issuer’s credit risk default. Therefore, a higher issuer credit spread reduces the cost of the funding leg and mechanically increases the option budget, which may result in more attractive coupons, although at the expense of higher credit risk for the investor.
Options
The performance component of a structured product is constructed through a portfolio of options. Once the funding leg has secured the desired capital protection level, the remaining capital is allocated to buying and/or selling derivative instruments that shape the payoff profile. The option portfolio may include long call options to provide upside participation, short put options to finance enhanced coupons, digital options to generate fixed conditional payments, and barrier options to create knock-in or knock-out features. We will now explore deeper how the mechanisms we explained before are replicated with options.
What about capital protection barriers?
Capital protection barriers are engineered primarily through put options. Consider a structure offering full capital protection as long as the underlying does not fall below 60% of its initial level at maturity. Economically, this is equivalent to the issuer being short a put down-and-in (PDI) option at 60% of the initial level. If the underlying finishes above that level, the put expires worthless, and the investor receives full nominal repayment. If it finishes below, the put is in the money and the investor participates in the downside beyond the strike, typically through physical delivery. Therefore, the sale of this PDI brings cash to the investor that allows to buy more options to increase the potential payoff. By bearing a downside risk with the investor being short a PDI, the premium of the option brings cash to finance other options. The price of these put options varies a lot depending on many factors: volatility of the underlying, maturity but also type of barrier. As a matter of fact, a PDI with a European barrier is cheaper than a PDI with an American barrier. Let’s break it down. European barriers can only be triggered at the end of the product life, at the maturity, but an American put can be exercised at any time before maturity. Ultimately, an American option gives more in-the-moneyness probabilities to the investor who is long the put.
Moreover, there is a concept that matters a lot for structurers: the skew. Skew simply states that the downside protection is more expensive than upward protection. In other words, put are more expensive than call for a same (opposite) strike. This is explained because investors fear more the loss than the gains. This concept affects therefore the price of a PDI option, in the advantage of the investor if he’s willing to take a riskier standpoint.
Finally, another alternative to PDI to gain downside protection, is the Gear Put, which is a leveraged put. As I mentioned earlier, these protections are not common since the European and French regulators do not want that retail investors take leveraged downside positions.
How do structurers build autocall barriers ?
As an reminder, an autocall is triggered if, at the observation date, the underlying trades above the autocall barrier. This barrier is synthetized by structurers by using knock-out digital options, calls here, also called barrier options. These tools simply say that, at the observation date, if the underlying asset trades above the strike price, then the digital call is triggered and pays a fixed pre-determined amount. The payoff of these instruments is therefore simply 1 or 0 depending of the level of the underlying. Without going too deep into the technical side of these digitals. Due to the liquidity of these options, a structurer creates these barrier options using call spreads.
The Greeks, what sensitiveness do traders look at?
Structured products are not static instruments. Once issued, they are dynamically hedged by the structuring or trading desk. The risk of these products is managed through sensitivities known as “Greeks,” which measure how the product’s value changes in response to variations in market parameters. Because most structured products embed optionality, understanding these sensitivities is crucial for risk management. Traders continuously monitor delta, gamma, vega, and theta in order to hedge their positions and control their P&L (Profit & Loss).
Delta
The delta measures the sensitivity of the product’s price to small changes in the underlying asset. For instance, if a product has a delta of 0.4, a one-unit increase in the underlying leads approximately to a 0.4 increase in the product’s value. In structured products, delta is rarely constant. For capital-protected products with upside participation, delta is positive but typically less than one. For yield products such as autocalls or reverse convertibles, delta can vary significantly depending on proximity to barriers. Autocalls structures often shows complex delta behavior. When the underlying approaches the autocall barrier, delta may increase sharply due to the higher probability of early redemption (if the product is triggered, the product ends, and there is no more delta-hedging since the investor is paid). Conversely, if the underlying approaches the capital protection barrier, delta can become more negative, reflecting increasing downside exposure. Trading desks hedge delta dynamically by buying or selling the underlying asset (or futures). Because delta changes continuously, hedging must be adjusted frequently, especially in volatile markets.
Gamma
Gamma measures the sensitivity of delta to changes in the underlying price (it is the second derivative of the product value with respect to the underlying). Gamma reflects how quickly delta changes. High gamma means that delta is unstable and requires frequent rebalancing. Same as the delta, structured products with embedded barrier options often exhibit high gamma near barrier levels. For example, when the underlying trades close to a knock-in or knock-out barrier, small price movements can significantly change the probability of barrier activation, causing sharp shifts in delta. In summary, gamma risk is particularly acute near maturity or near barrier levels.
Vega
Vega measures sensitivity to changes in implied volatility. Implied volatility is not the historical volatility, but the volatility that is anticipated by the market. This implied volatility affects, by a lot, option prices. Vega indicates how much the product’s value changes when market-implied volatility moves by one percentage point. Most structured products distributed to investors are structurally short volatility. This is because enhanced coupons are financed by selling optionality, such as puts. When implied volatility rises, the value of those short options increases, negatively impacting the product’s market value. An investor has to remember that during market crises, volatility spikes can significantly deteriorate the value of structured product inventories due to their short vega profile.
Theta
Finally, the last Greek that an investor must understand is Theta. It measures the sensitivity of the product’s value to the passage of time. It represents time decay. For a long option position, theta is typically negative, as options lose value over time. For a short option position, theta is positive, reflecting the fact that the seller benefits from time passing without adverse movement. For autocall products, time decay also influences the probability of early redemption. As maturity approaches, the distribution of potential outcomes narrows, and risk becomes more concentrated around barrier levels.
Why should I be interested in this post?
You may be interested in this article for several reasons. It summarizes a wide range of key concepts related to financial products. It will therefore be particularly useful if you are an investor seeking investment solutions aimed at growing your wealth. This article provides a solid foundation for understanding these products, which are very often misunderstood. Naturally, these investments involve risks, and I strongly encourage you to fully acknowledge them, as partial or total loss of capital may be associated with this type of product. This article will also help you understand how issuers design and structure these products.
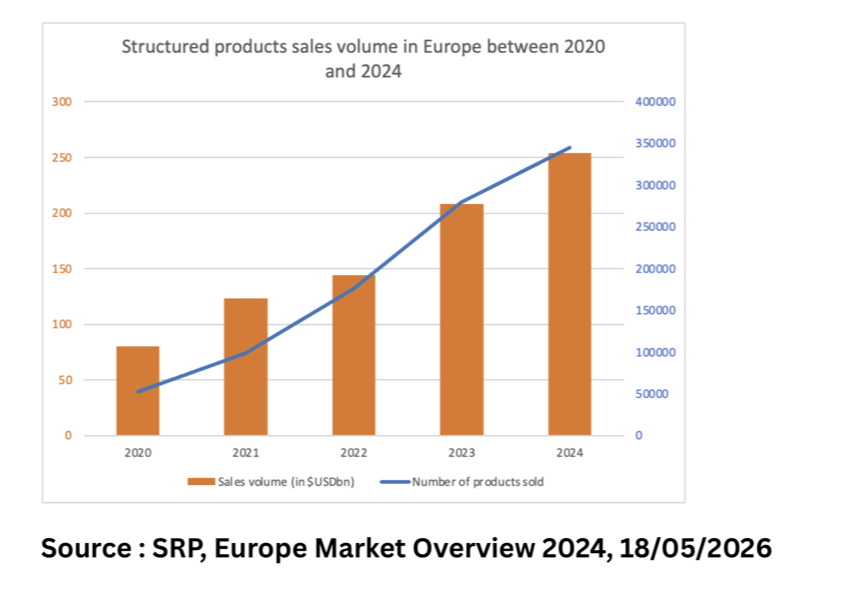
Moreover, the number of structured products sold and issued has increased a lot for few years. According to SRP and their report on the European market, in 2020, the sales volume of structured products in Europe was about more than USD$75 billion, for less than 50 000 structured products issued. In 2024, the number of structured products issued rose to more than 350 000 and the sales volume exploded to reach more than USD$250 billions. You can find below the sales volume evolution of structured products in Europe between 2020 and 2024 :
Structured products sales volume in Europe between 2020 and 2024
Finally, this article may prove highly valuable if you are a student looking to build your knowledge of these financial products. It will also be beneficial if you are preparing for interviews for trading floor positions at investment banks or for roles as a structured products broker. All the elements covered in this article provide relevant material to help you prepare for the technical questions typically asked by recruiters.
Related posts on the SimTrade blog
Professional experiences
▶ All posts about Professional experiences
▶ Mickael RUFFIN My Internship Experience as a Structured Finance Analyst at Société Générale
▶ Wenxuan HU My experience as an intern of the Wealth Management Department in Hwabao Securities
▶ Mathis HOUROU Client Segmentation and Private Banking: Marketing Strategy or Risk Shield?
▶ Lang Chin SHIU My internship experience at HSBC
Financial techniques
▶ Tianyi WANG Understanding Snowball Products: Payoff Structure, Risks, and Market Behavior
▶ Mahé FERRET Selling Structured Products in France
▶ Akshit GUPTA Equity structured products
▶ Shengyu ZHENG Reverse Convertibles
▶ Slah BOUGHATTAS Book by Slah Boughattas: State of the Art in Structured Products
▶ Shengyu ZHENG Capital Guaranteed Products
Useful resources
Yaël Eljarrat-Ouakni What is a Structured Product? Société Générale Private Banking France.
BNP Paribas Wealth Management (07/2021) Understanding Structured Products
Autorité des Marchés Financiers (AMF) (24/05/2025) 2025 Markets and Risk Outlook
SRP (18/03/2025) Global Market review 2024, Europe Market review 2024
Central Bank of Ireland (03/03/2023) MiFID Structured Retail Product Review – Supervisory Guidance (Decrement Index warnings)
About the author
The article was written in February 2026 by Jules HERNANDEZ (ESSEC Business School, Global Bachelor in Business Administration (GBBA), 2021-2025).
▶ Discover all articles by Jules HERNANDEZ.


 Source: Fisher Investments


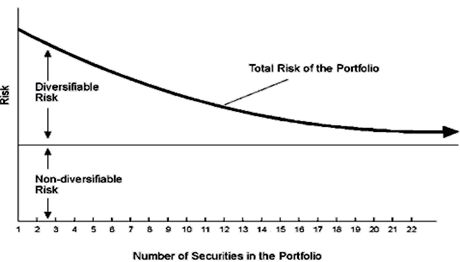 Increasing the number of securities in a portfolio reduces unnecessary risk, limiting the risk of excessive fear for the investor