

In this article, Hadrien PUCHE (ESSEC Business School, Grande École Program, Master in Management, 2023-2027) will help you to prepare your stock pitch by developing your skills in financial analysis, equity valuation, critical thinking, and investment decision-making.
What is a stock pitch?
A stock pitch is a structured presentation of an investment idea, regarding the shares of a publicly traded company. Its purpose is to convince an audience, such as a portfolio manager or an investment committee, to buy, hold, or sell a stock based on a well-supported financial analysis.
A stock pitch typically combines an analysis of the company and its industry, an assessment of its financial performance and prospects, a valuation of its shares, and an evaluation of the main risks and opportunities. The analysis leads to an investment recommendation (Buy, Hold, or Sell), supported by a clear investment thesis and a target price reflecting the estimated value of the stock over a specified investment horizon.
The objective of this article is to put yourself in the position of a financial analyst and prepare your own stock pitch. You will select a publicly traded company, analyze its business and financial performance, assess its stock valuation, and formulate a reasoned investment recommendation.
A successful company is not necessarily an attractive investment. Whatever its true value may be, what really matters is whether or not its price is above or under this value. As Warren Buffett once said, price is what you pay, value is what you get. Therefore, the true question lies in understanding if the current price correctly reflects the company’s value.
Why is mastering stock pitching useful for your career ?
In finance, you may be asked to prepare slide decks, and pitch any type of investment idea. Moreover, being able to structure and organize a presentation is a key skill that will be useful in whatever field you want to work in.
An important tool in finance
Here are some finance jobs that may require you to master stock-pitching:
- Buy-Side (Mutual Funds, Family Offices, Hedge Funds): Long-only portfolio manager evaluates investment ideas pitches to deploy capital over the long term. Pitches are also useful in long/short or market-neutral hedge funds, to construct relative-value ideas or pair-trades (going long on an undervalued company while being short on an overvalued peer to isolate company-specific alpha from market-wide beta).
- Sell-Side (Investment Banks): Equity Research Analysts pitch research views to institutional clients to generate trade ideas and commission.
- Corporate Finance & M&A: It’s a fundamental skill set (evaluating business drivers, competitive moats, and financial models) for transaction advisory and strategic planning.
From Passive Learning to Active Valuation
Studying financial statements in a textbook is static. Building a stock pitch forces you to bridge theory and practice. You move from reading financial ratios to predicting operational drivers, learn to defend your assumptions, test sensitivities, and quantify risk versus reward.
Developing a “Variant View”
The market is generally efficient, meaning public information is already reflected in the stock price. The true relevance of a stock pitch lies in training your mind to spot market inefficiencies, situations where public perception, short-term panic, or over-optimism obscures a business’s true long-term earning potential.
How to pick your stock?
The first thing you will have to do is choose a stock to analyze and pitch. Those are the key factors to consider when choosing a firm to analyze:
- Size (market capitalization): choosing a “large cap” (over a billion euros/dollars) will let you have access to much more content and research than when choosing a “small cap”, making your work easier.
- Geography: European or American firms are usually easier to analyze because of more detailed reporting and a more developed financial ecosystem. You may also find it easier to analyze a firm from your home country.
- Sector / industry: a utility company will be easier to forecast than a biotech one. This ultimately comes down to how you can model the company’s revenue and earnings: for Netflix, you can use number of subscribers X average subscription price, for Amundi you can use Asset under management X average management fee, but forecasting Société Générale’s earnings require you to have a much better understanding of the banking industry.
- Number of operating segments: some firms may hold different business units that will have to be analyzed separately, making them more time-consuming to understand and analyze.
We can summarize this choice under two axis: predictability and complexity.
- Predictability: can you reasonably make assumptions about this firm’s future revenue and profits, or is it too unpredictable to do so comfortably ?
- Complexity: can you easily understand and model how the company makes its money or will it take some time to do so ?
Choosing a Stock: Predictability and Complexity
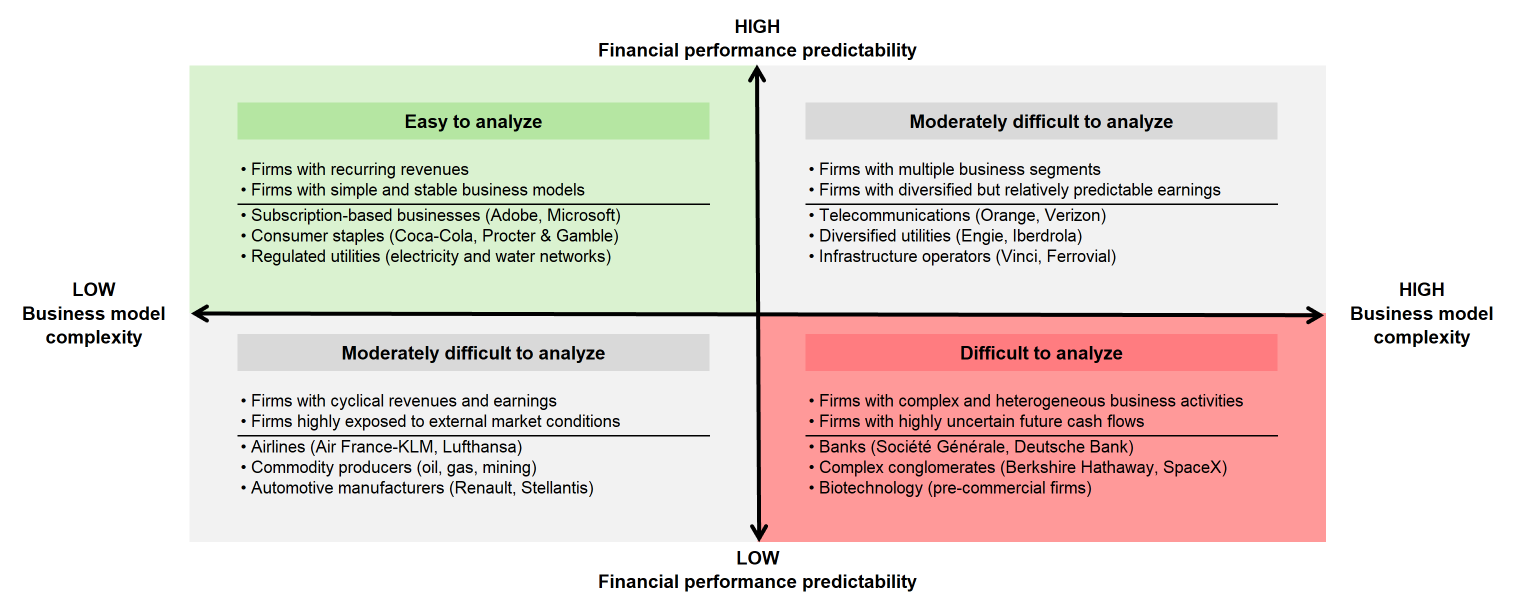
Firms that are predictable and not complex will be easier to analyze. Firms that are both complex and unpredictable will be much more difficult to deal with.
A stock pitch does not have to be a BUY recommendation but can also be a HOLD or a SELL. Therefore, simply pick a firm you want to work on and you’ll see in the end what your recommendation will be.
Structure of a Stock Pitch
Objective of this case study and roadmap
The goal of this guide is to provide a clear, step-by-step roadmap for building your first stock pitch.
Because you may come from different backgrounds and have more or less experience or expectations for this exercise, we outline what is strictly needed at a basics level for each section, along with how you can take your analysis further (advanced) to get closer to institutional equity research standards.
Step-by-Step Pitch Breakdown
Your pitch should cover the standard structure outlined below. The templates provided further in this article follow this order and structure, and you are welcome to follow it strictly, or feel free to change the order and add any additional section that you believe is relevant to your particular stock pitch.
For each section, start with Basic, and then look at Advanced to explore how to take it further depending on the depth of analysis you are targeting.
1 – Company Overview
- What is needed (Basics): Provide a simple overview of what the firm does. Is it a single business or do they have multiple operating segments? In which countries does it operate? What is the current share price, market capitalization, turnover, profits, dividends?
- How to take it further (Advanced): Provide a detailed overview of the firm, including but not limited to detailed key data, shareholder analysis, ESG analysis, and corporate governance structure.
2 – Industry Overview
- What is needed (Basics): What business does this firm operate in? Can you find a few key figures on this industry and how the markets believe it will evolve in the coming years? List a few competitors for your company.
- How to take it further (Advanced): Go deeper into the industry analysis by looking at research notes or papers. Try to find all relevant competitors and analyze market share dynamics, entry barriers, and structural shifts.
3 – Investment Thesis
- What is needed (Basics): Try to formulate in a few key sentences why you believe this stock is, by itself, a good buy or sell (or neutral) opportunity. What do you think makes this a good or a bad business?
- How to take it further (Advanced): In addition to the basic arguments, try to understand and explain why this company may be undervalued or overvalued by the market. Is there an irrational fear or something the market may be wrong about (or at least irrational)? Is there an assumption embedded in the current share price that may be wrong in your opinion? In other words, how could it be possible that you are right and that the current market price is not?
4 – Valuation
Historical Share Price Analysis
- What is needed (Basics): How has the stock evolved in the past 5 years? Can you identify specific events linked to sharp increases or drops in the share price? This is easily done by adding an image of the stock price that you can get from the internet.
- How to take it further (Advanced): Provide a graph of the historical share price versus the relevant index and key competitors, in a base 100 over a few years. Add a list of all relevant key events on the same graph. Build this graph yourself in Excel or using Python.
Discounted Cash Flow (DCF)
- What is needed (Basics): Build a simplified Discounted Cash Flow (DCF) model by forecasting the shareholders’ free cash flows and discounting them using the Weighted Average Cost of Capital (WACC). Estimate the terminal value using a perpetual growth model and explain the main assumptions underlying your valuation.
- How to take it further (Advanced): Develop a more detailed financial model based on the company’s fundamental operating drivers, integrating the income statement, balance sheet, and cash flow statement. Refine the WACC calculation, incorporate the bridge from enterprise value to equity value, and perform sensitivity and scenario analyses.
Comparable Company Analysis (CCA)
- What is needed (Basics): Gather data on the firm’s main competitors. Look at price-to-earnings (P/E) and analyze your company’s current ratio to try and understand if there is room for increase or decrease in this ratio. Once you have a target ratio, you can compute a target price relative to it too.
- How to take it further (Advanced): Multiple ratios (EV/EBITDA, P/E, EV/Sales, etc.), choose the most relevant ratios, much more thinking on what they mean, and add a confidence interval to this.
5 – Investment Recommendation
Valuation Summary
- What is needed (Basics): Summarize your DCF and comparable company valuation results in a single table. Include the current stock price and analysts’ consensus target price as additional reference points. Compare the different valuation estimates and explain their main differences. The current stock price should serve as a benchmark for assessing potential upside or downside, while analysts’ consensus provides an external perspective on valuation.
- How to take it further (Advanced): Present valuation ranges using a football field chart, incorporating sensitivity analyses and bear, base, and bull scenarios. Assess the reliability of each valuation method and identify the assumptions driving differences in estimated values. Compare your results with recent analysts’ estimates (e.g., from Bloomberg or FactSet) to understand how your valuation differs from market expectations.
Investment Recommendation
- What is needed (Basics): Determine and justify your own target price based primarily on your DCF and comparable company analyses. Specify an investment horizon (e.g., 12 months) and calculate the expected upside or downside relative to the current stock price. Formulate a clear investment recommendation (Buy, Hold, or Sell). You may use percentage thresholds around the current stock price (e.g., +/-5%) to guide your decision. Explain why your valuation supports your final recommendation.
- How to take it further (Advanced): Develop a weighted valuation approach, assigning explicit weights to the different valuation references according to their relevance and reliability. If you incorporate the current stock price or analysts’ consensus into your weighted target price, explain the economic rationale for doing so. Compare the recommendation implied by your valuation with your own investment judgment. Defend your final recommendation by considering the company’s fundamentals, investment thesis, valuation uncertainties, risks, and potential catalysts. Explain your variant view: why might your assessment differ from the market’s?
Trading Implementation
- What is needed (Basics): Translate your investment recommendation into a practical trading strategy. Specify your entry price, take-profit price, and stop-loss price. Ensure that these levels are consistent with the direction of your position (long or short) and explain how they were determined. Calculate the theoretical reward-to-risk ratio by comparing the potential gain with the potential loss. A ratio of at least 3:1 can serve as an illustrative objective, provided the selected price levels are economically justified.
- How to take it further (Advanced): Develop a more detailed trading and risk management strategy. Define your position size based on the portfolio’s risk limits, your maximum acceptable loss, and market liquidity (e.g., average daily trading volume). Identify the operational, financial, or macroeconomic catalysts that could trigger the expected price adjustment. Specify the conditions under which you would increase, reduce, hedge, or close your position. Consider transaction costs, financing costs, and stock-borrowing constraints where relevant.
Note on execution risk (slippage and market impact): Potential gains and losses are calculated using the specified take-profit and stop-loss levels. Actual execution prices may differ from these levels due to slippage and market impact, particularly during periods of high volatility, low market liquidity, or when trading large positions.
6 – Appendix
- What is needed (Basics): It’s a good habit to put your tables and calculations that are not already in your presentation inside of the appendix, in case you get asked any questions. You can also add graphs, maps, the company’s products, the countries it operates in …
- How to take it further (Advanced): Think about deep technical questions you could be asked during a Q&A session. Add captures of your dynamic Excel tables, debt schedules, sensitivity matrices, and detailed analyst opinion breakdowns.
Your stock pitch should present a coherent investment argument supported by financial data, quantitative analysis, and relevant charts or tables. All sources should be properly referenced, and all data has to be exact, up to date, and relevant.
Templates
To guide you through the process, we provide templates for both the excel file and the powerpoint presentation. You will find here one set of templates for the ‘Basic’ work and one for the ‘Advanced’ version.
Basic version
You can download below the PowerPoint file for the stock pitch.

You can download below the Excel file for the financial valuation of the company for a stock pitch (Discounted Cash Flow (DCF) and Comparable Company Analysis (CCA)).

Advanced version
Not available yet
Examples
Here are examples of what a pitch could look like:
About the use of AI for investment analysis
I would strongly advise you to avoid using AI for this work. Three key reasons why:
- Artificial intelligence (AI) tools can help you understand financial concepts, retrieve and organize information, write code, and improve the presentation of your analysis. However, they should not replace your own financial reasoning and investment judgment.
- AI-generated financial data, calculations, and interpretations may contain errors or rely on outdated information. You should therefore verify all figures against reliable sources, understand the assumptions underlying your valuation, and critically assess the conclusions.
- The objective of this case study is not simply to produce a stock pitch, but to develop your ability to analyze a company, estimate its value, and defend an investment recommendation. You remain responsible for the accuracy, originality, and quality of your work, but what really matters is the path you took, not the final outcome.
Feel free, however, to ask AI for advice, explanations on financial concepts, rewriting some text, or fixing mistakes.
Related financial concepts
- Fundamental analysis
- Market efficiency and a variant view
- Discounted Cash Flow (DCF)
- Comparable Company Analysis (CCA)
Why should you be interested in this post?
Whether you are preparing for interviews in Equity Research, Asset Management, Private Equity, or Corporate Finance, mastering a stock pitch moves you from passive theoretical learning to active investment decision-making.
By engaging with this case study, you will bridge the gap between financial statements and practical business valuation, practice finding market inefficiencies, and build hands-on skills in financial modeling and presentation.
Related posts on the SimTrade blog
▶ Hadrien PUCHE Price is what you pay, value is what you get – Warren Buffett
▶ Roberto RESTELLI The role of DCF in valuation
▶ Jorge KARAM DIB Multiples valuation method for stocks
How to download financial data using either Python or R :
▶ Hadrien PUCHE How to download financial data with Python
▶ Hadrien PUCHE How to download financial data with R
Useful resources
Books
Graham, B. (2003). The Intelligent Investor: The Definitive Book on Value Investing. Revised edition, with commentary by J. Zweig. HarperBusiness Essentials.
Damodaran, A. (2012). Investment Valuation: Tools and Techniques for Determining the Value of Any Asset. 3rd edition. Wiley.
Rosenbaum, J., and J. Pearl (2022). Investment Banking: Valuation, LBOs, M&A, and IPOs. 3rd edition. Wiley.
Pedersen, L. H. (2015). Efficiently Inefficient: How Smart Money Invests and Market Prices Are Determined. Princeton University Press.
Damodaran Online (NYU Stern valuation resources)
SimTrade courses
About the Author
This article was written in September 2026 by Hadrien PUCHE (ESSEC Business School, Grande École Program, Master in Management, 2023-2027).
▶ Discover all posts by Hadrien PUCHE
