Trump Trade

In this article, Marine SELLI (ESSEC Business School, Global Bachelor in Business Administration (GBBA), 2020-2024) examines the phenomenon of “Trump Trades” and their enduring impact on financial markets.
What Is the Trump Trade?
Have you ever wondered how politics shapes financial markets?
The “Trump Trade” highlights this intersection as it captures how market movements are influenced by the policies of Donald Trump. This phenomenon was first observed after his surprise 2016 election victory, and then resurfaced in 2024 with Trump’s re-election.
The Trump Trade is the financial strategies and market movements based on expectations of Trump’s economic policies enactments. It is about how markets understand and view them. Investors react to these policies such as anticipated tax cuts, deregulation, trade measures, and infrastructure projects which leads to significant market shifts.
In 2016 when Trump’s election came out of the blue and the market rallied, all major U.S. indices, including the S&P 500, Dow Jones Industrial Average and Russell 2000, hit record highs. Then, fast forward to 2024 and the story repeated itself. In the month of the election, November 2024, the Dow Jones shot to an all-time high of 44,910.65 and the S&P 500 broke 6,000 points for the first time.
In this phenomenon, it is observed how investor behavior follows the perception of Trump’s policy as pro-business.
What is it about Trump’s presidency that drives these significant market reactions?
Trump has a real estate magnate background therefore he positions himself as a supporter of loose monetary policy: as a developer, he used to rely mainly on cheap credit to finance his projects, benefit from asset appreciation and leverage investments.
His economic philosophy was shaped by his background and that is still reflected in his policies and statements. If implemented, Trump’s policies would prioritize growth, borrowing, and investment, the core of the Trump Trade phenomenon. In fact, Trump’s policies are largely articulated in terms of tax cuts, deregulation, tariffs and infrastructure spending, which are for investors, opportunities of growth.
Two Elections: 2016 vs. 2024
When comparing the Trump Trade in 2016 and 2024. What remained the same and what changed? Trump’s surprise win in 2016 sent shockwaves through the financial world. He was able to get investors to change their portfolios based on his policies. Small cap stocks led the way, outperforming large caps by nearly 8 percent, as they are more reliant on domestic growth, and equity markets surged. The yield on the 10-year Treasury also shot up by almost 100 basis points. It was a steepening yield curve, reflecting optimism over growth but concern about higher borrowing costs and inflation.
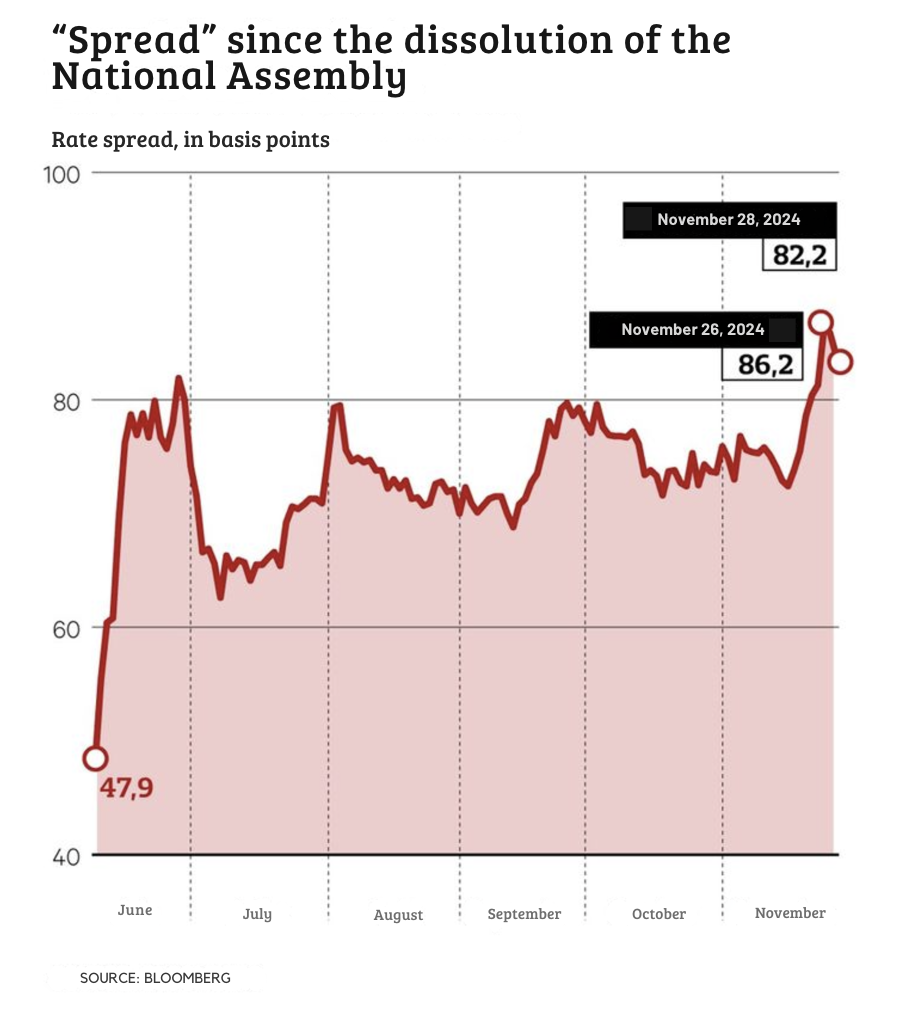
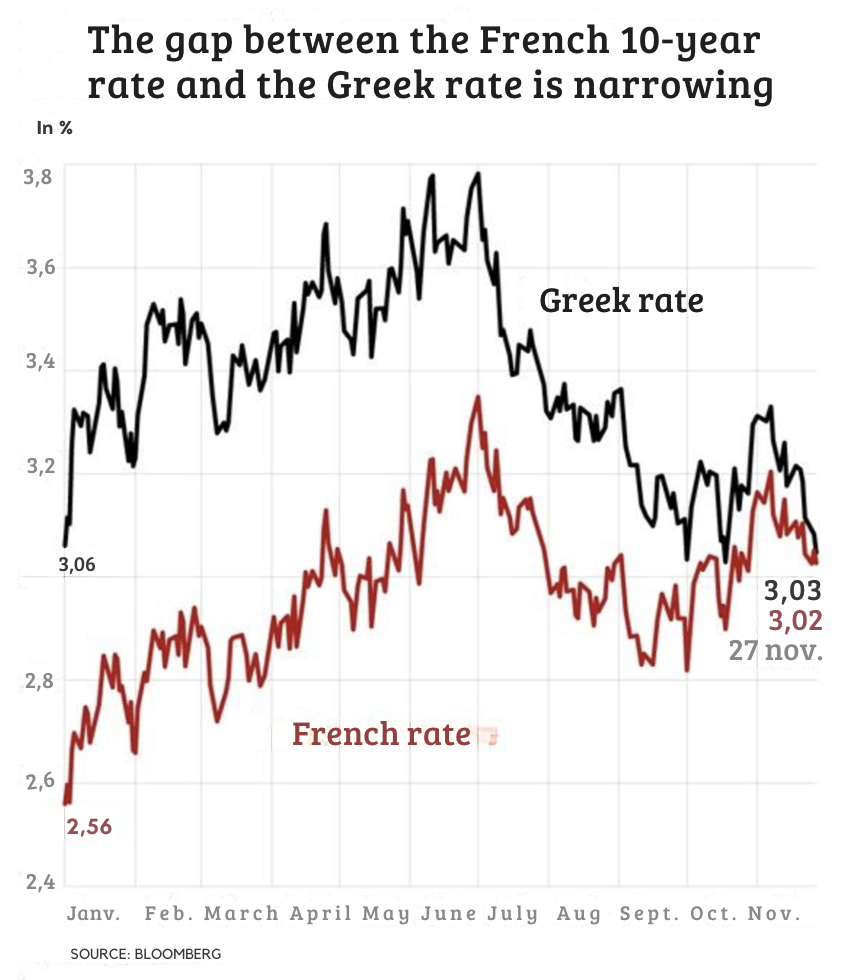
Trump’s reelection by 2024 was less surprising, but markets still reacted heavily. Shortly after his victory, the Dow Jones climbed 200 points and small cap stocks again outperformed as investors favored companies less exposed to global trade risks. Additionally, the bond market behaved in line with 2016 trends by long term yields rising faster than short term yields, a sign of inflation expectations.
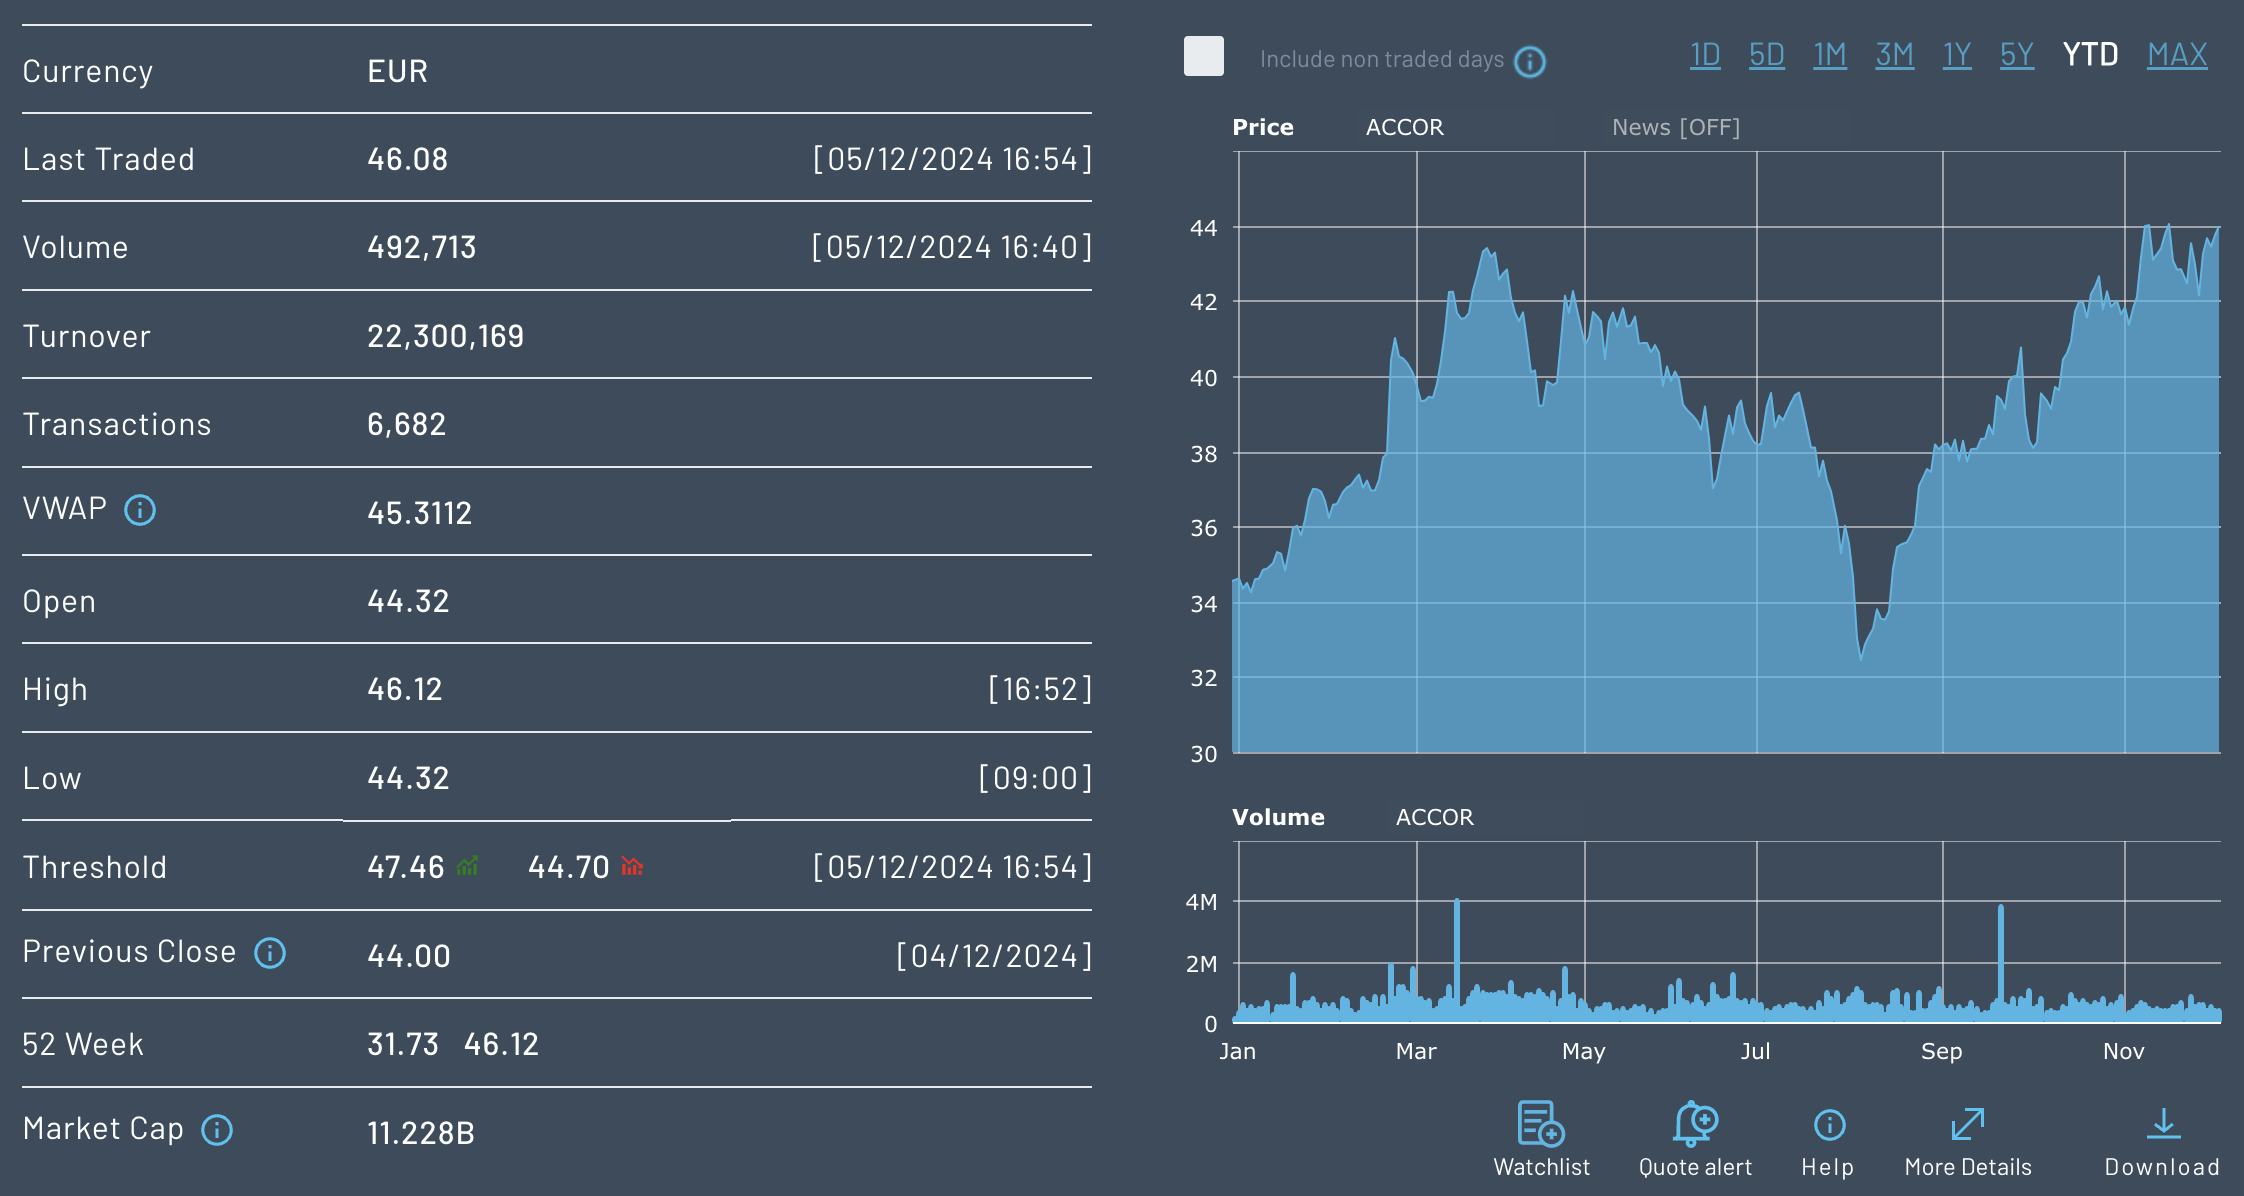
Financial Market Movements during Trump Re-election
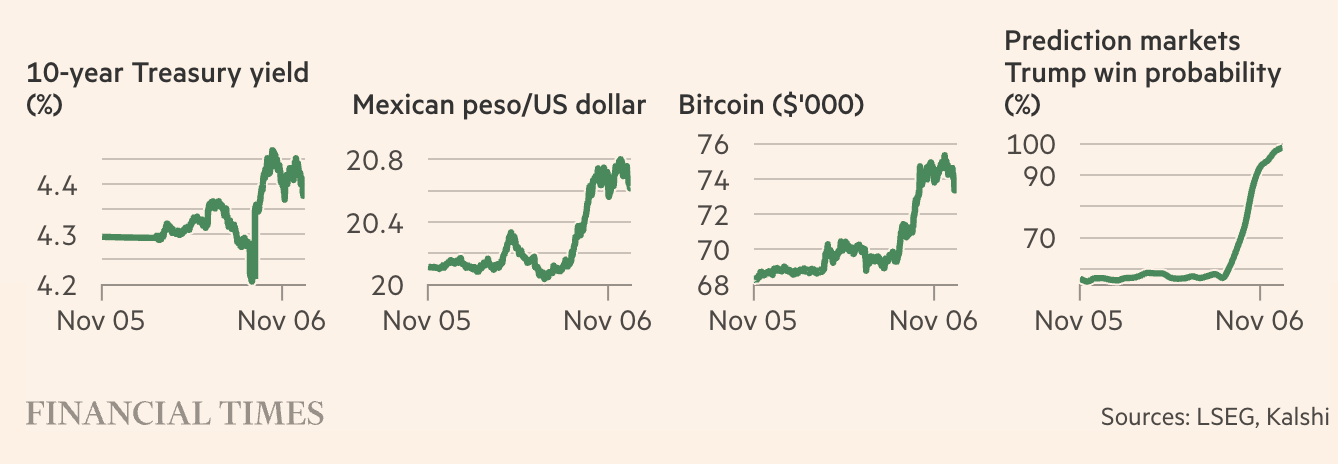
Source: Bloomberg, Les Echos
Trump viewed as an inflationist?
Why do markets think Trump equals inflation? The answer to his policies and economic philosophy. Of course, Trump’s way of doing fiscal expansion through unfunded tax cuts and big spending naturally triggers inflation expectations. Higher disposable income from lower taxes creates demand and raises prices. At the same time, businesses that import goods are burdened by higher costs, which are often passed on to consumers due to protectionist measures that Trump wants to accentuate.
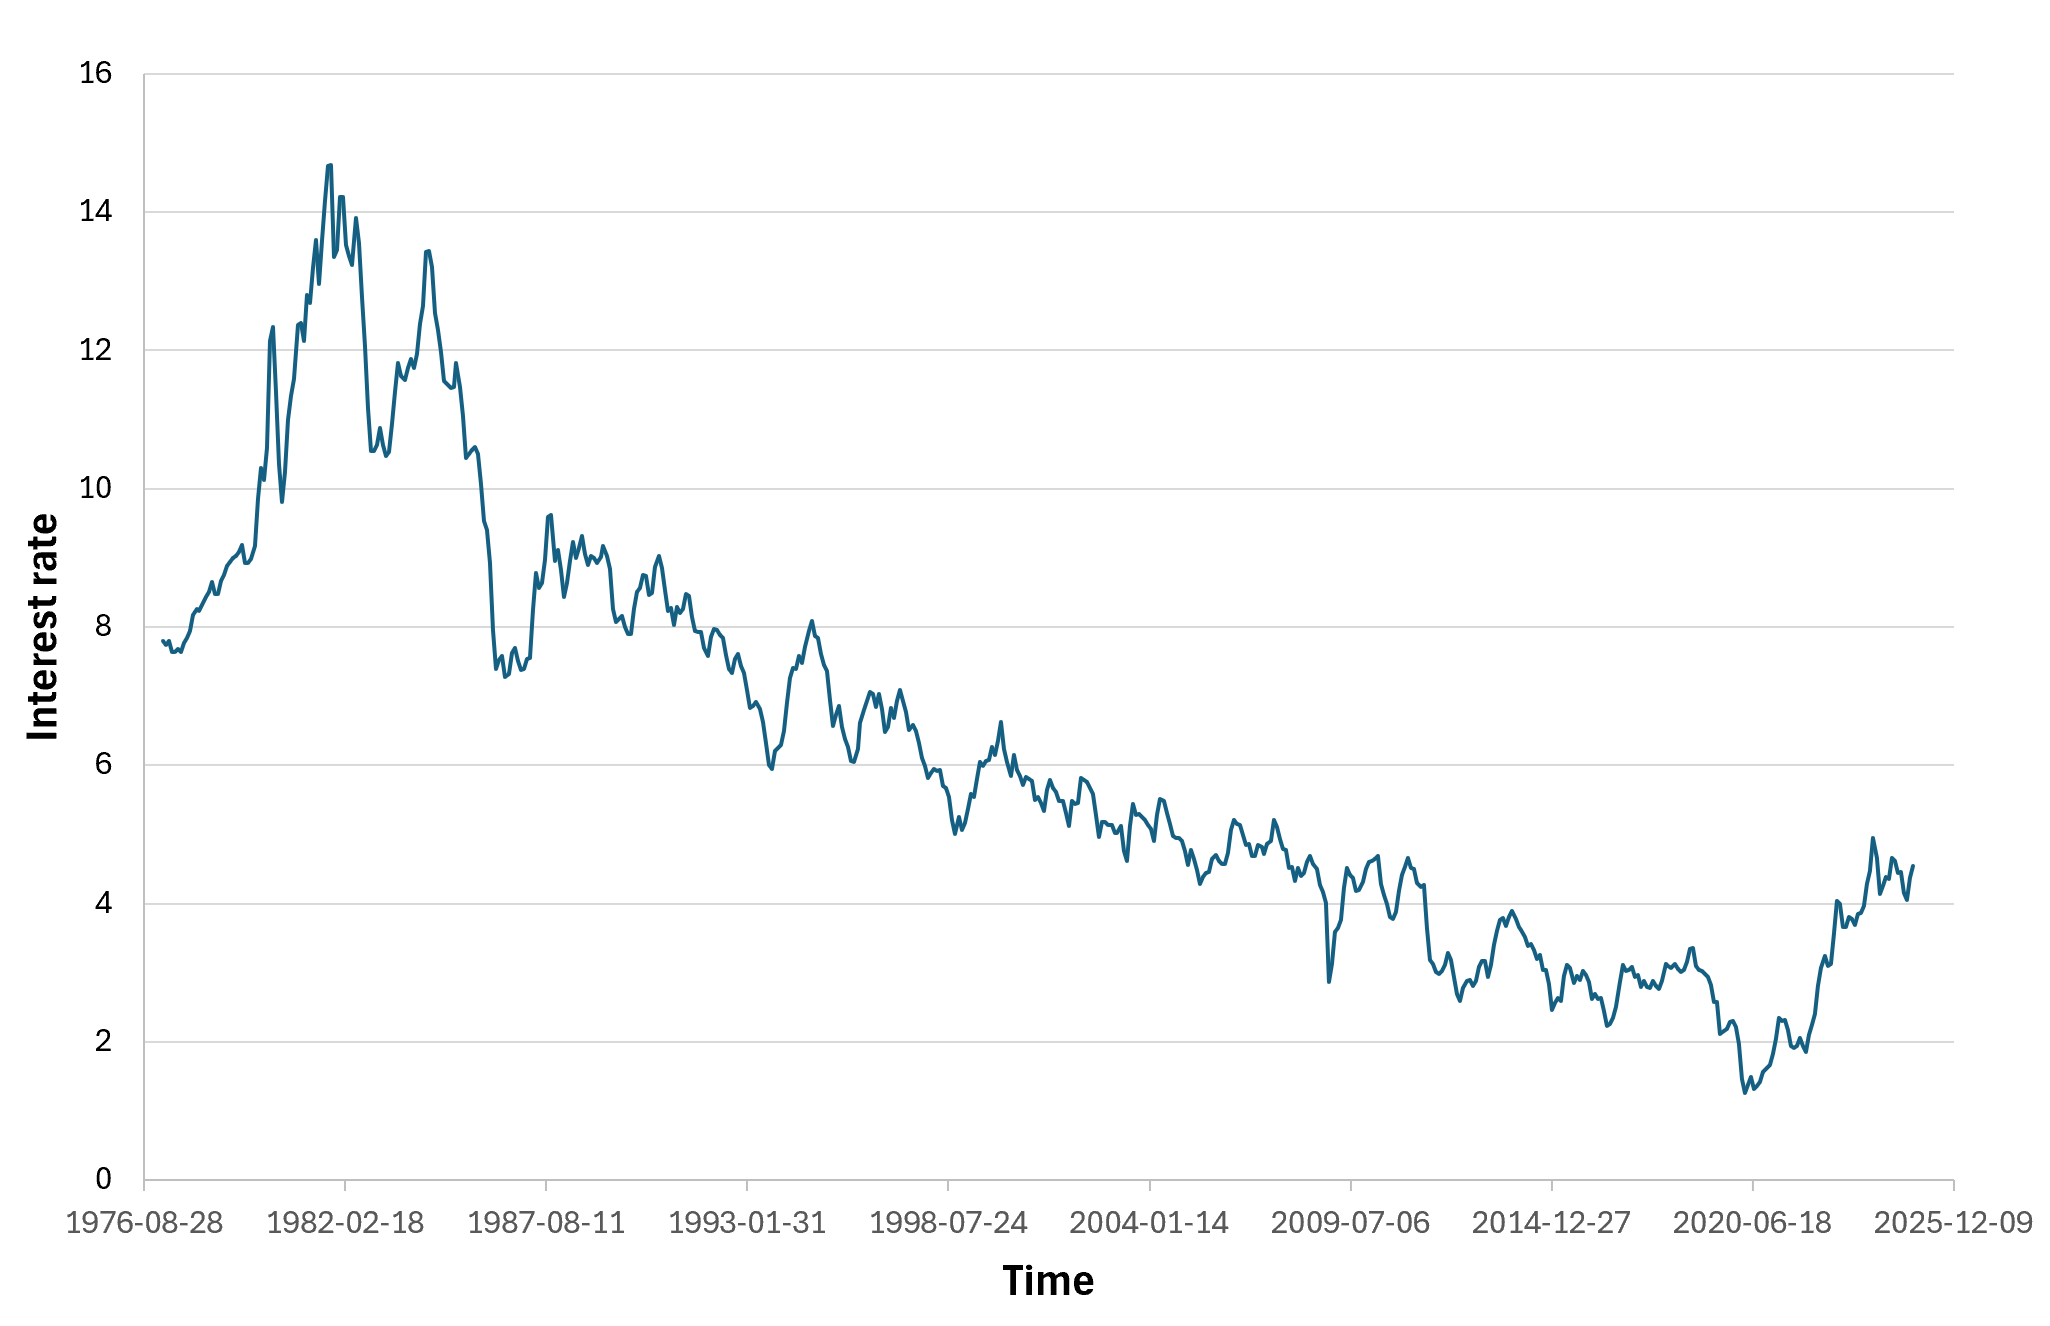
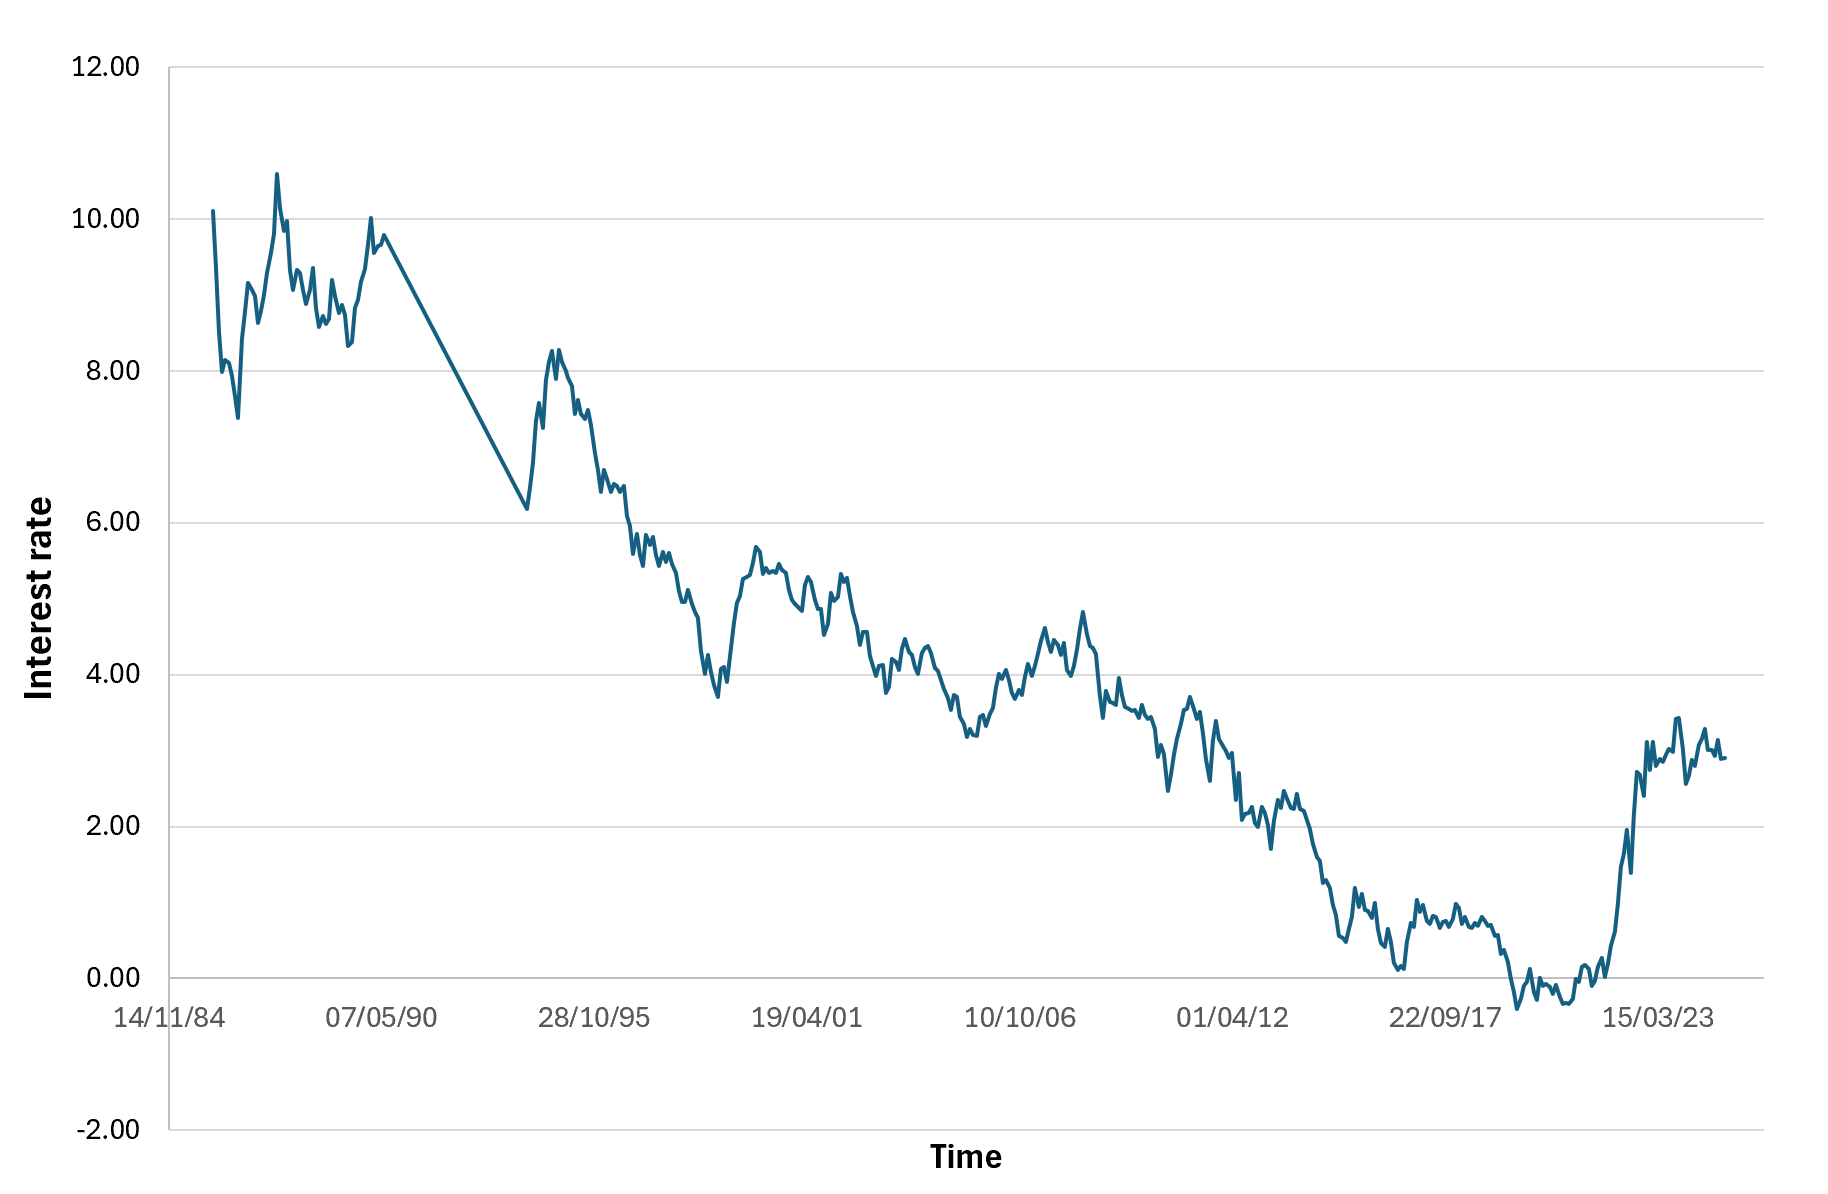
These dynamics are reflected in bond markets. Inflation eats away at the purchasing power of fixed payments, so investors require higher yields on long term bonds. The dynamic steepens the yield curve, whereby long-term rates rise faster than short term rates. In 2016 and then again in 2024, this pattern characterized the Trump Trade and proved that markets still see Trump as an inflationist.
In addition, as I mentioned earlier, Trump’s economic strategy is influenced by his background in real estate. He has always been someone that has leveraged debt to grow and has always pushed for lower interest rates and expansive fiscal policies.
The Forces Driving the Trump Trade
Trump’s policies and economic agenda have included his tax reforms. The 2017 Tax Cuts and Jobs Act cut the corporate tax rate from 35% down to 21%, which had a massive impact on corporate earnings and stock valuations. The same optimism is building in technology and consumer sectors that would be the biggest beneficiaries of these measures for 2024, when there is a possibility of further tax incentives.
Another key driver is deregulation, as during Trump’s first term rollbacks on things like environmental protections, financial regulations and healthcare compliance lowered costs for businesses and raised profitability in sectors like energy and banking. While these expectations have reappeared yet again in 2024, the increased focus on ESG investing has made things more difficult, with some investors eschewing industries deemed environmentally unfriendly.
Furthermore, a boost to infrastructure spending also fuels optimism, as Trump’s pledge of massive energy infrastructure investments such as in energy pipelines for example, has raised market hopes for the industrial sectors. In the weeks following Trump’s 2016 victory, the energy sector outperformed the broader market by over 10%, and similar gains were seen in 2024 as infrastructure-related stocks went up on hopes of renewed public investment.
In conclusion, the Trump Trade exemplifies how market perceptions, often driven by political rhetoric rather than enacted policies, can shape financial dynamics. While Trump’s agenda captures market optimism, much of it may rest on speculative assumptions and short-term gains, masking the underlying risks and long-term challenges. The sustainability of this optimism is contingent on consistent execution, realistic fiscal discipline, and the ability to address structural issues beyond mere rhetoric. Without these, the Trump Trade could unravel as a fleeting market illusion.
Why should I be interested in this post?
Understanding the Trump Trade demonstrates how political decisions, and macroeconomic policies can move financial markets. The analysis links the theoretical principles you study such as market behavior, and corporate strategy to their real-world application. The Trump Trade is a practical example of how politics, economics, and finance play off each other, no matter whether your aspiration is to work in investment banking, asset management, or corporate strategy. It goes beyond academic learning as a basis to think critically about future political and economic shifts that might influence global markets.
Related posts on the SimTrade blog
▶ Nitisha CHALLA The S&P 500 index
▶ Nitisha CHALLA Financial Indexes
▶ Martin VAN DER BORGHT Market Efficiency
Useful resources
JPMorgan Private Bank Is the Trump Trade a Good Deal?
Goldman Sachs on Trump’s Economic Policies
LSE Economic Impacts of the Trump Tariff Proposals on Europe
Financial Times Trump’s Tariff Policies Analysis
Financial Times Market Reactions to Trump’s Economic Decisions
Financial Times Global Trade in the Trump Era
Deutsche Bank Flow: Trump Trade – Back to the Future
Synapses (YouTube channel) Business Insights
About the author
The article was written in December 2024 by Marine SELLI (ESSEC Business School, Global Bachelor in Business Administration (GBBA), 2020-2024).