

In this article, Shengyu ZHENG (ESSEC Business School, Grande Ecole Program – Master in Management, 2020-2024) explains the different methods used to select the threshold for the tails for the peak-over-threshold (POT) approach of extreme value theory (EVT).
The Peak-over-Threshold threshold approach
As we have seen in the previous post, Extreme Value Theory: the Block-Maxima approach and the Peak-Over-Threshold approach, there are two main paradigms to model the extreme behavior of a random variable (say asset returns in finance).
Amongst the two, the POT approach makes use of all data entries above a designated high threshold u. The threshold exceedances could be fitted into a generalized Pareto distribution (GPD):
Threshold selection
Along with the POT approach arises the issue of threshold selection to define when the tail of the distribution starts. Estimating parameters for extreme value distributions becomes more stable when based on exceedances beyond an appropriate threshold. In the tail, the distribution may behave more consistently, leading to more reliable parameter estimates. This stability is crucial for making accurate predictions about extreme events.
An efficient method for the computation of an optimal threshold optimizes the trade-off between bias and inefficiency (Jansen and de Vries, 1991). As explained by Gkillas, Katsiampa, and Longin (2021): “on the one hand, a low threshold value induces an estimation bias, due to observations not belonging to the distribution tails considered as exceedances. On the other hand, a high threshold value leads to inefficient estimates with high standard errors, due to the reduced size of the estimation sample”.
Methods of optimal threshold selection
There are several methods to this issue. We explain in detail the methods based on the plot analysis and Monte Carlo simulations. We also briefly discuss other methods: bootstrapping techniques, bias reduction, etc.
Plot analysis
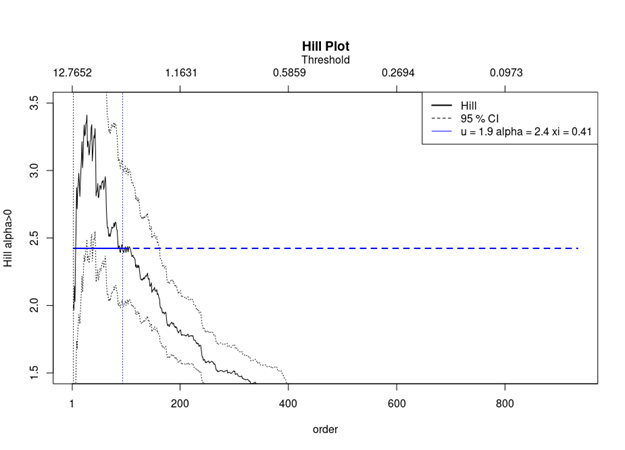
The most known plot for deriving the optimal threshold is the Hill plot.
The Hill estimator is commonly used to estimate the tail index of a generalised Pareto distribution and to estimate the optimal threshold. The tail index is a measure of the heaviness of the tails of a distribution. According to the statistical order X_(1:n), the Hill estimator for the tail index α=1/ξ is given by

with k being the highest statistical order.
The Hill plot is a graphical representation of the Hill estimators. In a Hill plot, the sample data is sorted in descending order, and the plot shows the logarithm of the sample quantiles against their corresponding order statistics. The slope of the line in the plot provides information about the tail behaviour of the distribution. What we are looking for here is the point from where the plot starts to stabilise.
Here we have an example of a Hill Plot of the logarithmic losses of the S&P 500 index.
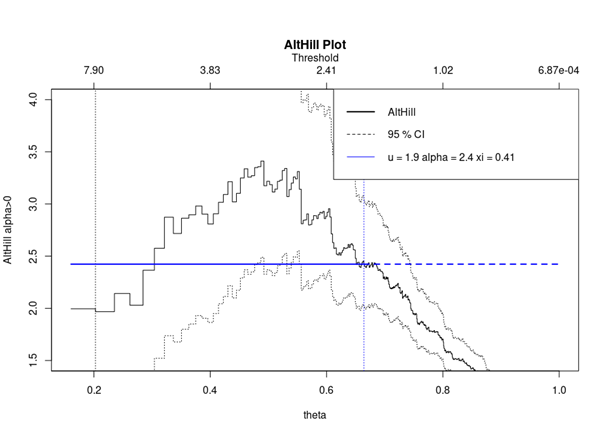
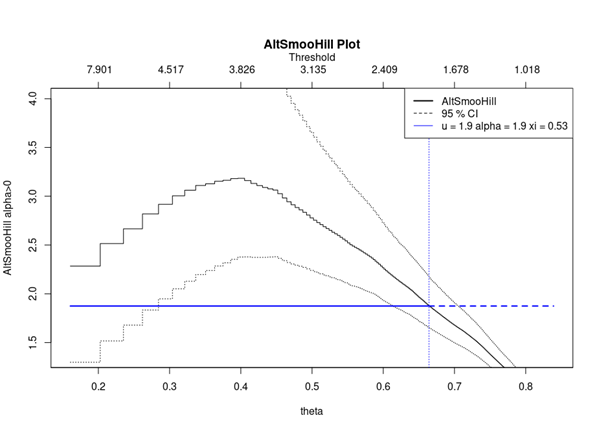
There exist alternative plots based on the standard Hill plot, such as Alternative Hill plot, smoothed Hill plot. These two alternatives are available in the evmix R package.
Monte Carlo simulations
Jansen and de Vries (1991) proposed a Monte Carlo simulation method as follows. Imagine we would like to study the behaviour of a random variable at its extreme. First a family of specific models for this random variable is assumed (say the family of Student-t distributions). Based on the assumption of a specific distribution, Monte Carlo simulations are launched. For each simulation, the optimal number of return exceedances is computed, and this corresponds to the optimal threshold. The mean squared error (MSE) of simulated optimal numbers of return exceedances is then calculated. With this result, we can derive the optimal threshold for the observed series. As Theil (1971) explains, the MSE criterion takes into account of a double effect of bias and inefficiency. The MSE of S simulated observations of the estimator of a parameter X could be represented as:

Where X̄ represents the mean of S simulated observations. The first part on the right of the equation represents the bias, and the second part represents the inefficiency.
Other methods
There are many other methods based on various mechanisms, such as bootstrap and bias reduction. The tea package in R has in place multiple methods for estimating optimal thresholds from a series of scholars. In the R file that can be downloaded below, we can find various examples. For instance, the “danielsson” function from the package is based on a double bootstrap procedure for choosing the optimal sample fraction. (Danielsson et al., 2001). The “DK” function is a Bias-based procedure for choosing the optimal threshold. (Drees & Kaufmann, 1998)
Download R file to model extreme behavior of the index
You can find below an R file to calculate optimal threshold for the POT approach.

Related posts about extreme value theory
▶ Shengyu ZHENG Extreme Value Theory: the Block-Maxima approach and the Peak-Over-Threshold approach
▶ Gabriel FILJA Application de la théorie des valeurs extrêmes en finance de marchés
Useful resources
Academic resources
Danielsson, J. and Haan, L. and Peng, L. and Vries, C.G. (2001). Using a bootstrap method to choose the sample fraction in tail index estimation. Journal of Multivariate analysis, 2, 226-248.
Drees H. and E. Kaufmann (1998) Selecting the optimal sample fraction in univariate extreme value estimation. Stochastic Processes and their Applications, 75(2), 149–172.
Embrechts P., C. Klüppelberg and T. Mikosch (1997) Modelling Extremal Events for Insurance and Finance.
Embrechts P., R. Frey and A.J. McNeil (2022) Quantitative Risk Management, Princeton University Press.
Gumbel, E. J. (1958) Statistics of extremes New York: Columbia University Press.
Jansen D. and C. de Vries (1991) On the Frequency of Large Stock Returns: Putting Booms and Busts into Perspective, The Review of Economics and Statistics, 73, 18-24.
Longin F. (2016) Extreme events in finance: a handbook of extreme value theory and its applications Wiley Editions.
Longin F. and B. Solnik (2001) Extreme Correlation of International Equity Markets, The Journal of Finance, 56, 649-676.
Other resources
Rieder H. E. (2014) Extreme Value Theory: A primer (slides).
About the author
The article was written in December 2023 by Shengyu ZHENG (ESSEC Business School, Grande Ecole Program – Master in Management, 2020-2024).
2 thoughts on “Optimal threshold selection for the peak-over-threshold approach of extreme value theory”
Comments are closed.