

In this article, Raphael TRAEN (ESSEC Business School, Global BBA, 2023-2024) delves into the fascinating world of correlation and its profound impact on diversification strategies in the financial realm. Understanding correlation is crucial for crafting well-diversified investment portfolios that can effectively mitigate risk and enhance overall performance (the famous trade-off between risk and expected return).
Statistical correlation
Definition
Statistical correlation is a quantitative measure of the strength and direction of the linear relationship between two variables. It describes how two variables are related to each other and how one variable changes in response to the other (but remember that correlation is not causality!).
Mathematically (or more precisely statistically), correlation is defined by the following formula:
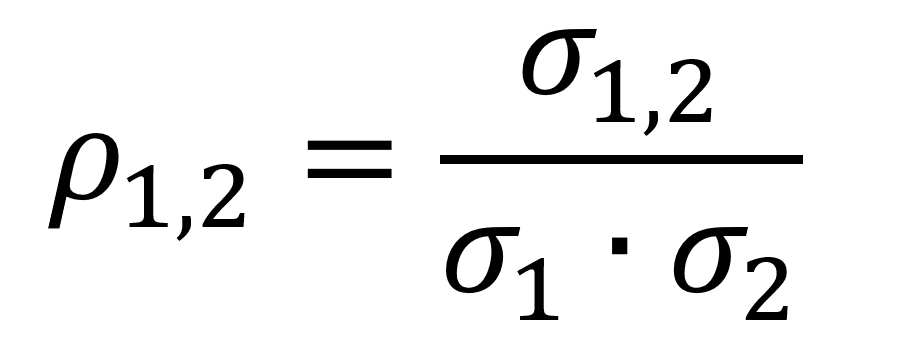
where ρ1,2 is the correlation coefficient between the two random variables (say X1 and X2), 𝜎1,2 the covariance between the two random variables, and 𝜎1 and 𝜎2 are the standard deviation of each random variable.
Correlation is measured on a scale from -1 to +1, with -1 representing a perfect negative correlation, +1 representing a perfect positive correlation, and 0 representing no correlation.
Correlation vs Independence
Correlation and independence are two statistical measures that describe the relationship between two variables. As already mentioned, correlation quantifies the strength and direction of the relationship, ranging from perfect negative (one variable decreases as the other increases) to perfect positive (both variables increase or decrease together). Independence on the other hand indicates the absence of any consistent relationship between the variables.
If two random variables are independent, their correlation is equal to zero. But if the correlation between two random variables is equal to zero, it does not necessarily mean that they are independent. This can be illustrated with an example. Let us consider two random variables, X and Y, defined as follows: X is a random variable that takes discrete values from the set {-1, 0, 1} with equal probability (1/3) and Y is defined as Y = X2.
E(X) = 0, as the expected value of X is (1 + 0 + (-1))/3 = 0
E(Y) = E(X2) = (12 + 02 + (-1)2)/3 = 2/3
E(XY) = (-1 * 1 + 0 * 0 + 1 * 1)/3 = 0
Cov(X, Y) = E(XY) – E(X)E(Y) = 0 – 0 * (2/3) = 0
As Corr(X, Y) is equal to Cov(X, Y) / (sqrt(Var(X)) * sqrt(Var(Y))), we find that Corr(X, Y) = 0.
Application in finance
We now consider a financial application : the construction of portfolios. We show that correlation is a key input when building portfolios.
If the concept of portfolios is completely new to you, I recommend first reading through the article by Youssef LOURAOUI about Portfolio.
Portfolio with two assets
In the world of investments, understanding the expected return and variance of a portfolio is crucial for informed decision-making. These two statistical measures provide valuable insights into the potential performance and risk of a collection of assets held together. In what follows, we first focus on a portfolio consisting of two assets.
Return and expected return of a portfolio
The return of a two-asset portfolio P is computed as
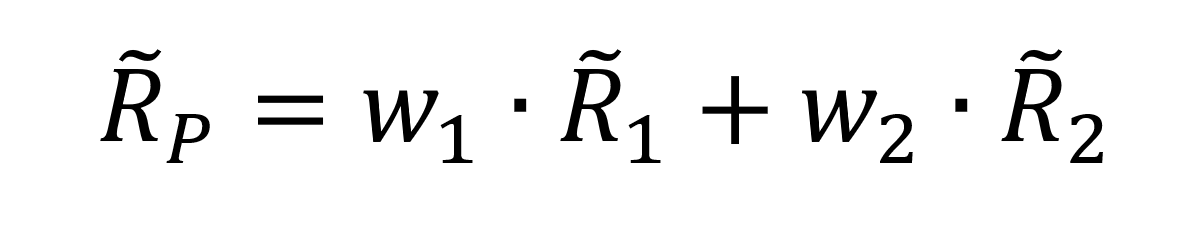
where w1 and w2 are the weights of the two assets in the portfolio and R1 and R2 are the returns of the two assets.
The expected return of the two-asset portfolio P is computed as

where w1 and w2 are the weights of the two assets in the portfolio and μ1 and μ2 are the expected returns of the two assets.
Risk of a portfolio
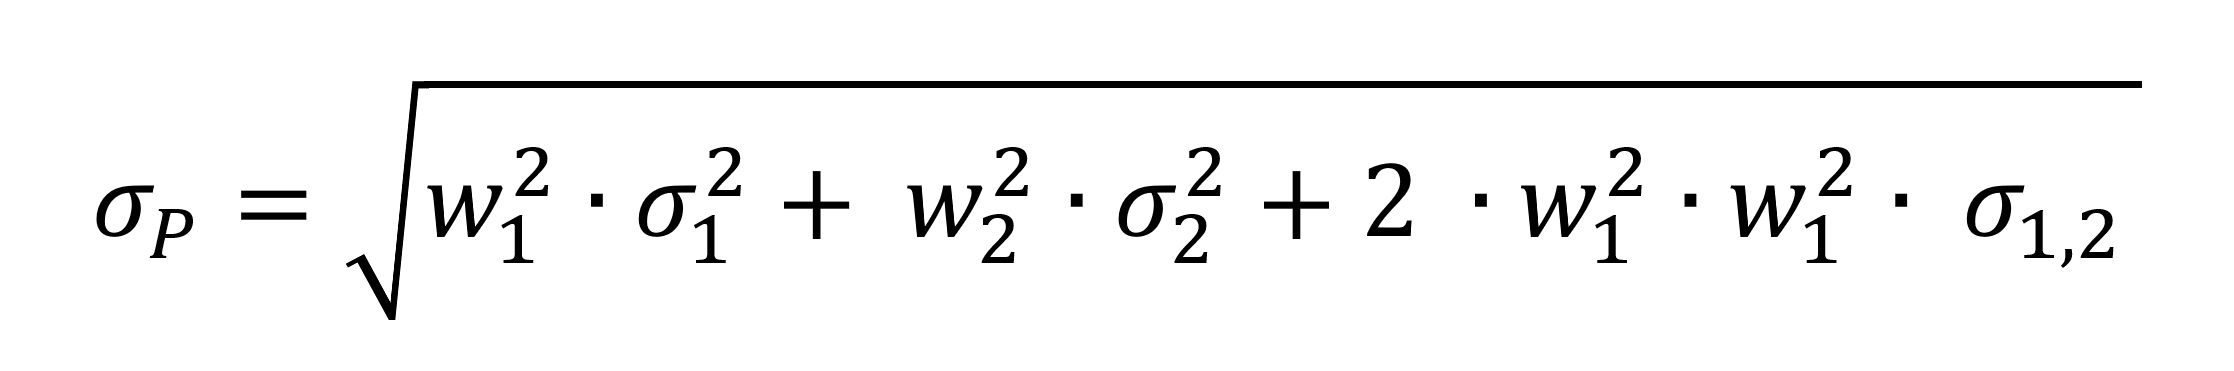
The standard deviation (squared root of the variance) of a two-asset portfolio is computed as
or
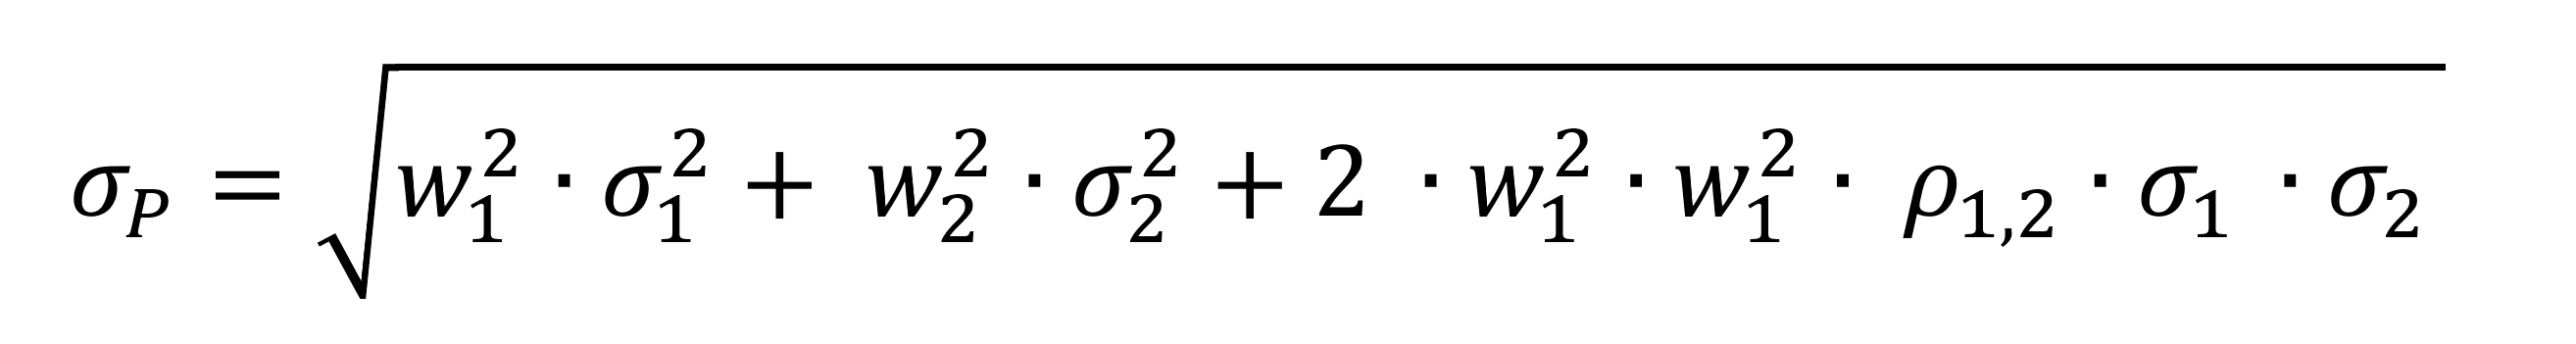
where w1 and w2 are the weights of the two assets in the portfolio, 𝜎1 and 𝜎2 are the standard deviations of the returns of the two assets, and 𝜎1,2 and ρ1,2 are the covariance and correlation coefficient between the two assets returns.
The first expression uses the covariance 𝜎1,2 and the second expression the correlation ρ1,2.
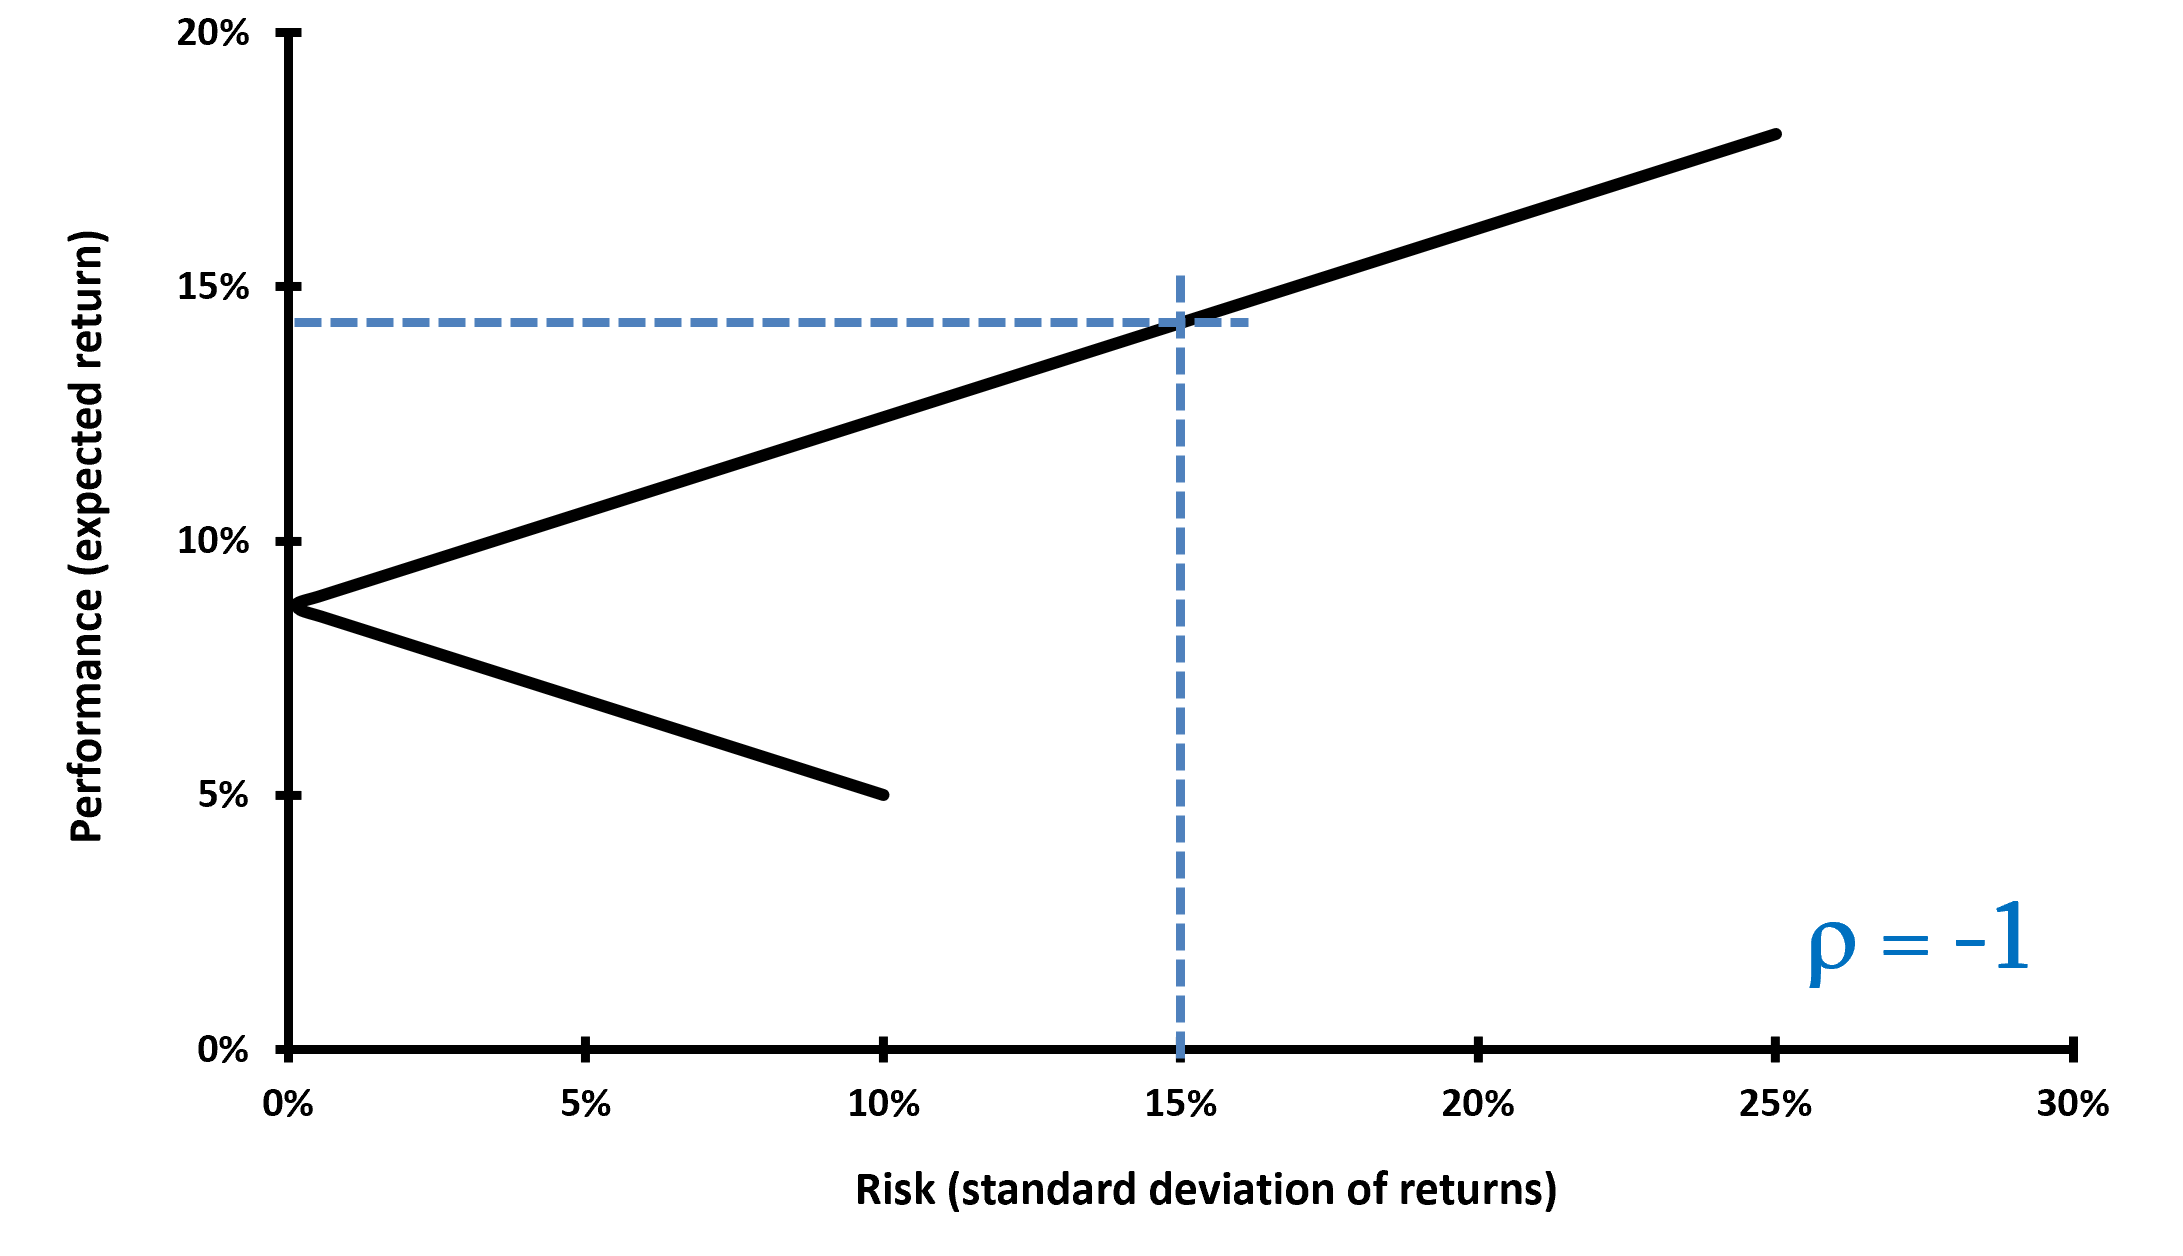
Impact of correlation on diversification (the case of two assets)
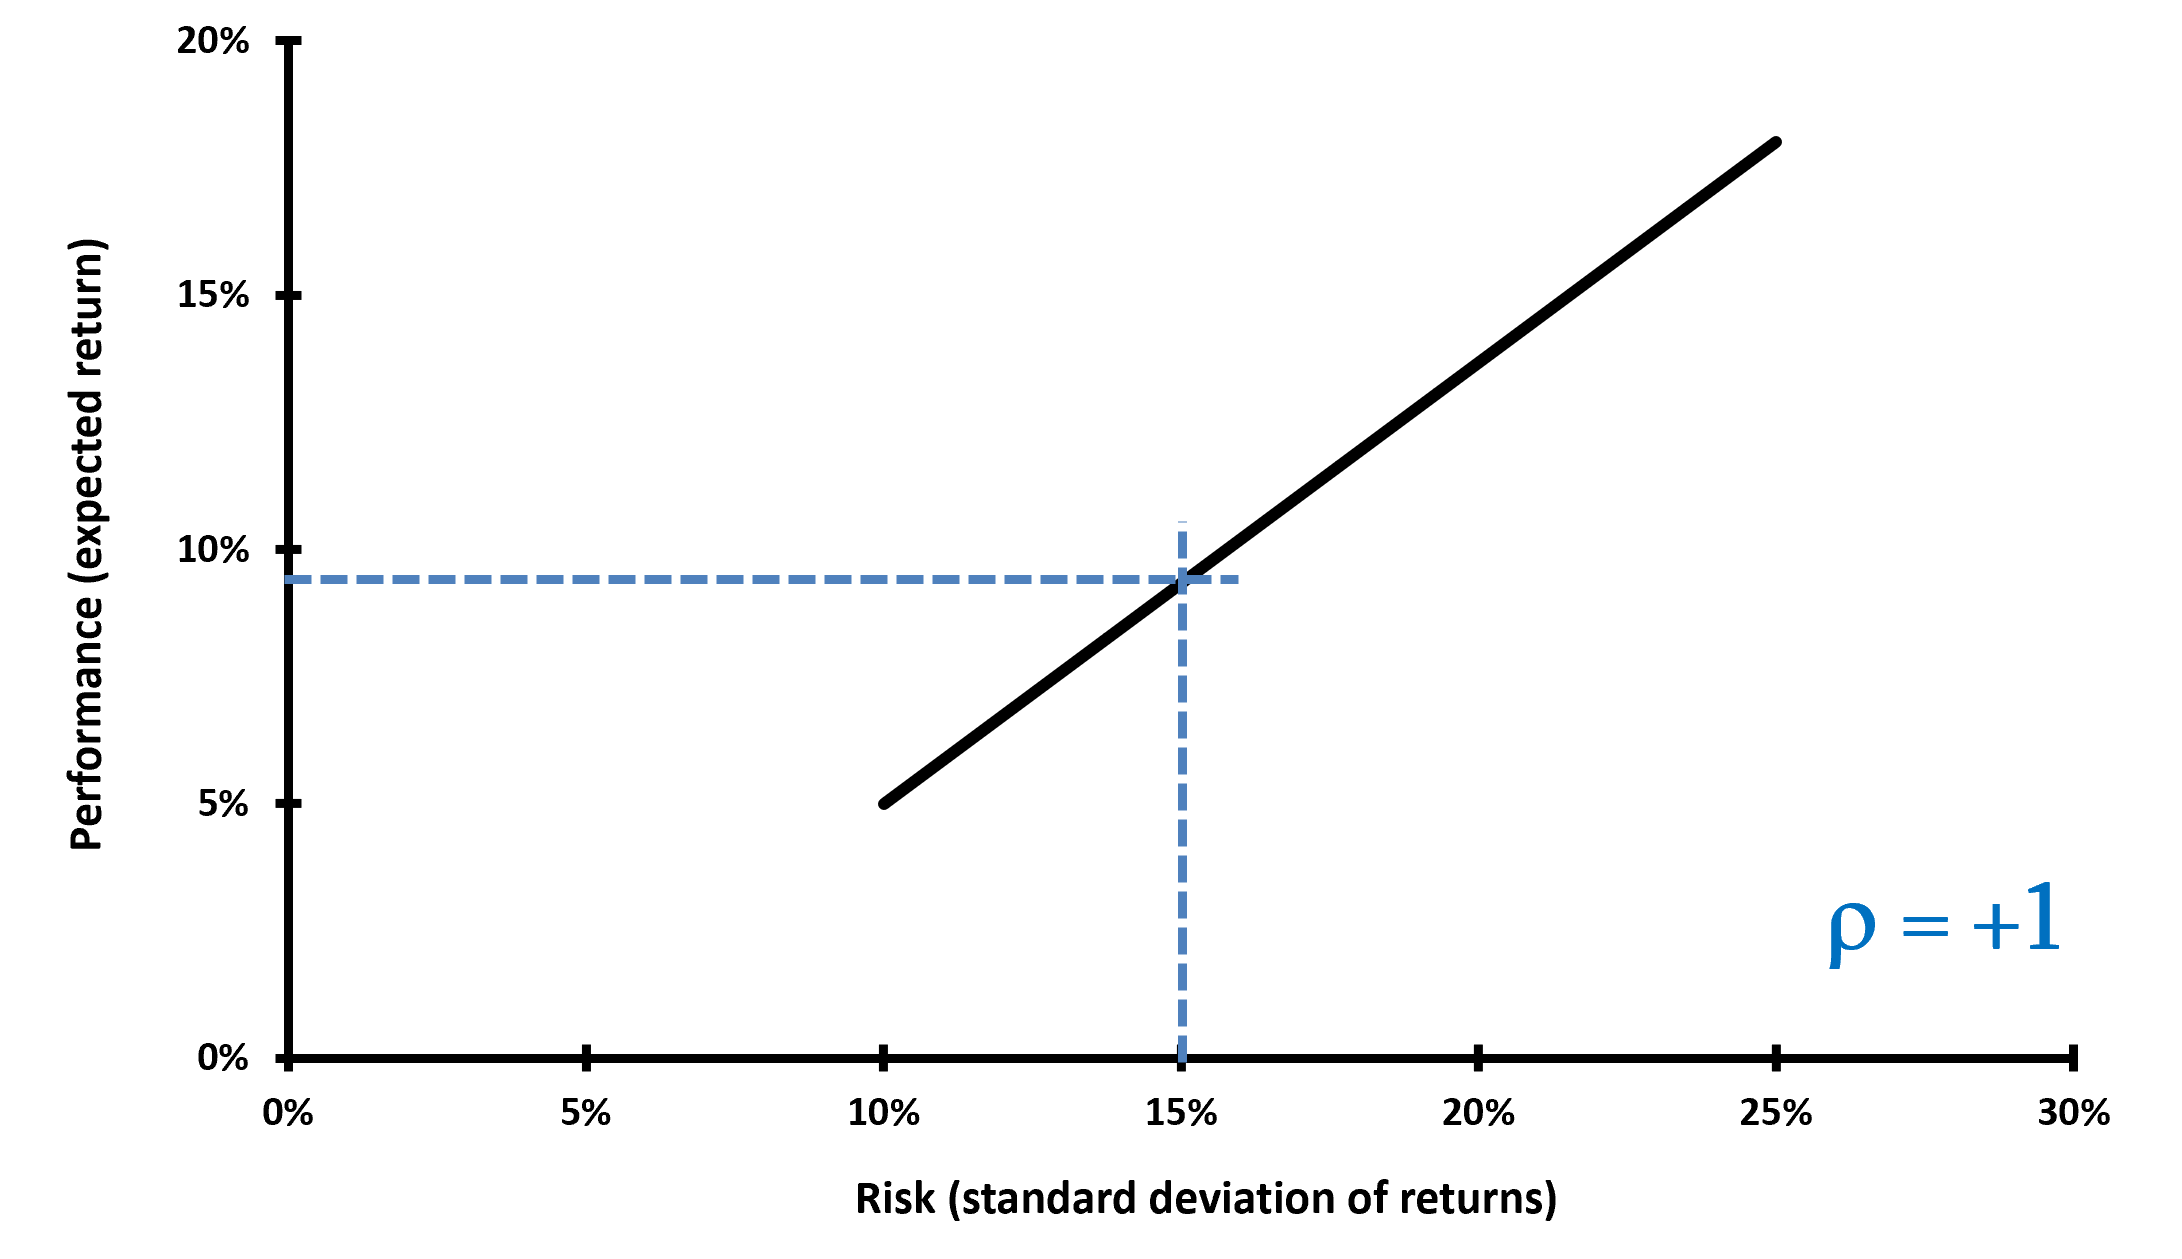
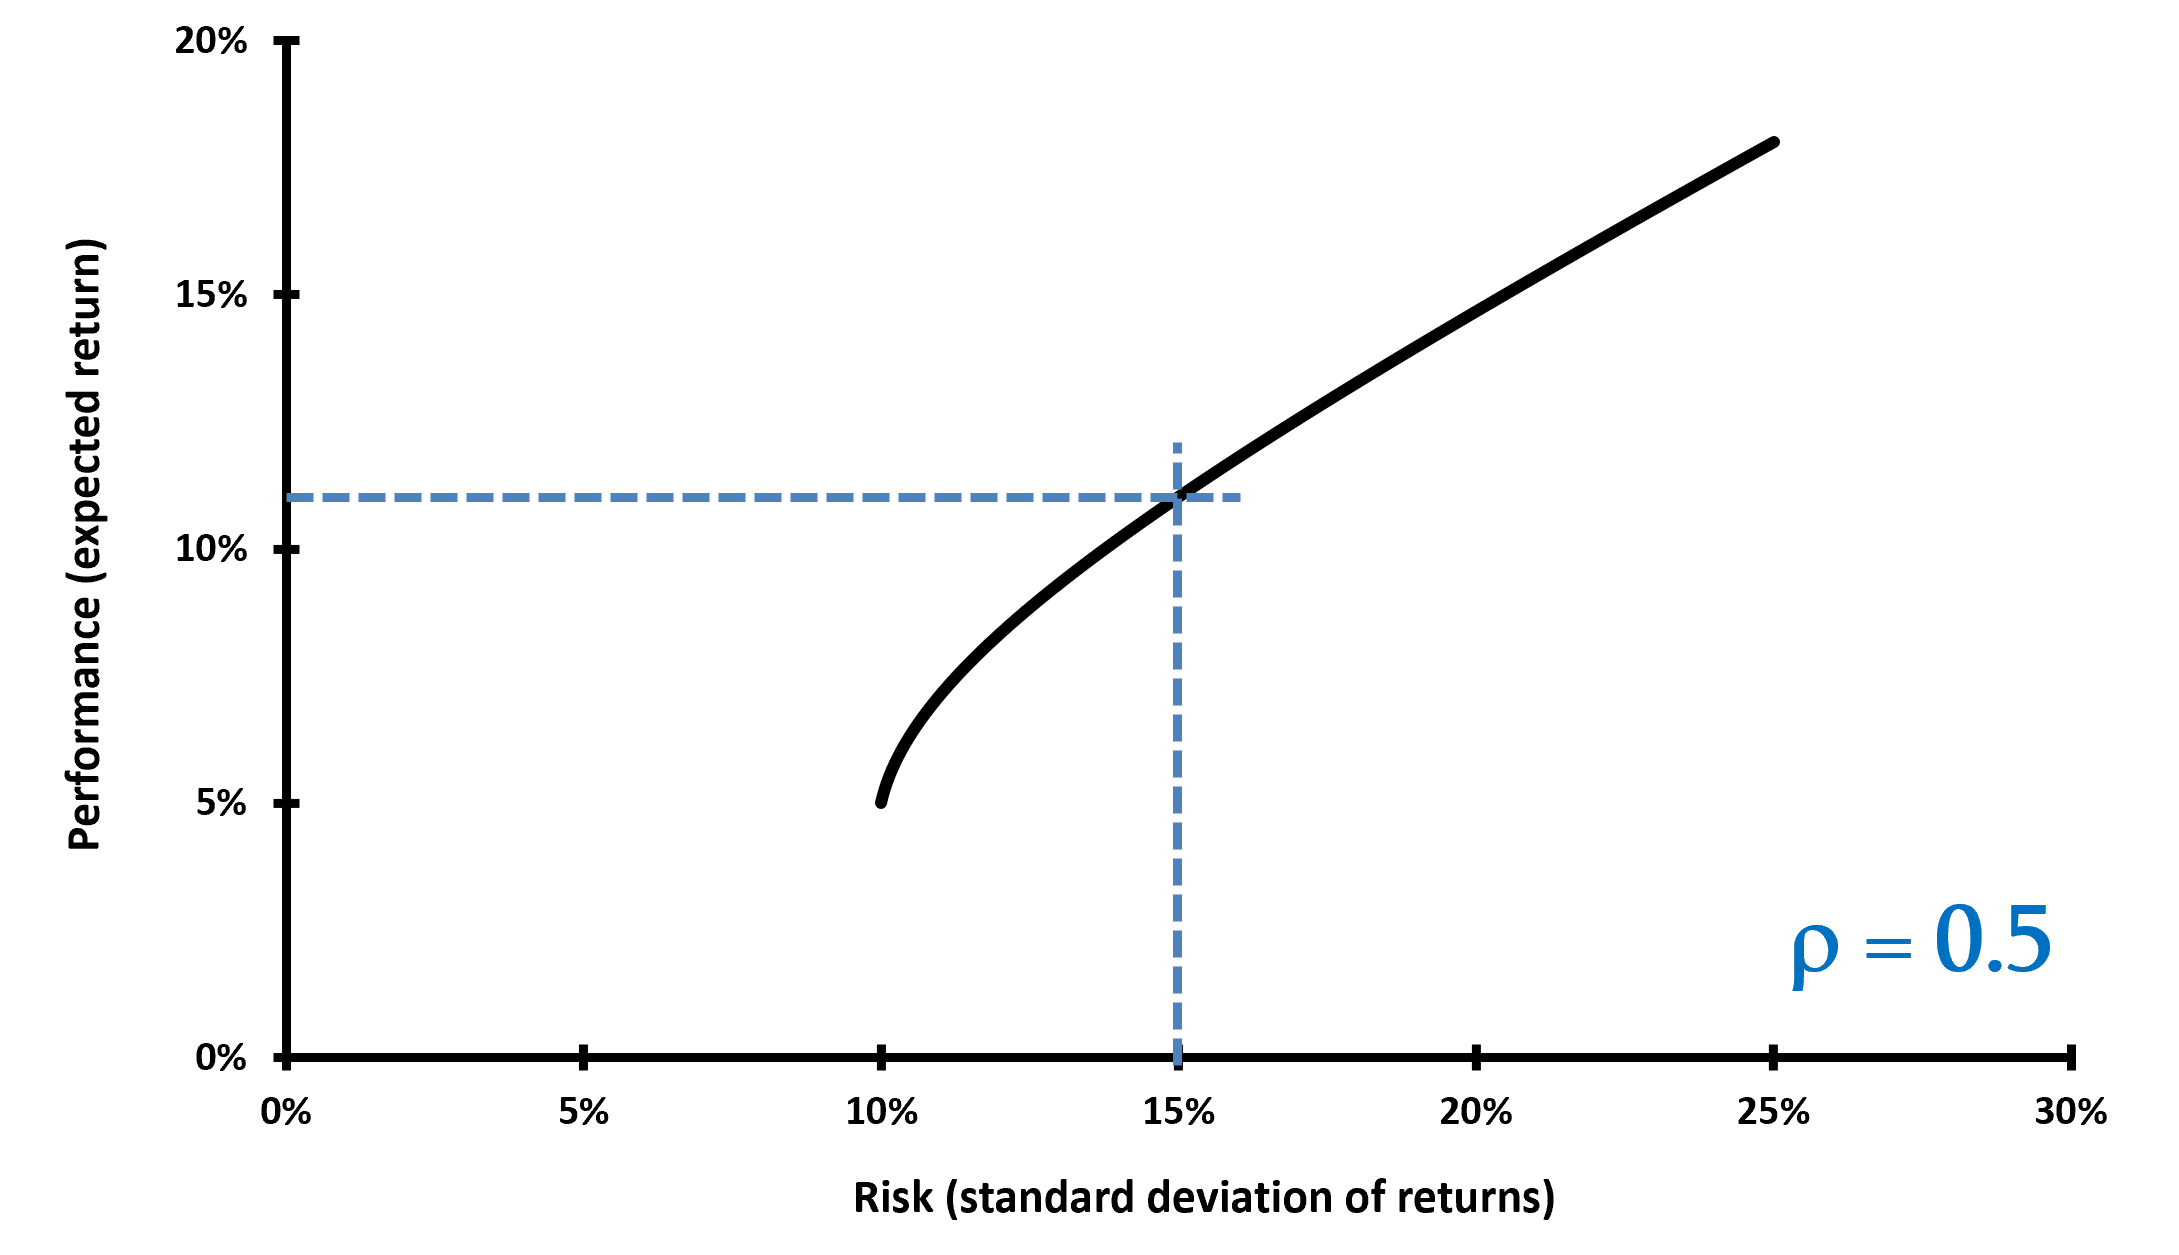
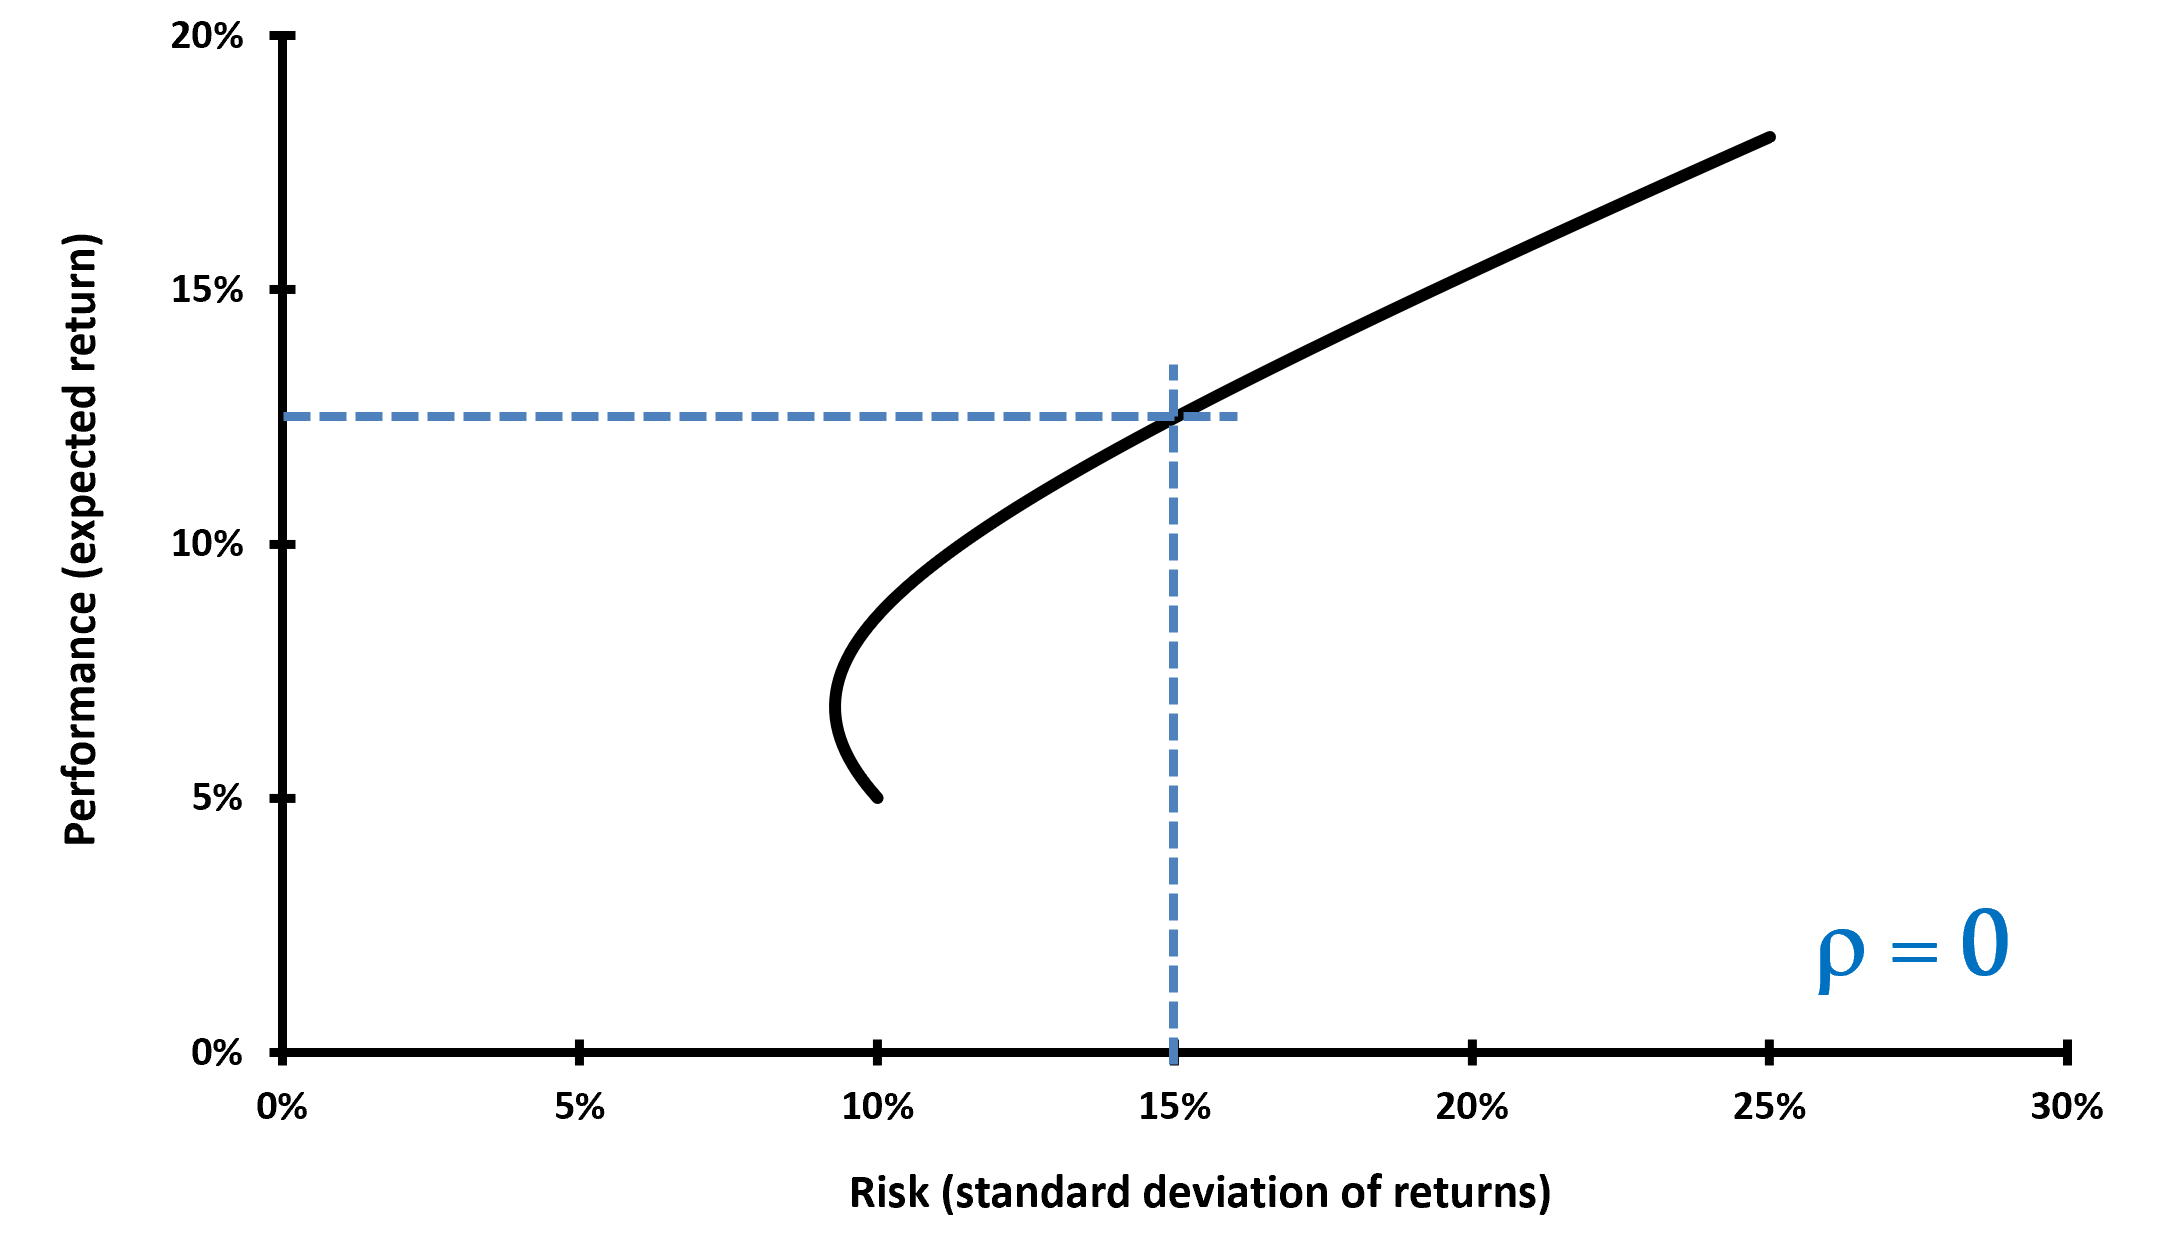
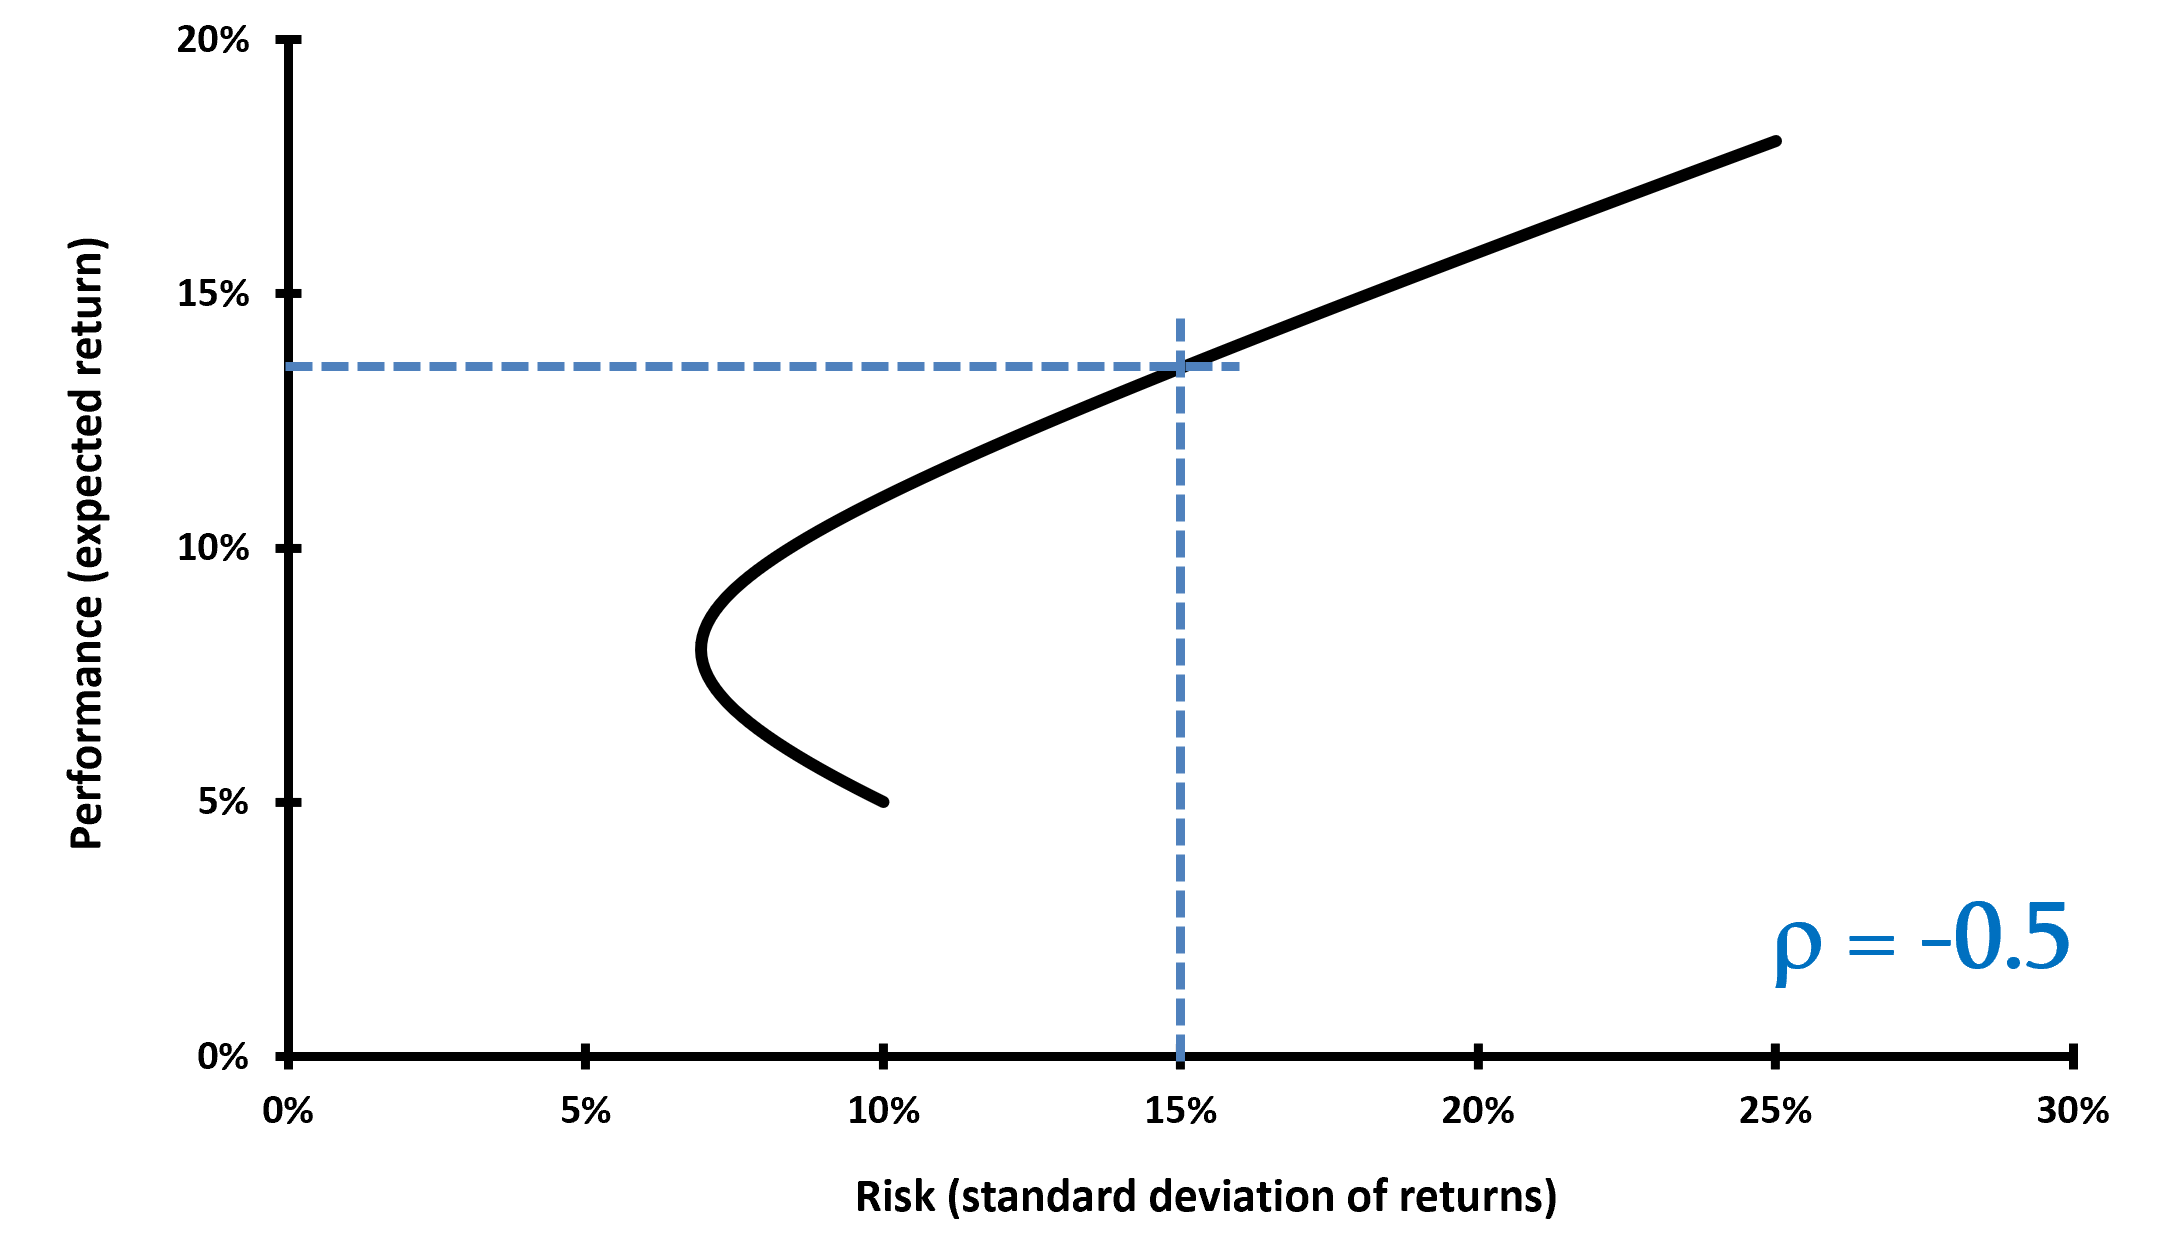
From the above formulas follows a very interesting theorem called the “Diversification effect” which says the following: with two assets, suppose the weights of both securities are positive. As long as the correlation coefficient is less than 1, the standard deviation of a portfolio of two securities is less than the weighted average of the standard deviation deviations of the individual securities. Investors can obtain the same level of expected return with lower risk.
The figures below illustrate the impact of the correlation between the two assets on portfolio diversification and the efficient portfolio frontier. For a given level of portfolio risk, the lower the correlation, the higher the expected return of the portfolio.
You can download below an Excel file (from Prof. Longin’s course) that illustrates the impact of correlation on portfolio diversification.

Diversification effect (extension to several assets)
With many assets, suppose the weights of all securities are positive. As long as the correlations between pairs of securities are less than 1, the standard deviation of a portfolio of many assets is less than the weighted average of the standard deviations of the individual securities.
Why should I be interested in this post?
Understanding correlation is an essential skill for any investor seeking to build a well-diversified portfolio that can withstand market volatility and achieve long-term growth. By carefully analyzing correlation dynamics and incorporating correlation analysis into their investment strategies, investors can effectively manage risk exposure and build resilient portfolios that can weather market storms and emerge stronger on the other side.
Related posts on the SimTrade blog
▶ Youssef LOURAOUI Portfolio
▶ Jayati WALIA Standard deviation
▶ Youssef LOURAOUI Hedge fund diversification
▶ Lou PERRONE Navigating the Balance Between Risk and Reward in Finance
Useful resources
Prof. Longin’s ESSEC Master in Management “Fundamentals of finance” course.
William Pouder’s ESSEC BBA “Finance” course.
About the author
The article was written in December 2023 by Raphael TRAEN (ESSEC Business School, Global BBA, 2023-2024).