

In this second article on a series on market profile, Michel Henry VERHASSELT (ESSEC Business School – Master in Finance, 2023-2025) explains the difference between market profile and volume profile.
Comparison
Both Market Profile and Volume Profile follow the auction theory of markets. According to this theory, price, time and volume are the three processes through which trading takes place.
More exactly:
- Price advertises all opportunities. It lets the participants know that they can buy or sell an asset at a given price; it tells them what their opportunities are.
- Time regulates all opportunities. Indeed, the opportunities given by price are limited in time; they are ephemeral and depend on the liquidity and volatility of an asset, in other words, how much time it takes for the price to change and the opportunity to vanish.
- Volume measures the success or failure of advertised opportunities. Volume reflects the degree of market participation and validates the relevance of the opportunities presented. If an opportunity is advertised and becomes successful that means many participants agree on the fairness of this opportunity and a relatively significant amount of trading activity (volume) takes place at this price. A price that is not accepted over time is, in fact, rejected: the advertisement has failed.
All traders feel the pressure of time ticking away during a trade. When a trade stalls and doesn’t go as expected, it can create doubts, especially the longer it remains stagnant. The constant tick of the clock forces traders to ponder what might be going wrong. For instance, the late liquidation or short-covering rally in the pit session may be due to day traders running out of time rather than a lack of trading volume. In that sense, volume must take place within a given time range to validate the price advertisement.
Now when it comes to Volume Profiles, the chart shows the distribution of volume at different price levels, kind of like a visual map of where the action is happening. It uses a vertical histogram to make it easy for traders to see where the most trading activity is concentrated. This charting tool is all about giving traders a closer look at how much trading is going on at different price points over time.
Comparing Volume Profile to Market Profile, we find three key areas of differences: analytical focus, representation of data, and time and price dynamics.
Analytical Focus
Volume Profile: As the name suggests, Volume Profile places a paramount emphasis on volume, aiming to dissect the distribution of trading activity at different price levels over a designated timeframe.
Market Profile: In contrast, Market Profile combines time and price to create a graphical representation of market behavior. It divides price movements into designated time segments, typically 30-minute intervals, offering a nuanced perspective on the interplay between time and price.
Representation of Data
Volume Profile: The chart generated by Volume Profile provides a clear visualization of how volume is distributed across various price levels, offering insights into where significant buying or selling activity is concentrated.
Market Profile: While also representing volume, Market Profile charts use letters (TPOs) to signify the time spent at specific price levels, creating a distinctive visual pattern resembling a probability distribution.
Time and Price Dynamics
Volume Profile: Its primary concern is the interrelation of volume and price, with a focus on understanding the significance of different price levels based on the amount of trading activity.
Market Profile: Integrates time as a crucial factor, providing traders with a holistic view of market behavior over specific time intervals. This temporal dimension aids in identifying periods of heightened activity and potential areas of interest.
Let’s now look at Market and Volume profiles graphs.
Illustration
The figure below is taken from Steidlmayer’s main work: “Steidlmayer on Markets, Trading with Market Profile”. Each letter (A, B, C, D, etc.) corresponds to a single timeframe of 30 minutes. The condensed triangle-shaped figure shows where price has moved throughout the entire time period according to the trading activity.
Market profile.
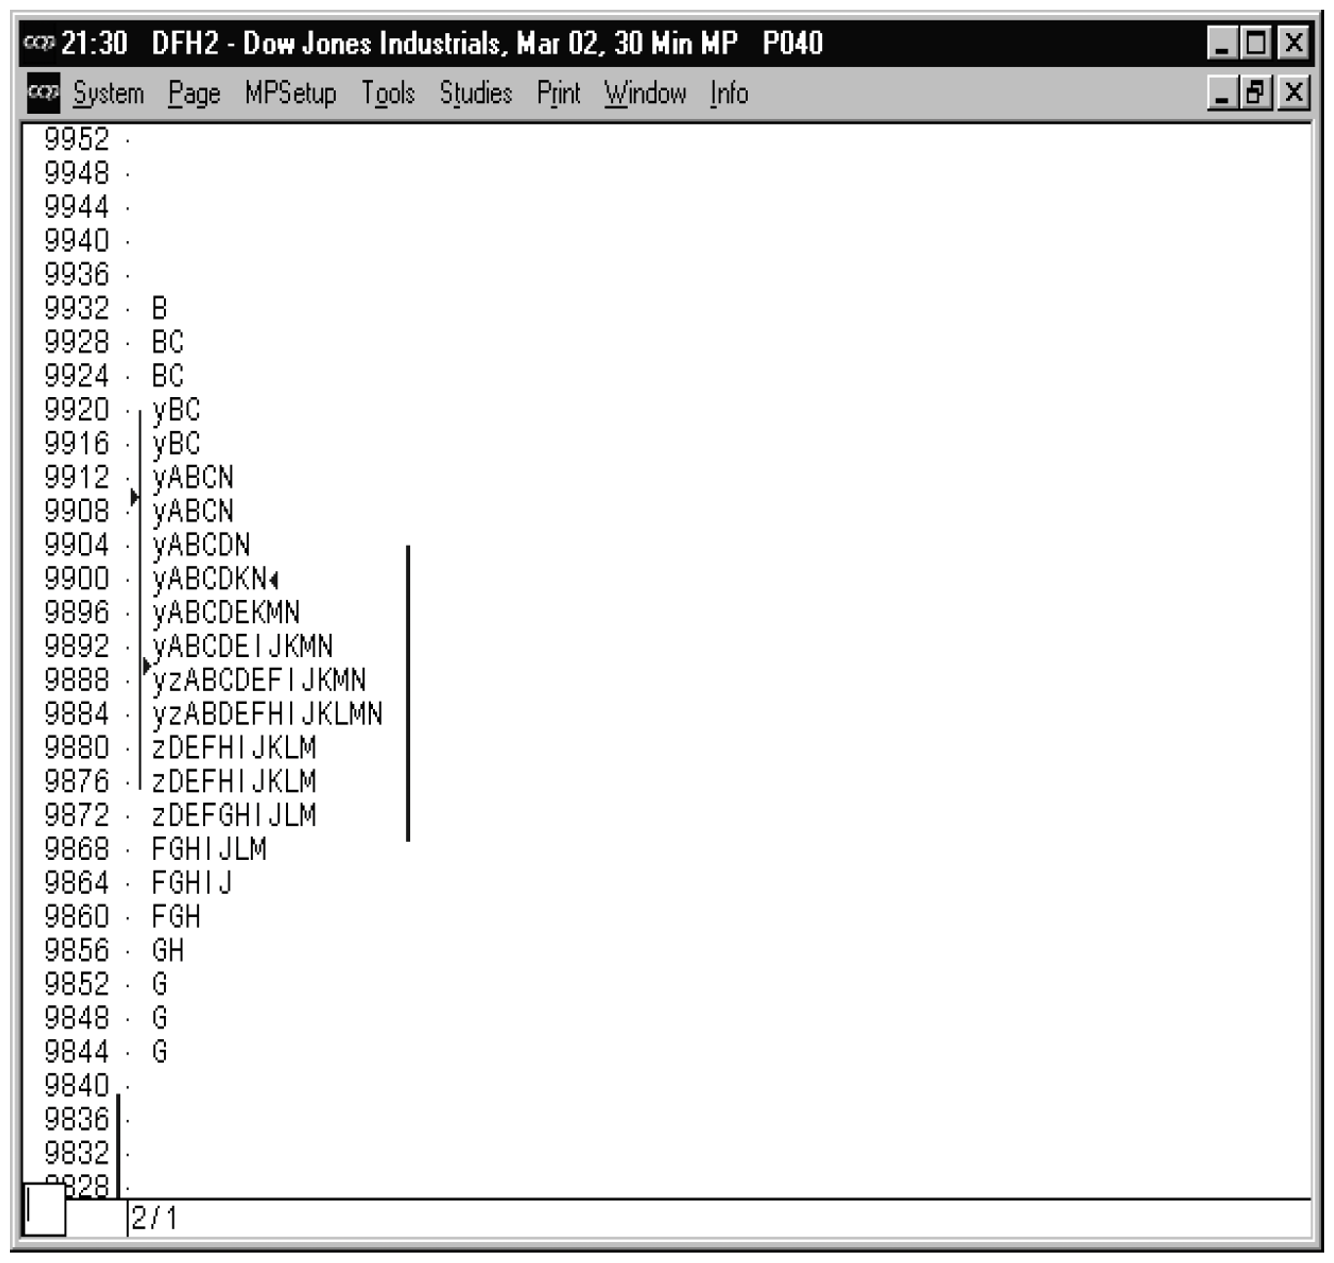
Source: Steidlmayer’s book “Steidlmayer on Markets, Trading with Market Profile”.
If we rotate the figure, we get a bell-shaped pattern that looks like a normal distribution.
Market profile (reversed presentation).
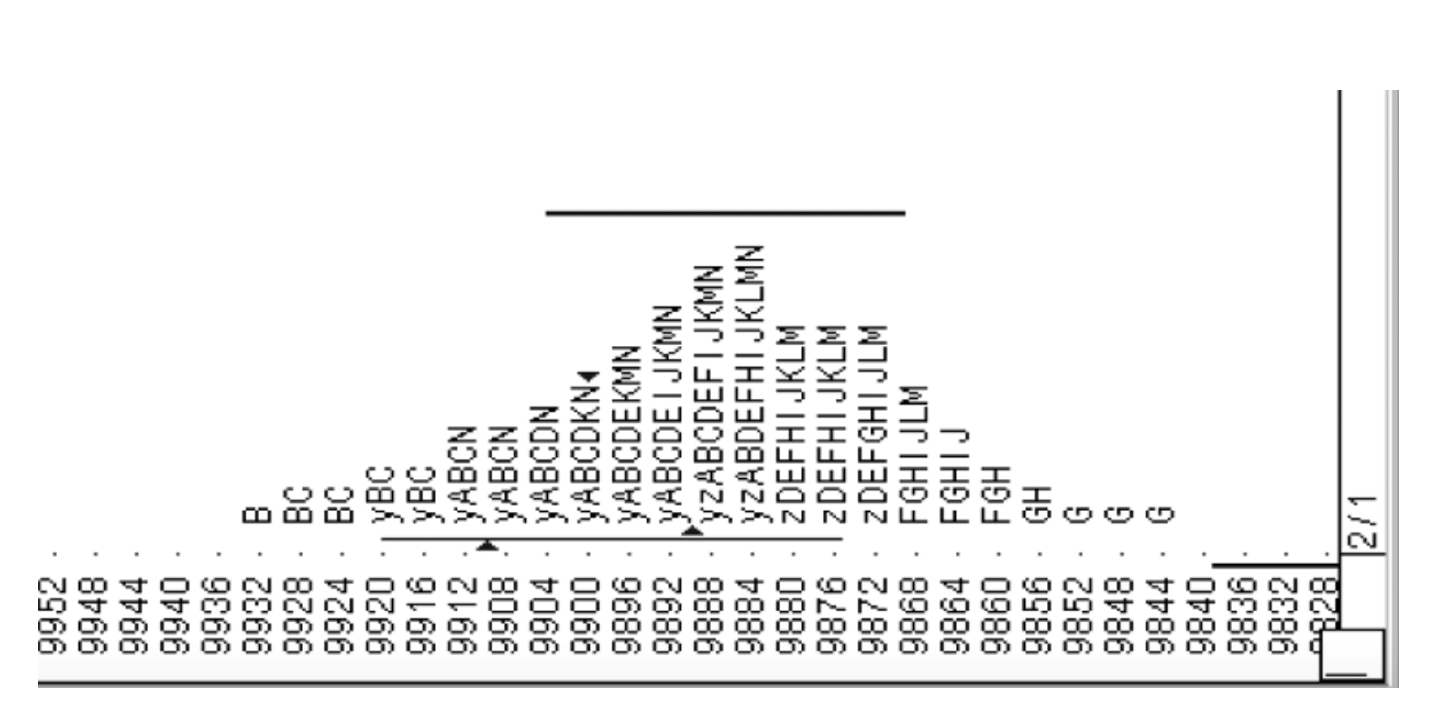
Source: Steidlmayer’s book “Steidlmayer on Markets, Trading with Market Profile”.
The price distribution in a Market Profile tends to exhibit a bell-shaped pattern due to the nature of market dynamics and participant behavior. In a well-functioning and liquid market, prices are subject to constant fluctuations driven by the interplay of buying and selling activities and the bell-shaped distribution is simply a reflection of the statistical tendency of prices to cluster around a central point. The majority of trading activity should in theory occur around a fair or equilibrium price. As you move away from this central point, the occurrences of extreme price levels decrease, forming the characteristic bell curve. It is a visual representation of the market’s natural inclination to spend more time around prices that are deemed fair.
The figure below represents the volume profiles of the BTC/USDT pair on Binance’s futures market from December 8 until December 15, 2023.
Volume profile.
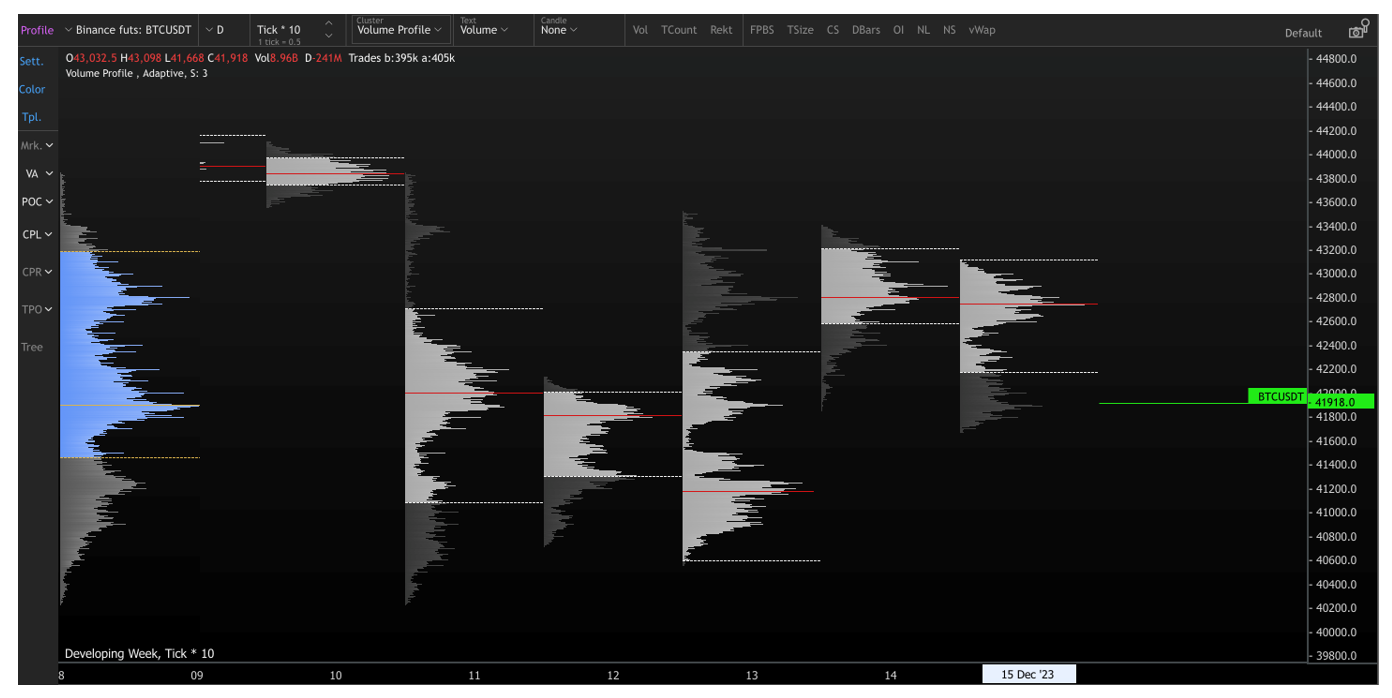
Source: exocharts.com.
We see the point of control (POC) that corresponds to the most traded price as a red line extending through the volume profile of each day. The value area is marked both by a whiter grey and dotted lines. The current price is a green line on the far left. On the far right, we find the volume profile for the whole timeframe displayed on the screen, with its own value area and point of control.
While the two profiles are very similar, however instead of looking at price and time as in a market profile, the volume profile focuses on volume. First, the volume profile is indifferent to when exactly a given trade took place within the same timeframe, here a day. Second, the volume profile uses true volume data rather than simply whether or not a trade took place. The length of each bar within a volume profile is directly proportionate to the volume of the trades at that price. In contrast, the market profile does not show the size of the trades but simply shows whether or not a price was traded during a 30-minute period, and then aggregates (or “collapses”) the data to form one profile, as we saw in the bell-shaped curve above.
Why should I be interested in this post?
Students of finance interested in financial markets and trading would be the target audience of this post. I believe this technique to be relatively obscure despite its long history. We rarely see asset charts displayed as histograms as an effort to understand market behavior and participant psychology. I believe it is fundamental to consider that the market is made up of human actors, that these actors have their biases on price and value, and in turn that these biases’ success is represented as a function of volume. Even if a student does not subscribe to this understanding of markets, it would broaden his/her perspective and allow him/her to understand trading more generally.
Related posts on the SimTrade blog
▶ Michel VERHASSELT Market profile
▶ Michel VERHASSELT Trading strategies based on market profiles and volume profiles
▶ Theo SCHWERTLE Can technical analysis actually help to make better trading decisions?
▶ Theo SCHWERTLE The Psychology of Trading
▶ Clara PINTO Strategy and Tactics: From military to trading
Useful resources
Steidlmayer P.J. and S.B. Hawkins (2003) Steidlmayer on Markets: Trading with Market Profile, John Wiley & Sons, Second Edition;
Steidlmayer P.J. and K. Koy (1986) Markets and Market Logic: Trading and Investing with a Sound Understanding and Approach, Porcupine Press.
Trader Dale Volume Profile vs. Market Profile – What Is The Difference? YouTube video
About the author
The article was written in December 2023 by Michel Henry VERHASSELT (ESSEC Business School – Master in Finance, 2023-2025).
2 thoughts on “Difference between market profile and volume profile”
Comments are closed.