Financial indexes

In this article, Nithisha CHALLA (ESSEC Business School, Grande Ecole Program – Master in Management, 2021-2023) explains financial indexes, their construction and their use in the finance.
Definition
What is an index? An index can be defined as a measure of a quantity.
An index is a measure of quantity that can be defined as the ratio between the value of the quantity during a current period and its value during a base period. The use of a ration makes it easy to calculate and compare changes in one or more quantities between two given periods. This ratio is often multiplied by 100 or 1,000. Indexes are frequently used in the financial sector to measure the evolution of market prices for a set of financial assets over time. These sets of assets can be defined to represent an asset class, country or geographical zone, or sector of the economy, and provide a comprehensive and accurate overview of the market.
Financial indexes serve as a benchmark for assessing the performance of an investor’s asset portfolio and give investors a way to monitor the performance of a given set of assets. By using financial indexes, investors can gain knowledge of market trends and conditions and make informed investment decisions. Index providers are responsible for creating and maintaining financial indexes.
History
The Dow Jones Industrial Average was first created in 1896 by Charles Dow, a co-founder of the Dow Jones Company, and is widely regarded as the first index. Who is creating the index? The Dow Jones Industrial Average, which included 12 companies at the time that were emblematic of the US Market. Currently, there are 30 companies that make it up even though none of the original 12 companies are still included. As interest in indices increased, financial publications like the Financial Times or exchange owners like the Deutsche Borse in Germany developed their own equity indices, while investment banks took the lead in developing indices for bonds. Since then, numerous other financial indexes have been developed, including the NASDAQ Composite, FTSE 100, Nikkei 225, S&P 500, and others.
Evolution over time
Stock market indexes were initially just simple arithmetic averages of the prices of a small number of chosen stocks; they did not take the entire market into account. The daily averages were first published in the newspapers in the 1800s. Later, they began to use market capitalization weighting, which was well-liked because it assigned weights based on the size of the company. Following that, various indexes based on sectors, nationalities, etc. were assigned. A significant trend recently has been the use of passive index funds and the addition of ESG criteria to the indexes.
Providers of financial indexes
Financial indexes are typically provided by financial data and research firms. As mentioned earlier, though there are several providers in the financial services industry, there are few most prominent index providers – S&P Global, MSCI, FTSE Russell, Dow Jones Indices and Nasdaq. With a combined market share of about 90% for equity indexes, these firms are thought to dominate the world index market.
Index Industry Association (IIA)
The production of indexes has become an industry! And every industry has a professional association. The index industry is no exception. The Index Industry Association was founded in 2012. Some of the founding members are MSCI and S&P Dow Jones Indexes.
As stated on the IIA website, the association mandate is “to educate investors on the attributes and role of indexes within the investment process, to advocate for the interests of index users and providers worldwide, and to push for industry standards of best practice, independence and transparency”.
Composition of an index
The composition of an index is a crucial factor in determining its representation, and it is important for investors to understand the criteria used by the index provider to select the assets included in the index, as well as the weightings assigned to each asset. The composition of an index is designed to represent a specific market or sector, and the index provider selects the assets to be included based on specific criteria, such as market capitalization, liquidity (float), and sector representation.
There are several steps in the process of creating an index. As we all know, index providers use a variety of companies to create the index, but how are they selected? Specific eligibility requirements must be met, such as the size of the business and the industry it belongs to, etc. After the eligible companies have been narrowed down, they are properly evaluated before being included in the index. This evaluation includes looking at the company’s earnings, market capitalization, and other factors. Additionally, they conduct index balancing with regard to various industries, segments, etc. Last but not least the index’s potential market impact is cross-checked as the index stands as a benchmark for the investors to make decisions. Different index providers may have different selection criteria and processes.
The index provider regularly reviews and updates the composition of the index to ensure that it remains representative of the market or sector it is tracking.
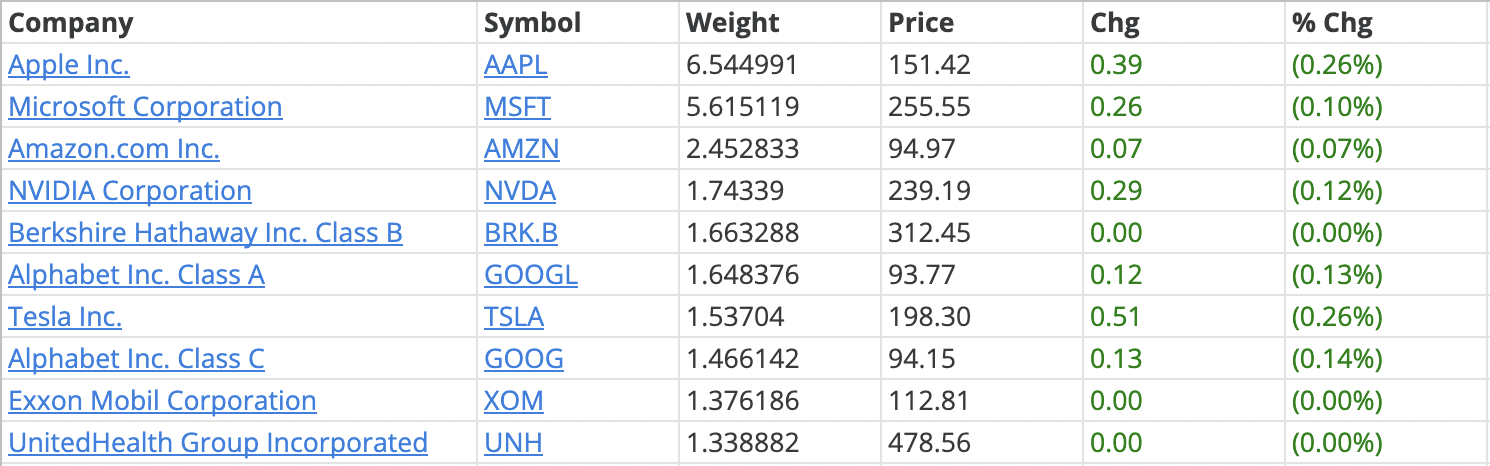
For example, the S&P 500 index is designed to represent the performance of the U.S. stock market, and the securities included in the index are chosen based on market capitalization, liquidity, and sector representation. Since each security’s weight in the index is based on its market capitalization, the largest and most powerful corporations have the biggest effects on the index’s overall performance.
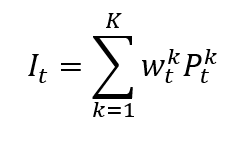
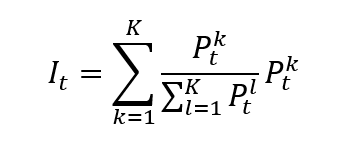
Calculation of financial indexes
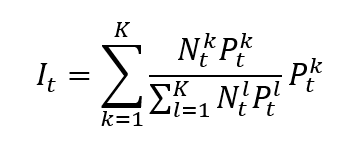
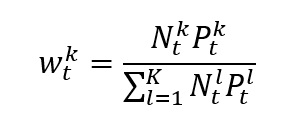
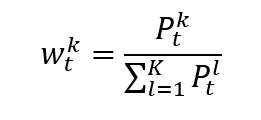
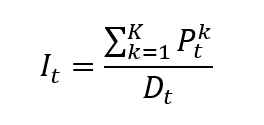
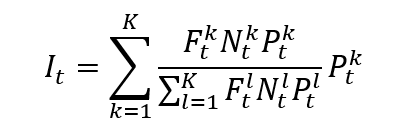
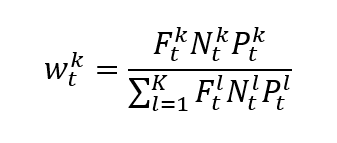
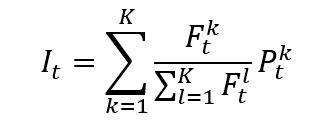
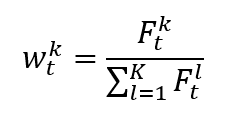
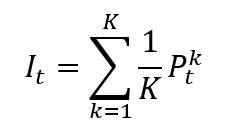
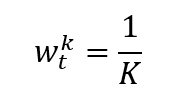
Once the index provider has chosen the assets to be included in the index based on predetermined criteria, such as market capitalization, liquidity, and sector representation. Then the index value has to be calculated with a specific formula. There are different calculation methods for financial indexes: price-weighted index, market-capitalization-weighted index, equal-weighted index and fundamentals-weighted index.
Classifications of financial indexes
By having a solid understanding of the various classifications of financial indexes, investors can select the most suitable indexes for their investment goals and strategies. Market coverage, calculation method, geographic region, asset class, investment approach, and security type are used to categorize financial indexes.
The criteria for classifying financial indexes include:
- Asset class: equity, bond, crypto, etc.
- Geography: US, Asia-Pacific, Europe
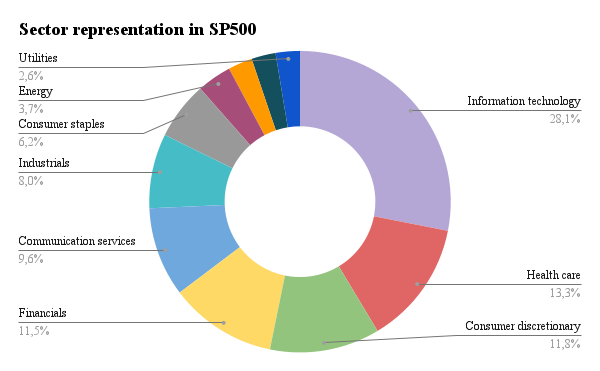
- Sector: Information Technology, Health Care, Financials, Consumer Discretionary, Communication Services, Industrials, Consumer Staples, Energy, Utilities, Real Estate, and Materials.
- Weighting methodology: price-weighted, market-capitalization-weighted, float-adjusted market-capitalization-weighted, fundamental-weighted
- Objectives: market representation, risk factor representation
Most popular financial indexes
The Dow Jones Industrial Average
The Dow Jones Industrial Average (DJIA) was established in 1896, is the country’s first stock market index. Thirty large-cap companies that are leaders in their fields are included in this price-weighted index. The index is frequently used as a gauge for the American stock market and the overall economy. ▶ More about the DJIA index
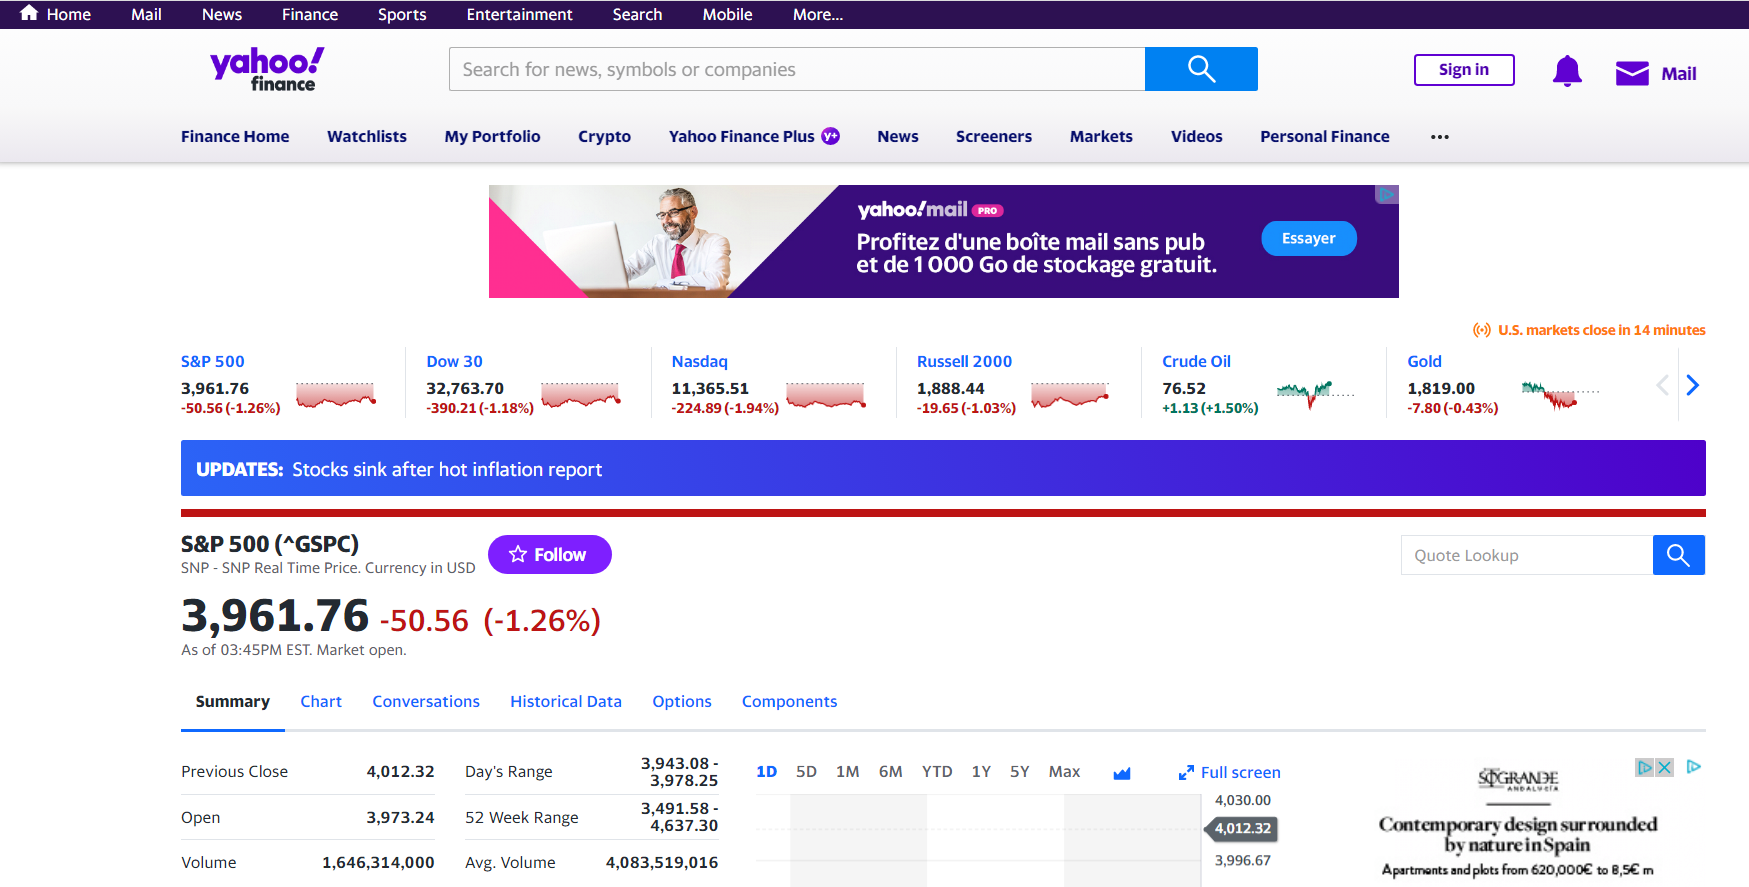
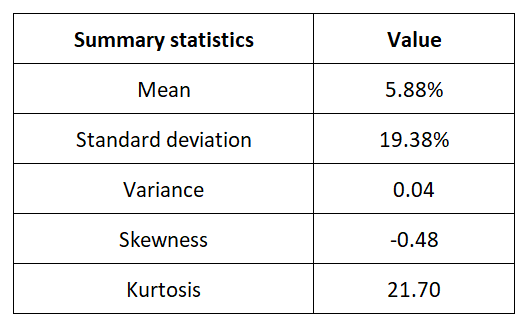
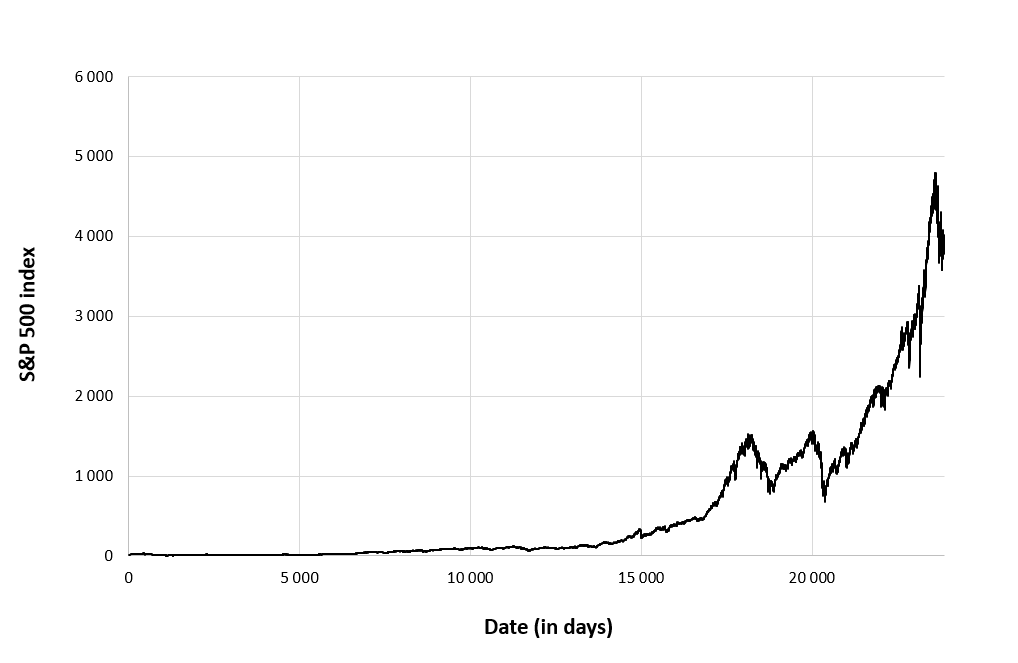
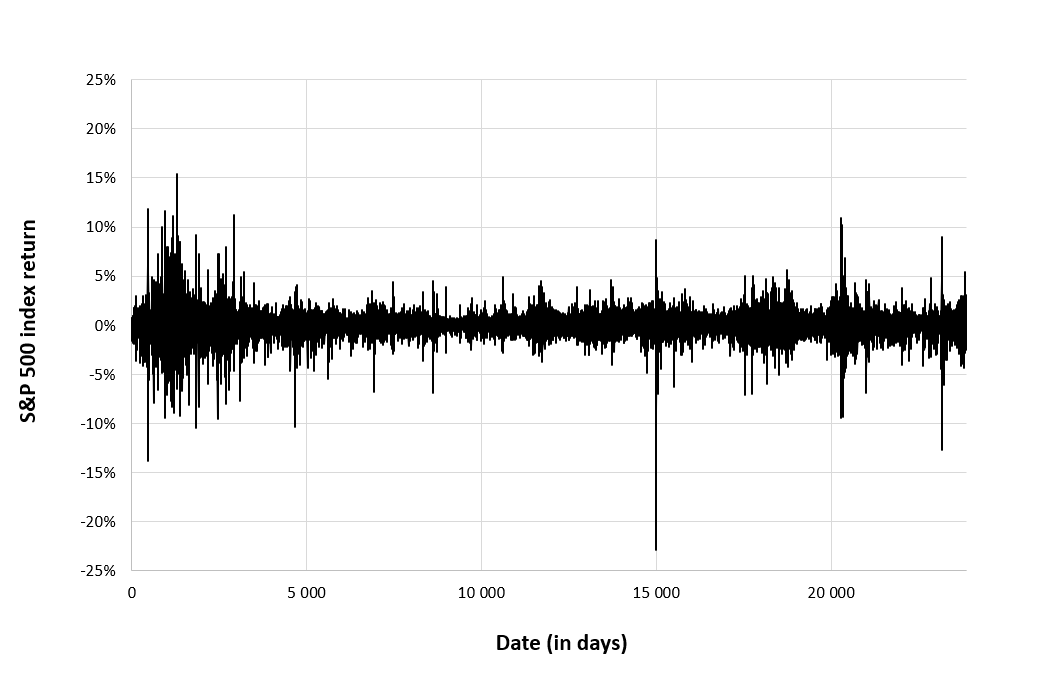
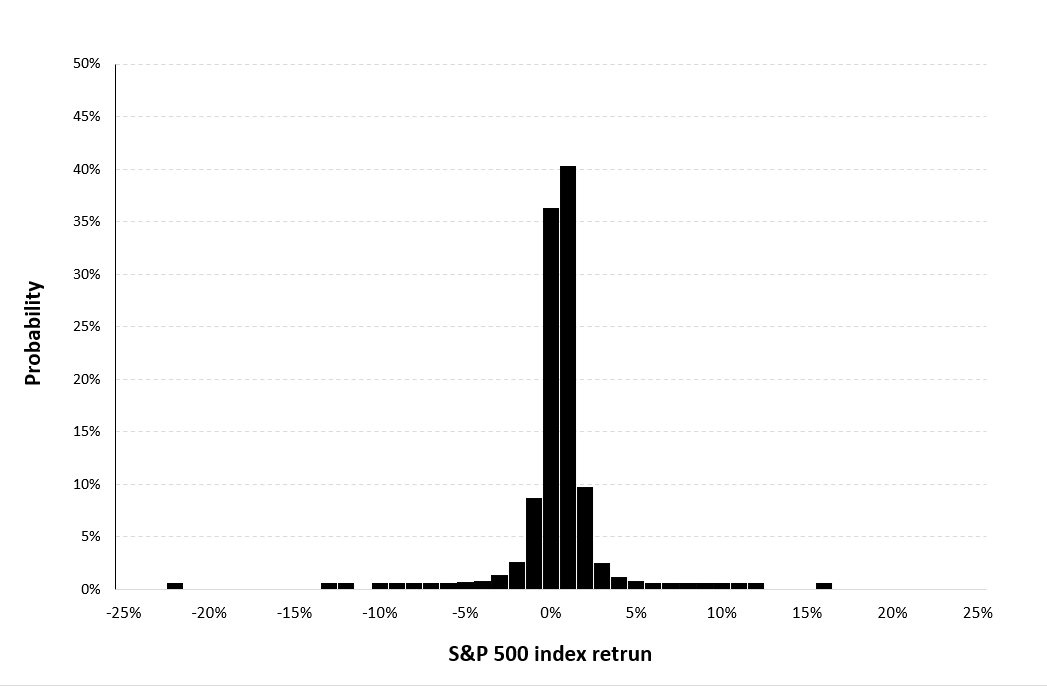
S&P 500
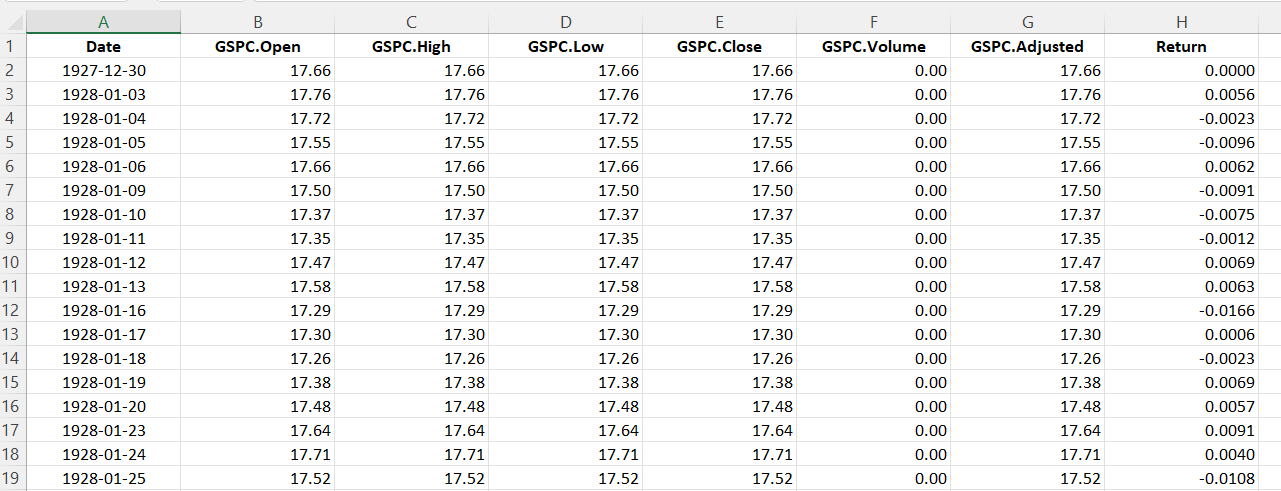
The S&P 500 index is a market capitalization-weighted index that monitors the progress of 500 large-cap U.S. businesses operating in various industries. It was established in 1957, and many people consider it to be one of the most significant benchmarks for the American stock market. The index is widely used as a benchmark by fund managers and investors and is frequently used as a stand-in for the overall health of the American economy. ▶ More about the S&P 500 index
Nasdaq Composite
Composed of all the companies listed on the Nasdaq stock market, the Nasdaq Composite is a market capitalization-weighted index. It was founded in 1971 and is renowned for the prominence of technology firms, even though it also includes businesses from the consumer goods, healthcare, and finance sectors. The index is frequently used as a yardstick for growth and technology stock performance. ▶ More about the Nasdaq Composite index
FTSE 100
The performance of the top 100 companies listed on the London Stock Exchange is tracked by the FTSE 100, a market capitalization-weighted index. Since its creation in 1984, it has gained widespread recognition as the top benchmark for the UK stock market. Companies from the financial, energy, and mining sectors make up the majority of the index, and each company is weighted according to its market capitalization. ▶ More about the FTSE 100 index
MSCI World
The MSCI World Index tracks the performance of businesses in 23 developed markets around the world, including the United States, Canada, Japan, and Europe. It is a market capitalization-weighted index. It was developed in 1969 and is frequently used as a yardstick for performance in the global equity market. The weighting of each company in the index, which consists of more than 1,600 large- and mid-cap stocks, is determined by its market capitalization.
Health Care Select Sector Index
The Health Care Select Sector Index is based on the companies of the S&P 500’s health care sector. It was established in 1998 with the purpose of monitoring the performance of businesses involved in the health care sector, such as those producing pharmaceuticals, biotechnology, medical devices, and healthcare providers.
Use of indexes in finance
Financial indexes play an important role for market participants like investors, traders, and asset managers. Some of the ways indexes are used in finance include:
Gauges of the market evolution
Indexes can offer insightful information about the state of the financial markets. An index helps to measure the market returns of a given set of securities.
The best part of the stock index is that just by tracking the simple indicator we get a general idea of how the stock market is performing. A stock index clearly shows how the market is performing, or at least the market that it represents, despite the fact that individual stocks may perform differently, making it challenging to determine whether the market is strong or weak.
Benchmarks
Indexes are frequently used as a benchmark to assess the performance of investment portfolios, especially actively managed portfolios.
Proxies for modeling
In academic studies, indexes are used as proxies for the market portfolio to capture systematic risk and to compute risk-adjusted performance.
Portfolio Asset allocation
Because they offer a way to gain exposure to particular asset classes, industries, or geographic areas, indices serve as the foundation for asset allocation strategies.
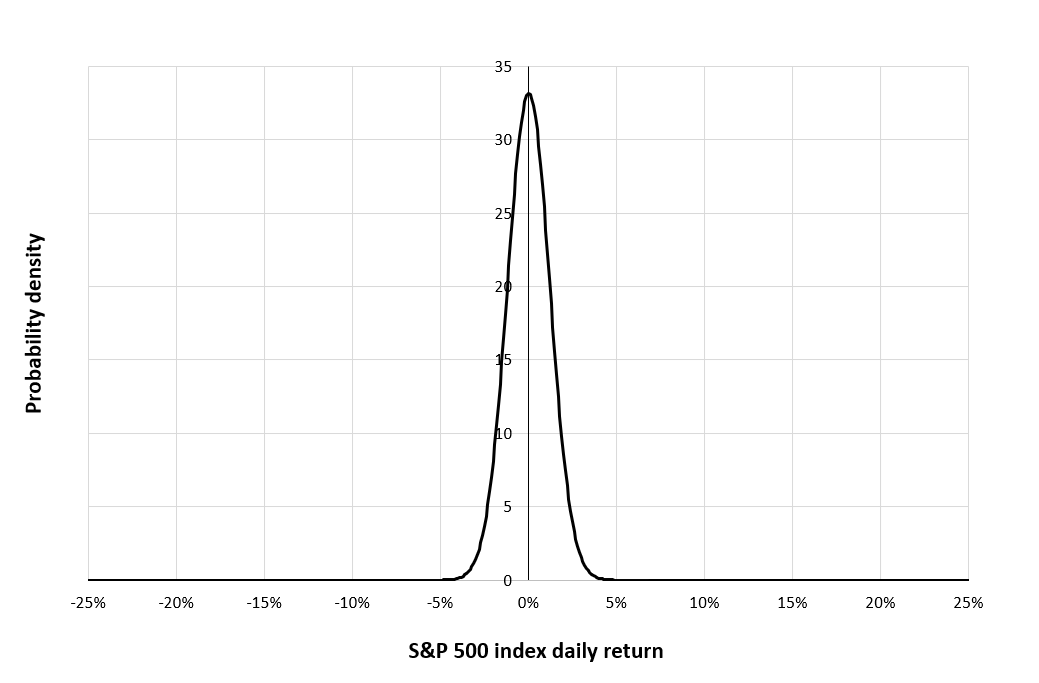
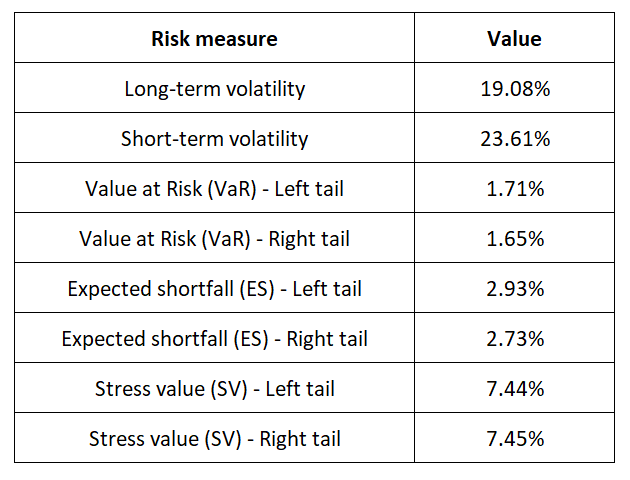
Risk management
Indexes can assist investors in comprehending the risks related to particular asset classes or geographical areas.
Building of investment vehicles
Exchange-traded funds (ETFs), mutual funds, options and structured products, among others, use indexes as their underlying assets. These investment vehicles make it easy and affordable for investors to become exposed to the index’s performance.
Rebalancing
Some indexes imply frequent and even continuous rebalancing (buying and selling assets). For example, for a fund tracking an equally-weighted index, the fund manager will have to sell assets whose price increased and buy assets whose price decreased.
Change in index composition and impact on asset prices
When an asset is included in an index, its price usually increases as fund managers need to buy it to include it in their portfolio. Conversely, when an asset is excluded from an index, its price usually decreases as fund managers need to sell it to exclude it from their portfolio.
Empirical results confirming these propositions can be found in a study by McKinsey (2004). The prices of the assets included in a financial index may change as a result of changes in the composition of the index over time.
It is crucial to remember that depending on the specifics of the change, the effect of a change in index composition on asset prices may be either short-lived or long-lasting. The effect of a change in index composition on asset prices can also be challenging to forecast because it depends on a variety of variables, such as investor sentiment, fund flows, and market sentiment.
Link with academic research
The performance of a particular sector of the stock market, such as large-cap stocks, small-cap stocks, or a specific sector or industry, is measured by an equity index, a type of financial index.
On the other hand, market factors are factors that account for a significant amount of the variation in stock prices. Market variables include both macroeconomic ones like interest rates and GDP and market-specific ones like market volatility and liquidity.
The relationship between equity indexes and market factors is that changes in market factors can have an impact on equity index performance, and equity index performance can be influenced by market factor changes. For instance, adjustments in interest rates may have an effect on the performance of the stock market as a whole and, consequently, on the performance of an equity index that monitors the stock market. Factor-based indexes that seek to capture the performance of particular market factors, such as value, growth, and momentum, have been developed as a result of research into the effects of market factors on equity indexes. These factor-based indexes can be employed to examine the effects of market factors on the performance of equity indexes and to base investment choices on the exposure to market factors.
Why should I be interested in this post?
I frequently come across news-related stocks, bonds, and indices in publications like newspapers, financial journals, and business magazines. We require a fundamental understanding of indices in order to even understand what is happening in the business world. It’s also crucial to have a thorough understanding of markets and financial indices because we need to comprehend these financial indices in order to assess a company’s performance and compare it to previous years.
Related posts on the SimTrade blog
▶ All posts about Financial techniques
About financial indexes
▶ Nithisha CHALLA Calculation of financial indexes
▶ Nithisha CHALLA The business of financial indexes
▶ Nithisha CHALLA Float
Examples of financial indexes
▶ Nithisha CHALLA The DJIA index
▶ Nithisha CHALLA The S&P 500 index
▶ Nithisha CHALLA The Nasdaq index
Useful resources
Insee Indice
Russel How are indexes weighted?
Financial Index Industry Presentation of the association
Index Industry Association Presentation of the association
Marc H. Goedhart and Regis Huc (2004) What is stock index membership worth? McKinsey & Company.
About the author
The article was written in March 2023 by Nithisha CHALLA (ESSEC Business School, Grande Ecole Program – Master in Management, 2021-2023).