
The Warren Buffett Indicator

In this article, Youssef EL QAMCAOUI (ESSEC Business School, Master in Strategy & Management of International Business (SMIB), 2020-2021) discusses the Warren Buffett Indicator.
It is no secret that stock prices are all-time highs and people have been asking the important question: are we in a stock market bubble? According to the Warren Buffett Indicator, the answer to that question is YES.
Let’s discuss what exactly the Warren Buffett Indicator is, why it is showing that this stock market is the most overvalued in history and why the stock market would have to fall by more than 50% to be considered fairly valued based on historical averages.
Definition and origin of the Warren Buffett Indicator
The Warren Buffett Indicator is defined as the ratio between the US Wilshire 5000 index to US Gross Domestic Product (GDP). In other words, it is the American stock market valuation to US GDP divided by the size of the American economy.
It is used to determine how cheap or expensive the stock market is at a given point in time. It was named after the legendary investor Warren Buffett who called in 2001 the ratio “the best single measure of where valuations stand at any given moment”. It is widely followed by the financial media and investors as a valuation measure for the US stock market and has hit an all-time high in 2021.
To calculate the Warren Buffett Indicator, we need to get data for both metrics: the US Wilshire 5000 index and the US GDP.
The US Wilshire 5000 index
To determine the total stock market value of the US, Warren Buffett uses the Wilshire 5000 index. This index is a broad-based market capitalization weighted index composed of 3,451 publicly traded companies that meet the following criteria:
- The companies are headquartered in the United States.
- The stocks are listed and actively traded on a US stock exchange.
- The stocks have pricing information that is widely available to the public.
The Wilshire 5000 index is a better measure of the total value of the US stock market than other more popular stock market indices such as the S&P500 the Dow Jones or the NASDAQ. In the case of the S&P500, it only measures the 500 largest US companies. The Dow Jones has only 30 component companies and the NASDAQ consists of mostly tech companies and excludes companies listed on the NYSE. On the other hand, the Wilshire 5000 is often used as a benchmark for the entirety of the US stock market and is widely regarded as the best single measure of the overall US equity market.
In 2021, the market capitalization of the Wilshire 5000 is approximately 47.1 trillion dollars.
The US GDP
The US GDP which represents the total production of the US economy. It is measured quarterly by the US Government’s Bureau of Economic Analysis. The GDP is a static measurement of prior economic activity meaning it does not forecast the future or include any expectation or evaluation of future economic activity or growth. In 2021, the US GDP is 22.7 trillion dollars.
The Warren Buffett Indicator
Knowing the value of the US Wilshire 5000 index and the value of the US GDP, we can compute the value of the Warren Buffett Indicator:
(47.1 / 22.7)*100 = 207.5%.
Without any historical context this number doesn’t say anything so let’s dive into it.
Evolution of the Warren Buffett Indicator
Figure 1 gives the evolution of the Warren Buffett Indicator over the period 1987-2021. This figure underlines how extremely high the Warren Buffett Indicator currently is compared to historical averages.
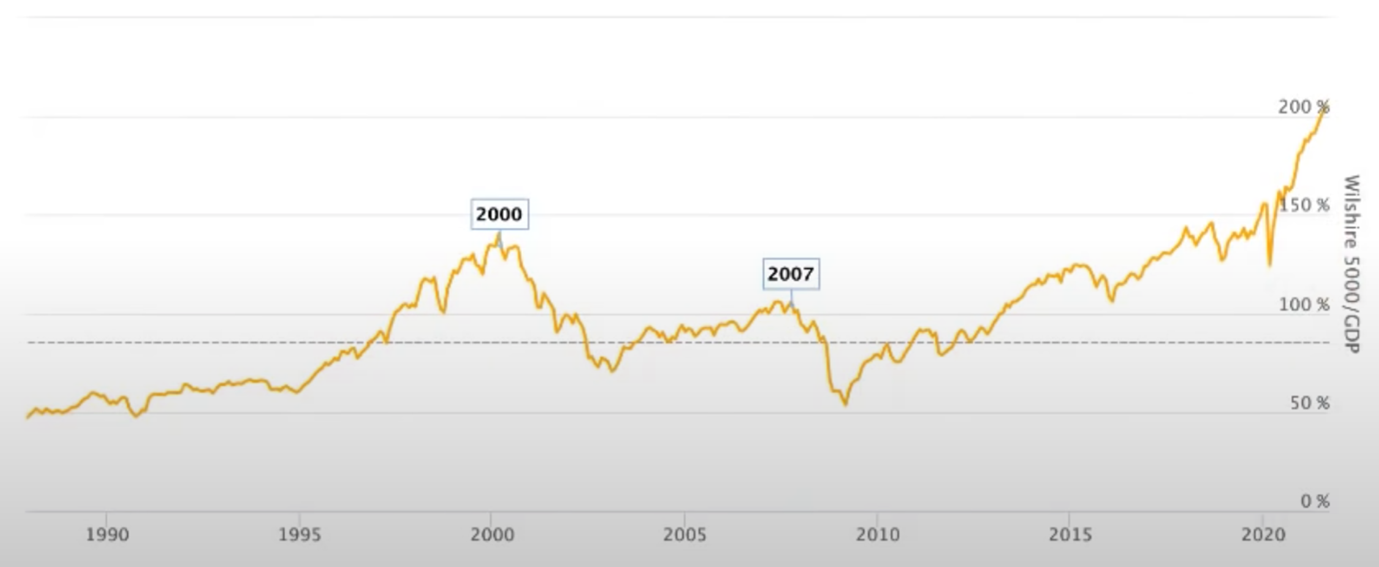
The Warren Buffett Indicator at 207% is tremendously higher than periods that turned out to be huge market bubbles such as “.com” bubble in March of 2000 where the Warren Buffett Indicator topped out at 140%. Even at the top of the housing bubble in October 2007 looks significantly tame at 104% compared to today’s level of nearly double that.
Since 1970, the average Warren Buffett Indicator reading has been at around 85%. In fact, for the stock market to be considered fairly valued based on historical averages, the total value of the stock market would have to fall to 19.3 trillion, far from the current value of 47.1 trillion. This means it would take a 60% stock market crash for the Warren Buffett Indicator to fall back to its historical average of 85%.
Use of the Warren Buffett Indicator for investment
But what does this mean for future investing returns? Over the last 10 years the S&P500 returns have been extremely strong at an average of 12.5% per year – well above historical trends.
Let’s look at how Warren Buffett used the thinking around the Warren Buffett Indicator to help make predictions about future returns from the stock market during these crazy times. Warren Buffett has been known to be hesitant about making predictions about the stock market but there have been a few times where Buffett used the Warren Buffett Indicator to help make accurate predictions about the future returns of the stock market in November 1999 when the Dow Jones was at 11,000 – and just a few months before the burst of the dot-com bubble – the stock market gained 13% a year from 1981 to 1998. The Warren Buffett Indicator was at 130% significantly higher than ever before in the past 30 years.
Warren Buffett said at the time that 13% return is impossible if you strip out the inflation component from this nominal return which you would need to do. However, inflation fluctuates that’s 4% in real terms and if 4%.
Two years after the November 1999 article when the Dow Jones was down to 9,000, Warren Buffett stated: “I would expect now to see long-term returns somewhat higher [around] 7% after costs”. He revised his expectations for future returns higher because the Warren Buffett Indicator had come down significantly from its high of 130% in November 1999 to 93% just two years later – meaning stocks were more fairly valued and as a result prospective future returns were higher.
In October 2008, after the S&P500 had fallen from a high of greater than 1,500 in July 2007 to around 900, Warren Buffett wrote “Equities will almost certainly outperform cash over the next decade probably by a substantial degree. At that moment, the indicator was at around 60%. This was not a popular prediction and people were selling out of stocks because they were worried about the future. They had seen stock prices fall consistently and wanted to sell out of stocks before they kept falling more. Since Warren Buffett made this call in October 2008, the S&P500 has returned an average annualized return of 14.7% with dividends reinvested. This return is significantly higher than the long-term historical return of the stock market.
To grasp the Warren Buffett Indicator has been a good gauge of future stock market returns, it is needed to understand the reason stocks can’t rise 25% or more a year forever. This is because over the long term, stock market returns are determined by the following:
Interest rate
The higher the interest rate, the greater the downward pole. This is because the rate of return that investors need from any kind of investment is directly tied to the risk-free rate that they can earn from government securities. As Warren Buffett explained: “If the government rate rises the prices of all other investments must adjust downward to a level that brings their expected rates of return into line. If government interest rates fall, the dynamic pushes the prices of all other investments upward”.
Long-term growth of corporate profitability
Over the long-term, corporate profitability reverts to its long-term trend (~6%). During recessions, corporate profit margins shrink and during economic growth periods corporate profit margins expand. Nonetheless, long-term growth of corporate profitability is closely tied to long-term economic growth.
Current market valuation
Over the long run, stock market valuation tends to revert to its historical average. A higher current valuation certainly correlates with lower long-term returns in the future. On the other hand, a lower current valuation correlates with a higher long-term return.
Discussion
That being said there are some points that we add to discuss this perspective.
Historically low interest rates
Figure 2 represents the history of interest rates in the US for the period 1960-2021.
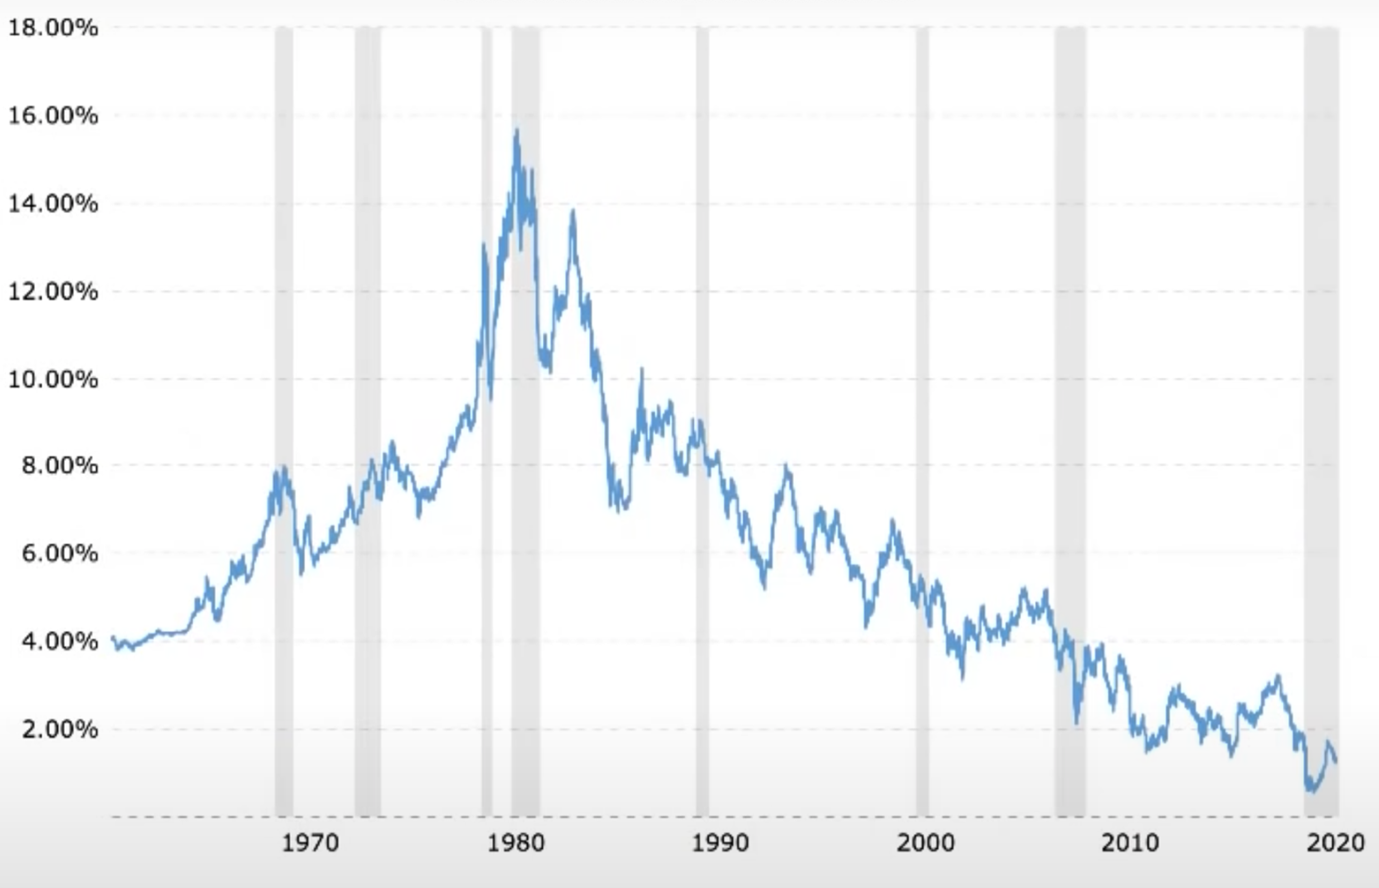
This figure shows that the current interest rate on 10-year US government bonds has never been so low. This extremely low level of interest rates partially helps to explain the high stock market valuation by historical standards. As Warren Buffet stated: “As interest rates rise stocks become less valuable and as interest rates decrease stock prices increase all else being equal”.
Companies are staying private for longer
As companies stay private for longer, these companies are not included in the value of the stock market. If these companies had decided to go public, the market cap of Wilshire 5000 would be higher as the index currently contains around 3,500 stocks. Since this index only counts publicly traded companies, if large non-publicly traded companies were also included in the value of the index, the value of the Warren Buffet Indicator would increase – although likely not by a large enough factor.
Why should I be interested in this post?
You might be interested in this topic if you are aware or are trying to get knowledge around the stock market and the possible crash that is being discussed in 2021. This might help you understand what the current situation is and why we are talking about this. But it also gives you insights to understand how important this topic can become in the very near future.
Useful resources
Data to compute the Warren Buffett Indicator
Federal Reserve Economic Data US GDP
Federal Reserve Economic Data Wilshire 5000 Full Cap Price Index
Other
Wilshire www.wilshire.com
Current market valuation Buffet Indicator
Related posts on the SimTrade blog
▶ Bijal GANDHI Gross Domestic Product (GDP)
▶ Rayan AKKAWI Warren Buffet and his basket of eggs
About the author
The article was written in October 2021 by Youssef EL QAMCAOUI (ESSEC Business School, Master in Strategy & Management of International Business (SMIB), 2020-2021).