Optimal portfolio

Youssef_Louraoui

In this article, Youssef LOURAOUI (Bayes Business School, MSc. Energy, Trade & Finance, 2021-2022) presents the concept of optimal portfolio, which is central in portfolio management.

This article is structured as follows: we first define the notion of an optimal portfolio (in the mean-variance framework) and we then illustrate the concept of optimal portfolio with an example.

Introduction

An investor’s investment portfolio is a collection of assets that he or she possesses. Individual assets such as bonds and equities can be used, as can asset baskets such as mutual funds or exchange-traded funds (ETFs). When constructing a portfolio, investors typically evaluate the expected return as well as the risk. A well-balanced portfolio contains a diverse variety of investments.

An optimal portfolio is a collection of assets that maximizes the trade-off between expected return and risk: the portfolio with the highest expected return for a given level of risk, or the portfolio with the lowest risk for a given level of expected return.

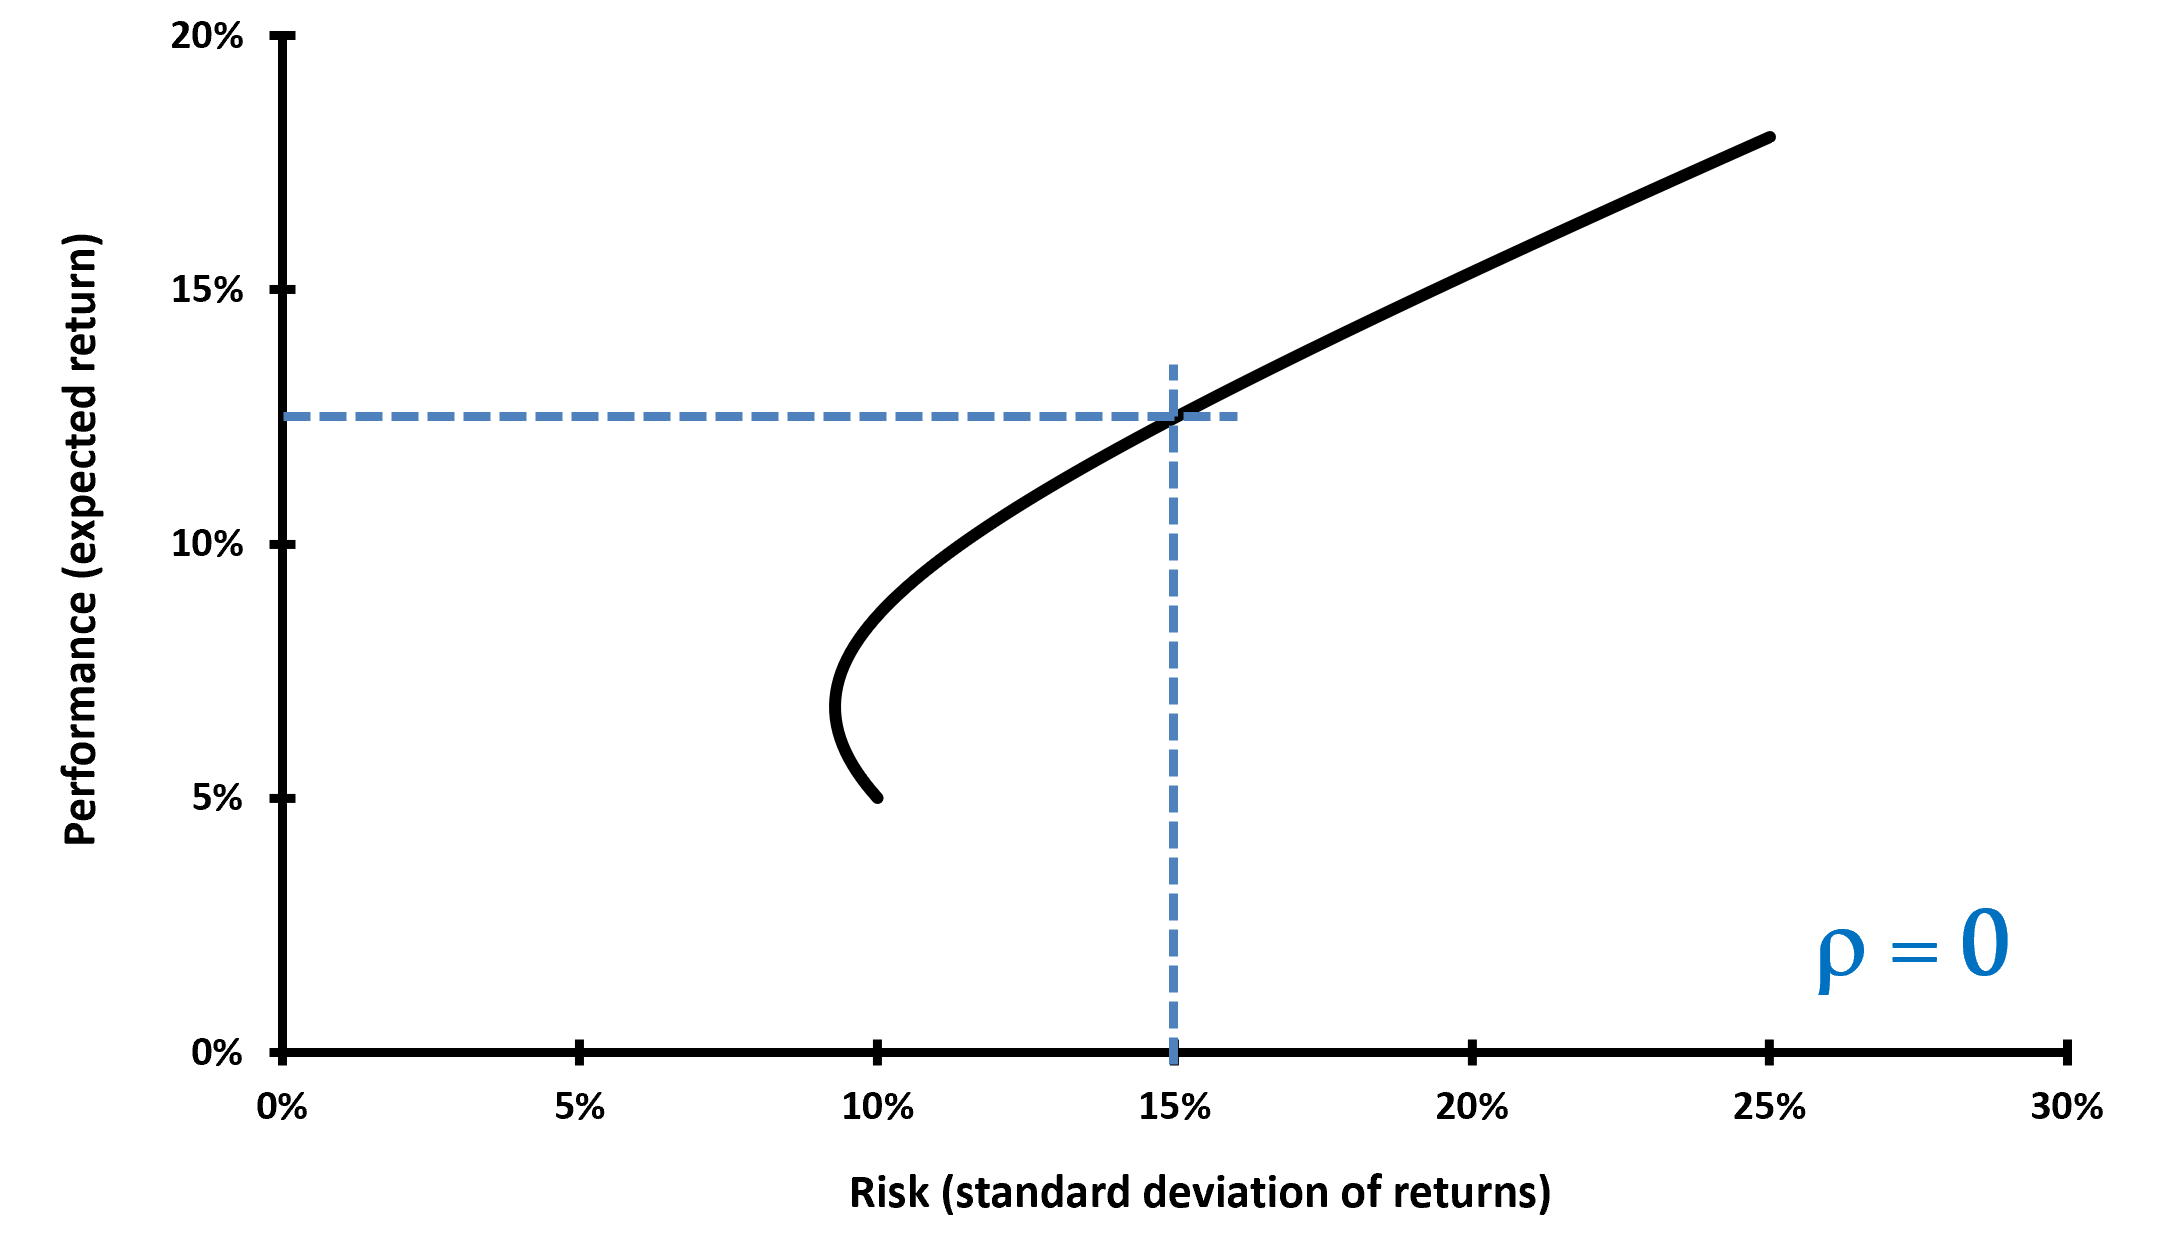
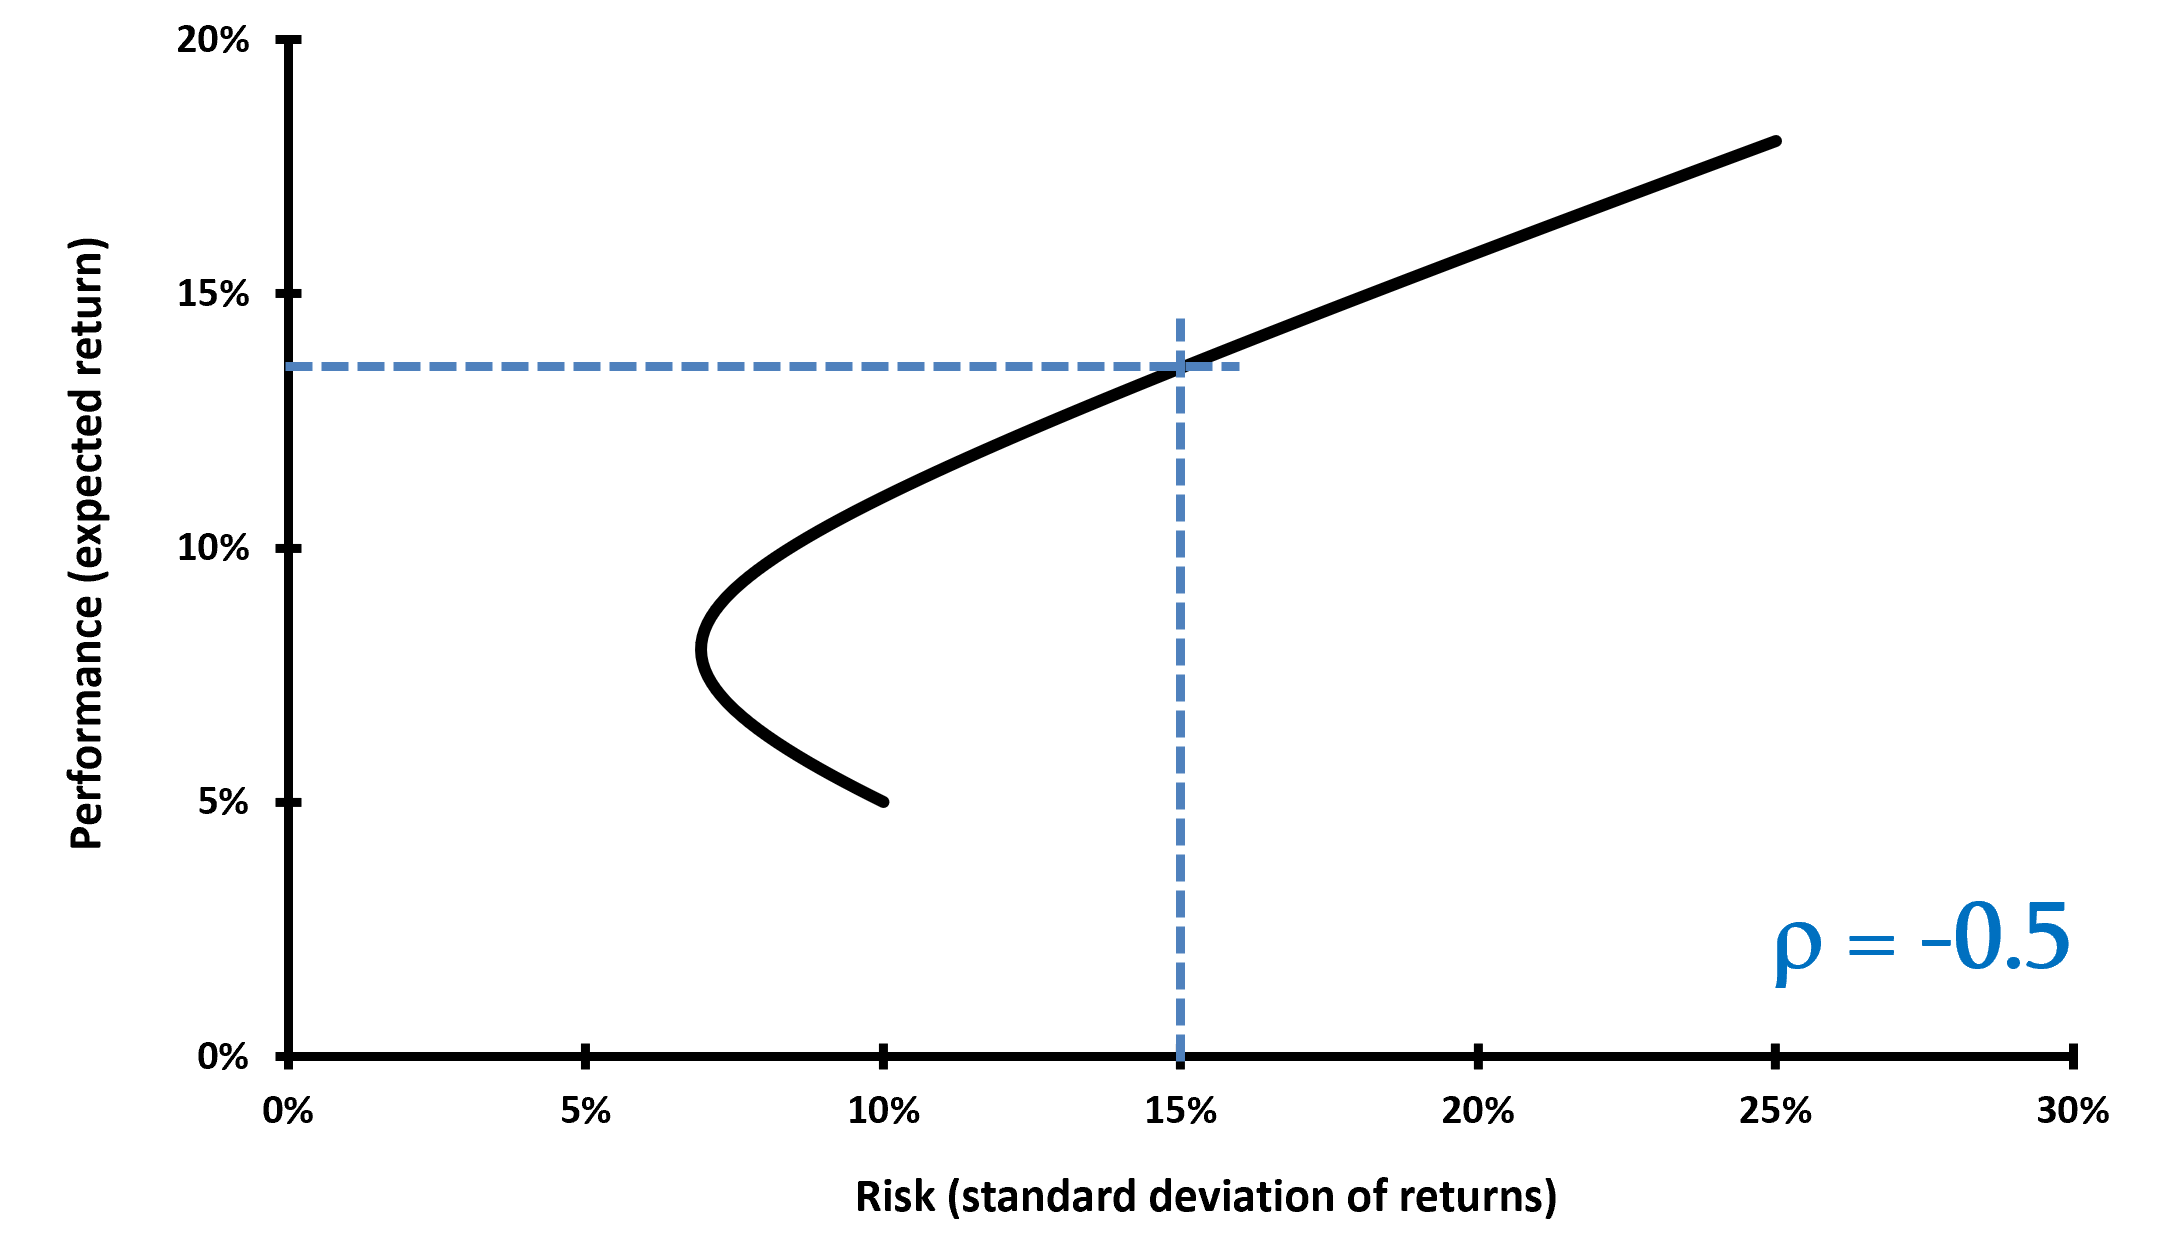
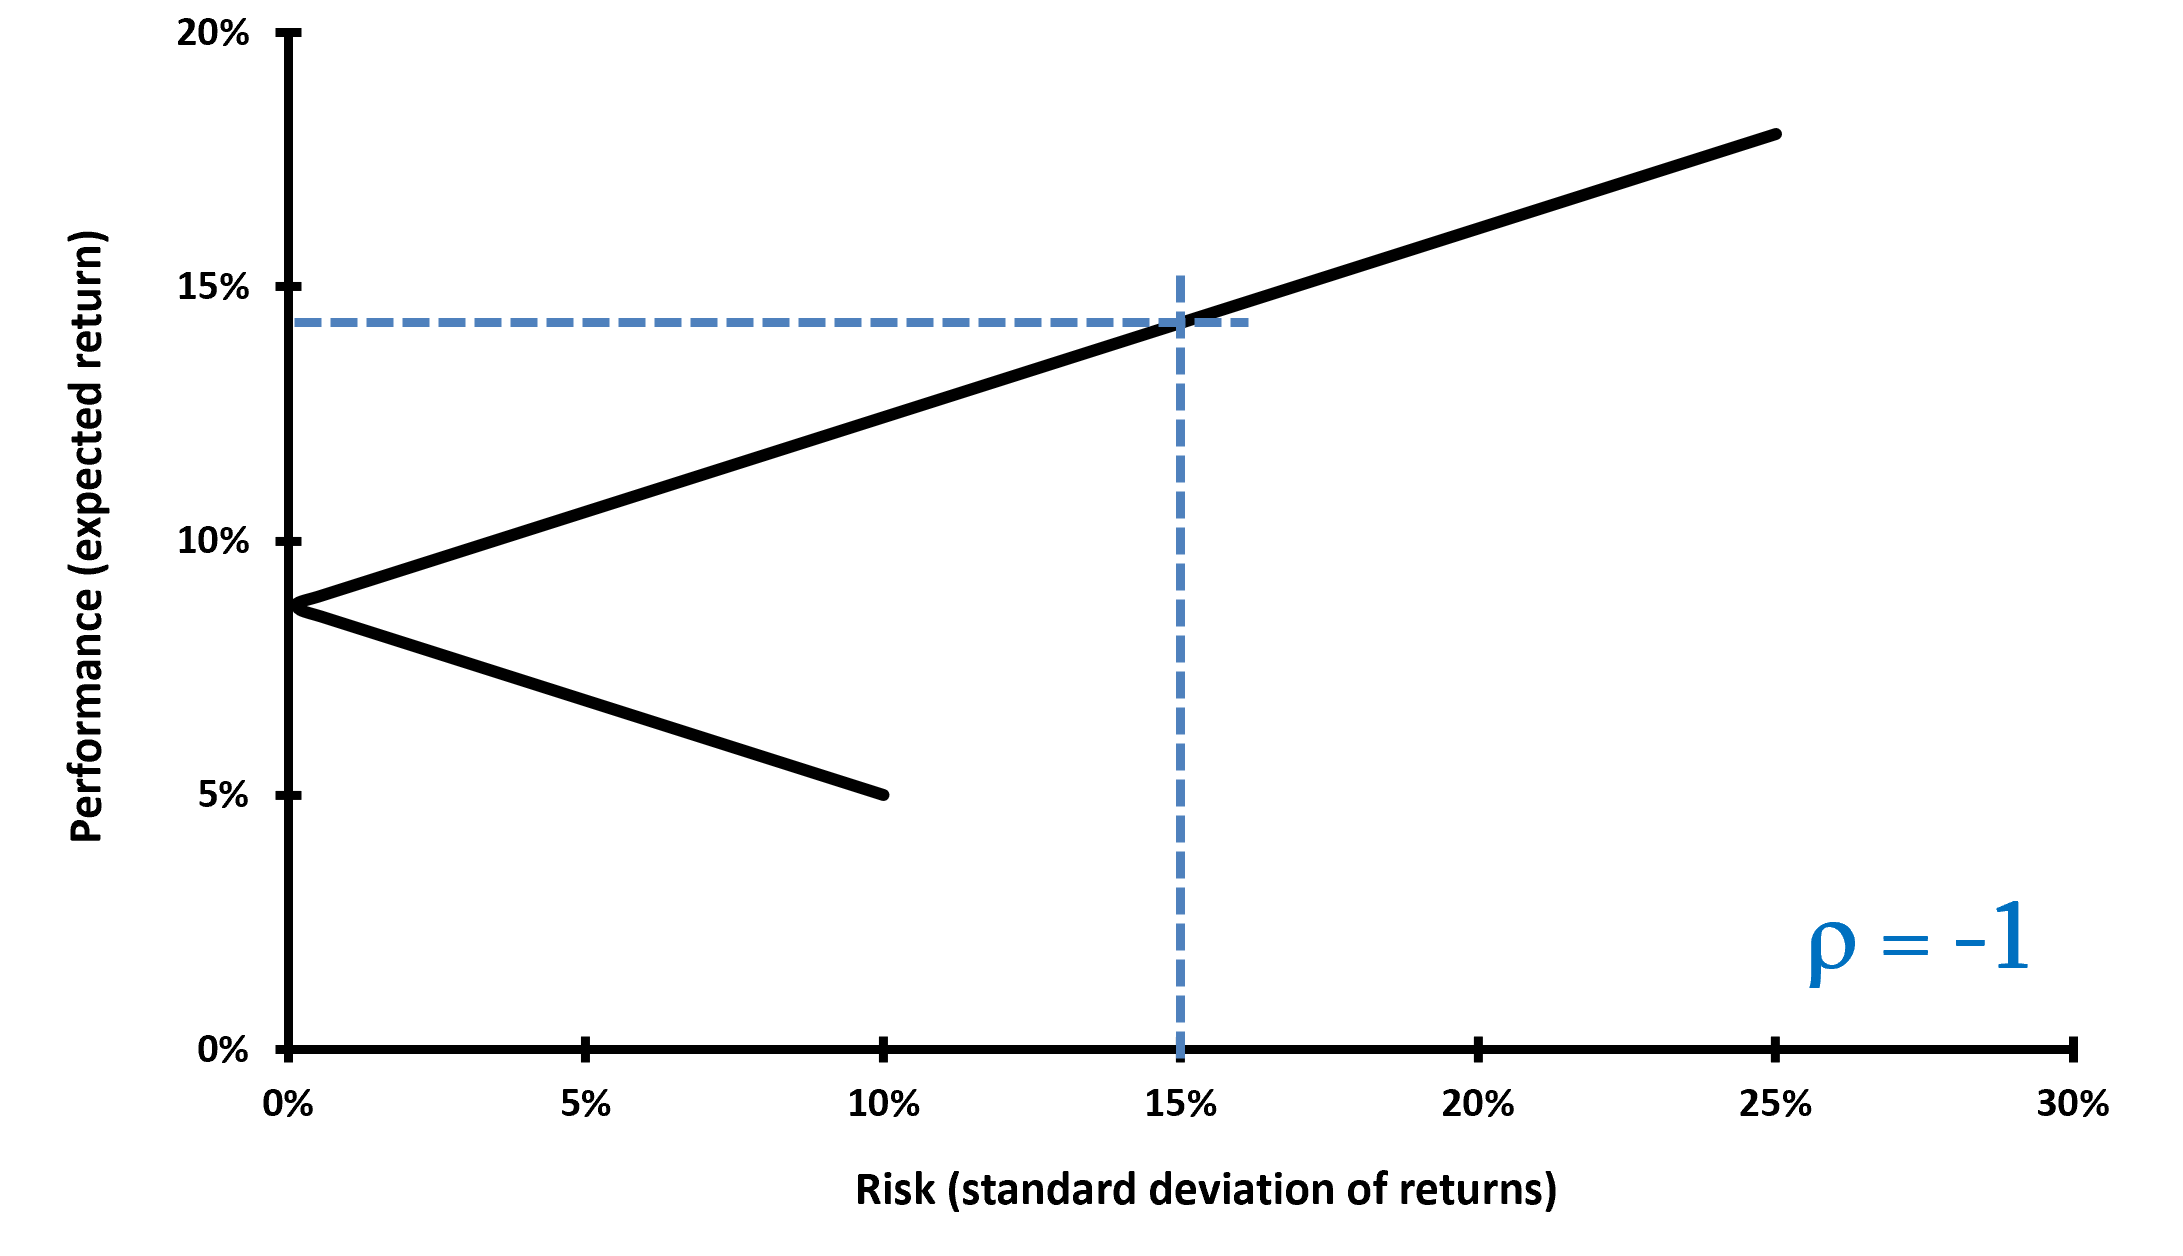
To obtain the optimal portfolio, Markowitz sought to optimize the following dual program:

The first optimization seeks to maximize expected return with respect to a specific level of risk, subject to the short-selling constraint (weights of the portfolio should be equal to one).

img_SimTrade_implementing_Markowitz_2

The second optimization seeks to minimize the variance of the portfolio with respect to a specific level of expected return, subject to the short-selling constraint (weights of the portfolio should be equal to one).

img_SimTrade_implementing_Markowitz

Mathematical foundations

The investment universe is composed of N assets characterized by their expected returns μ and variance-covariance matrix V. For a given level of expected return μP, the Markowitz model gives the composition of the optimal portfolio. The vector of weights of the optimal portfolio is given by the following formula:

img_SimTrade_implementing_Markowitz_1

With the following notations:

  • wP = vector of asset weights of the portfolio
  • μP = desired level of expected return
  • e = identity vector
  • μ = vector of expected returns
  • V = variance-covariance matrix of returns
  • V-1 = inverse of the variance-covariance matrix
  • t = transpose operation for vectors and matrices

A, B and C are intermediate parameters computed below:

img_SimTrade_implementing_Markowitz_2

The variance of the optimal portfolio is computed as follows

img_SimTrade_implementing_Markowitz_3

To calculate the standard deviation of the optimal portfolio, we take the square root of the variance.

Optimal portfolio application: the case of two assets

To create the optimal portfolio, we first obtain monthly historical data for the last two years from Bloomberg for two stocks that will comprise our portfolio: Apple and CMS Energy Corporation. Apple is in the technology area, but CMS Energy Corporation is an American company that is entirely in the energy sector. Apple’s historical return for the two years covered was 41.86%, with a volatility of 35.11%. Meanwhile, CMS Energy Corporation’s historical return was 13.95% with a far lower volatility of 15.16%.

According to their risk and return profiles, Apple is an aggressive stock pick in our example, but CMS Energy is a much more defensive stock that would serve as a hedge in our example. The correlation between the two stocks is 0.19, indicating that they move in the same direction. In this example, we will consider the market portfolio, defined as a theoretical portfolio that reflects the return of the whole investment universe, which is captured by the wide US equities index (S&P500 index).

As captured in Figure 1, CMS Energy suffered less severe losses than Apple. When compared to the red bars, the blue bars are far more volatile and sharp in terms of the size of the move in both directions.

Figure 1. Apple and CMS Energy Corporation return breakdown.
 Time-series regression
Source: computation by the author (Data: Bloomberg)

After analyzing the historical return on both stocks, as well as their volatility and covariance (and correlation), we can use Mean-Variance portfolio optimization to find the optimal portfolio. According to Markowitz’ foundational study on portfolio construction, the optimal portfolio will attempt to achieve the best risk-return trade-off for an investor. After doing the computations, we discover that the optimal portfolio is composed of 45% Apple stock and 55% CMS Energy corporation stock. This portfolio would return 26.51% with a volatility of 19.23%. As captured in Figure 2, the optimal portfolio is higher on the efficient frontier line and has a higher Sharpe ratio (1.27 vs 1.23 for the theoretical market portfolio).

Figure 2. Optimal portfolio.
 Optimal portfolio plot 2 asset
Source: computation by the author (Data: Bloomberg)

You can find below the Excel spreadsheet that complements the example above.

 Optimal portfolio spreadsheet for two assets

Optimal portfolio application: the general case

We generated a large time series to obtain useful results by downloading the equivalent of 23 years of market data from a data provider (in this example, Bloomberg). We generate the variance-covariance matrix after obtaining all necessary statistical data, which includes the expected return and volatility indicated by the standard deviation of the returns for each stock during the provided period. Table 1 depicts the expected return and volatility for each stock retained in this analysis.

Table 1. Asset characteristics of Apple, Amazon, Microsoft, Goldman Sachs, and Pfizer.
img_SimTrade_implementing_Markowitz_spreadsheet_1
Source: computation by the author.

We can start the optimization task by setting a desirable expected return after computing the expected return, volatility, and the variance-covariance matrix of expected return. With the data that is fed into the appropriate cells, the model will complete the optimization task. For a 20% desired expected return, we get the following results (Table 2).

Table 2. Asset weights for an optimal portfolio.
Optimal portfolio case 1
Source: computation by the author.

To demonstrate the effect of diversification in the reduction of volatility, we can form a Markowitz efficient frontier by tilting the desired anticipated return with their relative volatility in a graph. The Markowitz efficient frontier is depicted in Figure 1 for various levels of expected return. We highlighted the portfolio with 20% expected return with its respective volatility in the plot (Figure 3).

Figure 3. Optimal portfolio plot for 5 asset case.
Optimal portfolio case 1
Source: computation by the author.

You can download the Excel file below to use the Markowitz portfolio allocation model.

 Download the Excel file for the optimal portfolio with n asset case

Why should I be interested in this post?

The purpose of portfolio management is to maximize the (expected) returns on the entire portfolio, not just on one or two stocks. By monitoring and maintaining your investment portfolio, you can build a substantial amount of wealth for a variety of financial goals such as retirement planning. This post facilitates comprehension of the fundamentals underlying portfolio construction and investing.

Related posts on the SimTrade blog

   ▶ Youssef LOURAOUI Portfolio

   ▶ Youssef LOURAOUI Factor Investing

   ▶ Youssef LOURAOUI Origin of factor investing

   ▶ Youssef LOURAOUI Markowitz Modern Portfolio Theory

Useful resources

Academic research

Pamela, D. and Fabozzi, F., 2010. The Basics of Finance: An Introduction to Financial Markets, Business Finance, and Portfolio Management. John Wiley and Sons Edition.

Markowitz, H., 1952. Portfolio Selection. The Journal of Finance, 7(1): 77-91.

About the author

The article was written in December 2022 by Youssef LOURAOUI (Bayes Business School, MSc. Energy, Trade & Finance, 2021-2022).

Long-short equity strategy

Youssef LOURAOUI

In this article, Youssef LOURAOUI (Bayes Business School, MSc. Energy, Trade & Finance, 2021-2022) presents the long-short equity strategy, one of pioneer strategies in the hedge fund industry. The goal of the long-short equity investment strategy is to buy undervalued stocks and sell short overvalued ones.

This article is structured as follow: we introduce the long-short strategy principle. Then, we present a practical case study to grasp the overall methodology of this strategy. We conclude with a performance analysis of this strategy in comparison with a global benchmark (MSCI All World Index).

Introduction

According to Credit Suisse, a long-short strategy can be defined as follows: “Long-short equity funds invest on both long and short sides of equity markets, generally focusing on diversifying or hedging across particular sectors, regions, or market capitalizations. Managers have the flexibility to shift from value to growth; small to medium to large capitalization stocks; and net long to net short. Managers can also trade equity futures and options as well as equity related securities and debt or build portfolios that are more concentrated than traditional long-only equity funds.”

This strategy has the particularity of potentially generate returns in both rising and falling markets. However, stock selection is key concern, and the stock picking ability of the fund manager is what makes this strategy profitable (or not!). The trade-off of this approach is to reduce market risk but exchange it for specific risk. Another key characteristic of this type of strategy is that overall, funds relying on long-short are net long in their trading exposure (long bias).

Equity strategies

In the equity universe, we can separate long-short equity strategies into discretionary long-short equity, dedicated short bias, and quantitative.

Discretionary long-short

Discretionary long-short equity managers typically decide whether to buy or sell stocks based on a basic review of the value of each firm, which includes evaluating its growth prospects and comparing its profitability to its valuation. By visiting managers and firms, these fund managers also evaluate the management of the company. Additionally, they investigate the accounting figures to judge their accuracy and predict future cash flows. Equity long-short managers typically predict on particular companies, but they can also express opinions on entire industries.

Value investors, a subset of equity managers, concentrate on acquiring undervalued companies and holding these stocks for the long run. A good illustration of a value investor is Warren Buffett. Since companies only become inexpensive when other investors stop investing in them, putting this trading approach into practice frequently entails being a contrarian (buy assets after a price decrease). Because of this, cheap stocks are frequently out of favour or purchased while others are in a panic. Traders claim that deviating from the standard is more difficult than it seems.

Dedicated short bias

Like equity long-short managers, dedicated short bias is a trading technique that focuses on identifying companies to sell short. Making a prediction that the share price will decline is known as short selling. Similar to how purchasing stock entails profiting if the price increases, holding a short position entail profiting if the price decreases. Dedicated short-bias managers search for companies that are declining. Since dedicated short-bias managers are working against the prevailing uptrend in markets since stocks rise more frequently than they fall (this is known as the equity risk premium), they make up a very small proportion of hedge funds.

Most hedge funds in general, as well as almost all equity long-short hedge funds and dedicated short-bias hedge funds, engage in discretionary trading, which refers to the trader’s ability to decide whether to buy or sell based on his or her judgement and an evaluation of the market based on past performance, various types of information, intuition, and other factors.

Quantitative

The quantitative investment might be seen as an alternative to this traditional style of trading. Quants create systems that methodically carry out the stated definitions of their trading rules. They use complex processing of ideas that are difficult to analyse using non-quantitative methods to gain a slight advantage on each of the numerous tiny, diversified trades. To accomplish this, they combine a wealth of data with tools and insights from a variety of fields, including economics, finance, statistics, mathematics, computer science, and engineering, to identify relationships that market participants may not have immediately fully incorporated in the price. Quantitative traders use computer systems that use these relationships to generate trading signals, optimise portfolios considering trading expenses, and execute trades using automated systems that send hundreds of orders every few seconds. In other words, data is fed into computers that execute various programmes under the supervision of humans to conduct trading (Pedersen, 2015).

Example of a long-short equity strategy

The purpose of employing a long-short strategy is to profit in both bullish and bearish markets. To measure the profitability of this strategy, we implemented a long-short strategy from the beginning of January 2022 to June 2022. In this time range, we are long Exxon Mobile stock and short Tesla. The data are extracted from the Bloomberg terminal. The strategy of going long Exxon Mobile and short Tesla is purely educational. This strategy’s basic idea is to profit from rising oil prices (leading to a price increase for Exxon Mobile) and rising interest rates (leading to a price decrease for Tesla). Over the same period, the S&P 500 index has dropped 23%, while the Nasdaq Composite has lost more than 30%. The Nasdaq Composite is dominated by rapidly developing technology companies that are especially vulnerable to rising interest rates.

Overall, the market’s net exposure is zero because we are 100% long Exxon Mobile and 100% short Tesla stock. This strategy succeeded to earn significant returns in both the long and short legs of the trade over a six-month timeframe. It yielded a 99.5 percent return, with a 36.8 percent gain in the value of the Exxon Mobile shares and a 62.8 percent return on the short Tesla position. Figure 1 shows the overall performance of each equity across time.

Figure 1. Long-short equity strategy performance over time
 Time-series regression
Source: computation by the author (Data: Bloomberg)

You can find below the Excel spreadsheet that complements the example above.

 Download the Excel file to analyse a long-short equity strategy

Performance of the long-short equity strategy

To capture the performance of the long-short equity strategy, we use the Credit Suisse hedge fund strategy index. To establish a comparison between the performance of the global equity market and the long-short hedge fund strategy, we examine the rebased performance of the Credit Suisse index with respect to the MSCI All-World Index. Over a period from 2002 to 2022, the long-short equity strategy index managed to generate an annualised return of 5.96% with an annualised volatility of 7.33%, leading to a Sharpe ratio of 0.18. Over the same period, the MSCI All World Index managed to generate an annualised return of 6.00% with an annualised volatility of 15.71%, leading to a Sharpe ratio of 0.11. The low correlation of the long-short equity strategy with the MSCI All World Index is equal to 0.09, which is closed to zero. Overall, the Credit Suisse hedge fund strategy index performed somewhat slightly worse than the MSCI All World Index, but presented a much lower volatility leading to a higher Sharpe ratio (0.18 vs 0.11).

Figure 2. Performance of the long-short equity strategy compared to the MSCI All-World Index across time.
 Time-series regression
Source: computation by the author (Data: Bloomberg)

You can find below the Excel spreadsheet that complements the explanations about the Credit Suisse hedge fund strategy index.

 Download the Excel file to perform a Fama-MacBeth regression method with N-asset

Why should I be interested in this post?

Long-short funds seek to reduce negative risk while increasing market upside. They might, for example, invest in inexpensive stocks that the fund managers believe will rise in price while simultaneously shorting overvalued stocks to cut losses. Other strategies used by long-short funds to lessen market volatility include leverage and derivatives. Understanding the profits and risks of such a strategy might assist investors in incorporating this hedge fund strategy into their portfolio allocation.

Related posts on the SimTrade blog

   ▶ Youssef LOURAOUI Introduction to Hedge Funds

   ▶ Youssef LOURAOUI Portfolio

Useful resources

Academic research

Pedersen, L. H., 2015. Efficiently Inefficient: How Smart Money Invests and Market Prices Are Determined. Princeton University Press.

Business Analysis

BlackRock Long-short strategy

BlackRock Investment Outlook

Credit Suisse Hedge fund strategy

Credit Suisse Hedge fund performance

Credit Suisse Long-short strategy

Credit Suisse Long-short performance benchmark

About the author

The article was written in December 2022 by Youssef LOURAOUI (Bayes Business School, MSc. Energy, Trade & Finance, 2021-2022).

Fama-MacBeth two-step regression method: the case of K risk factors

Fama-MacBeth two-step regression method: the case of K risk factors

Youssef LOURAOUI

In this article, Youssef LOURAOUI (Bayes Business School, MSc. Energy, Trade & Finance, 2021-2022) presents the Fama-MacBeth two-step regression method used to test asset pricing models in the case of K risk factors.

This article is structured as follows: we introduce the Fama-MacBeth two-step regression method. Then, we present the mathematical foundation that underpins their approach for K risk factors. We provide an illustration for the 3-factor mode developed by Fama and French (1993).

Introduction

Risk factors are frequently employed to explain asset returns in asset pricing theories. These risk factors may be macroeconomic (such as consumer inflation or unemployment) or microeconomic (such as firm size or various accounting and financial metrics of the firms). The Fama-MacBeth two-step regression approach found a practical way for measuring how correctly these risk factors explain asset or portfolio returns. The aim of the model is to determine the risk premium associated with the exposure to these risk factors.

The first step is to regress the return of every asset against one or more risk factors using a time-series approach. We obtain the return exposure to each factor called the “betas” or the “factor exposures” or the “factor loadings”.

The second step is to regress the returns of all assets against the asset betas obtained in Step 1 using a cross-section approach. We obtain the risk premium for each factor. Then, Fama and MacBeth assess the expected premium over time for a unit exposure to each risk factor by averaging these coefficients once for each element.

Mathematical foundations

We describe below the mathematical foundations for the Fama-MacBeth regression method for a K-factor application. In the analysis, we investigated the Fame-French three factor model in order to understand their significance as a fundamental driver of returns for investors under the Fama-MacBeth framework.

The model considers the following inputs:

  • The return of N assets denoted by Ri for asset i observed every day over the time period [0, T].
  • The risk factors denoted by Fk for k equal from 1 to K.

Step 1: time-series analysis of returns

For each asset i from 1 to N, we estimate the following linear regression model:

Fama-French time-series regression

From this model, we obtain the βi, Fk which is the beta associated with the kth risk factor.

Step 2: cross-sectional analysis of returns

For each period t from 1 to T, we estimate the following linear regression model:

Fama-French cross-sectional regression

Application: the Fama-French 3-Factor model

The Fama-French 3-factor model is an illustration of Fama-MacBeth two-step regression method in the case of K risk factors (K=3). The three factors are the market (MKT) factor, the small minus big (SMB) factor, and the high minus low (HML) factor. The SMB factor measures the difference in expected returns between small and big firms (in terms of market capitalization). The HML factor measures the difference in expected returns between value stocks and growth stock.

The model considers the following inputs:

  • The return of N assets denoted by Ri for asset i observed every day over the time period [0, T].
  • The risk factors denoted by FMKT associated to the MKT risk factor, FSMB associated to the MKT risk factor which measures the difference in expected returns between small and big firms (in terms of market capitalization) and FHML associated to 𝐻𝑀𝐿 (“High Minus Low”) which measures the difference in expected returns between value stocks and growth stock

Step 1: time-series regression

img_SimTrade_Fama_French_time_series_regression

Step 2: cross-sectional regression

img_SimTrade_Fama_French_cross_sectional_regression

Figure 1 represents for a given period the cross-sectional regression of the return of all individual assets with respect to their estimated individual beta for the MKT factor.

Figure 1. Cross-sectional regression for the market factor.
 Cross-section regression for the MKT factor Source: computation by the author.

Figure 2 represents for a given period the cross-sectional regression of the return of all individual assets with respect to their estimated individual beta for the SMB factor.

Figure 2. Cross-sectional regression for the SMB factor.
 Cross-section regression for the SMB factor Source: computation by the author.

Figure 3 represents for a given period the cross-sectional regression of the return of all individual assets with respect to their estimated individual beta for the SMB factor.

Figure 3. Cross-sectional regression for the HML factor.
 Cross-section regression for the HML factor Source: computation by the author.

Empirical study of the Fama-MacBeth regression

Fama-MacBeth seminal paper (1973) was based on an analysis of the market factor by assessing constructed portfolios of similar betas ranked by increasing values. This approach helped to overcome the shortcoming regarding the stability of the beta and correct for conditional heteroscedasticity derived from the computation of the betas for individual stocks. They performed a second time the cross-sectional regression of monthly portfolio returns based on equity betas to account for the dynamic nature of stock returns, which help to compute a robust standard error and assess if there is any heteroscedasticity in the regression. The conclusion of the seminal paper suggests that the beta is “dead”, in the sense that it cannot explain returns on its own (Fama and MacBeth, 1973).

Empirical study: Stock approach for a K-factor model

We collected a sample of 440 significant firms’ end-of-day stock prices in the US economy from January 3, 2012 to December 31, 2021. We calculated daily returns for each stock as well as the factor used in this analysis. We chose the S&P500 index to represent the market since it is an important worldwide stock benchmark that captures the US equities market.

Time-series regression

To assess the multi-factor regression, we used the Fama-MacBeth 3-factor model as the main factors assessed in this analysis. We regress the average returns for each stock against their factor betas. The first regression is statistically tested. This time-series regression is run on a subperiod of the whole period from January 03, 2012, to December 31, 2018. We use a t-statistic to explain the regression’s behavior. Because the p-value is in the rejection zone (less than the significance level of 5%), we can conclude that the factors can first explain an investor’s returns. However, as we will see later in the article, when we account for a second regression as proposed by Fama and MacBeth, the factors retained in this analysis are not capable of explaining the return on asset returns on its own. The stock approach produces statistically significant results in time-series regression at 10%, 5%, and even 1% significance levels. As shown in Table 1, the p-value is in the rejection range, indicating that the factors are statistically significant.

Table 1. Time-series regression t-statistic result.
 Cross-section regression Source: computation by the author.

Cross-sectional regression

Over a second period from January 04, 2019, to December 31, 2021, we compute the dynamic regression of returns at each data point in time with respect to the betas computed in Step 1.

That being said, when the results are examined using cross-section regression, they are not statistically significant, as indicated by the p-value in Table 2. We are unable to reject the null hypothesis. The premium investors are evaluating cannot be explained solely by the factors assessed. This suggests that factors retained in the analysis fail to adequately explain the behavior of asset returns. These results are consistent with the Fama-MacBeth article (1973).

Table 2. Cross-section regression t-statistic result.
Source: computation by the author.

Excel file

You can find below the Excel spreadsheet that complements the explanations covered in this article.

 Download the Excel file to perform a Fama-MacBeth regression method with K-asset

Why should I be interested in this post?

Fama-MacBeth made a significant contribution to the field of econometrics. Their findings cleared the way for asset pricing theory to gain traction in academic literature. The Capital Asset Pricing Model (CAPM) is far too simplistic for a real-world scenario since the market factor is not the only source that drives returns; asset return is generated from a range of factors, each of which influences the overall return. This framework helps in capturing other sources of return.

Related posts on the SimTrade blog

   ▶ Youssef LOURAOUI Fama-MacBeth regression method: stock and portfolio approach

   ▶ Youssef LOURAOUI Fama-MacBeth regression method: Analysis of the market factor

   ▶ Jayati WALIA Capital Asset Pricing Model (CAPM)

   ▶ Youssef LOURAOUI Security Market Line (SML)

   ▶ Youssef LOURAOUI Origin of factor investing

   ▶ Youssef LOURAOUI Factor Investing

Useful resources

Academic research

Brooks, C., 2019. Introductory Econometrics for Finance (4th ed.). Cambridge: Cambridge University Press. doi:10.1017/9781108524872

Fama, E. F., MacBeth, J. D., 1973. Risk, Return, and Equilibrium: Empirical Tests. Journal of Political Economy, 81(3), 607–636.

Roll R., 1977. A critique of the Asset Pricing Theory’s test, Part I: On Past and Potential Testability of the Theory. Journal of Financial Economics, 1, 129-176.

American Finance Association & Journal of Finance (2008) Masters of Finance: Eugene Fama (YouTube video)

About the author

The article was written in December 2022 by Youssef LOURAOUI (Bayes Business School, MSc. Energy, Trade & Finance, 2021-2022).

Fama-MacBeth regression method: the stock approach vs the portfolio approach

Fama-MacBeth regression method: the stock approach vs the portfolio approach

Youssef_Louraoui

In this article, Youssef LOURAOUI (Bayes Business School, MSc. Energy, Trade & Finance, 2021-2022) presents the Fama-MacBeth regression method used to test asset pricing models and addresses the difference when applying the regression method on individual stocks or portfolios composed of stocks with similar betas.

This article is structured as follow: we introduce the Fama-MacBeth testing method. Then, we present the mathematical foundation that underpins their approach. We conduct an empirical analysis on both the stock and the portfolio approach. We conclude with a discussion on econometric issues.

Introduction

Risk factors are frequently employed to explain asset returns in asset pricing theories. These risk factors may be macroeconomic (such as consumer inflation or unemployment) or microeconomic (such as firm size or various accounting and financial metrics of the firms). The Fama-MacBeth two-step regression approach found a practical way for measuring how correctly these risk factors explain asset or portfolio returns. The aim of the model is to determine the risk premium associated with the exposure to these risk factors.

As a reminder, the Fama-MacBeth regression method is composed on two steps: step 1 with a time-series regression and step 2 with a cross-section regression.

The first step is to regress the return of every stock against one or more risk factors using a time-series regression. We obtain the return exposure to each factor called the “betas” or the “factor exposures” or the “factor loadings”.

The second step is to regress the returns of all stocks against the asset betas obtained in the first step using a cross-section regression for different periods. We obtain the risk premium for each factor used to test the asset pricing model.

The implementation of this method can be done with individual stocks or with portfolios of stocks as proposed by Fama and MacBeth (1973). Their argument is the better stability of the beta when considering portfolios. In this article we illustrate the difference with the two implementations.

Fama and MacBeth (1973) implemented with individual stocks

We downloaded a sample of daily prices of stocks composing the S&P500 index over the period from January 03, 2012, to December 31, 2021 (we selected the stocks present from the beginning to the end of the period reducing our sample from 500 to 440 stocks). We computed daily returns for each stock and for the market factor retained in this study. To represent the market, we chose the S&P500 index, an important global stock benchmark capturing the US equity market.

The procedure to derive the Fama-MacBeth regression using the stock approach can be achieved as follow:

Step 1: time-series regression

We compute the beta of the stocks with respect to the market factor for the period covered (time-series regression). We estimate the beta of each stock related to the S&P500 index. The beta is computed as the slope of the linear regression of the stock return on the market return (S&P500 index return). This time-series regression is run on a subperiod of the whole period from January 03, 2012, to December 31, 2018.

Step 2: cross-sectional regression

Over a second period from January 04, 2019, to December 31, 2021, we compute the dynamic regression of returns at each data point in time with respect to the betas computed in Step 1.

With this procedure, we obtain a risk premium that would represent the relationship between the stock returns at each data point in time with their respective beta for the sample analyzed.

Test the statistical significance of the results obtained from the regression

Results in the time-series regression using the stock approach are statistically significant. As shown in Table 1, the p-value is in the rejection area, which implies that the factor that the market factor can be considered as a driver of return.

Table 1. Time-series regression t-statistic result.
img_SimTrade_Fama_MacBeth_cross_sectional_regression_stat_result Source: computation by the author.

However, when analyzed in the cross-section regression, the results are not statistically significant anymore. As shown in Table 2, the p-value is not in the rejection area. We cannot reject the null hypothesis (H0: non significance of the market factor). Market factor alone cannot explain the premium investors are considering.
This means that the market factor fails to explain properly the behavior of asset returns, which undermines the validity of the CAPM framework. These results are in line with the Fama-MacBeth paper (1973).

Table 2. Cross-section regression t-statistic result.
img_SimTrade_Fama_MacBeth_cross_sectional_regression_stat_resultSource: computation by the author.

You can find below the Excel spreadsheet that complements the explanations covered in this part of the article (implementation of the Fama and MacBeth (1973) method with individual stocks).

 Download the Excel file to perform a Fama-MacBeth two-step regression method using the stock approach

Fama and MacBeth (1973) implemented with portfolios of stocks

Fama-MacBeth seminal paper (1973) was based on an analysis of the market factor by assessing constructed portfolios of similar betas ranked by increasing values. This approach helped to overcome the shortcoming regarding the stability of the beta and correct for conditional heteroscedasticity derived from the computation of the betas for individual stocks. They performed a second time the cross-sectional regression of monthly portfolio returns based on equity betas to account for the dynamic nature of stock returns, which help to compute a robust standard error and assess if there is any heteroscedasticity in the regression. The conclusion of the seminal paper suggests that the beta is “dead”, in the sense that it cannot explain returns on its own (Fama and MacBeth, 1973).

The procedure to derive the Fama-MacBeth regression using the portfolio approach can be achieved as follow:

Step 1: time-series regression

We first compute the beta of the stocks with respect to the market factor for the period covered (time-series regression). We estimate the beta of each stock related to the S&P500 index. The beta is computed as the slope of the linear regression of the stock return on the market return (S&P500 index return). This time-series regression is run on a subperiod of the whole period from January 03, 2012, to December 31, 2015. We build twenty portfolios based on stock betas ranked in ascending order. The betas of the portfolios are then estimated again on a subperiod from January 04, 2016, to December 31, 2018.

It is challenging to maintain beta stability over time. Fama-MacBeth aimed to remedy this shortcoming through its novel technique. However, some issues must be addressed. When betas are calculated using a monthly time series, the statistical noise in the time series is significantly reduced in comparison to shorter time frames (i.e., daily observation). When portfolio betas are constructed, the coefficient becomes considerably more stable than when individual betas are evaluated. This is due to the diversification impact that a portfolio can produce, which considerably reduces the amount of specific risk.

Step 2: cross-sectional regression

Over a second period from January 03, 2019, to December 31, 2021, we compute the dynamic regression of portfolio returns at each data point in time with respect to the betas computed in Step 1.

With this procedure, we obtain a risk premium that would represent the relationship between the portfolio returns at each data point in time with their respective beta for the sample analyzed.

Test the statistical significance of the results obtained from the regression

Results in the cross-section regression using the portfolio approach are not statistically significant. As captured in Table 3, the p-value is not in the rejection area, which implies that the factor is statistically insignificant and that the market factor cannot be considered as a driver of return.

Table 3. Cross-section regression with portfolio approach t-statistic result.
img_SimTrade_Fama_MacBeth_Portfolio_cross_sectional_regression_stat_result Source: computation by the author.

You can find below the Excel spreadsheet that complements the explanations covered in this part of the article (implementation of the Fama and MacBeth (1973) method with portfolios of stocks).

 Download the Excel file to perform a Fama-MacBeth regression method using the portfolio approach

Econometric issues

Errors in data measurement

Because regression uses a sample instead of the entire population, a certain margin of error must be accounted for since the authors derive estimated betas for the sample.

Asset return heteroscedasticity

In econometrics, heteroscedasticity is an important concern since it results in unequal residual variance. This indicates that a time series exhibiting some heteroscedasticity has a non-constant variance, which renders forecasting ineffective because the time series will not revert to its long-run mean.

Asset return autocorrelation

Standard errors in Fama-MacBeth regressions are solely corrected for cross-sectional correlation. This method does not fix the standard errors for time-series autocorrelation. This is typically not a concern for stock trading, as daily and weekly holding periods have modest time-series autocorrelation, whereas autocorrelation is larger over long horizons. This suggests that Fama-MacBeth regression may not be applicable in many corporate finance contexts where project holding durations are typically lengthy.

Why should I be interested in this post?

Fama-MacBeth made a significant contribution to the field of econometrics. Their findings cleared the way for asset pricing theory to gain traction in academic literature. The Capital Asset Pricing Model (CAPM) is far too simplistic for a real-world scenario since the market factor is not the only source that drives returns; asset return is generated from a range of factors, each of which influences the overall return. This framework helps in capturing other sources of return.

Related posts on the SimTrade blog

   ▶ Youssef LOURAOUI Fama-MacBeth regression method: N-factors application

   ▶ Youssef LOURAOUI Fama-MacBeth regression method: Analysis of the market factor

   ▶ Jayati WALIA Capital Asset Pricing Model (CAPM)

   ▶ Youssef LOURAOUI Security Market Line (SML)

   ▶ Youssef LOURAOUI Origin of factor investing

   ▶ Youssef LOURAOUI Factor Investing

Useful resources

Academic research

Brooks, C., 2019. Introductory Econometrics for Finance (4th ed.). Cambridge: Cambridge University Press. doi:10.1017/9781108524872

Fama, E. F., MacBeth, J. D., 1973. Risk, Return, and Equilibrium: Empirical Tests. Journal of Political Economy, 81(3), 607–636.

Roll R., 1977. A critique of the Asset Pricing Theory’s test, Part I: On Past and Potential Testability of the Theory. Journal of Financial Economics, 1, 129-176.

American Finance Association & Journal of Finance (2008) Masters of Finance: Eugene Fama (YouTube video)

About the author

The article was written in December 2022 by Youssef LOURAOUI (Bayes Business School, MSc. Energy, Trade & Finance, 2021-2022).

Fama-MacBeth regression method: Analysis of the market factor

Youssef_Louraoui

In this article, Youssef LOURAOUI (Bayes Business School, MSc. Energy, Trade & Finance, 2021-2022) presents the Fama-MacBeth two-step regression method used to test asset pricing models. The seminal paper by Fama and MacBeth (1973) was based on an investigation of the market factor by evaluating portfolios of stocks with similar betas. In this article I will elaborate on the methodology and assess the statistical significance of the market factor as a fundamental driver of return.

This article is structured as follow: we introduce the Fama-MacBeth testing method used in asset pricing. Then, we present the mathematical foundation that underpins their approach. I then apply the Fama-MacBeth to recent US stock market data. Finally, I expose the limitations of their approach and conclude to discuss the generalization of the original study to other risk factors.

Introduction

The two-step regression method proposed by Fama-MacBeth was originally used in asset pricing to test the Capital Asset Pricing Model (CAPM). In this model, there is only one risk factor determining the variability of returns: the market factor.

The first step is to regress the return of every asset against the risk factor using a time-series approach. We obtain the return exposure to the factor called the “beta” or the “factor exposure” or the “factor loading”.

The second step is to regress the returns of all assets against the asset betas obtained in Step 1 during a given time period using a cross-section approach. We obtain the risk premium associated with the market factor. Then, Fama and MacBeth (1973) assess the expected premium over time for a unit exposure to the risk factor by averaging these coefficients once for each element.

Mathematical foundations

We describe below the mathematical foundations for the Fama-MacBeth two-step regression method.

Step 1: time-series analysis of returns

The model considers the following inputs:

  • The return of N assets denoted by Ri for asset i observed over the time period [0, T].
  • The risk factor denoted by F for the market factor impacting the asset returns.

For each asset i (for i varying from 1 to N) we estimate the following time-series linear regression model:

Fama MacBeth time-series regression

From this model, we obtain the following coefficients: αi and βi which are specific to asset i.

Figure 1 represents for a given asset (Apple stocks) the regression of its return with respect to the S&P500 index return (representing the market factor in the CAPM). The slope of the regression line corresponds to the beta of the regression equation.

Figure 1. Step 1: time-series regression for a given asset (Apple stock and the S&P500 index).
 Time-series regression Source: computation by the author.

Step 2: cross-sectional analysis of returns

For each period t (from t equal 1 to T), we estimate the following cross-section linear regression model:

Fama MacBeth cross-section regression

Figure 2 plots for a given period the cross-sectional returns and betas for a given point in time.

Figure 2 represents for a given period the regression of the return of all individual assets with respect to their estimated individual market beta.

Figure 2. Step 2: cross-section regression for a given time-period.
Cross-section regression
Source: computation by the author.

We average the gamma obtained for each data point. This is the way the Fama-MacBeth method is used to test asset pricing models.

Empirical study of the Fama-MacBeth regression

The seminal paper by Fama and MacBeth (1973) was based on an analysis of the market factor by assessing constructed portfolios of similar betas ranked by increasing values. This approach helped to overcome the shortcoming regarding the stability of the beta and correct for conditional heteroscedasticity derived from the computation of the betas for individual stocks. They performed a second time the cross-sectional regression of monthly portfolio returns based on equity betas to account for the dynamic nature of stock returns, which help to compute a robust standard error and assess if there is any heteroscedasticity in the regression. The conclusion of the seminal paper suggests that the beta is “dead”, in the sense that it cannot explain returns on its own (Fama and MacBeth, 1973).

Empirical study: Stock approach

We downloaded a sample of end-of-month stock prices of large firms in the US economy over the period from March 31, 2016, to March 31, 2022. We computed monthly returns. To represent the market, we chose the S&P500 index.

We then applied the Fama-MacBeth two-step regression method to test the market factor (CAPM).

Figure 3 depicts the computation of average returns and the betas and stock in the analysis.

Figure 3. Computation of average returns and betas of the stocks.
img_SimTrade_Fama_MacBeth_method_4 Source: computation by the author.

Figure 4 represents the first step of the Fama-MacBeth regression. We regress the average returns for each stock with their respective betas.

Figure 4. Step 1 of the regression: Time-series analysis of returns
img_SimTrade_Fama_MacBeth_method_1 Source: computation by the author.

The initial regression is statistically evaluated. To describe the behavior of the regression, we employ a t-statistic. Since the p-value is in the rejection area (less than the significance limit of 5 percent), we can deduce that the market factor can at first explain the returns of an investor. However, as we are going deal in the later in the article, when we account for a second regression as formulated by Fama and MacBeth (1973), the market factor is not capable of explaining on its own the return of asset returns.

Figure 5 represents Step 2 of the Fama-MacBeth regression, where we perform for a given data point a regression of all individual stock returns with their respective estimated market beta.

Figure 5. Step 2: cross-sectional analysis of return.
img_SimTrade_Fama_MacBeth_method_2 Source: computation by the author.

Figure 6 represents the hypothesis testing for the cross-sectional regression. From the results obtained, we can clearly see that the p-value is not in the rejection area (at a 5% significance level), hence we cannot reject the null hypothesis. This means that the market factor fails to explain properly the behavior of asset returns, which undermines the validity of the CAPM framework. These results are in line with Fama-MacBeth (1973).

Figure 6. Hypothesis testing of the cross-sectional regression.
img_SimTrade_Fama_MacBeth_method_1 Source: computation by the author.

Excel file for the Fama-MacBeth two-step regression method

You can find below the Excel spreadsheet that complements the explanations covered in this article to implement the Fama-MacBeth two-step regression method.

 Download the Excel file to perform a Fama-MacBeth two-step regression method

Limitations of the Fama-McBeth approach

Selection of the market index

For the CAPM to be valid, we need to determine if the market portfolio is in the Markowitz efficient curve. According to Roll (1977), the market portfolio is not observable because it cannot capture all the asset classes (human capital, art, and real estate among others). He then believes that the returns cannot be captured effectively and hence makes the market portfolio, not a reliable factor in determining its efficiency.

Furthermore, the coefficients estimated in the time-series regressions are sensitive to the market index chosen for the study. These shortcomings must be taken into account when assessing CAPM studies.

Stability of the coefficients

The beta of individual assets are not stable over time. Fama and MacBeth attempted to address this shortcoming by implementing an innovative approach.

When betas are computed using a monthly time-series, the statistical noise of the time series is considerably reduced as opposed to shorter time frames (i.e., daily observation).

Using portfolio betas makes the coefficient much more stable than using individual betas. This is due to the diversification effect that a portfolio can achieve, reducing considerably the amount of specific risk.

Conclusion

Risk factors are frequently employed to explain asset returns in asset pricing theories. These risk factors may be macroeconomic (such as consumer inflation or unemployment) or microeconomic (such as firm size or various accounting and financial metrics of the firms). The Fama-MacBeth two-step regression approach found a practical way for measuring how correctly these risk factors explain asset or portfolio returns. The aim of the model is to determine the risk premium associated with the exposure to these risk factors.

Why should I be interested in this post?

Fama-MacBeth made a significant contribution to the field of econometrics. Their findings cleared the way for asset pricing theory to gain traction in academic literature. The Capital Asset Pricing Model (CAPM) is far too simplistic for a real-world scenario since the market factor is not the only source that drives returns; asset return is generated from a range of factors, each of which influences the overall return. This framework helps in capturing other sources of return.

Related posts on the SimTrade blog

   ▶ Youssef LOURAOUI Fama-MacBeth regression method: N-factors application

   ▶ Youssef LOURAOUI Fama-MacBeth regression method: stock and portfolio approach

   ▶ Jayati WALIA Capital Asset Pricing Model (CAPM)

   ▶ Youssef LOURAOUI Origin of factor investing

   ▶Youssef LOURAOUI Factor Investing

Useful resources

Academic research

Brooks, C., 2019. Introductory Econometrics for Finance (4th ed.). Cambridge: Cambridge University Press. doi:10.1017/9781108524872

Fama, E. F., MacBeth, J. D., 1973. Risk, Return, and Equilibrium: Empirical Tests. Journal of Political Economy, 81(3), 607–636.

Roll R., 1977. A critique of the Asset Pricing Theory’s test, Part I: On Past and Potential Testability of the Theory. Journal of Financial Economics, 1, 129-176.

American Finance Association & Journal of Finance (2008) Masters of Finance: Eugene Fama (YouTube video)

Business Analysis

NEDL. 2022. Fama-MacBeth regression explained: calculating risk premia (Excel). [online] Available at: [Accessed 29 May 2022].

About the author

The article was written in December 2022 by Youssef LOURAOUI (Bayes Business School, MSc. Energy, Trade & Finance, 2021-2022).

My experience as an investment banking analyst intern at G2 Capital Advisors

My experience as an investment banking analyst intern at G2 Capital Advisors

Aastha DAS

In this article, Aastha DAS (ESSEC Business School, Bachelor’s in Business Administration, Exchange Student from Northeastern University) shares her experience during a summer internship as an investment banking analyst at G2 Capital Advisors.

About the company

G2 Capital Advisors is a boutique, low-middle market investment bank which is sector-focused with an integrated and multi-product approach, creating an uncommon full-service product line. G2 provides unique solutions in the investment banking realm including specializing in buy-side and sell-side advisory, capital markets, and restructuring, with different teams allocated to each part of those practices. Most analysts specialize in one of the products while associates and vice presidents tend to cover more product lines while specializing a certain industry in the business practice, further supporting the C-Level executive heading their respective industry specialty group.

G2 Capital Advisors logo
Women in Finance
Source: G2 Capital Advisors.

G2 follows a unique business model in which their managing directors and leads of industry practices are from a background of sector success, and not necessarily banking careers, like Industrials & Manufacturing, Technology & Business Services, Consumer & Retail, and Transportation & Logistics. The culture and core values at G2 Capital Advisors revolve around dedication to their clients, to be able to provide the best possible, creative yet lucrative solutions for their issues. Their main business practice remains Restructuring and Investment Banking.

Through remaining tenacious in all their business processes, they are able to create a full-servicing bank which can provide accountability in an honest and respectful manner, further differentiating themselves.

My Internship

My Missions

I worked as an intern in the summer of 2022 for the Investment Banking practice at G2 Capital Advisors. I was mainly responsible for supporting the analysts and sometimes supported the associates in the buy-side and sell-side business practices. As the size of this boutique lower-middle market investment bank is a lot smaller than a lot of other banks, my experience was more unique than most investment banking summer analyst positions.

I got holistic views on the whole firm as I got experience in intensive levels in three of four of their business practices: Technology & Business Services, Consumer & Retail, and Transportation & Logistics, on both the buy-side and sell-side investment banking advisory. On the buy-side, I created extensive market maps for clients to source their clients and potential new acquisitions for them. Here I was also able to perform also as a research analyst for M&A and equity research on active advisory and restructuring deals throughout the summer by using Excel to curate and develop market maps, historical financial analysis, and prepare for engagement with clients. I was the forefront of the intern class through ensuring that all the submissions from the group were of top quality for all curated presentation materials including tailored pitch books, Confidential Information Memorandums, deal sheets, and teasers. This helped prepare me, the other interns, as well as the analysts and associates for client presentations, oftentimes doing more research than necessary, to stay ahead of competitors. I also aided in the company’s outreach initiatives through drafting many press releases and research presentations for transaction announcements and quarterly industry reports specifically for the Consumer & Retail and Transportation & Logistics business practices.

In my final weeks as an intern, I was able to generate my own comparables and financial models to aid associates for many ongoing deals. All the interns were also responsible for a research presentation of any of the business practices and I delivered a presentation on Consumer & Retail. In this presentation, I sourced new portfolio companies, hedge funds, and private equity firms for G2 to create connections with and evaluated the intrinsic value of creating relations with each of these different sub-sectors and companies and how it better aligns with G2’s goals to provide industry specialized support for clients. I have since gotten feedback from several of the managing directors and leads in the Consumer & Retail team that many of the suggested partnerships have rendered successful and are in process of deal-making with due diligence underway.

Required Skills and Knowledge

The Investment Banking sector at G2 Capital Advisors is arguably the most profitable business practice and there was a high learning curve to going into this internship. I had to quickly learn the sell-side and buy-side business practices to best support the analysts and associates so that we were able to deliver the best market maps and materials to the clients and our managing directors/deal managers. Along with the steep learning curve of investment banking concepts, I also had to adapt to the G2 form of financial modeling as I had learned it already from a club at my university called Bull & Bear Equity Research club. It is also necessary to develop and come prepared with many soft skills like humility, generosity to always give a helping hand, self-discipline, time management, conflict resolution, and high analytical/critical thinking. As an aspiring intern in the investment banking and advisory space, it is wise to stay up to date with financial news, so it is recommended to read/listen to news through podcasts like the NYTimes Daily, New York Times, Wall Street Journal, The Economist. Most higher-level executives are well versed with financial news and do not need to think twice about it and this is a good tactic to incorporate in beginner’s careers to ensure the interns are knowledgeable on all that is going on in the market, in light of any swift changes.

What I Learned

My internship at G2 Capital Advisors gave me a good understanding of the composition of the entire financial institution and the operation of the financial market as well as investment banking through allowing me to master my Excel capabilities, relationship building skills with clients and other employees, while learning technical skills as well like financial terms and everything that is necessary in the different advisory processes. The knowledge I had previously from taking microeconomics, macroeconomics, macroeconomic theory, financial management, Wall Street Prep, and financial accounting aided me in the internship to create a solidified foundation to grow in the industry. I also learned how lucrative a career in investment banking is because of how heavily technical it can get with developing models, but also how personable it can make you through creating special relationships with many different market leaders, clients, and investors, creating a well-rounded employee in the financial services space.

Key Financial Concepts

Here are three useful financial concepts I learned in the Investment Banking department at G2 Capital Advisors.

Buy-side vs sell-side

Buy-Side – is the side of the financial market that buys and invests large portions of securities for the purpose of money or fund management.

Buy-Side – is the other side of the financial market, which deals with the creation, promotion, and selling of traded securities to the public.

M&A Sell-Side Advisory Process Explained

One of the most in-depth processes I learned was the Sell-side process for investment banking: Detailing my insight below

Process and Timeline

  • 1. Winning the Mandate
    • a. Pitch
    • b. Engagement Review Memo
    • c. Engagement Letter Signing
  • 2. Preparing for sale
    • a. Definite strategy (who, how much, what process)
    • b. Draft Teaser, Executive Summary, CIM
    • c. Kick-off Meeting
    • d. Organize Financials
    • e. Create Projections
    • f. Prepare non-disclosure agreement
  • 3. Marketing
    • a. Launch process
      • i. Contact Buyers
      • ii. Receive preliminary bids
      • iii. Manage deal processes
      • iv. Send teaser and NDA
      • v. Investor meetings/emails
      • vi. Draft Letter of Interest bid
      • vii. Draft Management Presentation
      • viii. Set up data room and due diligence
    • b. Letter of Interest Bid Deadline
      • i. Receive final LOIs
      • ii. Board meetings
      • iii. Management presentation
      • iv. Negotiate with lead bidders
      • v. Execute LOI
  • 4. Confirmatory Due Diligence
    • a. Enter into exclusivity agreement with one bidder post negotiation
    • b. Kick-off diligence meeting
    • c. Facilitate due diligence
  • 5. Closing
    • a. Proceeds waterfall deliverables
    • b. Present finalized deal terms and fairness opinion
    • c. Get board approval
    • d. Signing and closing
    • e. Invoice deliverable sent
    • f. Transaction review memo

What is Restructuring?

Restructuring is a unique concept in investment banking which entails growth and special situations in and out of the court with both a debtor and creditor side, based on what is best fit for the firm. It helps provide clients with clear solutions to ensure sustainable long-term stability. This is usually a practice which is enacted, and advisors are called in when a company wants to change its structure completely or significantly in both financial and operational aspects, during times of financial pressures where clear restructuring of the business is necessary. It often involves revising debt options, operations, and forms of limiting financial detriment while still improving the firm.

A company will often use restructuring advisory when there is debt difficulty, especially regarding consolidating to pay their bondholders. It is also possible to incorporate operation restructure to help cut costs in payroll and/or in the size of assets through significant sales.

Internal restructuring often entails operations, processes, departments, supply chains, executive board, and even ownership change, further enabling the firm to grow profitable while growing. This is when investment banks come in to help with the negotiation of restructuring plans to input financial and legal advisors and potentially even gain aid from investors and appointing new CEOs to implement the new changes and propel the firm forward.

Merger & Acquisition Activism

Activism a particularly new space in the investment banking world but one worth keeping tabs on because of how much it changes and how volatile it can make certain deals. In activist investing, there is usually a sign of change occurring through a catalyst which prompts activist investors to reveal themselves. This is an investment strategy where an investor comes into and/or attempts to pursue poorly-run companies with share prices that have gone down recently, usually an investor which much potential. The activist investor usually takes in a large stake in the company which reveals their interest and pushes for changes because of their vast equity, in efforts to turnaround the company for the better. This hopefully results in price increases for the security.

It is necessary to stay weary of activist investors because they may not always have the company’s best interests at hand. For this reason, shareholder trust is a large factor for activist investors. Most of the most successful activist investors are public figures and not necessarily hedge funds. They often use aggressive and confrontational tactics to pressure the management teams of public companies. It is necessary to grow public and shareholder trust along with public attention to grow their platform to endorse the suggested recommendations.

Why should I be interested in this article?

It is worth reading this article because of the topic it discusses in the popular investment banking space. It is necessary to note how well-rounded investment banking can make an individual but also the uniqueness of this post entails how the experience was at a boutique low-middle market investment bank with full servicing to reveal how one smaller firm can do so much in efforts to create the most impactful and creative solutions to business issues and M&A deals.

Related posts on the SimTrade blog

All posts about Professional experiences

▶ Anne BARBERO Career in finance

▶ Suyue MA Expeditionary experience in a Chinese investment banking boutique

Useful resources

G2 Capital Advisors

Financier Worldwide Magazine (June 2019) The rising influence of shareholder activism in M&A transactions: recent trends in the UK

About the author

The article was written in December 2022 by Aastha DAS (ESSEC Business School, Exchange Student from Northeastern University – Bachelor’s in Business Administration).

Why is Apple’s new iPhone 14 release line failing in the first few months?

Why is Apple’s new iPhone 14 release line failing in the first few months?

Aastha DAS

In this article, Aastha DAS (ESSEC Business School, Bachelor’s in Business Administration, Exchange Student from Northeastern University) discusses events about Apple’s products, their impact on Apple’s share price and the link with market efficiency.

Brief reminder of the facts

On Tuesday October 18th, 2022, Apple stocks saw a downturn after the announcement of the limit of one of its iPhone suppliers for the newly released iPhone 14 Plus due to demand issues.

Figure 1. Event about Apple.
Event about Apple
Source: Bloomberg.

With the new release, Apple took a large risk with eliminating certain failing lines like the “mini” model. Within the iPhone 14 range, the largest changes and upgrades were to the “Pro” models in hopes of diversifying its product line while pricing remained consistent in appropriate increases, as done in the past. Unfortunately, this has been highly unsuccessful with many reports revealing how the sales of the “iPhone 14” line have been subpar of expectations.

Impact on company

This is concerning for the company since Apple had increased its sales projections in the few weeks prior to the iPhone 14 family release in September as it does annually and many of its suppliers had already started making preparations for a 7% boost in orders after the release. This incident had direct financial consequences on the company as the stock immediately dropped by $4 from $145. There are mixed reports on consumers’ preferences to buy either the iPhone 14 Plus or iPhone 14 as preferences between the features and affordability of the two vary greatly. It is difficult for the company to gauge the fluctuations in demand, especially as the new iPhone 14 has not been doing as well as anticipated. This can also be attributed to the decrease in global demand because of surging inflation and the impending recession and war in Ukraine. The smartphone market is projected to decrease by 6.5% this year, 2022. Following an official announcement in a press release from Apple, the stock price immediately dropped in regard to the production halt for the iPhone 14 Plus at one of the plants in China. Apple shares fell 3.9% on the New York stock Exchange (NYSE) on Wednesday morning to $145.90. The shares are additionally also down about 18% this year in 2022, compared to a 23% drop in the S&P 500 Index. Still, many professionals state they are not surprised about this due to more preference toward the more premium models of the iPhone 14 family. The share price quickly leveled out but it revealed how volatile the stock is to the market and each decision they make.

Figure 2. Event about Apple.
Apple share price
Source: Google Finance.

Relations to market efficiency

Market efficiency involves a market where the current price of a stock/security quickly reflects information of that security and/or its respective company in a wholly rational manner.

There are many ways to evaluate a market’s efficiency, even as novice market watchers, starting with reevaluating the lag in the time that information is released regarding a security to when it is reflected in the security’s price. The changes in price are usually a product of announcements that are novel and unexpected which can be compared to the press release by Apple to limit the supply chain of its iPhone 14 production as this is uncommon for the company to do, so soon after the company’s fall release, as it does annually. It also relates to a company’s share price in relation to its earnings per share outcomes and the share price growing following the EPS, in an efficient market, as EPS growth reveals positive growth for long-term investors, and it is still optimistic to observe that Apple has managed to grow EPS by 28%/year over the past three years. This restores faith in the stock as though it has proven to be volatile, it regulates itself and has clearly been on the rise in a long-term perspective, revealing sustainable growth. A real positive is seen with Apple’s similar EBIT margins to 2021 as revenue grew by 12% to $388B USD.

At this point in time, the Apple security can be seen as semi-strong efficiency. This can be attributed to how public Apple is with there being much historical market data and public information like company accounts, hundreds of reports on the renowned company which regularly are reflected in the company’s stock price.

Figure 3. Apple financial statistics.
Apple financial statistics
Source: Forbes Digital Covers.

Why did I choose this event?

I chose this event as a financial event of Apple’s stock taking a downturn dip because it reveals much about the smartphone and personal electronics market despite being a quite small event in the trajectory of its iPhone releases. This shows how smartphones will also suffer from raising inflation and the Ukrainian-Russia war despite popular demand and so-called need for smartphones like the iPhone. I am also an avid consumer of Apple products and find it interesting how emotional many stakeholders are based on how they react to even the smallest aspects of its product line. It reveals how despite the rationality of the market being beneficial, human beings chose to act on fear and precautionary measures to ensure that they will be safer rather than opting in favor of risk, within reason.

Why should you be interested in this topic?

There are many reasons why it is important to stay on top of the regular markets and this article discusses a company which is regularly changing in the markets. As a SimTrade student, or anyone interested in financial markets, market efficiency is a key aspect to refer to when making financial decisions and trading. It is worthwhile to consider companies with strong efficiency and those which do not, allowing a broader outlook into how they might function. It is necessary to see if there is a possibility of beating the market because any information available to a trader is already involved in the market price so it is difficult to beat it for the higher returns.

Useful resources

SimTrade course Market information

Yahoo! Finance (October 25, 2022) Here’s Why We Think Apple (NASDAQ:AAPL) Is Well Worth Watching

Apple Newsroom (November 6, 2022) Update on supply of iPhone 14 Pro and iPhone 14 Pro Max

Bloomberg (September 28, 2022) Apple Ditches iPhone Production Increase After Demand Falters

Related posts on the SimTrade blog

   ▶ Aamey MEHTA Market efficiency: the case study of Yes bank in India

   ▶ Henri VANDECASTEELE inancial markets are not accounting enough for the Ukraine-Russia conflict

About the author

The article was written in December 2022 by Aastha DAS (ESSEC Business School, Bachelor’s in Business Administration, Exchange Student from Northeastern University).

A quick review of the M&A – Real Estate job…

A quick review of the M&A – Real Estate job…

Louis DETALLE

In this article, Louis DETALLE (ESSEC Business School, Grande Ecole Program – Master in Management, 2020-2023) explains how is working as an M&A Analyst in Real Estate any different from being a general M&A.

Let’s recall what M&A is and then, we will assess how working in the Real Estate sector makes it different

M&A (Mergers & Acquisitions) is a profession that advises companies wishing to develop their external growth, i.e. growth through the acquisition of another company or through a merger with it. M&A mandates are therefore carried out on the side of the company that wishes to acquire another company, “buy-side”, or on the side of a company that wishes to be acquired, “sell-side”.

Therefore, an analyst in M&A with a Real Estate focus will only work on Real Estate-related topics. For example, clients may be property managers, real estate companies, property developers or hotel groups. By the same logic, the subjects encountered and studied in the M&A pitches will be centered around the real estate sector. These include shopping centers, entire housing estates, office towers, hotel chains and their hotel stock.

What does an analyst in M&A – Real Estate work on?

The tasks of an M&A analyst are diverse and include, for example, drawing up a business plan, modelling different scenarios and strategies in Excel, and drafting information memorandums (IMs) on the various deals in progress. With a real estate asset that you are trying to value for instance, the case scenarios that you will anticipate, will describe the possibility that you do not receive 100% of the rent, but perhaps only 30% for the first 6 months of the project.

All these skills on the real estate sector are cumulated to the ones you acquire as an M&A analyst and are then widely used for the mergers and acquisitions of companies, in the development of their external strategy, in their financial evaluation or in the analysis of databases.

Again, the financial analysis tools for the real estate sector are not the same and are specific to Real Estate. For example, analysts will focus on the possibility that rents for a property will not come in and will try to estimate whether the estimated average occupancy rate is realistic. When valuing by stock market or transactional comparables, the comparables used will be functions of the capitalization rate and not EBITDA or EBIT multiples.

What are the main exits for an M&A Analyst of the Real Estate sector?

There are a lot of opportunities, but of course largely limited to the real estate sector. This is because there are many different jobs and companies in the real estate world: asset managers, real estate companies, real estate management of a large company, etc. It is also possible to join the real estate teams of a private equity fund in order to move to the investor side.

Related posts on the SimTrade blog

▶ Ghali EL KOUHENE Asset valuation in the Real Estate sector

▶ Clément KEFALAS My experience of Account Manager in the office real estate market in Paris

▶ Louis DETALLE A quick presentation of the M&A field…

▶ Louis DETALLE A quick presentation of the Private Equity field……

Resources

Youtube Interview with a Deloitte Manager in M&A Real Estate

BNP Paribas Real Estate – Presentation of all Real Estate jobs

About the author

The article was written in December 2022 by Louis DETALLE (ESSEC Business School, Grande Ecole Program – Master in Management, 2020-2023).

A quick review of Wealth Management’s job…

A quick review of Wealth Management’s job…

Louis DETALLE

In this article, Louis DETALLE (ESSEC Business School, Grande Ecole Program – Master in Management, 2020-2023) explains what an Wealth Manager works on, on a daily basis.

What does Wealth Management consist in?

Private banking is a specialized advisory service offered by financial institutions to individual or institutional clients with substantial financial resources and assets. The clients targeted by this type of activity may be company directors such as Bernard Arnault or François Pinault. Clients may also be wealthy families who maintain and grow their assets through the solutions offered by private bankers.

To do this, institutions that practice private banking employ various experts who cover all the issues related to the optimization of an estate: private bankers, tax lawyers, asset managers and notaries.

What does a Wealth Manager work on?

As stated above, the Wealth Manager should be able to propose a property investment (such as the Pinel Law in France for example), an investment in traditional life insurance or even an investment in a private equity management company. The diversity of investment products can be very great, and it is therefore important for the Wealth Manager to understand his client’s needs in order to offer him the solution that is best suited to his needs.

This is particularly true in an independent wealth management firm but much less so in a division of a large bank with wealth management activities. Indeed, in an independent asset management firm, fund managers will have to invent new investment solutions. The private bank employees of a large bank, on the other hand, will only be able to offer products created by the bank to which they are attached.

For this reason, wealth management work varies greatly depending on the type of structure in which the wealth manager works. Indeed, the proportion of “commercial” work will be much greater for a “non-independent” private banker, since he or she will not be as involved in the construction and development of the solutions proposed. For independent private banks, the work of creating investment solutions and finding investment opportunities will logically be more significant.

What are the different levels of clients that wealth managers can deal with?

In this respect, four main levels of segmentation of high-net-worth clients can be distinguished, hierarchized according to the thresholds of assets managed by the firm or the private bank.

Upper Affluent : The Upper Affluent have assets between €100,000 and €1,000,000. In order to develop their wealth, these clients mainly turn to the so-called premium investment offers of retail banks or small independent wealth management firms.

High Net Worth Individuals (HNWI): High Net Worth Individuals (HNWI) have assets of up to €5,000,000. HNWIs generally make up a large proportion of the client base of both independent and non-independent private banks.

Very High Net Worth Individuals (Very HNWI): These are individuals with an estimated wealth of between €5,000,000 and €30,000,000. This very wealthy clientele is generally advised by the wealth management departments of independent private banks and private banks attached to the network banks. It should be noted that this type of individual constitutes the so-called “premium” clients of these departments.

The “above €30 million”: The most affluent individuals (with assets of over €30,000,000) are the main clients of family offices. They are external organizations of individuals related to a single family and advise them on all aspects of their wealth management. Family offices employ people who are often experienced and have a wide range of skills.

Related posts on the SimTrade blog

▶ Wenxuan HUMy experience as an intern of the Wealth Management Department in Hwabao Securities…

▶ William ANTHONY Working for a Private Bank

▶ Hélène VAGUET-AUBERT Private banking: evolving in a challenging environment

Resources

Article about the different jobs that exist in the management of financial resources: asset management, wealth management, family office…

Youtube Top 20 Wealth Manager Interview Q&A

Youtube Natixis wealth management department’s website

About the author

The article was written in December 2022 by Louis DETALLE (ESSEC Business School, Grande Ecole Program – Master in Management, 2020-2023).

What are green bonds?

What are green bonds?

Louis DETALLE

In this article, Louis DETALLE (ESSEC Business School, Grande Ecole Program – Master in Management, 2020-2023) explains what are the different green bonds and what are they used for.

Green bond

A green bond is a debt security, often issued by a company or public entity on the market to enable it to finance projects related to the ecological transition. These securities function in the same way as traditional bonds, characterized by an interest rate, a repayment schedule, etc. However, green bonds are specific in that the projects financed by this type of bond must be oriented towards preserving the environment. From 2013 onwards, the green bond market has experienced very strong growth worldwide: almost $275 billion of broadly defined green bonds were issued between 2013 and 2017, including over $100 billion in the last year. In 2021, global green bond sales reached a record $513 billion, according to Bloomberg. Despite this explosion of green bonds, the craze for this type of bonds is to be qualified as they remain very marginal compared to conventional bonds, especially in the current context of the war in Ukraine.

What are the main green bond issuers?

Green bonds issuers can consist mainly of states and governments. For example, Europe has an important place in this market: almost 45% of green bond issues in 2019 were denominated in euros, compared to 26% in dollars. Indeed, France was the first country to issue a significant size of green bond, followed closely by Germany, Belgium, Ireland and the Netherlands. 225 billion in green bonds as part of the European recovery plan.

Outside Europe, the US and China are the largest issuers of green bonds. They account for almost 32% of such issues.

On the other hand, green bonds issuers can also consist of large companies. In France, Suez (the water and waste group) issued a first green bond for €2.6 billion in May 2022. This transaction met with strong demand as it was oversubscribed by about 2.9 times by 200 European institutional investors, the group said in a statement. In the meantime, large companies, particularly in the energy sector, have also launched green bond issues with, in France, Engie, EDF or in real estate with the Icade group. The SNCF also issued a green bond in 2016, becoming the first railway infrastructure manager in the world to adopt such an approach. 900 million euros were issued in the first year, then 1 billion in 2017, the largest green issue for a French company, and 500 million in 2019.

US companies have been slower to embrace green bonds, but with a total of $30 billion in green bonds issued in the first 10 months of 2019, US corporate green bond issuance has jumped by 60%. PepsiCo has obtained 1 billion dollars from investors for its inaugural operation in 2019. These 30-year green bonds will be used to finance projects that reduce the use of non-recycled plastic in the manufacture of bottles, limit the consumption of water in its production processes and, more generally, reduce its carbon footprint. The UDR real estate group is one of the recent issuers. In February 2019, it was telecoms giant Verizon that raised $1 billion, attracting eight times more demand than supply.

How are the green bonds regulated?

In the European Union, the regulation of European green bonds is still at the draft stage. The EU is taking further steps to implement its strategy on financing sustainable growth and energy transition.

The EU Permanent Representatives have given the green light to the Council’s position on a proposal to create European green bonds. The regulation concerned sets out uniform requirements for bond issuers who wish to use the name “European Green Bond” or “EuGB. For the latter, the main interest is that this regulation would provide a registration system and a monitoring framework for European green bond issuers.

Environmentally sustainable bonds are one of the main instruments for financing investments in green technologies, energy and resource efficiency, and sustainable transport and research infrastructure. The Council announced that it is ready to enter into negotiations with the European Parliament in order to reach agreement on a final version of the text that will have to be accepted by all Member States.

Outside the EU, in the US, China and elsewhere, green bond regulation is still in its infancy. This raises a major concern: actors can issue green bonds without using the funds for environmental purposes. For example, according to the Climate Bonds Initiative, only half of China’s green bonds comply with international standards. It is precisely for this reason that regulations are more necessary than ever to avoid a green bond fashion

Related posts on the SimTrade blog

▶ Anant JAIN The World 10 Most Sustainable Companies in 2021 …

▶ Anant JAIN Green Investments

▶ Maite CARNICERO MARTINEZClimate change’s impact on the financial sector

Resources

French State’s Website about green bonds

An article by BNP Paribas about the EU regulation on ESG criterias

An article by Les Echos on how the US are defining new regulations in order to fight the plague of greenwashing

About the author

The article was written in December 2022 by Louis DETALLE (ESSEC Business School, Grande Ecole Program – Master in Management, 2020-2023).

A quick review of the corporate lawyer’s job…

A quick review of the corporate lawyer’s job…

Louis DETALLE

In this article, Louis DETALLE (ESSEC Business School, Grande Ecole Program – Master in Management, 2020-2023) explains what a corporate lawyer works on, on a daily basis.

How a corporate lawyer is different from any other lawyer?

A corporate lawyer (also called a business lawyer) is first and foremost a lawyer, so he has studied law. However, he specializes in commercial and company law. He can also add banking law, tax law, industrial property law, mergers and acquisitions or stock exchange law to his skills.

Unlike the classical lawyer in the common sense of the term, the corporate lawyer works in a law firm or directly with a large company, advising it on all legal aspects of its activities. They only plead in cases of litigation, whereas a lawyer specialized in criminal law will plead much more often and in various criminal cases.

What does a corporate lawyer work on?

The tasks of a corporate lawyer are varied and depend on the specialty he or she practices within a business law firm. Indeed, the latter may have a dominant advisory role, i.e., he will accompany corporate clients on all their issues such as company takeovers, share transfers, debt issues… On the other hand, the corporate lawyer may also work with a litigation focus, i.e., he will specialize in defending the interests of his clients when they are the target of a lawsuit, or when they sue a third party. In any case, the corporate lawyer is a genuine advisor. The corporate lawyer must lead his clients to make the best strategic choice for them and must defend their interests against the opposing party.

The daily advisory missions of the corporate lawyer

In relation to corporate clients, the business lawyer will have to participate in his clients’ projects by ensuring that they respect a well-adapted legal framework. This will be an important part of the lawyer’s work to ensure that the client is not in conflict with the law and the regulations specific to its sector. The corporate lawyer will also need to assist clients in M&A transactions in the same way that an investment banker will. In this respect, the corporate lawyer will participate in the negotiations on the amount of the transaction and will pay particular attention to the various clauses and legal documents relating to the transaction. Whether it is the drafting of a Non-Disclosure Agreement, a Letter of Intent, a Non-Binding Offer or the signing of the Share Purchase Agreement, the business lawyer will have to supervise all these legal documents in order to protect his client as best as possible. The business lawyer will also have to assist his clients in the drafting and supervision of the various contracts relating to the company’s partners.

The punctual litigation missions of the corporate lawyer

On the other hand, the corporate lawyer will be responsible for advising and representing his clients in possible litigation. This will consist of determining the rights and duties of his clients in case of litigation and pleading in court if necessary. This aspect of a business lawyer’s work may seem less recurrent, but it is nonetheless crucial because it is precisely when a client is being sued that he or she needs the business lawyer most.

How to become a corporate lawyer?

In France, after a baccalaureate, the future corporate lawyer must enroll in a law faculty to obtain at least a Master 1 or a Master of Law. Afterwards, they can specialize in business law and obtain a Master 2 in business law, financial law, or tax law. They can also choose to continue their studies at a university abroad or take a master’s degree at a business school, which they will enter by admission based on their qualifications.

Once they have their master’s degree, the future business lawyer will have to join a regional center for professional training of lawyers or CRFPA to obtain the certificate of aptitude for the profession of lawyer or CAPA, commonly known as the “bar exam” and become a business lawyer.

Resources

An comprehensive interview of a corporate lawyer

Youtube Conference Business Lawyer: between myths and realities

Related post on the SimTrade blog

▶ Louis DETALLE A quick review of the tax specialist’s job……

About the author

The article was written in December 2022 by Louis DETALLE (ESSEC Business School, Grande Ecole Program – Master in Management, 2020-2023).

Forex exchange markets

Forex exchange markets

Nakul PANJABI

In this article, Nakul PANJABI (ESSEC Business School, Grande Ecole Program – Master in Management, 2021-2024) explains how the foreign exchange markets work.

Forex Market

Forex trading can be simply defined as exchange of a unit of one currency for a certain unit of another currency. It is the act of buying one currency while simultaneously selling another.

Foreign exchange markets (or Forex) are markets where currencies of different countries are traded. Forex market is a decentralised market in which all trades take place online in an over the counter (OTC) format. By trading volume, the forex market is the largest financial market in the world with a daily turnover of 6.6 trillion dollars in 2019. At present, it is worth 2,409 quadrillion dollars. Major currencies traded are USD, EUR, GBP, JPY, and CHF.

Players

The main players in the market are Central Banks, Commercial banks, Brokers, Traders, Exporters and Importers, Immigrants, Investors and Tourists.

Central banks

Central banks are the most important players in the Forex Markets. They have the monopoly in the supply of currencies and therefore, tremendous influence on the prices. Central Banks’ policies tend to protect aggressive fluctuations in the Forex Markets against the domestic currency.

Commercial banks

The second most important players of the Forex market are the Commercial Banks. By quoting, on a daily basis, the foreign exchange rates for buying and selling they “Make the Market”. They also function as Clearing Houses for the Market.

Brokers

Another important group is that of Brokers. Brokers do not participate in the market but acts as a link between Sellers and Buyers for a commission.

Types of Transactions in Forex Markets

Some of the transactions possible in the Forex Markets are as follows:

Spot transaction

As spot transaction uses the spot rate and the goods (currencies) are exchanges over a two-day period.

Forward transaction

A forward transaction is a future transaction where the currencies are exchanged after 90 days of the deal a fixed exchange rate on a defined date. The exchange rate used is called the Forward rate.

Future transaction

Futures are standardized Forward contracts. They are traded on Exchanges and are settled daily. The parties enter a contract with the exchange rather than with each other.

Swap transaction

The Swap transactions involve a simultaneous Borrowing and Lending of two different currencies between two investors. One investor borrows the currency and lends another currency to the second investor. The obligation to repay the currencies is used as collateral, and the amount is repaid at forward rate.

Option transaction

The Forex Option gives an investor the right, but not the obligation to exchange currencies at an agreed rate and on a pre-defined date.

Peculiarities of Forex Markets

Trading of Forex is not much different from trading of any other asset such as stocks or bonds. However, it might not be as intuitive as trading of stocks or bonds because of its peculiarities. Some peculiarities of the Forex market are as follows:

Going long and short simultaneously

Since the goods traded in the market are currencies themselves, a trade in the Forex market can be considered both long and short position. Buying dollars for euros can be profitable in cases of both dollar appreciation and euro depreciation.

High liquidity and 24-hour market

As mentioned above, the Forex market has the largest daily trading volume. This large volume of trading implies the highly liquid feature of Forex Assets. Moreover, Forex market is open 24 hours 5 days a week for retail traders. This is due to the fact that Forex is exchanged electronically over the world and anyone with an internet connection can exchange currencies in any Forex market of the world. In fact for Central banks and related organisations can trade over the weekends as well. This can cause a change in the price of currencies when the market opens to retail traders again after a gap of 2 days. This risk is known as Gapping risk.

High leverage and high volatility

Extremely high leverage is a common feature of Forex trades. Using high leverage can result in multiple fold returns in favourable conditions. However, because of high trading volume, Forex is very volatile and can go in either upward or downward spiral in a very short time. Since every position in the Forex market is a short and long position, the exposure from one currency to another is very high.

Hedging

Hedging is one of the main reasons for a lot of companies and corporates to enter into a Forex Market. Forex hedging is a strategy to reduce or eliminate risk arising from negative movement in the Exchange rate of a particular currency. If a French wine seller is about to receive 1 million USD for his wine sales then he can enter into a Forex futures contract to receive 900,000 EUR for that 1 million USD. If, at the date of payment, the rate of 1 million USD is 800,000 EUR the French wine seller will still get 900,000 EUR because he hedged his forex risk. However, in doing so, he also gave up any gain on any positive movement in the EUR-USD exchange rate.

Related posts on the SimTrade blog

   ▶ Jayati WALIA Currency overlay

   ▶ Louis DETALLE What are the different financial products traded in financial markets?

   ▶ Akshit GUPTA Futures Contract

   ▶ Akshit GUPTA Forward Contracts

   ▶ Akshit GUPTA Currency swaps

   ▶ Luis RAMIREZ Understanding Options and Options Trading Strategies

Useful resources

Academic resources

Solnik B. (1996) International Investments Addison-Wesley.

Business resources

DailyFX / IG The History of Forex

DailyFX / IG Benefits of forex trading

DailyFX / IG Foreign Exchange Market: Nature, Structure, Types of Transactions

About the author

The article was written in December 2022 by Nakul PANJABI (ESSEC Business School, Grande Ecole Program – Master in Management, 2021-2024).

A quick review of the Equity Research analyst's job…

A quick review of the Equity Research analyst’s job…

Louis DETALLE

In this article, Louis DETALLE (ESSEC Business School, Grande Ecole Program – Master in Management, 2020-2023) explains what an Equity Researcher works on, on a daily basis.

What does Equity Research consist in?

The objective of equity research is to make buy or sell recommendations on stocks to advise investors on their asset allocation. In doing so, the Equity Research team will closely monitor certain stocks to see if the stock is outperforming or underperforming. In doing so, they will closely monitor the share price and sell their monitoring as a service to determine whether to buy or sell a share.

This equity research service is therefore sold to investors in the financial markets to provide them with a comprehensive financial analysis, as well as advice on whether to buy or sell particular securities. The analysis report presented by an equity analyst is used by investment banks and private equity firms to evaluate the company for an initial public offering (IPO), a leveraged buy-out (LBO), alliances and others. Therefore, all these investors constitute clients of Equity Research teams.

Most banks have Equity Research teams such as Societe Generale Bank, UBS, BNP Paribas, Barclays, Goldman Sachs and Citi for instance. In short, equity research analysts are mainly employed by investment banks (BNP, Citi, Barclays, etc.), investment funds (KKR, Blackstone, Bpifrance) or asset managers (BlackRock, Vanguard, Amundi).

An equity research analyst is specialised in a specific sector such as automotive, aerospace, healthcare, telecoms and biotech. The advantage of doing that is that the banks will have extremely complementary profiles that will be able to deal with the analysis of many companies of the same sector. They will have the benefit of hindsight trough building their knowledge of comparable companies. The analyst will often even develop a special expertise on a particular company, which he or she will follow closely.

What does an analyst in Equity Research work on?

As explained above, an equity research analyst will follow the release of sector or company specific information to write a note for subsequent use by the clients as part of their investment strategy. Therefore, the work of the equity research analyst will be primarily information research, reading quarterly financial reports, and press releases which may provide information on the company’s performance to date compared to expectations. The analyst will also look for information on upcoming mergers and acquisitions (M&A) or divestment transactions, the announcement of new partnerships or possible disposal plans.

As for the sectoral notes, the analyst will delve into the reading of documents from the major international institutions for all the data relating to global and entire sectors.
Once this research work is completed, equity research analysts proceed to forecast results through financial modelling: they use historical data to understand how the results were obtained and they confront these historical performances with the constraints of the future environment in order to anticipate how the company will perform. This modelling will enable them to forecast short-, medium- and long-term stock performance and the behavior to adopt in order to make the most of it.

This work will therefore be carried out in the form of a synthesis and by drafting studies for investors and reacting to specific news items.

Finally, a last type of task will consist of answering clients’ questions by telephone during morning meetings in order to give them recommendations for the day.

Why do Equity Research jobs appeal so much to business school students?

First of all, it should be noted that this profession combines corporate finance skills with financial market experience, which is rare! Indeed, the Equity Research analyst will carry out various financial analyses which will be used to issue trading recommendations on the financial markets. A financial profession in such a situation is rare, which is a first strong argument.

In addition, it is the dynamic working environment that investment banking constitutes that attracts young graduates. Equity Research is marked by a culture of high standards and maximum commitment, with highly responsive teams and extremely competent colleagues. Working in a high-powered team though quite small teams enables an analyst to quickly gain knowledge on a sector or a client.

The position of Equity Research in front of clients also makes the job really interesting because the Equity Research Analyst is at the core of the clients’ investment strategies. Because as we have seen together, such a job requires the ability to manage theoretical models and market trends in order to give clients a good insight of what is to expect for the day. For that matter, an Equity Research career can be very challenging and gives plenty of responsibilities, and this is what young graduates seek for.

Related posts on the SimTrade blog

All posts about jobs in finance

   ▶ Louis DETALLE A quick review of the ECM (Equity Capital Market) analyst’s job…

   ▶ Haiyuan XU My professional experience as financial research assistant in a green finance institute

   ▶ Tanmay DAGA My experience as a sell-side equity research analyst

   ▶ Marie POFF Film analysis: The Wolf of Wall Street

Resources

Equity Research Interview Questions with answers

Youtube An analyst in Equity Research’s Youtube Interview

Youtube How to do the Equity Research of a company?

About the author

The article was written in November 2022 by Louis DETALLE (ESSEC Business School, Grande Ecole Program – Master in Management, 2020-2023).

A quick interview with an Asset Manager at Vontobel…

A quick interview with an Asset Manager at Vontobel…

Louis DETALLE

In this article, Louis DETALLE (ESSEC Business School, Grande Ecole Program – Master in Management, 2020-2023) interviews an asset manager at Vontobel to better understand their daily work.

Hello, what is your background?

I went to business school and chose to do an internship in finance at Blackrock. When I left ESCP Business School, Blackrock offered me a job and that’s how I launched my career in Finance. I got into Vontobel later, as I had experienced many aspects of Asset Management.

Could you explain what Vontobel Asset Management does?

Vontobel is an asset management company, which means that it invests the funds of clients such as banks and insurance companies that do not necessarily have the required expertise.

Our investment strategy must therefore ensure the growth of our clients’ funds while combining several factors such as risk, investment horizon and the profitability objective sought by the client.

What is your role as Managing Director here at Vontobel?

I am responsible for the global development of bond sales, so I have to make sure that our representatives around the world present these bond products well by making sure they have access to all the necessary marketing materials such as tenders. I also have to understand the market behaviour and the expectations of our clients in order to define the best possible strategy.

How were you recruited for this position and what qualities do you think are required?

I was recruited in particular for my experience and knowledge of the various financial markets. Vontobel was looking for someone who had the ability to understand the client segments and the ability to manage teams, for example, I manage 50 people on a daily basis. Generally speaking, the higher you go, the less technical skills are required. A managing director (MD) will of course have to be able to master the financial issues of the day, but he or she will make the difference by his or her ability to lead a team to ever-improving results.

What do you like about this job?

What I like is the diversity of the subjects I deal with in my job. This job requires me to use my technical knowledge of investment products, stock markets and macroeconomic principles in the context of a client relationship.

I have to analyse both the financial markets and my clients’ needs. Understanding their psychology and the structure in which they evolve allows me to define offers in line with their needs. For instance, it is required of me to understand what the best investment opportunities are given the macroeconomic circumstances and the interest rates environment.

Do you have any advice for students who want to go into investment banking or asset management?

Before choosing which area of finance you want to work in, I think it’s important to identify the characteristics of each of these sectors. Investment banking is similar to corporate finance, so it is a very demanding job (including weekends) because you work on M&A and company IPOs. So an analyst in M&A will be required to work from 9:30 am until midnignt and later sometimes…Asset management is a market finance job, with the definition of investment strategies linked to the opening of the market. This is why this sector requires more reasonable hourly volumes, we are talking about 8 am to 8:30 pm. The level of remuneration will be less than the ever-increasing wages of M&A, an Asset Manager can start around 50 K€ per year but it will increase every year.

Resources

Vontobel

Youtube How to approach a job interview for Asset Management

Related posts on the SimTrade blog

All posts about jobs in finance

▶ Louis DETALLE A quick presentation of the Asset Management field…

▶ Akshit GUPTA Asset management firms

▶ Jayati WALIA My experience as a credit analyst at Amundi Asset Management

▶ Youssef LOURAOUI ETFs in a changing asset management industry

About the author

The article was written in November 2022 by Louis DETALLE (ESSEC Business School, Grande Ecole Program – Master in Management, 2020-2023).

The Money Changer and his Wife

The Money Changer and his Wife

Nakul PANJABI

In this article, Nakul PANJABI (ESSEC Business School, Grande Ecole Program – Master in Management, 2021-2024) talks about the The Money Changer and his Wife painting by Quentin Matsys and the related subject of foreign exchange markets.

About the The Money Changer and his Wife painting

This painting called ‘The Money Changer and his Wife’ was painted in 1514 by Quentin Matsys, a 16th century Flemish Artist. It originated at a time when Belgium saw an increase in the number immigrants from Spain and neighboring countries because of the Spanish Inquisition. The immigrants needed local money to buy goods and services in Belgium. Therefore, the business of money changers thrived at that time.

The Money Changer and his Wife painting
 The Money Changer and his Wife
Source: Quentin Matsys (Louvre Museum).

In fact, the city of Antwerp was growing in importance at that time. Earlier, Bruges was the trading capital of Belgium. In 13th century, Bruges was the leading trade centre of the North-western Europe and the world’s ever first Stock Exchange was founded in Bruges. However, due to silting up of Zwin due to tidal inlet, Bruges lost access to the North Sea and suffered from economic decline.

At the end of the 15th Century, most foreign trading houses shifted from Bruges to Antwerp and Antwerp became the Sugar capital of Europe. The city attracted Sugar traders from all around the Europe and became a major trading hub. Moneylenders and Financiers capitalized this opportunity and Antwerp became developed an efficient Bourse (Stock Exchange) that even lent money to the English Government.

Money Changer

A money changer was a person who exchanged coins or currency of one country for that of another. Many European cities and towns produced their own coinage during the Middle Ages, and these coins frequently featured the faces of their rulers, such as the local bishop or baron.

It became necessary to exchange foreign coins for local ones at neighborhood money changers when visitors from the outside world—especially traveling merchants—came to town for a market fair.

A foreign coin would be evaluated by money changers for its type, condition, and legitimacy before being accepted as a deposit and having its value converted into local money. The money could then be withdrawn by the merchant in local currency to complete a transaction. This was the humble yet prosperous beginning of the modern day banking and foreign exchange.

As mentioned on the Louvre Museum website, through its deployment of Christian symbolism (representation of the Bible), this depiction of a money changer’s store acts as a moral lesson on the spiritual need to resist worldly temptations (the woman is not looking at the Bible but the money).

The two subjects are pictured sitting behind a table, half-length. They become the center of attention because of how tightly the scenario is framed. They are symmetrical to the letter. On the table in front of him, the man is busy weighing the pearls, gems, and gold pieces. This is keeping his wife from finishing the devotional book she is now reading, as seen by the image of the Virgin and Child.

This painting can currently be seen in the Louvre Museum in Abu Dhabi.

The History of Forex

Trading between tribes began as early as 6000 BC. People started trading by exchanging one good for another. This was followed by systems in which goods like salt and spices became common media of exchange.

Then around 6th century BC societies started using coins as a medium of exchange. The main reasons were portability, durability, divisibility, uniformity, limited supply and acceptability. Most coins were valued by the purity and type of metal used, its weight and its stamp. Gold coins became the most common form of currency around the world.

However, in the 1800’s countries started adopting Gold Standard. England, USA, and other major countries adopted a system in which a piece of paper (fiat currency) is equal to a certain value of gold that can be redeemed by the holder of this paper from the government. Since the notes were a promise to pay a certain level of gold from the government, the value of that paper became equal to the value of gold it was backed by.

During the First and Second World Wars, the limits of this system were tested when the European countries needed to print more money to pay for the war. This led to the creation of Bretton Woods System. In this system, all the major currencies would be pegged (fixed rate) to the US Dollar and the US Dollar would be pegged to gold. It made sense as USD was the benchmark currency at that time and US had the majority of gold reserves in the world. The shortage of gold relative to the US dollars in circulation brought an end to the Bretton Woods agreement in 1971.

After a series of failed agreements, countries made the switch to the free-floating system that we know today. In this system the value of one currency in other currency’s terms is decided by the relative supply and demand of the currencies. Before the Internet, the major players in this market were large financial institutions and central banks. With the internet, anybody with a computer and access to internet can access the forex market and exchange currencies. This changed everything not just for Forex market but also for other financial markets. Now investing in or trading with another country became extremely easy. The costs (spreads) were reduced, and the movement of money (capital) was faster than ever.

The History of Forex
 The History of Forex
Source: Daily FX.

Although the Forex Markets, as we know it, are relatively new, people have always been exchanging currencies for trade. This lead to a creation and prosperity of a very specific profession- Money Changing.

Related posts on the SimTrade blog

   ▶ Nakul PANJABI Art as a financial asset class

   ▶ Nakul PANJABI Charging Bull on Wall Street

   ▶ Louis DETALLE What are the different financial products traded in financial markets?

Useful resources

About the painting

Wikipedia The Money Changer and His Wife

Louvre Abu Dhabi The Money Changer and His Wife

Joy Of Museums virtual Tours “The Money Changer and His Wife” by Quentin Matsys

Brugge Brugge: History in a nutshell

About the foreign exchange

IG Benefits of forex trading

Daily FX The History of Forex

About the author

The article was written in November 2022 by Nakul PANJABI (ESSEC Business School, Grande Ecole Program – Master in Management, 2021-2024).

Market efficiency: the case study of Yes bank in India

Market efficiency: the case study of Yes bank in India

Aamey MEHTA

In this article, Aamey MEHTA (ESSEC Business School, Master in Finance, Singapore campus, 2022-2023) explains the key financial concept of market efficiency.

What is Market Efficiency?

An informationally efficient market is a market in which the current price of a security fully, rationally, and quickly reflects all information of that security

We can measure the efficiency of a market by observing the lag between the time that information is received to the time that the security’s price reflects this information. If there is a large lag, then traders can make use of this information to generate positive returns. For efficient markets the price of a security should not be affected by information that is already expected. The changes in price should be due to new information, i.e., information that was unexpected. For example: if a company’s earning is expected to be $10M (market consensus) and their earnings are $10M, this should not cause a change in the company’s price. However, if the earnings were $20M or $5M, then the shock news will cause the stock price to move upwards or downwards.

Market efficiency and investment styles

In a perfectly efficient market investors should use a passive investment strategy. This is because in such a market it is not possible to beat the market. In efficient markets investors can expect the market value of an assets to be equal to its intrinsic value. Using an active strategy will result in underperformance compared to the market due to transaction costs. However, if the market is inefficient, then active investment strategies can result in a profit for the investor.

What factors affect market efficiency?

Generally, markets are neither perfectly efficient or inefficient. The degree of efficiency depends on the following factors: the number of market participants, the availability of Information, and impediments to trading.

Number of market participants

The higher the number of market participants the more efficient the market is. Market participants include investors, traders, analysts, and people who follow the market. The number of participants can vary over time and across countries. Some countries prevent foreigners from trading on their markets which reduces market efficiency.

Availability of Information

The more information that is available to the investors, more efficient the market is. The easier and cheaper it is to access the information the more efficient the market will be. The access to information should not favor one group over another and should be equally available to all participants. If participants have access to material nonpublic information about the firm they should not trade on this information as this would constitute insider trading which is illegal. In developed markets there is abundance of information, and the markets are efficient. Example: New York Stock Exchange. In less developed markets the availability of information is lower and hence markets are less efficient. Example: the forwards market.

Impediments to trading

Arbitrage refers to buying an asset in one market and simultaneously selling it in another market at a higher price. This buying and selling will continue till price in both the markets are the same and arbitrage is no longer possible. Impediments to trading such as high transaction costs will restrict arbitrage opportunities and allow for some mispricing of assets.

Short selling prevents assets from being overvalued and hence short selling improves market efficiency. Restrictions on short selling, such as inability to borrow stock cheaply will reduce efficiency.

Transaction and information costs

If the cost of gathering information, analysis and trading is more than the cost of trading misvalued assets markets will be inefficient. If after deducting costs, there is no risk adjusted returns to be made from trading based on publicly available information then the markets are said to be efficient.

Types of market efficiency

Weak form of market efficiency

This form of market efficiency states that current security prices fully reflect all currently available security market data. Thus, past price and volume information will have no predictive power over the future direction of security prices because price changes will be independent from one period to the next.

Semi-strong form of market efficiency

This form holds that security prices rapidly adjust without bias to the arrival of new public information. Current security prices fully reflect all publicly available information. This form says that security prices include all past security market and non-market information available to the public. Examples: Information on the financials reports published by the company, news about the company.

Strong form of market efficiency

This form states that security prices fully reflect all information from both public and private sources. The strong form includes all types of information: past security market information, public and private (insider) information. This means that no group of investors has monopolistic access to information relevant to the formation of prices and no one should be able to generate positive risk adjusted returns.

What do we know about the efficiency of the market?

Fama

Fama, in his paper Efficient Market Hypothesis defined a market to be “informationally efficient” if prices at each moment incorporate all available information about future values.

The efficient market hypothesis states:

  • Current prices incorporate all available information and expectations.
  • Current prices are the best approximation of intrinsic value.
  • Price changes are due to unforeseen events.
  • “Mispricings” do occur but not in predictable patterns that can lead to consistent outperformance.

The efficient market hypothesis does not state:

  • All investors are rational.
  • Prices are always right.
  • Prices should be stable.
  • Professional money managers can’t earn higher than market returns.

The Grossman-Stiglitz paradox

This paradox was proposed by Stanford Grossman and Joseph Stiglitz. They argue that perfectly informationally efficient markets are an impossibility since, if prices perfectly reflected available information, there is no profit to gathering information, in which case there would be little reason to trade and markets would eventually collapse.

Investors that purchase index funds or ETFs benefit at the expense of investors who pay for financial services either indirectly or directly via investing in actively managed funds.

Case study: yes bank

Yes Bank is an Indian Bank founded in 2004 by Rana Kapoor and Ashok Kapur, headquartered in Mumbai, India.

Yes bank is a private sector bank. In March 2020, Yes Bank faced a historical crisis. There are various reasons that led Yes bank to this crisis, they are, there were a large number of bad loans given by banks and depositors have withdrawn large numbers of amounts from the bank. There was no balance between the loan sheet and the depositors’ sheet. RBI put a 30 days moratorium on Yes Bank to save it.
A major effect of the yes bank crisis was that there was a big chance that other financial institutions could collapse. But the Reserve Bank of India took initiative and saved Yes Bank from major collapse.

In May 2020 shares of Yes Bank Ltd. fell as much as 84.65 percent intraday to Rs 5.65 apiece—the lowest on record—but pared some of the losses to traded 51.63 percent lower at Rs 17.80. The S&P BSE Sensex fell 1,450 points and NSE Nifty 50 slipped below 10,900. This, after the Reserve Bank of India on Thursday evening superseded the board of the lender and imposed curbs on its operations for a month.

stock chart of yes bank
Logo of Wells Fargo
Source: internet.

Useful resources

Academic resources

Fama E. (1970) Efficient Capital Markets: A Review of Theory and Empirical Work, Journal of Finance, 25,383-417.

Fama E. (1991) Efficient Capital Markets: II Journal of Finance, 46, 1575-617.

Grossman S.J. and J.E. Stiglitz (1980) On the Impossibility of Informationally Efficient Markets The American Economic Review, 70, 393-408.

Business resources

Yes bank

Related posts on the SimTrade blog

   ▶ Youssef LOURAOUI Passive Investing

   ▶ Youssef LOURAOUI Active Investing

   ▶ Akshit GUPTA Portfolio manager – Job description

About the author

The article was written in November 2022 by Aamey MEHTA (ESSEC Business School, Master in Finance, Singapore campus, 2022-2023)

My experience as a credit analyst at Wells Fargo

My experience as a credit analyst at Wells Fargo

Aamey MEHTA

In this article, Aamey MEHTA (ESSEC Business School, Master in Finance, Singapore campus, 2022-2023) shares his experience as a credit analyst at Wells Fargo.

The Company

Wells Fargo is the fourth largest bank in the United States in terms of total assets, with $1.9 trillion AUM. It is headquartered in San Francisco. On February 2, 2018, account fraud by the bank resulted in the Federal Reserve barring Wells Fargo from growing its nearly $2 trillion-asset base any further until the company fixed its internal problems to the satisfaction of the Federal Reserve. In September 2021, Wells Fargo incurred further fines from the United States Justice Department charging fraudulent behavior by the bank against foreign-exchange currency trading customers. Under the leadership of the current CEO Charles W. Scharf the bank is aiming to stabilize and improve the bank’s public image and I was able to witness the transition first hand as well as the CEO’s vision and mission for the company.

I worked in the Subscription Finance Group (SFG) which is under the Corporate and Investment Banking (CIB) department of the organization. The team was newly set up in India to provide support to the main team in the US and UK. This gave me exposure to several different aspects of the business and allowed me to learn a lot.

What is Subscription Finance?

Subscription credit facilities typically take the form of a senior secured revolving credit facility secured by the unfunded capital commitments of the fund’s investors. The facilities are subject to a borrowing base determined based on the value of the pledged commitments of investors satisfying specified eligibility requirements, with advance rates based on the credit quality of the relevant investors.

The purpose of subscription credit facilities is usually to provide liquidity for the fund on a faster basis than calling for capital contributions. Under a credit facility, borrowed funds typically can be made available within a day, while under a typical limited partnership agreement, capital calls may take 10 business days or more.

Logo of Wells Fargo
Logo of Wells Fargo
Source: Wells Fargo.

My Internship

I worked at Wells Fargo full time for 16 months from March 2021 to July 2022 and was mainly involved in the credit risk and analysis of the various clients of the bank (investment funds like hedge funds and real estate funds). Subscription Finance is a niche part of finance which refers to the process by which investors sign up and commit to investing in a financial instrument, prior to the actual closing of the purchase. Wells Fargo lent money to different investment funds. The collateral was the uncalled capital that these funds could draw from their respective investors. Wells Fargo would internally review the investors in each fund and come up with a risk profile for each client. The fees for these loans were LIBOR plus a negotiate premium.

My missions

  • Part of the team that undertook the task of preparing an Annual Review credit memo for the first time in India as well as teaching 7 new members of the team on how the process is done.
  • Co-Led the setup and work of the 5-member Deal Structuring Squad which undertook the task of understanding the terms that were included in various credit memos and educating the rest of the 25- member team on what each data point meant and where this information was sourced from.
  • Led the team that undertook the process of preparing and analyzing the FX Portfolio Overview File every week and established a reporting framework with the US team lead. The team highlighted and resolved 2 key errors that were previously overlooked.
  • Part of the Portfolio Overview team that undertook the preparation of the daily Portfolio Overview File. The team analyzed the daily reports and highlighted any discrepancies that arose. The reports generated were distributed firm-wide.
  • Completed Financial Spreading for 46 deals every quarter.

Required skills and knowledge

For the role I needed to have a working knowledge of how credit ratings are relevant during due diligence of a company. I also needed to have basic finance knowledge of how loans are priced and how hedge funds and other investment funds make money. However, the most important skills that were needed were those of ethics and compliance. As we were working with sensitive and private information it was of utmost importance that we were in compliance with the banks guidelines and did not violate any compliance standards.

What I have learnt

My full-time role taught me how hedge funds and large asset managers set up their different funds. It was insightful to learn about the different structures of the various and how they differ across geographies.

Another important learning was how different asset managers have different funds. The funds have different investment strategies such as real estate and each strategy would have different terms and different credit terms to analyze and look at.

There were several soft skills that I learnt too. The biggest one being communication. We were constantly in touch with the team in the US and liaising with them across different time zones to schedule calls and trainings was a new experience for me.

During this job I was also able to significantly improve my excel skills and understanding of several functions. This helped to increase my efficiency at my role and make some files more functional for the organization.

Three key financial concepts

Here are three useful concepts I used during my job at Wells Fargo.

Interest Rate Pricing

During my time working at Wells Fargo, I learnt that LIBOR was no longer the benchmark that was going to be used to determine pricing. The market was transitioning to a new rate called SONIA. SONIA is rate based on the actual overnight rate in active and liquid wholesale cash and derivatives market which makes it more robust and less volatile than LIBOR. The key difference is that LIBOR is forward-looking – it is agreed at the start of an interest period. SONIA is backward-looking – it cannot be determined until the end of an agreed interest period. This means that borrowers will no longer have upfront certainty about the amount of their interest payments and will require the calculations of the interest due at the end of the period.

Sovereign Immunity

Some of the clients of the bank were government backed funds and institutions. For example, a client was Abu Dhabi Investment Council (ADIC), which is the investment arm of the Government of Abu Dhabi and had $829 Billion of AUM as of 2022. These clients had sovereign immunity. Sovereign immunity refers to the fact that government cannot be sued. In the USA this is particularly relevant in the state of Texas. The main learning point was how banks like Wells Fargo treat such special entities, that is to say how it defines the different credit terms for these entities and how it takes into account for the fact that there is no recourse on such loans (due the sovereign immunity of these entities).

Credit Rating

I learnt that the credit rating analysis done by different agencies such as S&P and Moody’s, do not use the same approach. Often the ratings provided by both agencies may vary. The bank used to collate ratings from these two rating agencies for the same entity. Based on the ratings the bank would use an internal credit rating system to provide three different scores across three different categories for the entity. These scores fell into different bands as defined by the bank’s policy. Based on which band they fell into; different terms were offered to the clients and different negotiation was done. For example, a client that had a lower score across the categories would be offered more flexibility and better terms. The credit ratings were also assigned to the various investors of the fund as they were to be used as collateral while availing the loan which resulted in extensive due diligence.

Related posts on the SimTrade blog

   ▶ All posts about Professional experiences

   ▶ Jayati WALIA My experience as a credit analyst at Amundi Asset Management

   ▶ Jayati WALIA Credit risk

   ▶ Rodolphe CHOLLAT-NAMY Credit analyst

   ▶ Alexandre VERLET Classic brain teasers from real-life interviews

Useful resources

Wells Fargo

S&P Global (rating)

S&P Global (Capital IQ)

Moody’s

About the author

The article was written in November 2022 by Aamey MEHTA (ESSEC Business School, Master in Finance, Singapore campus, 2022-2023).

What are rating agencies and what are used they for?

What are rating agencies and what are used they for?

Louis DETALLE

In this article, Louis DETALLE (ESSEC Business School, Grande Ecole Program – Master in Management, 2020-2023) explains what are the different rating agencies and what are they used for?

What is a rating agency?

The purpose of a rating agency is to assess the credit risk of a company or a state. Since the 1980s, these agencies have become benchmarks for both issuers and investors when issuing bonds, for example. They therefore play a major role since the information they communicate (rating, positive or negative outlook) greatly influences the way in which the financial markets perceive the rated companies and states. However, the reputation, independence and existence of rating agencies are sometimes being questioned.

What are the main rating agencies?

There are mainly three rating agencies: Moody’s, Standard & Poors and Fitch Ratings. These three rating agencies are all American. Besides the three main agencies, the Chinese Dagong has gained in importance in recent years, especially in Asian countries.

Each rating agency choses its own rating ranking that you can see below:

Comparison of ratings of credit rating agenciesComparison of ratings of credit rating agencies
Source: internet.

After a grade is given to a company by one of these three rating agencies, it will determine how the company is perceived on financial markets. For example, if a company with a “BB-“ S&P rating wants to issue a bond, it will have to pay a higher interest rate to the bond’s buyers that a company with a “A+” S&P rating for the same bond issuance. All this is due to the fact that the risk of default from the BB- company will be greater than the A+ company. For that matter, it will be more expensive for “poorly rated” companies to issue debt on financial markets.

Why are rating agencies debated so much?

Rating agencies are often questioned because of the influence they have. Indeed, the three major rating agencies, Moody’s, Standard & Poor’s and Fitch Ratings, together account for 94% of the government and company rating market as of June 2022. This raises a first concern, relating to the plurality of sources of information and the asymmetry of the financial markets, which are partly based on the information provided by only three rating agencies.

On the other hand, since lower-rated securities present risks and therefore higher interest rates, the rating process ends up acting in a pro-cyclical way. When a company and/or a state suffers a downgrade, this has the direct consequence of increasing the cost of its financing and aggravating the issuer’s difficulties. The opposite is true: when a company sees its rating get better, the cost of its debt will go down and it will improve its financial health…

Finally, since the rating agencies are paid by the companies that want to be rated by them, a potential conflict of interest seems possible. Some rating agencies have entire departments devoted to advising the potential client on how an operation – a merger for example- would impact the rating…

What role did credit rating agencies played during the subprime crisis?

Rating agencies have played a crucial role in securitization, a financial technique that transforms illiquid assets into easily tradable securities, such as bonds. The agencies then rate the securitized loan packages and the bonds issued as counterparts according to different risk bands. This is what the rating agencies did: they rated the baskets containing subprime loans. But the agencies were far too generous in giving AAA ratings (the highest rating) on the securitized packages. This contributed to the euphoria surrounding these financial products. Without this rating, the real risk would probably have been better understood.

Then, when the housing market turned, the agencies did not downgrade mortgage securities properly and in time. They reacted too late and with abrupt downgrades, which aggravated the crisis.

In the end, almost all of the mortgage securitizations marketed in 2006 with a AAA rating are now rated as “junk bonds”.

Related posts on the SimTrade blog

▶ Louis DETALLE A quick presentation of the M&A field…

▶ Frédéric ADAM Senior banker (coverage)

Resources

Article about how Rating Agencies played a significant role in the subprime crisis in 2008…

S&P

Moody’s

Fitch Ratings

About the author

The article was written in November 2022 by Louis DETALLE (ESSEC Business School, Grande Ecole Program – Master in Management, 2020-2023).

A quick review of the tax specialist’s job…

A quick review of the tax specialist’s job…

Louis DETALLE

In this article, Louis DETALLE (ESSEC Business School, Grande Ecole Program – Master in Management, 2020-2023) explains what a tax specialist works on, on a daily basis.

What does the tax specialist’s job consist in?

A tax lawyer’s main task is to advise a company on the projects it intends to carry out to ensure that these projects are as optimized from a tax point of view while remaining legal. This means that the job of a tax lawyer is to use its knowledge of the legal environment and the latest standards to save the company money by limiting the amount of tax it has to pay. For business projects, this can be an acquisition, various investments, relocation, setting up abroad, and many other projects. The tax lawyer is also the privileged interlocutor and support of a company when it enters into a financial and/or legal dispute with the regulatory authorities for example.

It is the tax lawyer who guarantees the proper conduct of all the company’s operations through his or her recommendations! Thus, the tax lawyer is responsible for choosing the appropriate tax regime for each company, depending on its characteristics and the current state of affairs.

Why would a company employ a tax specialist rather than resort to legal cabinets whenever they need them?

Whether it is the drafting of a contract or the creation of a subsidiary on the other side of the world, the law and taxation of these operations is inherent to their successful completion. This is why the company resorts to a tax specialist at all times, since it needs a rapid response to the slightest of its questions that can come up anytime since law is always involved.

On the other hand, the advantage of having a tax specialist dedicated to the company is that the latter will develop a fine understanding of the company, its structure and its network. In doing so, the tax specialist will be able to provide a more personalized and tailored solution than a tax consultancy that discovers the company when it becomes a client.

What does a tax specialist work on?

The tax specialist’s job is to bring his or her skills to help the company to fill in its tax return if it is complex. He or she can also help with inheritances, in order to calculate the transfer duties that will be applied free of charge. For example, this is an important feature of LVMH, which Bernard Arnault has structured in order to anticipate his succession. For example, he had the holding company that owns LVMH – the Agache holding company – transformed into a limited partnership. This type of company is recognized as a good solution to control family groups (see “Resources” section below).

The tax lawyer can also assist the taxpayer when he wants to repatriate funds held abroad. The tax lawyer also comes in support when his client is subject to a tax audit, in this case, his mission is to ensure that the tax authorities do not exceed their powers and respect the procedural guarantees. He must assist him in all stages of the procedure in progress.

Finally, the optimization of his clients’ assets is also part of his missions. The Chief Financial Officer and the tax lawyer will therefore work together to ensure that the company’s real estate holdings are secure, optimized and in compliance with the law. When the tax lawyer works in collaboration with a company, his role is to defend the legal and economic interests of the latter and, in fact, he will be able to manage the various disputes directly related to its activity.

Why does the tax specialist’s job appeal so much to people?

First of all, it is the dynamic working environment that the legal environment constitutes that attracts tax specialists. Indeed, the law evolves with time, and this constitutes the first argument given by them. In fact, as the law is not the same today as it was yesterday, a tax specialist is often demanded to keep a close look at the different regulation changes that happen.

In addition, the position of this job within companies also makes the job really interesting because the tax specialist can interact with other departments such as the Corporate Strategy Department and the Board of Directors. For that matter, a tax specialist career can be very challenging, and this is what young lawyer seek for.

Resources

Youtube Interview with a Tax Specialist

Article about the main trends in taxation in the European Union in 2020

LVMH: how is Bernard Arnault preparing his succession?

Related posts on the SimTrade blog

All posts about jobs in finance

▶ Louis DETALLE A quick review of the ECM (Equity Capital Market) analyst’s job…

About the author

The article was written in November 2022 by Louis DETALLE (ESSEC Business School, Grande Ecole Program – Master in Management, 2020-2023).

How does a takeover bid work & how is it regulated?

How does a takeover bid work & how is it regulated?

Louis DETALLE

In this article, Louis DETALLE (ESSEC Business School, Grande Ecole Program – Master in Management, 2020-2023) explains how takeover bids and public tender offers work…

What is a takeover bid?

A takeover bid is a transaction launched by a company or a group of investors with a view to taking control of another listed company. After approval and review of the takeover proposal, the buyer triggers the launch of its takeover bid.

The launch of a takeover bid marks the beginning of a period during which the shareholders of the target company will be able to choose whether to keep their shares or to sell them to the acquiring company at a price higher than the last quoted price. This difference corresponds to a premium to encourage the shareholders of the target company to tender their shares to the bid.

There are two cases: cash takeover bids and equity takeover bid.

Cash Takeover bid: If the offer to acquire all the listed shares of the target company is in cash, it is called a cash takeover bid.

Equity Takeover bid: The bid can also be made in shares, i.e., the bidder will pay with its own shares. In this case, the bidder usually carries out a capital increase that will create these shares. This is known as a Public Exchange Offer (PEO) because the shareholders of the target company will be able to exchange their shares for a given number of shares in the initiating company according to an exchange ratio.

The bid can be either friendly or hostile. A takeover bid is “friendly” or “solicited” when the bid is made in agreement with the board of directors or supervisory of the target company; it is “hostile” or “unsolicited” in other cases.

The role of public authorities in regulating takeover bids?

In France, the company that initiates the takeover bid files a draft offer document with the Autorité des Marchés Financiers or AMF (the French authority about financial markets), which presents all the characteristics of the bid to investors. It is published as soon as it is filed, but is still subject to review by the AMF, which may request changes to its form and content.

• At the same time, the initiating company publishes a press release that presents the main features of the draft offer document.
• The target company may then publish a press release disclosing its board’s opinion on the bid and, where applicable, the conclusions of the independent expert’s report and the reasons for the bid.

This press release is submitted to the AMF for review and contains, in particular, the board’s reasoned opinion on the bid and, where applicable, the fairness opinion of the independent expert appointed by the company and the opinion of the works council.

To sum up, the French Authorities -through the AMF- will ensure the transparency of the potential merger between the two companies.

In addition, the Autorité de la concurrence (the French authority about competition) will assess whether the takeover bid is contradictory with the antitrust regulations & others. This is what happened with the TF1-M6 potential merger that we discussed a few weeks ago in an article (see “Related posts on the SimTrade blog” section below). On the other hand, the French Autorité de la concurrence declared this morning that the tender offer of EDF by the French state was allowed.

In the US, the institution from which companies must seek authorization from is the SEC (Securities Exchange Commission). For example, the SEC allowed Merck to buy Imago BioSciences Incorporation 2 days ago.

As regards French Autorité de la concurrence, only transactions exceeding a certain size are subject to its review. This is the case when the following three conditions are met:

• The total worldwide turnover (excluding tax) of all the undertakings or groups of natural or legal persons involved in the merger exceeds 150 million euros;

• The aggregate turnover excluding tax in France of at least two of the undertakings or groups of natural persons or legal entities concerned is more than EUR 50 million.

• The European Commission is not relevant for this merger

Indeed, sometimes, the European Commission’s approval may also have to be seeked for, when companies operate at a continental level. When the transaction involves the territory of more than one Member State and the turnover of the undertakings concerned is very large (e.g., where the worldwide turnover exceeds EUR 5 billion for all the parties to the transaction and EUR 250 million for at least two of the companies in the European Union), the European Commission is competent.

Resources

Autorité de la Concurence (French Competition Authority)

Autorité des Marchés Financiers (AMF) (French Financial Market Authority)

Bank mergers and acquisitions in the euro area: drivers and implications for bank performance

Related posts on the SimTrade blog

▶ Louis DETALLE A quick presentation of the M&A field…

▶ Frédéric ADAM Senior banker (coverage)

About the author

The article was written in November 2022 by Louis DETALLE (ESSEC Business School, Grande Ecole Program – Master in Management, 2020-2023).