Fixed-income products

Fixed-income products

Jayati WALIA

In this article, Jayati WALIA (ESSEC Business School, Grande Ecole – Master in Management, 2019-2022) presents fixed-income products.

Introduction

Fixed-income products are a type of debt securities that provides predetermined returns to investors in terms of a principle amount at maturity and/or interest payments paid periodically up to and including the maturity date (also known as coupon payments). For investors, fixed-income securities pay out a fixed set of cashflows that are known in advance and are hence preferred by conservative investors with low-risk appetite or those looking to diversify their portfolio and limit risk exposure. For companies and governments issuing these securities, it is a mechanism to raise capital to fund operations and projects.

The most elementary type of fixed-income instrument is the coupon-bearing bond. The values of different bonds depend on the coupon size, maturity date and market view of future interest rate behaviours (or essentially bond market yields). For eg., prices of bonds with longer maturity fluctuate more by interest rate changes. Bonds are generally traded OTC unlike equity stocks that are traded via exchanges. The risk exposure of a bond can be gauged by their Credit Rating issued by rating agencies (S&P, Moody’s, Fitch). The least risky bonds have a rating of AAA which indicates a high measure of credit worthiness and minimum degree of default.

Fixed-income products can come in many forms as well which include single securities like treasury bills, government bonds, certificate of deposits, commercial papers and corporate bonds, and also mutual funds and structured products such as asset back securities.

Types of fixed-income products

Fixed-income products come in several structures catering to the needs of investors and issuers. The most common types are explored below in detail:

Treasury bills

Treasury bills (also called “T-bills”) are money market instruments that are issued by governments with a short maturity ranging from one month to one year. These bills are used to fund short-term financing needs of governments and are backed by the Treasury Department. They are issued at discounted value and redeemed at par value. The difference between the issuance and redemption price is the net gain or income for the investor. The T-Bills are generally issued in denomination of $1,000 per bill. For example, if you buy a T-bill issued by the US Department of Treasury with a maturity of 52 weeks at $990, you will redeem your T-bill at a price of $1,000 upon maturity.

Treasury notes and bonds

Treasury notes and bonds are a type of fixed-income security issued by governments with a medium or long maturity beyond one year. These bonds are used to fund permanent financial needs of governments and are backed by the Treasury Department. They come with predetermined interest payments. They are considered to be the safest investment since they are backed by the government. As a consequence, government bonds come with low returns. Government bonds are usually traded over the counter (OTC) markets. Technically, government bonds come in various forms: zero-coupon bonds, fixed payment and inflation protected securities.

Corporate bonds

Corporate bonds, as the name suggests, are issued by corporations to finance their investments. They generally come with higher yields as compared to the government bonds as they are perceived as more risky investments. The expected return for such bonds generally depends on the company’s financial situation reflected in its credit rating. Corporations can issue different types of bonds which includes zero-coupon bonds, floating-rate bonds, convertible bonds, perpetual bonds, and subordinated bonds.

Asset-backed securities

Asset-backed securities (ABS) is a kind of fixed-income product that comprises of multiple debt pools packaged together as a single security (also known as ‘securitization’) and sold to investors. The assets that can be securitized include home loans (mortgages), auto loans, student loans, credit card receivables among others. Thus the interest and principal payments made by consumers of the individual debts are passed on to the investors as the yield earned on the ABS.

Benefits of fixed-income products

For issuers

Generally, fixed-income products are issued by governments and corporations to raise capital for their operation.

For firms, the issuance of bonds in financial markets along with bank credit (two types of debt) allows firms to use leverage. Interests can also be deduced from income such that the firm will pay less taxes.

For investors

The investment in fixed-income products is considered to be a conservative strategy as it presents low returns (compared to stocks) but also provides a relatively low-risk exposure. Other benefits include:

  • Capital protection: Fixed income products carry less risk as compared to other asset classes such as stocks. These investments ensure capital preservation till the maturity of the investment and are preferred by investors who are risk averse and look for stable returns.
  • Generation of predetermined income: The income from fixed-income products is generated by means of interest or coupon payments. The income level for such products is predetermined at the time of investment and is paid on a regular basis (usually semi-annually or annually). Also, investors benefit from income tax exemption on investment in many fixed-income products.
  • Seniority rights: The holders of corporate bonds get seniority rights in terms of repayment of their capital if the company goes into bankruptcy.
  • Diversification: The fixed-income markets are less sensitive to market risk compared to the equity markets. So, the fixed-income products are considered to be less risky than the equity market investments and generally provides a fixed or stable stream of income. To manage the risk exposure for any portfolio, investors prefer investing in fixed income products to diversify their investments and offset any losses which may result from the equity markets.

Risks associated with fixed-income products

While fixed-income securities are considered to provide relatively low risk exposure, volatility in the bond market may still prove tricky. Bond value and interest rates have an inverse relationship and increase in interest rates thus affects the bond value negatively. Due to the fixed coupon rate and interest payments, fixed-income securities are highly sensitive to inflation rates as cashflows may lose value. There is also credit risk including potential default by the issuer. If an investor buys international bonds, she/he is always exposed to exchange risk due to the ever-fluctuating FX rates.

Thus it is essential for investors to take into account these factors and purchase fixed-income securities according to their individual requirements and risk appetite.

Useful resources

Amodeo K. (10/05/20201) Fixed Income Explanation, Types, and Impact on Economy The Balance.

Blackrock Education: What is fixed income investing?

Corporate Fiannce Institute: Fixed-income securities

Related posts

About the author

The article was written by Jayati WALIA (ESSEC Business School, Grande Ecole – Master in Management, 2019-2022).

What is an Institutional Investor?

What is an Institutional Investor?

img_SimTrade_Photo1_Raphael_Roero_de_Cortanze

In this article, Raphaël ROERO DE CORTANZE (ESSEC Business School, Grande Ecole Program – Master in Management, 2018-2022) explains what is an institutional investor.

What do an investment management firm like BlackRock, a Pension Fund like the Caisse de Dépôt et Placement du Québec and an insurance company like AXA Investment Managers have in common? They are all institutional investors, a wide group of investors that is behind the largest supply and demand movements in securities markets.

What is an Institutional Investor?

An institutional investor is an organization that pools money to purchase securities such as bonds or stocks, real-estate, and other assets on behalf of its clients. The characteristics of an Institutional Investor can be summarized in three points. An institutional investor:
Is a legal entity that manages a number of funds (not the fund itself)
Manages professionally numerous assets according to the interest and the goals of its clients
Manages a significant number of funds

Institutional investors include:

  • Banks (Goldman Sachs, BNP Paribas, etc.)
  • Credit unions (Navy Federal Credit Union etc.)
  • Insurance companies (Insurers like AXA or Reinsurers like SCOR)
  • Pension funds (Caisse de dépôt et placement du Québec etc.)
  • Hedge funds (Archegos, etc.)
  • Others: REITs (Real-Estate), investment advisors, endowments, and mutual funds.
  • Compared to other investors, Institutional Investors as professional investment managers face fewer regulations as they are believed to be more capable of protecting themselves from risk.

Institutional investor VS Retail Investor

A Retail Investor, or individual investor is a non-professional investor who purchases securities for its own personal accounts and often trade in dramatically smaller amounts as compared to Institutional Investors. Like Institutional Investors, Retail Investors are active in a variety of markets (bonds, options, commodities, forex, futures contracts, and stocks). Nonetheless, some markets are primarily for Institutional Investors, such as swaps and forward markets.

As an estimation, retail investors typically buy and sell stocks in round lots of 100 shares or more while institutional investors are known to buy and sell in block trades of 10,000 shares or more. Thus, institutional investors’ buying and selling decisions can have tremendous impact on shares prices. This is why Institutional Investors avoid buying or selling large blocks of small companies, as it could create sudden supply and demand imbalances which could be detrimental to the market equilibrium. Nonetheless, Institutional investors also typically avoid owning large stake in big companies because doing so can violate securities law: some Institutional Investors are limited as to the magnitude of their voting stake in a company.

As Institutional Investors’ investment strategy are expected to be formulated by market professionals, Retail Investors sometimes try to mimic buying and selling decisions of Institutional Investors. This behavior known as “smart money” also comes from the fact that Institutional Investors’ investment decisions are formulated according to extensive and well documented researches. As Institutional Investors have a lot more resources at their disposal (both cash and information) in order to invest, they bring in their wake numerous Retail Investors, eager to benefit from the Institutional Investors’ expertise.

The impact of Institutional Investors

As explained above, Institutional Investors can significantly impact financial markets through their buying and selling decisions. In 2015, the three biggest US asset managers (BlackRock, The Vanguard Group and Fidelity Investments) together owned an average of 18% in the S&P 500 Index and constituted the largest shareholder in 88% of the firms included in the S&P 500 index. Thus, it is no coincidence that Institutional Investors are often called “market makers” as they exert a large influence on the price dynamics of different financial instruments.

The majority of Institutional Investors focus on long-term profitability rather than short-term profit. Nonetheless, this statement strongly varies according to the investor which is considered. An Insurance Company for instance focuses on investment capable of creating long-term returns, as the money insurance companies invest comes directly from their client. As Insurance companies need to be capable of facing claim settlements, they cannot allow themselves to gamble with their clients’ money. That is why the Institutional Investors’ activism as shareholders is thought to improve corporate governance — exception being made for investors such as Hedge Funds which, through very aggressive investment management, can have long-term negative located impacts.
As a conclusion, the presence of Institutional Investors in a market creates a positive effect on overall economic conditions.

Key concepts

Bond

A bond is a fixed income instrument that represents a loan made by an investor to a borrower (typically corporate or governmental)

Credit Union

A type of financial institution similar to a commercial bank, is a member-owned financial cooperative, controlled by its members and operated on a not-for-profit basis.

Mutual Funds

Mutual funds give small or individual investors access to professionally managed portfolios of equities, bonds, and other securities. Each shareholder, therefore, participates proportionally in the gains or losses of the fund.

Options

Options are financial instruments that are derivatives based on the value of underlying securities such as stocks. An options contract offers the buyer the opportunity to buy or sell—depending on the type of contract they hold—the underlying asset.

Commodities

A commodity is a basic good used in commerce that is interchangeable with other goods of the same type. Commodities are most often used as inputs in the production of other goods or services.

Forex

The foreign exchange market is where currencies are traded. Forex markets exist as spot (cash) markets as well as derivatives markets offering forwards, futures, options, and currency swaps.

Futures contracts

Futures are derivative financial contracts that obligate the parties to transact an asset at a predetermined future date and price. The buyer must purchase or the seller must sell the underlying asset at the set price, regardless of the current market price at the expiration date.

Sources: OECD, Corporate Finance Institute, MarketWatch, Wallstreet Prep

About the author

Article written in June 2021 by Raphaël ROERO DE CORTANZE (ESSEC Business School, Grande Ecole Program – Master in Management, 2019-2022).

What is an Activist Investor?

What is an Activist Investor?

img_SimTrade_Photo1_Raphael_Roero_de_Cortanze

In this article, Raphaël ROERO DE CORTANZE (ESSEC Business School, Master in Management, 2018-2022) explains what is an activist investor.

What is an Activist Investor?

Activist Investors regularly make the headlines. In March 2021, Emmanuel Faber stepped down as CEO of Danone as a result of an aggressive campaign led by Bluebell Capital Partners and Artisan Partners, two investment funds.
Who are these activist investors? What is their modus operandi? And, above all, what are the consequences of their actions on the companies they target?

Activist investors are mostly Private Equity firms, hedge funds and wealthy individuals that acquire a significant stake in a public company in order to influence how the company is managed, with a view to extracting short-term profits. As shareholders activists, they attempt to use their rights as a shareholder of a publicly-traded corporation to bring about change within the corporation.

Activist investors seek companies they think are mismanaged, have excessive costs or could be run in a more profitable way. Their goal is to boost the short-term profitability of a company, in order to make a quick capital gain by reselling the shares at a higher price than the activist investor acquired them before the company’s upheaval.

Owning a small proportion of the shares of a publicly-traded company is sufficient for an activist investor to wield enough shareholder power to implement short-term profit maximizing changes. Indeed, 5% or even 3% can already carry a lot of control power: above a certain percentage of ownership, it is possible to request the inclusion of a draft resolution on the agenda of a general assembly.

Modus operandi

The typical modus operandi of activist investors is the following:

  • acquire some shares of a company
  • heavily criticize the company’s current management
  • demand changes: cost reductions, board seats, departure of the current CEO, etc.
  • convince other shareholders of the validity of their criticism and demands in order to gather around them sufficient shareholder voting rights and ownership to propose and implement their decision during a general assembly
  • see these changes being implemented and bring short-term profitability
    resell the shares

The Danone case

Mid-January, the activist fund Bluebell Capital Partners (with an ownership believed to range between 2% to 3%) began attacking Emmanuel Faber’s governance. It was joined a few days later by Artisan Partners (0,6% of ownership). Together they deplored what they considered to be the poor performance of the company compared to its competitors Unilever or Nestlé.

Initially, a separation of functions between chairman and CEO was made in response to the investment funds’ attacks: Emmanuel Faber would have remained chairman while his former CEO position would have been filled by Gilles Schnepp, former CEO of the Legrand group. However, the two funds quickly objected to this move and Emmanuel Faber was eventually forced to leave the group while Gilles Schnepp succeeding him as chairman (with two co-CEOs running the Executive Committee). In less than two months, therefore, the CEO was removed, replaced by a profile a little less focused on corporate social responsibility and a little more on financial results.

Activist investors: good or bad for shareholders?

On the one hand, one might think that the intervention of an activist fund is a good thing for the shareholders. Shareholder activism might bring about change in the corporation, or even in the company’s objectives and vision, and will lead to a growth in profits, which will inevitably result in a rise in the share price rather quickly.

However, it is important to keep in mind that activist funds have a short-term investment horizon and want to increase the share price quickly in order to pocket a capital gain as soon as possible. It’s far from being synonymous with long-term value creation. Furthermore, the public image of a company can be severely damaged by industrial actions and cost-cutting plans.

It is therefore difficult to say whether activist funds are beneficial or not. The arrival of an activist fund in a very badly managed company can be very good news. But it all boils down to what is considered to be a “bad” management. Could Emmanuel Faber’s focus on corporate social responsibility be really considered as bad management?

The role of activist investor cab be seen in two famous financial movies: Other people’s money and Wall Street.

Watch Garfield (in the Other people’s money movie) making his point about wealth maximization at the shareholders’ Annual Meeting of their company.

This could be compared to Gordon Gekko explaining “Greed, for the lack of a better word, is good” to the shareholders during the General Meeting of their company (in the Wall Street movie).

Useful resources

Sources: Les Echos, Boursorama, Investopedia, LegalAction, Wikipedia

Related posts

Film analysis – Other People’s Money

Film analysis – Wall Street: Money Never Sleeps

About the author

Article written in June 2021 by Raphaël ROERO DE CORTANZE (ESSEC Business School, Master in Management, 2019-2022).

In the shoes of a Corporate M&A Analyst

In the shoes of a Corporate M&A Analyst

img_SimTrade_Photo1_Raphael_Roero_de_Cortanze

In this article, Raphaël ROERO DE CORTANZE (ESSEC Business School, Master in Management, 2018-2022) shares his experience as a Corporate M&A Intern.

My internship at Scor

In 2020 as an intern, I had the opportunity to join the M&A Team of the French Reinsurer “SCOR” for 6 months.

As this internship allowed me to develop both hard and soft skills as well as helping me devising my future career path, I think it would be interesting to share this experience with you, hoping it could help you or give you some ideas.

SCOR Paris

SCOR is the world’s fourth-largest reinsurer with 16.4€bn of revenue in 2020. As a reinsurer, SCOR provides insurance companies with a range of solutions and services to control and manage the risks they face through its three divisions: Property & Casualty Reinsurance, Life & Health Reinsurance, and Investment Partners (the institutional investor division of SCOR).

What is a Corporate M&A Analyst?

A Corporate M&A Analyst is a Financial Analyst who works within and for a company, in comparison of a M&A Investment Banking Analyst who works in an Investment Bank or a Boutique.

The Corporate M&A Team is responsible for overseeing and carrying out all the transactions (acquisition, divesture, etc.) of a company. The team is in direct contact with investment banks, which it mandates in the case of an M&A operations. The team is also in direct contact with the Executive Committee and/or the Board of Directors of firms. Corporate M&A Analyst also work with other divisions within the company.

On average, a Corporate M&A Analyst and the rest of the M&A teamwork fewer hours than in an investment bank. Nonetheless, workhours strongly depend on the number of transactions the team makes in a year, and a M&A process can still be very intense and demanding even in a company.

What does a Corporate M&A Analyst do?

The tasks of a Corporate M&A Analyst are usually divided into two parts, the first being M&A-linked tasks and the other linked to the other activities the Corporate M&A team is related. For instance, at SCOR, the M&A team was also responsible for overseeing Corporate Finance at group level. Thus, I also worked on internal projects such as a cross-border restructuring project. In other corporates, M&A teams can be merged with Investor Relations, Strategy or for instance being only responsible for M&A related issues.

M&A tasks consist of:

  • Performing financial modelling and valuation: with conventional valuation tools (discounted cash flows, trading comparables and precedent transactions, etc.) and industry-specific tools (dividend discount model, appraisal value – for the Insurance/Reinsurance industry for instance)
  • Carrying out competitive and market intelligence of the industry: at SCOR I monitored 20+ competitors and targets, while devising regular updates and case studies on insurance/reinsurance transactions (merger, divesture, IPO, etc.)
  • Assisting in the execution on deals: in an acquisition or divesture process, the main task will be to perform valuation from bank documents (Info Memos), data rooms and internal data (in the case of a divesture). Compared to an M&A Analyst in an Investment Bank, a Corporate M&A Analyst also works on and follow the integration challenges raised by an acquisition.

The main tools used by a Corporate M&A Analyst are similar to the ones used by an M&A Analyst in a bank: Excel and Powerpoint of course, but also financial data providers such as Bloomberg, Factset, S&P Global, etc.

How can you become a Corporate M&A Analyst?

The majority of Corporate M&A Analysts and their colleagues usually spend some time in an Investment Bank before joining a Corporate M&A Team. This is why the work habits of a Corporate M&A team are similar to those in a bank: high attention to details, same requirements in terms of mastery of Excel and Powerpoint, high expectations in terms of speed and quality.

Between a job at an investment bank a corporate job, a Corporate M&A position can be a good opportunity to get the best of both worlds: high level of technicity and knowledge of a sector, combined with a more manageable workflow. Furthermore, members of a Corporate M&A team have the opportunity to work on transforming deals for the sake of the company they work for. In comparison, Investment Banking Teams continuously switch from a client to another, from a deal to another, without having the corporate strategy dimension of a Corpor
ate M&A Team.

Key concepts

Trading comparable

A comparable company analysis (CCA) is a process used to evaluate the value of a company using the metrics of other businesses of similar size in the same industry. Comparable company analysis operates under the assumption that similar companies will have similar valuation multiples, such as EV/EBITDA. Analysts compile a list of available statistics for the companies being reviewed and calculate the valuation multiples in order to compare them.

Precedent transaction

The cost of a precedent transaction is used to estimate the value of a company that is being considered. The reasoning is the same as that of a prospective home buyer who checks out recent sales in a neighborhood.

Discounted cash flow

The discounted cash flow (DCF) method is a valuation method used to estimate the value of an investment based on its expected future cash flows. DCF analysis attempts to figure out the value of an investment today, based on projections of how much money it will generate in the future. A DCF valuation of a company gives the Enterprise Value.

Dividend discount model

The dividend discount model (DDM) is a quantitative method used for predicting the price of a company’s stock based on the theory that its present-day price is worth the sum of all of its future dividend payments when discounted back to their present value. A DDM valuation gives the Equity Value (or stock value).

Divesture

A divestiture is the partial or full disposal of a business unit which most commonly results from a management decision.

Property & Casualty insurance

Property and casualty (P&C) insurance provides coverage on assets (e.g., house, car, etc.) and also liability insurance for accidents, injuries, and damage to other people or their belongings.

Life & Health insurance

Life and health (L&H) insurance provides coverage on the risk of life and medical expenses incurred from illness or injuries.

Reinsurer

A reinsurer is a company that provides financial protection to insurance companies (basically an insurer of an insurer). Reinsurers handle risks that are too large for insurance companies to handle on their own and make it possible for insurers to obtain more business than they would otherwise be able to.

Related posts on the SimTrade blog

   ▶ All posts about Professional experiences

   ▶ Basma ISSADIK My experience as an M&A Analyst Intern at Oaklins Atlas Capital

   ▶ Louis DETALLE A quick presentation of the M&A field…

   ▶ Suyue MA Analysis of synergy-based theories for M&A

Useful resources

Sources: Investopedia, Wikipedia, Corporate Finance Institute, Scor

About the author

Article written in April 2021 by Raphaël ROERO DE CORTANZE (ESSEC Business School, Master in Management, 2018-2022)

Covid-19 and its effect around hospital

Covid-19 and its effect around hospital

Subhasish CHATTERJEE

This article written by Subhasish CHATTERJEE (ESSEC Business School, Master in Strategy & Management of International Business (SMIB), 2020-2021) discusses the financial impact of the Covid-19 crisis on the healthcare sector in India and especially for hospitals.

Impact of the Covid-19 crisis on hospital operations

For any organization, a positive operating margin is essential for long-term Financial stability. Few organizations can maintain themselves for a long period when total operating expenses are greater than total operating revenues. A positive operating margin allows the organisation to develop its business by financing new projects with internal financial resources along with external financial resources such as debt and equity.

For hospitals, a positive operating margin allows them to invest in new treatment services for enhancing patient satisfaction, building of new facilities, and researching on new drugs.

Before Covid-19

Compared with other sectors, healthcare margins typically have been very low. Even before the appearance of Covid-19, a number of Indian hospitals struggled with poor or even negative margins—in other words, they were losing money on their operations. In fact, the median hospital margin was around 4.7 percent. This situation has been perilous to the future viability of many of Indian hospitals.

My experience during my internship

When the Covid-19 pandemic emerged, hospitals had to renounce the non-Covid treatment. The result was a drastic slowdown in volume of patients and in revenue, but the expenses remained high. To date, nobody can assure when and to what degree these non-Covid patients will return in the hospital. The result has been an uncertain future about the ability of hospitals to serve their communities and remain financially viable. My experience was in India but if you follow the statistics, the hospitals are suffering from same consequences anywhere in the world.

As indicated in Figure 1, during the year 2020, because of the Covid-19 crisis, 39.4% of hospitals lost more than 50% of their revenue compared to last year. Hospital Systems are Data from Hospital Centre Compiled Together.

Figure 1. Covid-19’s impact on hospital systems’ finances
Covid- 19 Impact on hospital systems finance
Source: AMGA surveys.

As indicated in Figure 2, during the year 2020, because of the Covid-19 crisis, 47.6% of independent medical groups lost more than 50% revenue as clinics couldn’t treat and provide bed to patients on a larger scale like hospitals. Independent Medical group are the private clinics run by physicians.

Figure 2. Covid-19’s impact on independent medical group finances
Covid- 19 Impact on independent medical group finances
Source: AMGA surveys.

The possible long-term impact of Covid-19 in hospitals

To date, the financial impact of Covid-19 has been significant, even with Government funding, the financial damage is likely to continue. Adding to this is the unpredictable nature of Covid-19. Now more than ever, hospitals will need support from governments, and will need to rethink their strategic–financial plans for what is likely to be a highly challenging environment even as Covid-19 cases diminish.

Key concepts

I present below key concepts to understand the financial situation of a business.

Ebitda

Ebitda = Revenue – Operating expense – Employee expense – Administrative & other expense

Some expenses of hospitals:

  • Wages and benefits
  • Professional fees
  • Food for patients
  • Medical equipment
  • Prescription drugs
  • Professional liability insurance
  • Utilities
  • Nursing, general and other professional services.

Some revenue of hospitals:

  • Patient service revenue
  • Research revenue
  • Academic revenue

Profit before and after tax

Profit before tax = Ebitda – Depreciation – Amortization – Interest on debt

Profit after tax = Profit Before Tax – Tax rate ✖ Profit Before Tax

Related posts on the SimTrade blog

   ▶ All posts about Professional experiences

About the author

Article written by Subhasish CHATTERJEE (ESSEC Business School, Master in Strategy & Management of International Business (SMIB), 2020-2021).

Veolia and Suez: the epitome of a hostile takeover bid

Veolia and Suez: the epitome of a hostile takeover bid

 Raphaël ROERO DE CORTANZE

In this article, Raphaël ROERO DE CORTANZE (ESSEC Business School, Master in Management, 2019-2022) details the Veolia-Suez saga.

Since August 30, 2020, when Engie put its 29,9% stake in Suez for sale, the Veolia-Suez saga continues to make headlines.

Veolia is a French company with activities in three main service and utility areas traditionally managed by public authorities: water management, waste management and energy services. Suez (formerly Suez Environnement) is a French-based utility company which operates largely in the water and waste management sectors. Suez is the largest private water provider worldwide, by number of people served.

Let’s go through the key stages of this saga with a view to understanding what is a hostile takeover, and why Veolia’s takeover bid on Suez can be considered as such.

August 2020: the beginning of hostilities

On August 30, 2020, Engie voiced its will to sell its 29,9% stake in Suez. This divesture aims at refocusing the group’s activities on renewable energies. Following this announcement, Veolia made a €2.9bn offer directly to Engie, for its stake in Suez. In the wake of this first offer, both boards of Engie and Suez rejected the bid: Suez feared that the acquisition would have serious consequences on the group’s employment, while Engie considered the offer price too low and put the increase of the offer price as a sine qua non condition to the completion of the deal.

This first offer is considered as a hostile bid as Veolia was willing to accomplish the acquisition with cash and by going directly to Engie, one of Suez’s shareholders, rather than by going to Suez’s board or executives. In other words, the transaction would have taken place without the approval of the purchased company.

September 2020: Engie accepts Veolia’s offer

Despite Suez’s counterattacks, Veolia continued and came back with a second offer at €3.4bn, higher than the first one, in order to convince Engie to give up its shares.

Engie’s board showed support for this second bid and later accepted the offer, highlighting the effort on the price, the strategic rationale and the social plan. Veolia, whose intention is to acquire the remaining 70% of Suez in the future, has also committed not to launch a full takeover bid without the agreement of Suez’s Board — thus proceeding with a friendly instead of hostile takeover.

Indeed, it is not uncommon for an acquirer willing to acquire 100% of the shares of a company to acquire a smaller block of shares in the first place and proceed later with the acquisition of the remaining block. Furthermore, in France, any shareholder who reaches or exceeds 30% of a listed French company will have to launch a takeover bid for the entire capital. In other words, Veolia, after having acquired 29,9% of Suez, would have had to propose a purchase offer to all shareholders, as a 30% stake triggers an automatic takeover bid.

February: Veolia launches a hostile takeover bid on 100% of Suez

Since Veolia’s second bid, Suez and Veolia haven’t been able to bridge divisions, and Suez continued to strongly reject the unfriendly acquisition. The counterproposition made by Suez to have an Ardian-GIP consortium taking over Suez’s French and international “Water and Technology” activities has been rejected by Veolia. On February 7, 2021, Veolia broke its commitment and filed a third public takeover bid but this time on 100% of Suez shares, at the same price as the second offer made exclusively to Engie. This acquisition would make Veolia the world leader in water and waste treatment. Once again, the offer was made without Suez’s approval, reinforcing the hostile dimension of the deal.

Have the negotiations reached a dead-end?

Bruno Le Maire, French Minister of Economy, denounced Veolia’s “unfriendly” bid and announced that he would refer the matter to the Autorité des Marchés Financiers (AMF) in order to verify the conformity of the group’s announcements with its previous commitments.

The situation seems to have reached a dead-end. On one side, Veolia has been ordered by the Tribunal de Commerce of Nanterre to suspend its takeover bid and to wait for validation of its offer by the Suez board of directors. On the other hand, Suez takeover defense strategy (which consists in the domiciliation of its Eau de France activity (targeted by Veolia) in a Dutch company for 4 years in order to make it inaccessible to a hostile bid) has just been rejected by the AMF on April 2, 2021.
Will Veolia and Suez be able to overcome their disagreements? Time will tell…

Key concepts

I present below key concepts to understand the Veolia-Suez saga.

Defense strategy

In response to hostile takeovers, targets can devise defense strategies in order to prevent the takeover from going across the finish line. Well-known defense strategies are:

  • Stock repurchase: purchase by the target of its own-issued shares from its shareholders
  • Poison pill: distribution to the target’s shareholders of the rights to purchase shares of the target or the merging acquirer at a substantially reduced price
  • White knight: the target seeks a friendlier acquirer
  • Crown jewels: the target divests one or several of its flagship activities or divisions (“jewel”) in order to reduce the interest of the hostile bidder
  • Fat man: the target issue new debt and or purchase assets or companies which are too large or known to be disliked by the hostile acquire, in order to “fatten up” and transform the target into a less attractive purchase

Public takeover bid

A public takeover bid can take two forms: the acquisition of the stake of the target company is made with cash (“Offre publique d’achat” or “OPA” in French) and the acquisition of the stake of a listed company is made by exchanging shares of the acquiring company with shares of the acquired company (“Offre publique d’échange” or “OPE” in French).

OPA and OPE refers to acquisition methods, not to acquisition behavior: an OPA or OPE can be friendly or hostile depending on whether the acquirer decides to obtain the acquired company’s approval or goes directly to the shareholders of the acquired company.

Useful resources

Sources: La Tribune, Le Monde, Easy Bourse, La Finance Pour Tous, Wikipedia

Related posts on the SimTrade blog

   ▶ Akshit GUPTA L’Autorité des Marchés Financiers (AMF)

   ▶ Akshit GUPTA Regulations in financial markets

About the author

Article written in April 2021 by Raphaël ROERO DE CORTANZE (ESSEC Business School, Master in Management, 2019-2022).

My experience as a sell-side equity research analyst

My experience as a sell-side equity research analyst

Tanmay DAGA

In this article, Tanmay DAGA (ESSEC Business School, Global Bachelor of Business Administration, 2017-2021) introduces equity research, shares his internship experience at a top sell-side equity research company named Kotak Securities and gives his opinions on what the future holds for the industry.

About Kotak Securities

Kotak Securities was founded in 1994 as a subsidiary of Kotak Mahindra Bank and is headquartered in Mumbai, India. It is headed by Mr. Jaideep Hansraj who is a leading figure and has over 20 years of experience in the equity research industry. The company has over 1.7 million customer accounts and handles over 800,000 trades every single day making it one of the biggest brokerage houses in the country. The company handles operations in over 394 cities in India and is well poised for further expansion helping it expand its customer base. Kotak Securities offers stock broker services, portfolio management services, depository services, research expertise, dynamic market data and international reach for clients looking for investment opportunities overseas.

Kotak Securities

What is equity research?

It is a mainstream finance position which entails fundamental analysis and subsequent recommendation of public securities. Fundamental analysis is a method of evaluating the intrinsic value of an asset (future cash flows discounted to the present) and analyzing the factors that could influence its price in the future. Hence, equity research is an investigation based upon the core business drivers of a particular business which are reflected in its financial statements. Hence, equity researchers use financial statements combined with other industry and macroeconomic reports to form their opinion about a certain company or a universe of companies (also called coverage list). Investors such as money/managers use this information to better investigate their potential or existing investment decisions. To conclude, the main purpose of equity research is to provide investors with detailed financial analysis and recommendations on whether to buy, hold, or sell a particular stock. The professionals working in brokerage firms which sell analysis reports to investors are called sell-side analysts. Professionals working for mutual funds or hedge funds and who make direct investment decisions are called buy-side analysts.

Read an interesting interview with an industry expert who shares his experience of working in the industry.

Me and Finance

I had gotten enrolled in ESSEC’s GBBA in 2017 owing to my curiosity in finance and the university’s premier status, especially in finance. At the end of the first year, I had the opportunity to apply my mind and practically learn a few things along with it. It had always been my mission to work in finance, particularly in valuation. My fascination with valuation is simple – you are allowed to deem the situation as you see fit provided you have a logical reasoning behind it. Nothing can narrow the scope of your thoughts as long as they are realistic and reasonable. It is a great way for individuals to look at things from a broader perspective and develop an analytical mindset to help comprehend several moving parts simultaneously. It does take time getting used to the idea of having to dig into minute details but it’s worth it! Valuation is not purely science per se. It is a blend between sound analytical reasoning that helps you come up with a story (forecast as experts call it) and simple objective mathematics to help validate your story’s credibility. The fact that valuation today in investment banking and other fields looks so complicated is partly to mask the simplicity involved in the process so big banks can continue to charge hefty fees for what they do. Moreover, it is not a skill that will ever go in vain. The mindset a sound valuer develops helps him/her analyze the pros and cons any situation better than a counterpart. It is a skill that I recommend everyone to acquire.

My internship in Kotak Securities

In 2018, at the end of my first year of my GBBA at ESSEC Business School, I did an internship at Kotak Securities equity research division in Mumbai, India. I was 18 years old and comparatively new to equity research. Resulting, I witnessed a steep learning curve requiring me to learn and apply several concepts in a short span of time. My main responsibility was to help the fundamental research team carry out due diligence (financial analysis to analyse the true or intrinsic value of an asset and all other factors affecting this value) for the companies under our coverage universe. This was done by performing rigorous research for the company’s business, its supply chain, its value drivers and all other factors that affect its value and ultimately its stock price. The conclusions were to be presented to the senior management and the sales team along with a thorough explanation behind the rationale of selecting a particular stock for client recommendation. Based on the findings, recommendations were to be published in a bi-monthly analysis report which also included other important topics like the economic analysis of the current situation and trends in the currencies traded in foreign exchange (FX) market. As the organization was agile and flexible with what responsibilities members could take, I had the opportunity of working with several other departments aside from fundamental research. Some of the other projects I worked on were developing a proprietary algorithm based on analysis of trading patterns for index companies alongside the technical analysis team (which is the motivation for me in selecting the SimTrade course) and a model project on sentiment analysis – how news and company perception (especially on Twitter) affect the stock price in the short run. I learnt several hard skills such as modelling in Excel, literacy in reading company’s financial statements and intermediate level of coding in Python. Overall, it was a great work experience for me.

Key takeaways from my internship

During my time at Kotak, I have come across some important financial concepts that I believe every individual, irrespective of their affiliation with the finance industry, must truly understand. They will help you better understand financial issues and make sound investment decisions.

Inflation

Inflation refers to the sustained increase in the price of goods and services in an economy. This increase in price is hard to pinpoint at any one factor but more often than not, it is a combination of various factors. This could range from increase in labor prices to jump in raw material costs. As prices rise due to inflation, you’ll be able to afford less and less over a given period of time. That’s why it is imperative to understand that long-term savings must be invested in a manner by which the returns surpass the inflation rate. That’s the only way one can continue to afford to buy more in a definite time period in the future. In many countries, the only reliable way to beat inflation is investing in stocks/equities. As Bonds or Bank savings do not offer any positive real interest realization.

Diversification

Diversification is a risk management strategy that mixes a wide variety of investments within a portfolio. A diversified portfolio contains a mix of distinct asset types and investment vehicles in an attempt at limiting exposure to any single asset or risk. The rationale behind this technique is that a portfolio constructed of different kinds of assets will, on average, yield higher long-term returns and lower the risk of any individual holding or security. This is a widely approved method for protecting capital against unexpected events in the global markets. By using the primary study of correlation, investors can diversify certain risk away. However, data on correlation is historical and thus, backwards looking, and might not always hold true in the future. For instance, during the shutdown of the global economy in March 2020, multiple assets like stocks, commodities and bitcoin (which have not been positively correlated in the past) collapsed together. All have had a positive recovery together since (again implying positive correlation as opposed to results from previous studies).

Time Value of Money

The time value of money (TVM) is the concept that money you have now is worth more than the identical sum in the future due to its potential earning capacity. This core principle of finance holds that provided money can earn interest, any amount of money is worth more the sooner it is received. For instance, assume a sum of $10,000 is invested for one year at 10% interest. The future value (FV) of that money is: FV = $10,000 x (1 + 10%) = $11,000. The formula can also be rearranged (reversed) to find the value of the future sum in present day dollars. For example, the present value (PV) of $5,000 one year from today, compounded at 7% interest, is: PV = $5,000 / (1 + 7% ) = $4,673.

TVM is also sometimes referred to as present discounted value. This is a fundamental pillar on which company valuation is based. The true value of a company is the future free cash flows the company generates, discounted to the present time using an appropriate discount factor.

Future of equity research: my personal view

Equity research is an important role that has come into prominence since the bull market in the 1950s. Thousands of fund managers handling trillions of dollars in assets under management often use sell-side research to get an outsider’s opinion before making investment decisions. Certainly, the size of the industry has shrunk significantly since buy-side and IB analysts are being better compensated, causing a shift in the workforce. However, things are not bad. Companies are now letting analysts focus more on analysis than on sales. This is certainly going to attract new talents who want to focus purely on analysis.

Read this interesting counter-view on the future of the industry.

Relevance to SimTrade

This course helps in understanding the other side of the same coin – technical analysis (using price movements and other factors to predict the future of a security). Participants of this course can expect to gain practical knowledge about stock trading by using a real-world like simulator where multiple strategies can be applied and tested. Other benefits include gaining a broad understanding of the financial markets and concepts.

Related posts on the SimTrade blog

   ▶ All posts about Professional experiences

   ▶ Louis DETALLE My experience as a Transaction Services intern at EY

   ▶ Aastha DAS My experience as an investment banking analyst at G2 Capital Advisors

   ▶ Basma ISSADIK My experience as an M&A/TS intern at Deloitte

Useful resources

Kotak Securities

Corporate Finance Institute Example of equity research report

About the author

The article was written by Tanmay DAGA (ESSEC Business School, Global Bachelor of Business Administration, 2017-2021).

Introduction to bonds

Introduction to bonds

Rodolphe Chollat-Namy

In this article, Rodolphe CHOLLAT-NAMY (ESSEC Business School, Grande Ecole Program – Master in Management, 2019-2023) introduces you to bonds.

While the bond market is growing fast and is worth about $115,000 billion as of 2021, in the following series of articles we will try to understand what it is all about. It is therefore appropriate here, firstly, to try to define what a bond is.

What is a bond?

A bond is a debt security, i.e. a tradable financial asset, that represents a loan made by an investor to a borrower. It allows the issuer to finance its investment projects and the creditor to receive interest payments at regular intervals until maturity when it is repaid the nominal amount. Creditors of the issuer are also known as debt holders.
Bonds are fixed-income securities because you know from the debt contract the exact amount of cash you can expect in the future, provided you hold the security until maturity.

What are the main characteristics of a bond?

A bond has several characteristics:

  • The face value, also known as the par value or principal, equal to the original capital borrowed by the bond issuer divided by the number of securities issued.
  • The maturity, which expresses the number of years to wait for the principal to be repaid. This is the life of the bond. The average maturity of a bond is ten years.
  • The coupon, that refers to the payment of interest to the creditor at regular intervals. The interest rate paid may be fixed or variable. It is the creditor’s remuneration for the risk taken as a bondholder. The higher the risk, the higher the return, the coupon, will be.

Example

Let us take the example of a company needs to borrow ten million euros in the bond market.

It decides to issue fixed-rate bonds. It divides this issuance into 1,000 shares of €10,000. The face value of each bond is therefore €10,000. The nominal interest rate is set at 5%. Interest payments are made on an annual basis. The annual coupon is then equal to €500 (=0.05*10,000). The maturity of the bond is set at 10 years.

In terms of cash flows, you will receive €500 per year for ten years. At the end of the tenth year, the issuer will pay you a final installment of €10,000 in addition to the interest payment of €500.

What are the different types of bonds?

The bonds issued can be diverse. Their maturity, interest rate and repayment terms vary. In order to better understand them, we must first distinguish their issuer and then the terms of payment of interest.

Types of issuers

There are three main types of issuers: governments, local authorities, and companies.

Government bonds

A government bond represents a debt that is issued by a government and sold to investors to support government spending. They are considered low-risk investments since the government backs them. So, because of their relative low risk, they are typically pay low interest rates. Country that issues bonds use different terms for them. UK government bonds, for example, are referred to as gilts. In the US, they are referred to as treasuries: T-bills (expire in less than one year), T-notes (expire in one to ten years) and T-bonds (expire in more than ten years).

Municipal bonds (“munis”)

A municipal bond represents a debt that is issued by a local authority (a state, a municipality, or a county) to finance public projects like roads, schools and other infrastructure. Interest paid on municipal bonds is often tax-free, making them an attractive investment option. Because of this tax advantage and of the backing by their issuer, they are also pay low interest rates.

Corporate bonds

A corporate bond represents a debt that is issued by a company in order for it to raise financing for a variety of reasons such as ongoing operations (organic growth) or to expand business (mergers and acquisitions). They have a maturity of at least one year, otherwise they are referred to as commercial paper. They offer higher yields than government or local authority bonds because they carry a higher risk. The more fragile the company is, the higher the return offered to the investor is. They are divided into two main categories High Grade (also called Investment Grade) and High Yield (also called Non-Investment Grade, Speculative Grade, or Junk Bonds) according to their credit rating reflecting the firm financial situation.

Technical characteristics

In addition, the way in which interest is paid may vary from one bond to another. For this purpose, there are several types of bonds:

Fixed-rate bonds

A fixed-rate bond is a bond with a fixed interest rate that entitles the holder to receive interest payments at a predetermined frequency. The interest rate is set when the bond is issued and remains the same throughout the life of the bond. This is the most common type of bond.

Floating-rate notes

A floating-rate note is a bond with an interest rate that changes according to market conditions. The contract of issuance fixes a specific reference serving as a basis for the calculation of the remuneration. For example, the most common references for European bonds are Eonia and Euribor.

Zero-coupon bonds

A zero-coupon bond is a bond that does not pay regular interest. They are therefore sold at a lower price than the value redeemed at maturity by the issuer. This difference represents the investor’s return.

Convertible bonds

A convertible bond is a bond with a conversion right that allows the holder to exchange the bond for shares in the issuing company, the two parties having previously fixed a conversion ratio which defines the number of shares to which the bond gives right.

Useful resources

Rating agencies

S&P

Moody’s

Fitch Rating

Related posts

   ▶ Rodolphe CHOLLAT-NAMY Bond valuation

   ▶ Rodolphe CHOLLAT-NAMY Bond risks

   ▶ Rodolphe CHOLLAT-NAMY Bond markets

   ▶ Bijal GANDHI Credit Rating

   ▶ Jayati WALIA Credit risk

About the author

Article written in April 2021 by Rodolphe CHOLLAT-NAMY (ESSEC Business School, Grande Ecole Program – Master in Management, 2019-2023).

Leading and Lagging Indicators

Leading and lagging indicators

Bijal GANDHI

In this article, Bijal GANDHI (ESSEC Business School, Grande Ecole Program – Master in Management, 2019-2022) elaborates on the concept of leading and lagging indicators. This reading will help you understand in detail the meaning of the leading and lagging indicators.

Leading indicators

Indicators that precede economic events and help predict the direction of an economy are termed as “leading indicators”. These indicators prove to be critical when the economy is heading from one stage to another in the business cycle. A single indicator may or may not be accurate to forecast the health of the economy. Therefore, these indicators are analyzed in conjunction through a composite index to predict the trend. In this post we deal with the U.S. case.

Composite index of leading indicators

The Composite Index of Leading Indicators is published monthly by The Conference Board to help market participants (traders, investors, financial analysts, central bankers, etc.) gauge the overall direction of the economy in the near-term future. It is a comprehensive index calculated with leading indicators based on their impact on the economy. This index is also known as the Leading Economic Index (LEI) in the U.S., and it comprises ten components detailed below.

The following is a snapshot of the LEI and the CEI for the United States. CEI refers to the coincident economic index which is based on the coincident indicators. Economic indicators that describe the current state of the economy within a particular segment (such as the job market or the market for goods and services), are termed “coincident indicators”. Coincident indicators move simultaneously along the changes in business cycles of the economy. Here we can see that the LEI increased for the month of February. The CEI also increased, following the LEI.

Bijal Gandhi
Source: The Conference Board.

Yield curve

Daily yields compare the return on short-term investment instruments like Treasury bills to long-term instruments like Treasury bonds. Generally, in the yield curve, the yields over the short term are lower than those over the long-term. When the yield curve inverts, it is a signal that the investors are expecting uncertainty over the long term. This may also be an indicator of a downturn in the economy or a recession.

Source: worldgovernmentbonds

Credit spreads

Credit Spread refers to the difference in yield between a risk-free instrument and a corporate bond over the same maturity. Credit spreads fluctuations are caused due to changes in other economic indicators like inflation, liquidity, etc. A widening credit spread would reflect investor concern and vice versa.

Stock market

The stock market is a leading indicator as stock prices are highly dependent on the future growth and expected earnings of companies. Investors may sell their stocks if they are not confident about the future of the company. The S&P 500 stock index for the U.S. is a close estimation of the total value of the business sector and therefore it is used to comprise the LEI.


Source: TradingView.

Durable goods orders

Durable Goods Manufactures’ report refers to the total capital goods purchased by companies. An increase in the volume of purchases is an indication that companies are confident about the future. It is classified under the leading indicator as business orders change much before an actual change in the business cycle.

Manufacturing jobs

The manufacturing jobs survey is also classified as a leading indicator as to the demand for labor shifts much before an actual change in the business cycle. If the demand for goods is anticipated to increase the supervisors may ask for a greater labor supply indicating a positive sign for the economy. A change in demand for labor will also impact other dependent sectors like transportation and retail.

Building permits

Building permit numbers are published monthly by the U.S. census which tells us in advance about the expected spending on construction-related projects. We all know the importance of the real estate sector on the economy from the subprime mortgage crisis in 2008.

Unemployment claims

The weekly claims for unemployment insurance help the government calculate the total layoffs and publish a report. This report is an indication of the changes in unemployment levels, business activities, and their impact on consumer income.

Manufacturing new orders

The Manufacturing New Orders Index published by the Institute of Supply Management (ISM) is calculated from the survey of purchasing manufacturers of hundreds of manufacturing firms. It indicates the change (increase or decrease) of orders of manufactured goods.

Consumer expectations

Consumer expectations is a survey conducted to gain insights from the end-users themselves. The surveyors ask the consumers about their opinions regarding jobs, income, and overall business conditions. They try to gauge the consumer sentiment for the next 6 to 12 months.

Leading Credit Index

This component is derived from six other financial indicators. All these financial indicators are forward looking such as 2 years swap spreads, security repurchases, investor’s sentiments, etc.

Lagging indicators

Lagging indicators are those economic indicators that lag the economic performance of a geographic region. Therefore, these indicators are not useful to predict the future health of the economy but to assess and confirm a pattern after a large movement in an underlying economic variable of interest like the unemployment rate. Since these indicators trail the shifts in the underlying variable, they are useful to analyze long-term trends in the economy. They are further categorized into economic, technical, and business indicators as per their use.

Composite index of lagging indicators

As discussed in the blog Economic Indicators, the Composite Index of Lagging Indicators is published monthly by the Conference Board. This Index includes the following seven components which help assess and confirm the economic situation of the U.S.

Average duration of unemployment

The Bureau of Labor Statistics computes the average number of weeks an individual has been unemployed. During a recession, long-term unemployment rises and vice versa.

Ratio, manufacturing, and trade inventories to sales

The Bureau of economic analysis computes the ratio of inventories to sales to understand the business conditions of both the individual firm and the industry. The inventory and sales data related to the manufacturing, wholesale, and retail is provided by the Bureau of the Census. When sales targets are not reached due to a weak economy, the inventories tend to shoot up and the ratio reaches its cyclical peak in the middle of a recession.

Change in labor cost per unit of output, manufacturing

The Conference Board computes the rate at which the labor costs per unit rise with respect to the cost of production per unit. During a weakening state of the economy, the production declines at a much higher rate than the labor costs even with layoffs of the laborers. This series is calculated over six months as monthly data can tend to be inconsistent.

Average prime rate charged by banks

The prime rate is the benchmark rate which banks use to estimate their interest rates for various types of loans. The change in this rate usually tends to lag the general economic performance. During periods of a strengthening economy, banks tend to resist reducing the interest rates, while during times of a weak economy, banks tend to resist increasing the interest rates.

Commercial and industrial loans outstanding

The total volume of outstanding business loans held by both banks and non-financial companies is computed by The Conference Board from the data compiled by the Board of Governors of the Federal Reserve System. When the revenues or profits decline in a business due to the weakening of the economy, banks start to take out more loans to cover their costs. Similarly, an improvement in the economy will result in liquidity and the demand for short-term credit may fall if the deflation sets in.

Ratio, consumer installment credit outstanding to personal income

This is the ratio of consumer debt to personal income. This ratio is a measurement of the indebtedness relative to income. This ratio tends to increase during times of expansion when the consumers are confident enough to pay off their debts in the future. Similarly, they tend to hold off borrowing even until after the months of recession due to skepticism and uncertainty.

Change in Consumer Price Index for services

The Bureau of Labor Statistics computes the rate of change in the services component of the Consumer Price Index (CPI). This is a lagging indicator as the services sector may raise prices well in advance in anticipation of a recession. The rise in prices may be due to market rigidities and recognition lag. Even with the recovery, firms in the services sector may keep cutting the prices. This is because they might not recognize when the recession is over.

Related posts on the SimTrade blog

   ▶ Bijal GANDHI Economic indicators

   ▶ Bijal GANDHI Gross Domestic Product (GDP)

Useful resources

US Department of Treasury

United States Census Bureau

Labor Statistics

About the author

Article written by Bijal GANDHI (ESSEC Business School, Grande Ecole Program – Master in Management, 2019-2022).

Economist – Job description

Economist – Job Description

Akshit Gupta

This article written by Akshit Gupta (ESSEC Business School, Master in Management, 2019-2022) presents the job description of an Economist.

Introduction

Economists are finance professionals who study and examine market activities in different geographical zones, economic sectors, and industries. They are primarily hired by commercial and investment banks, asset management firms, rating agencies, consultancy firms, central banks and other state agencies. In such institutions, economists are responsible for analyzing market and socioeconomic trends, devising statistical models to predict future trends (economic forecasting) and preparing economic reports.

In commercial banks, the work of economists will be used to manage credit risk and to prevent corporate credit default. In investment banks, economists will help traders to anticipate the economic events during the day like the publication of an economic indicator (inflation, GDP, unemployment, etc.). In asset management firms, economists will help portfolio managers to optimize their portfolios based on the current economic conditions and future scenarios. In other contexts, economists work on studying and assessing the economic situation to support investment decisions.

Duties of an economist

More specifically, the important duties of an economist include the following:

  • Analyze economic and market trends – An economist is responsible for researching, collecting data, and analyzing information pertaining to socio-economic, financial, political and market trends in different geographies and sectors.
  • Develop economic models – After analyzing the different trends, an economist is responsible for making econometric models to compute the numerical impact of different trends and make future predictions.
  • Prepare economic reports – The economist is responsible for preparing economic reports based on the statistical analysis to present technical insights about an economic situation. The reports are used to advise banks, investment firms, government agencies to take calculated investment decisions.
  • Communicate data – The reports prepared by the economists are effectively communicated by them to banks or agencies by ways of presentations, media releases or publication in journals.

Whom does an economist work with?

An economist depending in the sector he/she is employed in, works in tandem with many internal and external stakeholders including:

  • Retail or institutional clients of the firm – A economist works with the retail or institutional clients of the firm to communicate the different economic or market trends and policies.
  • Sales and Trading – An economist works with the sales and trading team to advise them on the investment decisions across sectors and geographies based on the economic reports.
  • Sector specialists – An economist works with the sector specialists to assess and quantify the economic opportunities and risks posed by different sectors and industries
  • Portfolio managers – An economist works with portfolio managers to advise and help them optimize their portfolios as per the current economic and market trends.
  • Legal compliance – To maintain a proper check over different rules and regulations and prevent legal challenges
  • Media – To give insights from technical and non-technical economic reports about different sectors and present future forecasts

How much does an economist earn?

The remuneration of an economist depends on the type of role and organization he/she is working in. As of the writing of this article, an entry level economist working in an investment bank earns a base salary between €40,000–50,000 in the initial years of joining. The economist also avails bonuses and other monetary/non-monetary benefits depending on the firm he/she works at. (Source: Glassdoor)

What training do you need to become an economist?

An individual working as a economist is expected to have a strong base in economics and mathematics (statistics, econometrics). He/she should be able to understand micro and macro-economic trends, devise different mathematical models, prepare reports and have strong research skills and interpersonal skills.

In France, a Grand Ecole diploma with a specialization in economics/mathematics is highly recommended to get an entry level economist position in a reputed bank, government agency or investment firm.

A bachelor degree coupled with an master degree in economics provides a candidate with an edge over the other applicants while hunting for a job.

In terms of technical skills, an economist should be efficient in using word processing, spreadsheet, presentation tool, and possess good understanding of database management and programming languages like VBA, R, Python, Mathlab, etc.

Example of an economist’s report – BNP Paribas

BNP Paribas – Economic Research Report

Related posts on the SimTrade blog

   ▶ Akshit GUPTA Remuneration in the finance industry

   ▶ Akshit GUPTA Trader: Job Description

   ▶ Akshit GUPTA Financial Analyst: Job Description

Useful Resources

All About Careers

Relevance to the SimTrade certificate

The concepts about the job of an economist can be understood in the SimTrade Certificate:

About theory

  • By taking the Market information course, you will understand how information is incorporated into market prices and the associated concept of market efficiency.

Take SimTrade courses

About practice

  • By launching the Efficient market simulation, you will practice how information is incorporated into market prices through the trading of market participants and grasp the concept of market efficiency.

Take SimTrade courses

About the author

Article written by Akshit Gupta (ESSEC Business School, Master in Management, 2019-2022).

Is smart beta really smart?

Is smart beta really smart?

Youssef LOURAOUI

In this article, Youssef LOURAOUI (ESSEC Business School, Global Bachelor of Business Administration, 2017-2021) presents the concept of smart beta used in the asset management industry.

Mutual funds and Exchange traded funds (ETF) based on the smart beta approach have increased in size during the recent years. As Burton Malkiel (2014), we also wonder if the smart beta approach is really smart.

The smart beta industry

Smart beta funds have experienced a significant growth with total assets under management approaching market 620 billion dollar in the U.S. as shown in Figure 1 (Morningstar Reseach, 2017).

Figure 1. Smart Beta Exchange Traded Products growth in the US market (2000-2017).
Smart Beta Exchange Traded Products growth
Source: Morningstar Research (2017).

Traditional approach in portfolio management

The traditional approach to build asset portfolio is to define asset weights based on the market capitalization. The framework of this traditional approach is based on the Capital Asset Pricing Model (CAPM) introduced by the work of Henry Markowitz and William Sharpe in 1964. The CAPM is based on a set of hypotheses about the market structure and investors:

  • No intermediaries
  • No constraints (possibility of short selling)
  • Supply and demand equilibrium
  • Inexistence of transaction cost
  • Investors seeks to maximise its portfolio value by optimizing the mean associated with expected returns while minimizing variance associated with risk
  • Investors are considered as “rational” with a risk averse profile
  • Investors have access to the information simultaneously in order to execute their investment ideas

Under this framework, Markowitz developed a model relating the expected return of a given asset and its risk:

Relation between expected return and risk

where E(r) represents the expected return of the asset, rf the risk-free rate, β a measure of the risk of the asset and E(rm) the expected return of the market.

In this model, the beta (β) parameter is a key parameter and is defined as:

Beta

where Cov(r,rm) represents the covariance of the asset with the overall market, and σ(rm)2 is the variance of market return.

The beta represents the sensibility of the asset to the fluctuations of the market. This risk measure helps investors to predict the movements of their asset according to the movement of the market overall. It measures the asset volatility in comparison with the systematic risk inherent to the market. Statistically, the beta represents the slope of the line through a regression of data points between the stock returns in comparison to the market returns. It helps investors to explain how the asset moves compared to the market.

More specifically, we can consider the following cases for beta values:

  • β = 1 indicates a fluctuation between the asset and its benchmark, thus the asset tends to move in a similar rate than the market fluctuations. A passive ETF replicating an index will present a beta close to 1 with its associated index.
  • 0 < β < 1 indicates that the asset moves in a slower rate than market fluctuations. Defensive stocks, stocks that deliver consistent returns without regarding the market state like P&G or Coca Cola in the US, tend to have a beta with the market lower than 1.
  • β > 1 indicates a more aggressive effect of amplification between the asset price movements with the market movements. Call options tend to have higher betas than their underlying asset.
  • β = 0 indicates that the asset or portfolio is uncorrelated to the market. Govies, or sovereign debt bonds, tend to have a beta-neutral exposure to the market.
  • β < 0 indicates an inverse effect of market fluctuation impact in the asset volatility. In this sense, the asset would behave inversely in terms of volatility compared to the market movements. Put options and Gold typically tend to have negative betas.

In order to better monitor the performance of an actively managed fund, active fund managers seek to improve the performance of their fund compared to the market. This additional performance is measured by the “alpha” (Jensen, 1968) defined by:

Alpha Jensen

where E(r) is the average return of the fund over the period studied, rf the risk-free rate, E(rm) the expected return of the market, and β×(E(rm)-rf) represents the systematic risk of the fund.

Jensen’s alpha (α) represents the abnormal returns of the fund.

The Smart beta approach

The smart beta approach is based on the construction of a portfolio of assets using several different yield enhancement “factors”. BlackRock Investment Solutions (2021) lists the following factors mainly used in the smart beta approach:

  • Quality, which aims to study the financial environment of the underlying asset.
  • Volatility which aims to filter assets according to their risk.
  • Momentum, which aims to identify trends in the selection of assets to be retained by focusing on stocks that have performed strongly in the short term.
  • Growth is the approach that aims to select securities that have strong return expectations in the medium to long term.
  • Size which aims to classify according to the size of the assets.
  • Value that seeks to denote undervalued assets that are close to their fundamental values.

The smart beta approach is opposed to the traditional portfolio approach where a portfolio is constructed using the weights defined by the market capitalization of its assets. The smart beta approach aims to position the portfolio sensitivity or “beta” according to the market environment expectation of the asset manager. For a bull market, the fund manager will select a set of factors to achieve a pronounced exposure of his portfolio. Symmetrically, for a bear market, the fund manager will select another set of factors opting for a beta neutral approach to protect the sensitivity of his portfolio against bear market fluctuations.

Performance and impact factor

S&P Group (2016) studied the performance of different factors (volatility, momentum, quality, value, dividend yield, growth and size) on the S&P500 index for 1994-2014 broken down into sub-sectors (see Table 1). This study finds that each sector is impacted differently by choosing one factor over another. For example, in the energy sector, the strategies of value and growth has led to a positive performance with respectively 1.22% and 2.56%, while in the industrial sector, the strategies of size were the only factor with a positive performance of 1.66%. In practice, there are two approaches: focusing on a single factor or finding a combination of factors that offers the most interesting risk-adjusted return to the investor in view of his/her investment strategy.

Table 1. Sector exposures to smart beta factors (1994-2014).
Sector exposures to smart beta factors
Source: S&P Research (2014).

S&P Group (2016) also studies the performance of the factors according to the market cycles (bull, bear or recovery markets), business cycles (expansion or contraction) and investor sentiment (neutral, bullish and bearish). The study shows how each factor has been mostly effective for every market condition.

Table 2. Performance of factors according to different market cycles, business cycles and investor sentiment.
Performance of factors
Source: S&P Research (2014).

In summary, the following characteristics of the different approaches discussed in this article can be identified:

  • The CAPM approach aims to give a practical configuration of the relationship between the return of an asset with the market return as well as the return considered as risk-free.
  • Alpha is an essential metric in the calculation of the portfolio manager’s return in an actively managed fund. In this sense, alpha and CAPM are linked in the fund given the nature of the formulas used.
  • Smart beta or factor investing follows an approach that straddles the line between active and passive management where the manager of this type of fund will use factors to filter its source of return generation which differs from the common approach based on CAPM reasoning (Fidelity, 2021).
  • The conductive link of these three reasoning is closely related to the fact that historically the CAPM model has been a pillar in financial theory, the smart beta being a more recent approach that tries to disrupt the codes of the so-called market capitalization based investment by integrating factors to increase the sources of return. Alpha is related to smart beta in the sense that the manager of this type of fund will want to outperform a benchmark and therefore, alpha allows to know the nature of this out-performance of the manager compared to a benchmark.

Is smart beta really smart?

Nevertheless, the vision of this smart beta approach has raised criticisms regarding the relevance of the financial results that this strategy brings to a portfolio’s return. Malkiel (2014) questioned the smartness of smart beta and found that the performance of this new strategy is only the result of chance in the sense that the persistence of performance is dependent in large part on the market configuration.

In his analysis of the performance of the smart ETF fund called FTSE RAFI over the period 2009-2014, he attributed the out-performance to luck. The portfolio allocation was highly exposed to two financial stocks, Citigroup and Bank of America, which accounted for 15% of the portfolio allocation. Note that Citigroup and Bank of America were prosecuted by the American courts for post-crisis financial events and interest rate manipulation operations related to the LIBOR scandal. This smart beta fund outperformed the passive managed US large cap ETF (SPY). Malkiel associated the asset selection of the FTSE RAFI fund with a bet on Bank of America that with another market configuration it could have ended in a sadder way.

Figure 2. FTSE RAFI ETF (orange) compared with its benchmark (FTSE RAFI US 1000) and with SPY ETF (green).
FTSE RAFI ETF
Source: Thomson Reuters Datastream.

We can conclude that the smart beta strategy can allow, as outlined in Blackrock’s research (BlackRock Investment Solutions, 2021), an opportunity to improve portfolio performance while seeking to manage variables such as portfolio out-performance, minimizing its volatility compared to the market or seeking diversification to reduce the risk of the investor’s portfolio. It is an instrument that must be taken judiciously in order to be able to affirm in fine if it is smart in the end, as Malkiel would say.

Related posts on the SimTrade blog

   ▶ Jayati WALIA Capital Asset Pricing Model (CAPM)

   ▶ Youssef LOURAOUI Beta

   ▶ Youssef LOURAOUI MSCI Factor Indexes

   ▶ Youssef LOURAOUI Factor Investing

   ▶ Youssef LOURAOUI Origin of factor investing

Useful resources

Academic articles

Malkiel, B. (2014). Is Smart Beta smart? The Journal of Portfolio Management 40, 5: 127-134

El Lamti N. (2017) Are smart beta strategies really smart? HEC Paris.

Business resources

BlackRock Investment Solutions (2021) What is Factor Investing

Fidelity (2021) Smart beta

S&P Global Research (2016) What Is in Your Smart Beta Portfolio? A Fundamental and Macroeconomic Analysis

Morningstar Research (2017) A Global Guide to Strategic-Beta Exchange-Traded Products

Fidelity (2021) Smart beta

About the author

The article in April 2021 was written by Youssef LOURAOUI (ESSEC Business School, Global Bachelor of Business Administration, 2017-2021).

Economic Indicators

Economic indicators

Bijal Gandhi

In this article, Bijal Gandhi (ESSEC Business School, Master in Management, 2019-2022) elaborates on the concept of economic indicators.

This read will help you understand in detail the types of economic indicators, their impact on stock prices and their use by investors in the financial markets.

Economic indicators

Economic indicators are statistical data related to economic activity. They help to evaluate and forecast the health of the economy at the macro level. These indicators measure the systematic risk of the economy and are widely used by investors for their investment decisions. Economic indicators are generally published on a regular basis in a timely manner by governments, universities, and non-profit organizations. To build economic indicators, these institutions use census and surveys. For example, the U.S Bureau of Labor Statistics publishes a monthly report on the Employment Situation through a survey. This report details about the jobs lost or created every month, compensation costs, unemployment rate, etc.

Economic indicators can be of great use if interpreted accurately. Historically, it has had a strong correlation with the economic growth of a nation. The impact can be clearly seen in the long-term performance of the financial markets and therefore investors keep a close eye on them. They try to evaluate and understand the impact of each of the economic indicators to make informed decisions. The government, economists, corporations, and research organizations are the other beneficiaries of these indicators.

Types of economic indicators

Leading indicators

Economic indicators that help understand and forecast the future health of the economy, are termed “leading indicators”. These indicators tend to precede economic events and therefore prove to be critical during times of economic recession. A single leading indicator may not prove to be accurate, but several indicators analyzed in conjunction may help in providing insights into the future of the economy. Economists, investors, and policymakers may use and analyze these indicators according to their interests.

The evolution of the stock market is one of the major leading indicators. Weak earnings forecasts may indicate to investors the weak state of the economy beforehand. The stock market may therefore tend to decline preceding to the decline of the economy as a whole and vice versa. For the United States, other important leading indicators include the following,

Investors may or may not look at the same indicators as economists. For example, investors would be more interested in the data related to jobless claims by the U.S. Department of Labor to gauge the signs of a weakening economy.

Coincident indicators

Economic indicators that describe the current state of the economy within a particular segment (such as the job market or the market for goods and services), are termed “coincident indicators”. Coincident indicators move simultaneously along the changes in business cycles of the economy. For example, the payroll data published by the U.S. Bureau of Labor Statistics can help analyze the demand for employees. This evaluation would help understand if the economy’s present condition is strong or weak. Therefore, coincident indicators reflect the real-time situation. They are more useful when used with the leading and lagging indicators. For the United States, other important coincident indicators are:

Lagging indicators

Economic indicators that describe the past state of the economy which confirms a pattern only after a large movement in the underlying variable, are termed “lagging indicators”. These factors tend to trail the shift in the underlying asset and are therefore useful to validate the long-term trends in the economy. Lagging indicators can further be classified under economic, technical, and business indicators as per their use.

The Lagging Index is published by The Conference Board . This economic indicator lags the composite economic performance of the U.S. This indicator is calculated with following seven economic components:

  • Average prime rates
  • Average duration of unemployment
  • Change in the Consumer Price Index for services
  • Ratio of manufacturing and trade inventories to sales
  • Real dollar volume of outstanding commercial and industrial loans
  • Change in labor cost per unit of output in manufacturing
  • Ratio of consumer installment credit outstanding to personal income

Important economic indicators

Gross domestic product

GDP refers to the sum of all goods and services produced in a country during a specific period. The motive is to calculate either the total income or spending in a country and compare it with the preceding period. This difference over time (from a quarter to another or from a year to another) allows economists to understand whether the economy has contracted or expanded.

GDP being the key indicator of the economy, has a significant impact on the investors’ sentiment. A positive change in the GDP would mean that the economy is thriving as compared to the previous period. This would further mean lower levels of unemployment, higher spending, and positive earnings outlook for the companies. This would translate into higher stock prices for investors. Therefore, GDP can be termed as an important economic indicator for both economists and investors.

Inflation (CPI & PPI)

Inflation is referred to the rate at which the value of goods and services rise and consequently the value of currency declines. It is one of the most important economic indicators for investors because it measures the real value of an investment being eroded in a certain period. For example, if the inflation rate is 4% and yield from an investment is 3%, then investors would in real terms lose 1% every year. Therefore, it is a vital factor in investment decision-making, as a higher inflation rate would mean that investor should get an even higher return on their investment. The effect of inflation on the costs incurred by the companies is another factor investor should look at. Decline in inflation would mean lower costs for companies resulting in better overall performance.
The most relevant inflation indexes are Consumer Price Index (CPI) and Producer Price Index (PPI)

  • The Consumer Price Index (CPI) is defined by the Bureau of Labor Statistics in the U.S. as “a measure of the average change over time in the prices paid by urban consumers for a market basket of consumer goods and services”. It is widely used as a close proxy and estimate to inflation. It helps economists, investors and others get an idea about the change in prices in the economy and make informed decisions accordingly.
  • The Producer Price Index (PPI) is defined by the Bureau of Labor Statistics in the U.S. as “a measure of the average change over time in the selling prices received by domestic producers for their output”. It differs from the CPI as it calculates the cost from the perspective of the producer instead of the consumer. It is an important tool as inflation can be tracked in the PPI much before any other economic indicators (including the CPI).

Interest rates

Interest rates are vital economic indicators both for economists and investors. In the U.S., the Federal fund rate is the interest rate at which the banks borrow from each other on an overnight basis. It is targeted by the Federal Open Market Committee (FOMC), which is the monetary policy making body in the U.S. The FOMC sets this target rate eight times a year. The announcement of the changes in the Fed rate is religiously followed by investors. This is because rate adjustments are decided by the FOMC after careful consideration of several economic variables ranging from inflation to employment.
Financial markets (both equity and bond markets) generally react heavily as even a minor rise or decline in this rate can significantly impact the borrowing costs of corporations.

Article written by Bijal Gandhi (ESSEC Business School, Master in Management, 2019-2022).

Financial leverage

Financial leverage

Shruti Chand

In this article, Shruti CHAND (ESSEC Business School, Grande Ecole Program – Master in Management, 2020-2022) elaborates on the concept of financial leverage.

This read will help you get started with understanding financial leverage and understand its impact of the business, advantages and disadvantages.

Definition of financial leverage

Financial leverage in simple words is the use of debt to acquire additional assets. Imagine this, if you are borrowing money and using it to expand your business’ assets, you are using financial leverage. Financial leverage is also known as gearing as it deals with profit magnification. Debt is important for a company because it’s an integral way to grow business. The most important question to ask here is why would someone borrow money to acquire assets? The answer is that financial leverage is based on the expectation that the income or capital gain from assets will exceed the cost of borrowing.

Financial leverage Balance sheet

How does financial leverage work in real life?

Let’s say a company wants to acquire an asset, the financing options available to the company are: equity and debt.

  • Equity: shares issued to the public by giving out ownership.
  • Debt: funds borrowed through bonds, commercial papers and debentures to be paid back to lenders along with interest.

Here, in case of equity, no fixed costs are incurred, hence the profit/capital gain from the asset remains totally as profits, while in case of debt and leases, there are fixed costs associated in terms of interest that the company expects to be lower than the profit/capital gain expected.

How is financial leverage measured?

Since financial leverage is considered to be a measure of the company’s exposure to risk, company’s stakeholders look at the Debt / Equity ratio, which is a measure of the extent of financial leverage.

Financial leverage ratio

Total Debt = Current liabilities + Long-term liabilities
Total Equity = Shareholders’ equity + Retained Earnings

Analysis: The higher the debt-equity ratio, the weaker the financial position of the enterprise. Hence, lesser the ratio, lesser the chances of bankruptcy and insolvency.

Other ratios that can be used to measure financial leverage: Debt to Capital Ratio, Interest Coverage Ratio, and Debt to Ebitda Ratio.

Example of financial leverage in action

A company with $1 million shareholder equity, borrows $4 million and has $5 million to invest in assets and operations. This will allow this company to set up new factories, take up growth opportunities and expand.

Let’s assume the cost of debt is $0.5 million for a year and at the end of the first year, the company makes $1 million in profits (20% for the return on assets), the realised profit for the business becomes $1 million (profits) – $0.5 million (debt cost) = $0.5 million (50% for the return on equity for shareholders).

Now on the other hand, if the company makes $1 million in losses (-20% for the return on assets), then the realised loss for the business is $1 million + $0.5 million= $1.5 million. (-150% for the return on equity for shareholders).

You can see how in adverse situation that the effect of leverage can be really detrimental.

Now let’s consider a scenario with no leverage, the business utilizes only the $ 1 million that it already has. Considering the profit and loss percentage in the previous scenario, the business will end up making or losing $200,000 in profitable and loss making scenario respectively (20% for the return on equity for shareholders for the positive scenario and -20% for the negative scenario).

Any business needs to support its activity with borrowed money to acquire assets and hence it can be seen that manufacturing companies such as automakers have a higher debt equity ratio than service industry companies.

Advantages of financial leverage

Among the main benefits of financial leverage is the opportunities to invest in larger projects. There are also tax advantages (linked to the deductibility of interests in the income statement).

Disadvantages of financial leverage

As attractive as financial leverage might sound for a business to grow, leverage can sometimes in fact be really complex. As much as it magnifies gains, it can also magnify losses. With interest expenses and credit risk exposure, a company can often destroy shareholder value to a greater extent if it would have grown its business without Leverage.

All in all, leverage can increase burden on the company, high risk of losses, may lead to bankruptcy and other reputational losses.

Conclusion

It is really important for a company to be wise with its financial leverage position. While giving out too much ownership is not good for the shareholders, in the same way taking too much debt can also be hazardous for the company. Hence, even though the debt equity ratio differs for different industries, it is of a consensus that ideally it shouldn’t be more than 2.

Related posts on the SimTrade blog

   ▶ Shruti CHAND Balance Sheet

   ▶ Louis DETALLE What are LBOs and how do they work?

   ▶ Akshit GUPTA Initial and maintenance margins in stocks

   ▶ Youssef LOURAOUI Introduction to Hedge Funds

Relevance to the SimTrade certificate

This post deals with financial leverage for firms. Similarly, financial leverage can be used investors in financial markets. This can be learnt in the SimTrade Certificate:

About theory

  • By taking the Financial leverage course (Period 3 of the certificate), you will know more about how investors can use financial leverage to buy and sell assets in financial markets.

Take SimTrade courses

About practice

  • By launching the series of Market maker simulations, you will practice how investors can use financial leverage to buy and sell assets in financial markets.

Take SimTrade courses

Useful resources

SimTrade course Financial leverage

About the author

Article written in March 2021 by Shruti CHAND (ESSEC Business School, Grande Ecole Program – Master in Management, 2020-2022).

Palantir: a potential and controversial rising decacorn

Palantir: a potential and controversial rising decacorn

Quentin Bonnefond

This article written by Quentin Bonnefond (ESSEC Business School, Master in Strategy & Management of International Business (SMIB), 2020-2021) discusses the case of Palantir.

Introduction

Founded in 2003 by entrepreneur Peter Thiel, Palantir provides software and data analysis services to help government agencies (CIA, NSA, etc.) and large corporations (among which Merck, Fiat-Chrysler, Ferrari, Crédit Suisse, Airbus, etc.) process large amounts of information. This discreet activity has led Palantir to be regularly accused of mass surveillance and criticized for its close links with law enforcement agencies.

Palantir introduced in the NSYEBanque Internationale à Luxembourg (BIL)Source : https://finance.yahoo.com/

Still no profits

Palantir is a real cash consumer. In 2019, its operations consumed $165 million in cash, or 22% of its revenues. And its cash consumption increased from the previous year. In 2018, Palantir’s negative cash flow from operations was $39 million, its cash consumption in 2019 soared by 323% while its revenues increased by only 25%.

The company has very high overhead costs, which accounted for 105% of sales last year. This is due to high R&D costs and low selling prices compare to traditional consulting due to the lengths of its project (several years). To be competitive and acquire new clients, the firm needs to propose reasonable prices.

In 2019, for example, Palantir’s sales and marketing expenses of $450 million accounted for 61% of sales, while general and administrative expenses of $321 million accounted for 44%.

After 17 years of existence, Palantir still hasn’t figured out how to make a profit.

The financial and health crisis: an opportunity not to be missed

The coronavirus crisis has created “enormous opportunities”. This phrase has prompted many funds to invest in the company. Moreover, at the end of January 2021, in a morose context of economic and health crisis, the Californian firm announced a partnership with IBM, which skyrocketed the share price to $39, which was 4 times its value at the time of its initial public offering (IPO), 4 months earlier.

Source: https://fr.finance.yahoo.com/quote/PLTR/

A price correction

Uncertainty linked to the global health crisis smiles on Palantir, but the end of the crisis could be (slightly) more unfavorable for the firm. The US company says that revenue growth is expected to slow to about 30% in 2021, compared to 47% in 2020. This announcement is reflected in the share price: $26.75 at the market closing of 23/02, a 31.41% drop in one month.

The company reported better-than-expected sales in the fourth quarter and recorded more than $1.1 billion in annual revenues by winning 21 contracts worth $5 million or more.

Insights:

  • $1.1 billion in revenue for full-year 2020, up 47% year-over-year
  • $322 million in revenue for Q4 2020, up 40% year-over-year
  • New contracts in Q4 2020 include Rio Tinto, PG&E, BP, U.S. Army, U.S. Air Force, FDA, and NHS
  • Expects Q1 2021 revenue growth of 45% year-over-year

A bright future for data and Palantir

In a conference call with analysts, Palantir’s Chief Operating Officer, Shyam Sankar, indicated that the company’s approach to automated data management and software will increase the total addressable market. “Look at our investments in archetypes. This means that in a few clicks you can deploy powerful end-to-end use cases that would have cost millions of dollars and taken many months to develop and can now be deployed in minutes,” he boasted.

“These are examples of why we’re confident in our long-term growth, which is expected to exceed $4 billion by 2025,” he said. Indeed, the company has a lot of leads for acquiring corporate customers. Palantir had eight Fortune 100 clients and twelve Global 100 clients.

The recent launch of the company’s platform, called Foundry 21, is expected to make it more modular with better data integration, code-free applications and a mobile offering. Historically, Palantir has always needed more implementations and high-level consultants. Recently, a demo day has generated more requests from potential customers.

Conclusion

In spite of huge cash consumption preventing Palantir from being profitable, the crisis has had a boost effect on the American firm’s activity. Growth is expected for 2020 and is expected to be, admittedly less, but at least significant for 2021. Excluding the accusations surrounding data protection and privacy, Palantir is promised to make great strides. A stock to watch.

Capital structure

Top 3 shareholders:

  • Thiel Peter (co-founder): 16.60%
  • Sompo Holdings, Inc: 7.30%
  • Alexander C. Karp (co-founder and CEO): 5.50%

Full structure and top 10 funds shareholders: money.cnn.com

Key concepts

Unicorn, decacorn and hectocorn

In business, a unicorn is a privately held startup company valued at over $1 billion. The term was coined in 2013 by venture capitalist Aileen Lee, choosing the mythical animal to represent the statistical rarity of such successful ventures. Decacorn is a word used for those companies over $10 billion, while hectocorn is used for such a company valued at over $100 billion.

Start-up valuation

Startups, pretty much like babies, need money to expand themselves, test ideas and develop a team. To raise money, a startup needs to be valued and therefore, understanding how the startup valuation process works is very important for any serious and committed entrepreneur.
Various valuation methods are used such as the Venture Capital, the Berkus, the Cost-to-ducat, the DCF or the Comparables methods.

Link: https://pro-business-plans.medium.com/startup-valuation-the-ultimate-guide-to-value-startups-2019-a31cbdaebd51

Initial Public Offering (IPO)

An initial public offering (IPO) or stock market launch is a public offering in which shares of a company are sold to individual and institutional investors. After the IPO, shares are traded freely in the market (secondary market).

Secondary market

The secondary market, also called the aftermarket and follow on public offering, is the financial market in which previously issued financial instruments such as stock, bonds, options, and futures are bought and sold. The existence of a secondary market provides liquidity for investors.

Useful resources

Capital.fr : https://www.capital.fr/entreprises-marches/palantir-le-big-brother-de-lanalyse-de-donnees-debarque-en-fanfare-en-bourse-1381955
https://www.capital.fr/entreprises-marches/palantir-devisse-la-croissance-de-lactivite-va-nettement-ralentir-en-2021-1394242
Forbes.fr: https://www.forbes.fr/finance/entree-en-bourse-de-palantir-pourquoi-il-ne-faut-pas-investir/
Palantir.com: https://www.palantir.com/
fr.finance.yahoo.com: https://fr.finance.yahoo.com/quote/PLTR/
marketwatch.com: https://www.marketwatch.com/investing/stock/pltr

Relevance to the SimTrade Certificate

The case of Palantir is relevant to the SimTrade Certificate as the stocks issued by the company are now traded on the stock market which brings liquidity for investors. It relates to the SimTrade Certificate in the following ways:

About theory

  • By taking the Discover SimTrade course (Period 1), you will discover the SimTrade platform that simulates a secondary market with a limit order book.
  • By taking the Market information course (Period 2), you will know more about how information is incorporated in the stock market price.

Take SimTrade courses

About practice

  • By launching the Sending an Order simulation, you will practice how financial markets really work and how to act in the market by sending orders.
  • By launching the Market order simulation and the Limit order simulation, you will practice market orders and limit orders that are the two main orders used by investors to build and liquidate positions in financial markets.

Take SimTrade courses

More about SimTrade

About the author

Article written by Quentin Bonnefond (ESSEC Business School, Master in Strategy & Management of International Business (SMIB), 2020-2021).
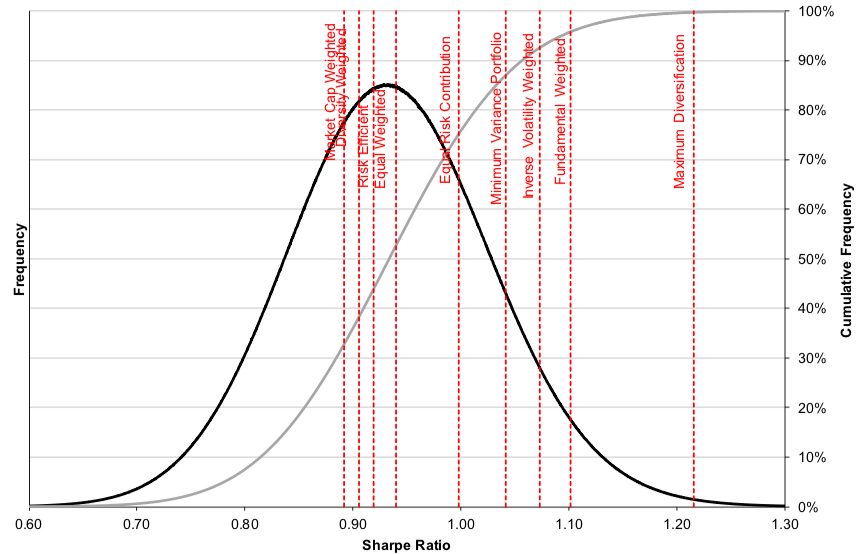
SimTrade: an inspiration for a career in finance

SimTrade: an inspiration for a career in finance

Qiuyi Xu

In this article, Qiuyi Xu (ESSEC Business School, Global Bachelor of Business Administration, 2019-2021) shares her experience as an intern in a securities company in China.

Interested in finance, I took the SimTrade course during my study at ESSEC Business School. This course helped me gain knowledge about financial markets as well as served to motivate me to continue my exploration in the sector of finance. Now I have started an internship at the investment banking department of a top 10 securities company in China.

The concept of “investment banking services” is slightly different in China. While in the US and Europe, it refers to all kinds of services (investment banking division, asset management, sales & trading and research departments), in China, it mainly includes securities (stocks and bonds) issuance and underwriting, merger & acquisition and restructuring.

My mission

My mission is to support the team responsible for an initial public offering (IPO) project. An initial public offering (IPO) refers to the process of offering shares of a private corporation to the public in a new stock issuance. Public share issuance allows a company to raise capital from public investors.

A main part of our work is to conduct pre-IPO due diligence. Due diligence is regularly carried out to assess the market maturity of the IPO candidate. We deal executers, together with the accompanying issuing houses and the advisers, typically commissions due diligence covering the financial, tax, legal, commercial, IT, operational, environmental and human resource areas. The objective of the pre-IPO due diligence is to analyze the sustainability of the business model, the plausibility of planning and the disbursement capacity of the company.

I am responsible for financial due diligence and shareholders’ due diligence. A pre-IPO due diligence delivers insights into the sustainability of the company’s business model, assesses the competitive landscape, delves into the opportunities available in the candidate’s industry and fully assesses the potential risks that could impact the company.

For financial due diligence, I check the bank card records of transactions of senior executives to identify whether their receipts and payments are normal transactions or there are possibilities of property transfer or commercial bribery. In addition, I check a large number of loan contracts, including the debt amount, starting and ending date, guarantors and guarantee amount to confirm whether the company’s liabilities are within a reasonable range and whether it has potential debt crisis. I am also responsible for writing the relevant part of financial analysis in the prospectus. For shareholders’ due diligence, I have collected the information of the company’s shareholders which should be disclosed in the prospectus through questionnaires under my mentor’s guide. In the case of an IPO, the shareholders of a company are usually directors, supervisors, and senior managers. Since they are the persons who are actually responsible for the operation of the company, we need to disclose in the prospectus their educational and professional backgrounds in detail so that investors can judge whether the company’s top management team can manage the company well to ensure its long-term growth. It is also important to know their investments in other companies or their holdings of shares of other companies, and to recognize the benefit relationship between shareholders and related companies.

Although I did not have the opportunity to participate in the whole process of an IPO project as it usually takes about two years to carry out a project from the beginning of due diligence to the final listing on an exchange, I still feel it is a rewarding experience because so far, I have helped my mentor completed a lot of basic information processing and through this process I have learned how the data and information in the prospectus are obtained, and I have gained an extensive series of knowledge of auditing, commercial laws, and corporate management.

Through the communication with the associates in my group, I learned about what the working environment and lifestyles are like for bankers. The work in an investment bank may begin with dealing with trivial things for several years, but the fact that many elites gather there and their pursuit of perfection in work allow people to develop working capacities and qualities that ordinary people need ten years to cultivate in three years. For example, the customers you are facing are senior executives of large companies, so you can touch the ideas of leaders in the industry; your skills to make and present slides will be greatly improved by doing numerous presentations to customers; and by analyzing the company’s business, you will have a deep understanding of the industry that it is in after each deal.

Relevance to the SimTrade certificate

Primary market and secondary market are interdependent upon each other. Primary market brings new tradeable stocks and bonds to secondary market. A company is considered private prior to an IPO. It grows with a relatively small number of shareholders including early investors like the founders, family and relatives along with professional investors such as angel investors. To expand at a higher speed, the company needs to raise more capital. That’s what an IPO can provide. Via an IPO, securities are created in the primary market. Those securities are then traded by public investors in the secondary market. The secondary market provides liquidity to company founders and early investors, and they can take advantage of a higher valuation to generate dividends for themselves.

From the course SimTrade, I learned many factors that may affect a company’s stock price. For example, when the company appoints a new director who has many years’ experience in the company’s business sector, this favorable news will attract more investors to invest because they believe that under the guidance of this new director, the company’s performance will improve. As a result, the valuation will increase, and the stock price will rise. If the news comes like the company’s new product development has failed, it will lower the expectations of investors, causing some of them to sell stocks and invest in other stocks, accompanied by a decline in stock price. This knowledge about the secondary market also helps me find out more factors that should be considered in pre-IPO due diligence. We should identify the company’s potential competitive advantages, which will become an attraction to public investors and ensure its vitality in the securities market; we also need to recognize its risk factors because if the company does not operate well, it will face the risk of delisting, and more importantly, we are responsible for ensuring the sustainable trade order in the secondary market.

In short, the SimTrade course has equipped me with necessary knowledge needed in internship as well as future work and paved the way for me to secure an ideal position. This will be an asset that I will cherish for the rest of life.

About the author

Article written in May 2021 by Qiuyi Xu (ESSEC Business School, Global Bachelor of Business Administration, 2019-2021).

Private banking: evolving in a challenging environment

Private banking: evolving in a challenging environment

Hélène Vaguet-Aubert

This article written by Hélène Vaguet-Aubert (ESSEC Business School, Master in Strategy & Management of International Business (SMIB), 2020-2021) discusses the challenging environment in private banking based on her experience at the Banque Internationale à Luxembourg (BIL).

Banque Internationale à Luxembourg (BIL)

Banque Internationale à Luxembourg (BIL) was founded in 1856 and is now steered by Marcel Leyers, appointed as director and chairman of BIL’s executive committee in 2019 (BIL, 2021). Being a top bank for over 160 years and being owned to a 10% extent by the Luxembourgish government, BIL supports Luxembourg’s economy at all levels. BIL has also established itself as top international player thanks to its international subsidiaries. BIL’s international scope, 2,000 top-skilled employees worldwide, strong financial results and growth confirms its systemic importance.

Headquarters of Banque Internationale à Luxembourg (BIL)Banque Internationale à Luxembourg (BIL)Source: BIL

BIL brings together all its banking business lines under a common umbrella in order to propose top-of-the-range solutions tailored to the requirements of a very diverse client base. Indeed, the bank has all the financial products and expertise necessary to fulfill all of its clients’ needs: private banking, retail banking, corporate banking and financial markets. As of H1 2019, the bank had a €45 million profit and €41.9 million of assets under management.

As BIL’s “create, collaborate, care” mission statement clearly indicates, BIL’s marketing strategy is client oriented. BIL’s objectives are to focus on core competencies to boost its revenues. To do so, BIL’s short term strategy is to strengthen its activities in mature markets such as Luxembourg and Switzerland. On the long term, BIL’s objective is to leverage the potential of Legend Holdings and the Chinese private banking market.

My internship at BIL

Passionate by strategy and sales, and willing to acquire international experience in the financial sector, I carried out a six-month internship in the Sales Management Department of Banque Internationale à Luxembourg (BIL). In this department, I worked with a team of five international people whose role was to design strategy, sales and marketing solutions to be the direct support of BIL front office and the private banking clients’ indirect support. During this internship, the responsibilities that I had where divided in two parts: on the one hand, sales and marketing, and on the other hand, strategy.

First, regarding the sales and marketing part, my role was to analyze the performance of the bonds and equity financial markets and mutual funds as well to develop weekly sell/buy/hold recommendations regarding BIL products. Once these sales recommendations were made, my role was to analyze the performance of wealth managers from BIL Europe, Asia and Middle East. Finally, once BIL products and wealth managers’ performances were analyzed, I had the opportunity to design relevant marketing content (pitch book containing the details of the financial products) for BIL 20,000 private banking clients.

Second, regarding the more strategic parts, I contributed to the management of two projects at the group level: digitalization of the commercial process on a selection of 2,500 products and repositioning of the private banking service offering targeting 2,000 customers.

Private banking

The financial concept that was the most linked to my experience at BIL is the concept of private banking. Private banking is the main subset of wealth management, it offers investment, banking and other financial services to high-net-worth individuals (HNWI) on different markets. The adjective “private” emphasizes a more consumer-centered approach than what is offered by retail banks since each client is usually assigned to dedicated relationship managers and benefits from tailor-made products. Historically, HNWI from different markets or private banks’ target, were individuals with liquidity over $2 million. However, now, it is possible to open a private banking account with cash and/or financial assets of $250,000. Hence, HNWIs segments that wealth management institutions such as private banks target can be divided into four categories based on their income:

  • Affluent: between $250,000 and $1 million
  • Lower HNWI: between $1 million and $20 million
  • Upper HNWI: between $ 20 million and $100 million
  • Ultra-High Net Worth individuals or UHNWI: over $100 million

Under one roof, private banks’ offering encompasses wealth management, tax and insurance services.

Pricing model

For these services, private banks can use three types of pricing models (Goyal et al., 2019):

  • “Standard” model: the client pays custody fees, transaction fees and management fees
  • “All-in fee” model: the client only pays management fees
  • “Performance fee” model: the client pays performance fees and custody fees

Challenges

Today, the private banking industry is facing many threats such as: digitalization, enhanced regulations, rising clients expectations but I would say one of the most important one I noticed in the wake of my internship is: negative interest rates, which is the second financial concept I will introduce here. Indeed, in the wake of the 2008 financial crisis, central banks such as the European Central Bank (ECB) in 2014 had to charge negative interest rates to fight the deflationary spiral. These negative interest rates (-0.5% since September 2019) are a big trouble for European banks such as the ones in Luxembourg: banks must now pay interests on their reserves to the ECB. The excess in bank reserves has exploded since the “Quantitative Easing” program of the ECB in 2015. Therefore, banks have paid €25 billion of negative deposit rate to the ECB since 2014 which had a had a considerable impact on banks’ profitability, equating to a 4% decline in profits for European banks in 2018 for instance (Honoré-Rougé, 2019).

To compensate these profits cuts, some European banks have started charging their clients on their cash deposits or take the risk to grant more risky loans to maintain a decent level of profitability (Arnold, Morris & Storbeck, 2019). However, despite these negative economic trends, Luxembourg is still the leading asset management center in the Eurozone. In Luxembourg, AUM increased to $4.9 trillion in 2020 (+5.4% from 2019).

Related posts on the SimTrade blog

Looking for an internship? Looking for a job? You may find useful information by reading other posts where students share their professional experience:

   ▶ All posts about Professional experiences

   ▶ Suyue MA Expeditionary experience in a Chinese investment banking boutique

   ▶ Raphaël ROERO DE CORTANZE In the shoes of a Corporate M&A Analyst

   ▶ Youssef LOURAOUI SimTrade: an eye-opener for gaining insights into the world of finance

Looking for an internship or a job in finance, you may also be interested in the following resources to prepare your interviews:

   ▶ Alexandre VERLET Classic brain teasers from real-life interviews

Useful resources

Arnold, M., Morris, S., & Storbeck, O. (2019). European banks fear no escape from negative rates. The Financial Times, 1-3. Retrieved from https://www.ft.com/content/93015730-d960-11e9-8f9b-77216ebe1f17

BIL. (2021). BIL, a key player in the Luxembourgish financial market. Retrieved 27 December 2021, from https://www.bil.com/en/bil group/the-bank/Pages/discover-BIL.aspx

Goyal, D., Zakrzewski, A., Mende, M., Alm, E., Kowalczyk, L., & Wachters, I. (2019). Solving the Pricing Puzzle in Wealth Management. Retrieved 28 December 2019, from https://www.bcg.com/publications/2019/solving-the-pricing-puzzle-in-wealth-management.aspx

Honoré-Rougé, C. (2019). Les taux négatifs et leurs conséquences sur les banques de la zone euro. Retrieved 25 February 2021, from http://www.bsi-economics.org/1039-taux-negatifs-consequences-banques-zone-euro-chr

Relevance to the SimTrade Certificate

It relates to the SimTrade Certificate in the following ways:

About theory

  • By taking the Discover SimTrade course (Period 1), you will discover the SimTrade platform that allows investors (or their financial advisors or private bankers) to invest in the financial markets.
  • By taking the Market information course (Period 2), you will know more about how information is incorporated in the stock market price.

Take SimTrade courses

About practice

  • By launching the Sending an Order simulation, you will practice how financial markets really work and how to act in the market by sending orders.
  • By launching the Market order simulation and the Limit order simulation, you will practice market orders and limit orders that are the two main orders used by investors to build and liquidate positions in financial markets.

Take SimTrade courses

More about SimTrade

About the author

Article written by Hélène Vaguet-Aubert (ESSEC Business School, Master in Strategy & Management of International Business (SMIB), 2020-2021).

Asset valuation in the real estate sector

Asset valuation in the Real Estate sector

Ghali El Kouhene

This article written by Ghali El Kouhene (ESSEC Business School, Global BBA, 2019-2022) discusses the valuation methods in the real estate sector.

Definition of a real estate

Real estate is a property, land, buildings, air rights above the land (with certain limitations) and underground rights below the land. The term “real estate” means real, or physical, property. It is the land and its attached constructions that represent a capital good that produces a flow of services over time. Therefore, land includes earth’s surface, lateral support and subjacent support. But it also includes materials under the surface such as substances, minerals oil and gas.

There are four types of real estate assets. First, we find residential real estate. It is a type of leased property, containing either a single family or multifamily structure that is available for occupation for non-business purposes. This includes both new construction and resale homes. Secondly, there is commercial real estate. They are property used exclusively for business purposes or to provide a workspace rather than a living space. All of them are owned to produce income. Thirdly, we can mention industrial real estate. There are generally two uses for industrial properties: companies make things, or they store things. These includes manufacturing buildings and property, as well as warehouses.

Finally, land is real estate or property, minus buildings and equipment that is designated by fixed spatial boundaries. Land ownership may offer the titleholder the right to natural resources on the land. Traditionally it is defined as a factor of production, along with capital and labor.

Importance of the real estate sector in the economy

According to the European Real Estate Forum, the real estate sector has a higher economic importance than several other sectors. Indeed, it makes a major contribution to GDP in the European Union and provides prosperity and jobs. The real estate sector contributed approximately 7% to the USA economy and 12% to the European economy.
Real estate represents the majority of the existing real capital and is particularly relevant too because of its additional function as provision for old age and protection against inflation.

The value of the world’s real estate reached US$281 trillion, the highest figure we’ve ever recorded. Residential real estate accounted for the largest share ($US220.2 trillion) of that huge figure.

Real estate is by far the most significant store of wealth, representing more than 3.5 times the total global GDP. For comparison, financial instruments like equities represent US$83,3 million, which is three times less than commercial real estate.

Global real estate universe in comparison

Source: Savills World Research

Why does the need for property valuation arise?

The need for property valuation arises in many decisions in real estate project like investing, managing, disinvesting and financing. Thereby, valuation is present throughout the life of real estate investment. It is not a unique need for real estate but common to any investment such as stock investment.

There are fundamental characteristics to be evaluated in the valuation process. Characteristics like the use of the asset (commercial, residential, etc.), the location, the antiquity (1st hand, 2nd hand), construction costs and surfaces.

Valuation values

What are the different types of value for a real estate asset?

According to the Royal Institution Of Chartered Surveyors standards (RICS) which offers qualifications and standards recognized in the real estate sector, a value is an estimated amount for which an asset or an obligation should be exchanged at the valuation date between a buyer willing to buy and a seller willing to sell, in a free transaction, after appropriate marketing, in which the parties have acted with sufficient information, prudence and without coercion. This specific definition is declined in several others values like equitable value, fair value or market value. For each value, different methods of valuation are used.

Which methods are used to appraise an asset?

The great diversity of real estate assets must be approached from different approaches in order to determine their value. The existence of comparable assets in the market, the type of use made of them, the cash flows that they may eventually generate, replacement costs or the state of development of the same opens up a wide range of valuation methodologies. In this way we can identify at least six different types of valuation methodologies applicable to the different types of real estate assets that we will classify into at least 14 large groups. The main axes of the valuation methodologies are: comparison, residual, capitalization and cash flows. It is important to know that each type of real estate asset has its preferred method of valuation. For example, the comparison method is mainly utilized for assets for own use (dwellings and premises mainly) and for rustic land. The concept for this method consists in comparing a property of known price and characteristics with the one we want to value. Regarding the discounted cash flow methodology, it consists in determining the market value of a property by estimating the cash flows generated by the property (mainly rents) during a determined period of time and the resale of the investment.

Reading the real estate market requires the development of an information tool. The study of the traditional approach has shown that the reliability of real estate valuation methods is intimately linked to the information available. Information is essential when it comes to asset valuation for each of the different methods (list of rents, the price per square meter etc.). The difficulty in the valuation process does not come from the methodology but from the availability of relevant information. To complete his/her analysis of the real estate deal, the expert can also consider the future instead of the past contained in historical data.

For example, the value of the real estate can be obtained by estimating the growth rate of future rents. Today, artificial intelligence (AI) can be used to develop new valuation models are based on machine learning (ML) algorithm.

How to invest in the real estate sector?

Real estate investment consists of acquiring a property not for the purpose of living in it, but as a savings investment to earn an income from it. It is considered as one of the most stable and profitable investments in the long term. For this reason, investing in real estate is not a trivial gesture: you must know enough about the state of the market and the different investment possibilities not to put your money in risky options.

Several reasons can push you to proceed to a real estate investment. First, it is a great way to build up a tangible and lasting estate. Secondly, investing in real estate enables to finance a property with the aim of making it your main residence later on, by means of rental investment. And lastly, it improves your purchasing power by collecting additional income.

There are several possibilities when it comes to investing in real estate. Among them, there is direct investment which means creating a property portfolio. Indeed, any private individual can firstly invest and acquire a property as a primary residence and later on acquire other properties for the purpose of making a rental investment in order to collect the rents. In the other hand, other types of investment such as indirect investment. The concept of indirect investment consists in buying shares of property company or Real Estate Investment Trust’s (REITS) which aims at the constitution, management and exploitation of a real estate portfolio. Therefore, this company manages real estate assets on behalf of its shareholders. Lastly, a real estate investment company (SCPI) is a collective investment vehicle which is very similar to REITS. Except that in return for this investment, investors receive social shares. Unlike company shares, these units are not listed on the stock exchange. These savings vehicles offer a very good market return in return for a moderate risk.

Related posts on the SimTrade blog

   ▶ All posts about Professional experiences

   ▶ Clément KEFALAS My experience of Account Manager in the office real estate market in Paris

   ▶ Chloé POUZOL Mon expérience de contrôleuse de gestion chez Edgar Suites

About the author

Article written in March 2021 by Ghali El Kouhene (ESSEC Business School, Global BBA, 2019-2022).

Organization of equity markets in the U.S.

Organization of equity markets in the U.S.

Bijal Gandhi

In this article, Bijal Gandhi (ESSEC Business School, Master in Management, 2019-2022) talks about the organization of the equity markets in the U.S.

Give this article a read, if you wish to know more about the market participants, intermediaries, and the products in this segment.

Financial markets in the U.S. account for 46% of the global stock market value as of October 2020. The combined market capitalization of the US stock market stands at around 41.17 trillion thereby dominating the global financial landscape. It holds a long-standing reputation and prominence owing to factors like legitimacy, transparency, tight regulations, and availability of capital to fund some of the world’s largest companies.

Primary markets vs Secondary markets

Primary markets are the markets where new securities are issued by corporations to raise capital to finance their new investments. These new securities are offered to the investors for the first time. The corporation may raise capital through an Initial Public Offering (IPO), rights issue, or private placements. Corporations that are already listed may opt for a Seasoned Equity Offering if they wish to raise more capital through the sale of additional shares or bonds. The companies who wish to go public in US, must adhere to the compliance and filing of the U.S. Securities and Exchange Commission before the listing.

Once the securities are issued in the primary market, secondary market provides the investors with a platform to trade in these securities. This smooth exchange of securities between investors creates liquidity and price discovery. These transactions take place over stock exchanges like NASDAQ and NYSE Euronext.

Exchanges vs OTC markets

Exchange is a centralized marketplace to trade securities through a network of people. The exchange establishes a formal setting to ensure fair trading, transparency, and liquidity. The are several rules and regulations in place to eliminate frauds and unscrupulous activities.

The transactions which do not take place over a centralized exchange are known as over the counter markets. OTC markets are less transparent, and they are subject to fewer regulations. They are digitalized markets where participants quote different prices and act as market-makers. American depository receipts are often traded as OTC.

Market intermediaries

The organization of such a huge marketplace has resulted in the creation of several intermediaries and participants. Let us delve deeper into what role each of these stakeholders play in the U.S. financial market organization.

Stock exchanges

A stock exchange is the principal intermediary in the financial market organization of a nation. An exchange can be either a physical or an electronic platform which intermediates between corporations, government, and market participants. In the U.S., a stock exchange must register and comply with the norms of the SEC. It is only after that it can facilitate the process of buying and selling of financial instruments on its platform.

A stock is first listed on an exchange through initial public offering (IPO). The shareholders can participate in this initial offering which is also known as the primary market. These shares are then publicly bought and sold on the exchange or the secondary market.

According to Reuters, as of 2020, there are a total of 13 stock exchanges in the U.S. out of which NASDAQ and NYSE Euronext are the largest exchanges in the world.

Broker-dealers

An investor or trader cannot directly purchase shares from the stock exchange. They must do so through an intermediary called a broker. A broker acts as a link between the investor and the stock exchange. In US, a broker can either be an individual or a firm who is registered with the SEC and SRO (self-regulatory organization). The SEC defines a broker as “any person engaged in the business of effecting transactions in securities for the account of others”. Similarly, a dealer is “any person engaged in the business of buying and selling securities for his own account, through a broker or otherwise”.

Brokers also perform several other secondary functions such as:

  • Marketing, sale, and distribution of investment products
  • Ensuring liquidity and smooth flow of financial products in the open market
  • Operation and maintenance of trading platforms

They may also act as underwriters and placement agents for securities offerings.

Clearing agencies

Clearing agencies in US are broadly classified under two categories, Central counterparty (CCP) and Central securities depository (CSD).

A clearing agency is a CCP when it intercedes between the two counterparties by performing the role of a buyer to every seller and a seller to every buyer in a transaction. The following are the clearing agencies in the US:

  • National Securities Clearing Corporation (NSCC)
  • Fixed Income Clearing Corporation (FICC)
  • The Options Clearing Corporation (OCC)

A clearing agency is a CSD when it operates a centralized system for the safekeeping of securities and maintaining records of ownership, sale, and transfer. The Depository Trust Company in New York, U.S. performs the role of a CSD. It is also the largest depository in the world.

Regulatory agencies

The Securities and Exchange Commission (SEC) is the US government regulatory body entrusted with the responsibility to protect the investors. Their primary goal is to supervise every intermediary and participant in the securities market to avoid any fraud or misconduct under its supervision. It ensures this through strict regulations, compliance, full disclosure, and fair dealing in the securities market.

Similarly, the Commodities Futures Trading Commission (CTFC) is an independent Federal agency established in the U.S. to regulate the derivatives markets (commodities, futures, options, swaps). The main responsibility of this agency is to ensure fair, transparent, efficient, and competitive capital markets.

Market participants

Corporations

Corporations are the most vital and primary participants in the capital market ecosystem. To raise capital for their operations, they issue new securities and instruments with the help of the intermediaries. They may do so by listing their shares on a stock exchange or by issuing debt instruments such as bonds. This opens avenues of investments for individuals and institutions and gives them a medium to invest, trade or park their funds.

Retail investors

Retail investors are nonprofessional individuals who either trade or invest in financial securities in their personal accounts. The amount of their investments is generally smaller with respect to institutional investors. They facilitate these transactions through a broker for a fee.

Institutional investors

Banks, mutual funds, pension funds, hedge funds, insurance companies and any other similar institution which invest large sums in the capital markets are termed as institutional investors. These investors are professionals and experts at handling funds and therefore there are several regulations by SEC that may specifically apply to them.

Investment banks

Investment Banks act as an intermediary between the corporations and investors. They play a major role in facilitating the transfer of funds from the lenders to the borrowers. Apart from that, they also assist the corporations in the sale and distribution of securities, bonds, and similar financial products. They aim to make a sale by connecting the corporations with investors who have similar risk and return appetite. Investment Banks perform several other ad-hoc functions including underwriting and providing equity research.

Robo-advisors

The most recent addition to the participants list is the robo-advisors. Retail investors often find it difficult to invest in the stock markets due to lack of knowledge and expertise. Robo-advisors are of great help here. They are digital platforms that study the financial situation of an individual and provides investment solutions through automation and algorithmic financial planning. These advisors require no human supervision and are therefore low cost. There are around 200 robo-advisors in the US. The robo-advisors like human advisors are subject to the registration and regulations under SEC.

Type of products

Stocks

The most traded instrument is the stock. There are two broad categories of stocks: common stocks and preferred stocks.

  • Common stocks: The investor in common stocks is entitled to both, the dividends, and the right to vote at shareholders meetings. It is a security which represents ownership of the company by the same proportion as its holding. In case of liquidation of the company, the shareholders’ right on the company’s assets are after that of the debt holders and preferred shareholders.
  • Preferred stocks: Preferred stock is more like a hybrid combination of equity and debt. Preferred shareholders have no voting rights, but they receive regular dividends unless decided otherwise. They have a priority over common stockholders in case of bankruptcy.

The choice of stock depends upon the investors risk appetite and goals. Investors may choose to invest in one or a combination of growth, value, income, or blue-chip stocks.

Market Index

Market index is a portfolio of stocks which represents a particular fragment of the financial market. The value of this index is derived from the underlying stocks and the weights attached to each of those stocks. The methodology to assign weights and calculate the index value may differ but the underlying idea to measure the fragment’s performance remains the same. In the US, they use the Dow Jones Industrial Average (DJIA), S&P 500 Index and Nasdaq Composite Index to gauge the performance of the US economy and the financial market.

Investors cannot directly invest in an index, therefore they can either invest in a mutual fund that follows that index or into index derivatives.

Derivative Instruments

Derivatives are financial instruments whose value is derived from an underlying asset. The underlying instruments include stocks, market indexes, interest rates, bonds, currencies, and commodities. Futures, options, forwards, and swaps are the types of derivatives that are most traded in the US markets.

Investors use derivatives to hedge their risk while speculators use it to gain profits from the same.

Mutual Funds

The financial markets are complex and therefore retail investors often find themselves unable to make their financial decisions. This is where the mutual funds step in. These are funds that pool money from several investors to invest in different types of securities. These funds are professionally managed by fund managers for a small fee. The main goal of the fund manager is to produce profits for the investors. Mutual funds vary in terms of the underlying securities, investment objectives, structure, etc.

Mutual funds are popular due to the benefits derived by retail investors in terms of diversification, liquidity, and affordability. In US, mutual funds are managed by “investment advisors” registered under the SEC and they are obliged to file a prospectus and regular shareholder reports.

Exchange Traded Funds

Exchange traded funds (ETFs) are like mutual funds, but unlike mutual funds, ETFs can be traded on the stock exchange and their value may or may not be the same as the net asset value (NAV) of the shares. An Index based ETF simply tracks a particular index and gives the investors an opportunity to invest in its components through the ETF. Actively managed ETFs are not based on an index but rather a stated objective which is achieved by investing in a portfolio of one or many assets.

Related posts

Useful resources

Relevance to the SimTrade certificate

The concepts about equity markets (secondary markets, trading, incorporation of information in market prices, etc.) can be learnt in the SimTrade Certificate:

About theory

  • By taking the Trade orders course, you will know more about the different type of orders that you can use to buy and sell assets in financial markets.
  • By taking the Market information course, you will understand how information is incorporated into market prices and the associated concept of market efficiency.

Take SimTrade courses

About practice

  • By launching the Send an Order simulation, you will practice how financial markets really work and how to act in the market by sending orders.
  • By launching the Efficient market simulation, you will practice how information is incorporated into market prices through the trading of market participants and grasp the concept of market efficiency.

Take SimTrade courses

About the author

Article written by Bijal Gandhi (ESSEC Business School, Master in Management, 2020-2022).

Eurozone Crisis 2011

Eurozone Crisis 2011

Akshit Gupta

This article written by Akshit Gupta (ESSEC Business School, Master in Management, 2019-2022) presents the real life case of the Eurozone Crisis 2011.

Introduction

The Eurozone Crisis, also called the European sovereign debt crisis, took place between 2010 and 2012 when several European countries faced an unmanageable increase in their sovereign debts, fall of their financial institutions and a sharp rise in the government bond yield spreads (difference between the yield of bonds issued by a country and the yield of bonds issued by Germany). The crisis was a result of excessive borrowing done by the Eurozone member states and a lowered refinancing or repayment capacity following the financial crisis of 2008.

Origin of the crisis

The Eurozone, also called the Euro area, was formed in 1999 with the primary aim to promote economic integration and have a stable, growth-oriented Europe by means of a unified primary currency across all member countries. Around 2010, Eurozone was comprised of 17 European countries all of which share a unified primary currency named Euro (€). The monetary policies of the Eurozone member states are governed by a central authority named the European Central Bank (ECB), whereas each country has the power to decide their fiscal and economic policies individually. As a result of a unified monetary framework, countries with weaker economy have access to more debt at a comparatively lower interest rates than before the creation of the Eurozone. Due to the excessive availability of debt, weaker countries increased their spending which resulted in high fiscal deficits. Since, the fiscal policies were controlled by countries individually, no centralized authority could keep a tab on it.
The beginning of the crisis came to light in 2009, when the new Greek government reported irregularities in the accounting system followed by the previous government. The new fiscal deficit showed a sovereign debt amounting to €300 billion which represented more than 110% of the country’s GDP at that time. The chances of default on the government’s debt started building up and the tension started to soar across the European continent.

Picture 1
Source: im-an-economist.blogspot.com

The peak of the crisis

After the Greek government reported the higher levels of sovereign debt, rating agencies started downgrading the country’s debt ratings. The creditors started demanding higher yields on the government bonds, leading to higher borrowing costs for the government and a fall in the prices of these bonds (there is an inverse relationship between the price and yield of bonds). The fall in the prices of these securities sparked an outrage when many large European countries, financial institutions and central banks holding these securities started to lose money due to fall in their prices. By 2010, many other countries including Portugal, Italy, Ireland, and Spain reported similarly high level of sovereign debts.

Causes of the crisis

The Eurozone crisis was a result of many policy failures including high fiscal deficits, lack of unified body to monitor fiscal policies, trade imbalances, and also cultural differences. Some of the primary reasons that triggered the crisis are:

    • The Eurozone crisis was triggered by the financial crisis of 2008 when access to capital at low interest rates became tough and the countries with high sovereign debt were unable to refinance or repay their debts without the intervention or help of other countries. During the recession that followed the financial crisis of 2008, tax revenues decreased whereas the public spending on unemployment benefits and infrastructure development increased. This resulted in further worsening the fiscal deficit for the weaker economies.
    • Another cause for the crisis can be attributed to an easy access to cheap capital to the weaker countries during early 2000’s and a lack of centralized fiscal policy framework to put a check on the individual government borrowing and spending.
    • The trade imbalance resulting from the flow of capital from developed countries like France and Germany to southern nations like Greece, Spain, Italy etc. led to an increase in the wages in these countries which was not matched by the increase in productivity. The increased wages led to an increase in prices of finished goods, thus making these country’s exports less competitive. The increase inflow of capital led to a trade deficit in these countries further aggravating the crisis.

Solutions

All the seventeen member states of the Eurozone voted to create a European Financial Stability Facility (EFSF), which was a temporary measure to provide financial assistance to the countries impacted by the sovereign debt crisis. With the intervention of the International Monetary Fund (IMF), the European Central Bank and the EFSF, a bailout package was provided to the debt-ridden countries amounting to €1 trillion. Several conditions were applied on countries which received bailout funds from the EFSF. The countries were bound to apply severe EU-mandated austerity measures which were formed to reduce government deficits and sovereign debts to acceptable levels. But the measures also faced criticism from the impacted countries as it could have halted the economic recovery for the impacted countries by cutting their spending capacities.

The creation of the EFSF provided remedial measures to the impacted countries by means of financial assistance subject to certain reforms and conditions that the fund – receiving country must undertake. The EFSF functioned by issuing EFSF bonds and other marketable securities to lenders. The bonds and securities were secured and backed by the Eurozone member countries up to the proportion of their share of capital in the ECB.

After effects

In 2012, a European Stability Mechanism (ESM) was instated to replace the EFSF as a permanent financial stability and crisis resolution measure for the Eurozone countries. The ESM is fully backed by the members of the Eurozone. This backing provides a relief to the lenders and assures them of their capital protection. The crisis saw the creation of the Eurobonds, which are used as a new way of financing the bailout funds. The ESM is funded by issuance of Eurobonds worth €700 billion which are backed by the Eurozone countries.

Lessons learnt from the crisis

The Eurozone crisis has affected the world economy at large, posing a threat to the global markets. Although, the decisions taken by the Eurozone countries helped in containing the damage, some policy changes are required to prevent such events to happen in the future. Political consensus among Eurozone member countries is required to ensure efficient decision making. The coordination and monitoring of the fiscal policies along with the monetary policies of the Eurozone countries is also essential to ensure a balanced economy growth. The policy makers should implement centralized fiscal policies to ensure the long-term viability and stability of the European economies.

Relevance to the SimTrade certificate

The concepts about pricing of securities in the secondary market and incorporation of information in market prices can be learnt in the SimTrade Certificate:

About theory

      • By taking the Trade orders course, you will know more about the different type of orders that you can use to buy and sell assets in financial markets.
      • By taking the Market information course, you will understand how information is incorporated into market prices and the associated concept of market efficiency.

Take SimTrade courses

About practice

      • By launching the Sending an Order simulation, you will practice how financial markets really work and how to act in the market by sending orders.
      • By launching the Efficient market simulation, you will practice how information is incorporated into market prices through the trading of market participants and grasp the concept of market efficiency.

Take SimTrade courses

Useful resources

TheBalance – Eurozone Crisis

Solving the Financial and Sovereign Debt Crisis in Europe – by Adrian Blundell-Wignall

European Stability Mechanism

Investopedia Article – European Financial Stability Facility

Article written by Akshit Gupta (ESSEC Business School, Master in Management, 2019-2022).

Ponzi scheme

Ponzi scheme

Louis Viallard

This article written by Louis Viallard (ESSEC Business School, Master in Management – Economic Tracks, 2020-2022) presents the basics of a fraudulent financial scheme: the Ponzi scheme. The famous and recent Madoff Affaire is used to illustrate this financial fraud.

In the Letter 142 of The Persian Letters, Montesquieu tells us the mythological tale of the son of Aeolus, god of the wind, who decides to travel the world to sell air-filled otters. The French author presents us with his reflections on a new discipline in gestation in the 17th century that already fascinates minds: modern finance. Indeed, Montesquieu’s work was written in 1720, the same year as the bursting of one of the first financial bubbles of our history following a speculation around the Royal Bank and the Mississippi Company in which Montesquieu, a contemporary of the crash, was interested. The example used in The Persian Letters with the metaphor of the wind to qualify financial speculation and certain fraudulent financial mechanisms is perfectly suited to define a sadly famous fraudulent scheme: the Ponzi Scheme.

Money makes money – What is a Ponzi scheme?

A Ponzi scheme is a form of financial fraud in which participants are paid with money invested by subsequent participants, not by actual profits from investments or business activities. Investors are attracted by windfall dividends that are paid by the entry of new investors into the system to pay the first ones and so on.

The organizers of a Ponzi scheme generally attract investors by offering higher returns than any legitimate business can offer. The rate of growth of new inflows must be exponential in order to be able to remunerate members, and the system inevitably breaks down when the need for funds exceeds new inflows. Most participants then lose their investments, even though the first participants – including the founders – can benefit from high returns or exceptional annuities provided that to have withdrawn from the scheme in time.

Fraudsters organizing such schemes often target groups that have something in common, such as ethnicity, religion or profession, in the hope of exploiting their trust. The example of the Rochette Affaire in 1908 illustrates this well. Henri Rochette managed to capture the small provincial savings by relying on the wave of investment in coal mines at the beginning of the 19th century and by selling the merits of his (fictitious) companies through investment advice journals that he himself controlled.

An example of a Ponzi Scheme – The Madoff scandal

Bernard Madoff was born in 1938. This American broker immersed himself in finance at a very young age and quickly earned a good reputation among the greatest financiers. Reputed to be intuitive, ultra-fast but also very “ethical”, he had finally established himself in the financial community, which earned him the position of President of Nasdaq from 1990 to 1991. Socially-minded, jovial, he managed to capture the confidence of his future clients.

Through his fund (Bernard Madoff Investment Securities), Mr. Madoff received capital to manage, which he supposedly invested in a complex investing technique: the split-strike conversion strategy (see Bernard and Boyle (2009)). It is a three-step technique. First, you buy a portfolio of securities (the S&P100 index in the case of the Madoff). Second, you purchase out of the money put options with a nominal value on the underlying asset equal to the value of your portfolio. The objective is to limit the risk of loss of the portfolio. Third, you write out of the money call options on the underlying asset with a nominal value equal to the value of your portfolio. The sale of calls finances the purchase of puts.

When the performance was not there, instead of reducing the return distributed to investors, Madoff simply took the money from the new investors and used it to pay the old ones. As a result, he gave the impression of an exceptional performance in terms of risk-return trade-off (relatively high performance but delivered regularly year after year). Such an investment track record allowed Mr Madoff to attract more and more investors, but year after year, he squandered the capital they had entrusted to him.

When the stock market crisis broke out in 2008, many investors wanted to withdraw their funds from Madoff investment. Too many at the same time. Mr. Madoff could not give their money back. He informed his son of the situation and he warned the authorities. On December 11th 2008, Bernard Madoff was arrested by the FBI and was then sentenced to 150 years in prison.

Economic and financial damage

Ponzi schemes are expensive for most participants and divert savings from productive investment. If left unchecked, they can grow disproportionately and cause great economic and institutional damage, undermining confidence in financial institutions and regulators and putting pressure on the budget in the event of bailouts. Their collapse can even lead to economic and social instability.

In the case of a Ponzi Scheme detected, there is a need for a rapid government response. However, the authorities often struggle with not only detecting these scams at an early stage but also put an end to it. There are several reasons why it is difficult to stop these practices. Often, neither the leaders nor the schemes are licensed or regulated. In many countries, supervisory authorities do not have appropriate enforcement tools, such as the right to freeze assets and block systems quickly. On the one hand, once a Ponzi scheme has grown, authorities may be reluctant to stop it, because if they do so – thus preventing it from meeting its repayment obligations – subscribers may blame them rather than the inherent flaws in the system. It is not uncommon to see investors supporting the authors of these chains, trusting them blindly. But on the other hand, when the system collapses of its own accord, experience shows that the authorities can be criticized for not acting more quickly.

“Trust does not preclude control” – The necessity to regulate

To prevent Ponzi schemes, authorities must be prepared to intervene on several fronts. Here are the main ideas when it comes to fight Ponzi schemes:

Investigate. Ponzi schemes are generally difficult to detect due to their opaque or even secretive operation, as members are required to maintain confidentiality. In order to detect them, regulators need to develop effective and sophisticated ways to identify this type of fraud. New technologies can provide an answer through an automatic analysis model that identifies (legal) pyramid schemes that would require further analysis.

Intervene urgently. The procedures required for the prosecution of a person alleged to be the perpetrator of a Ponzi scheme are very lengthy. So much time is left for the perpetrator to disappear. It is necessary to have the legal possibility to immediately stop any activity that is proven to be a Ponzi scheme (freezing of assets, protection of spyware interests, etc.).

Arrest. Heavy penalties must be imposed on crooks, including criminal action (as was the case for Bernard Madoff, who was sentenced to 150 years in prison).

Coordinate and cooperate. It is necessary that the financial authorities must collaborate with the legal system to penalize and regularize. To combat scams, financial regulators need effective mechanisms for information exchange and cooperation. To achieve this, the role of the International Organization of Securities Commissions (IOSCO) is central to the articulation of global standards.

Inform. Financial training can be a barrier to scams. It is also essential for financial regulators to inform and educate the public about the main methods used to deceive savers. In the name and shame concept, creating lists of persons or organizations that may or may not be licensed to engage in financial activities, as well as a database describing the actions taken against certain persons and entities, is also a good way to counter any malicious activity.

What lessons can be learned?

Many lessons can be learned from Ponzi schemes, both at the micro and macro levels.

At the micro level, it is important to remind individual investors that the analysis of an investment is essential and must follow three precise criteria: profitability, risk and liquidity (not to be neglected). It is also very wise to follow the adage “don’t put all your eggs in one basket”; portfolio diversification allows you to benefit from the “portfolio effect” due to low statistical correlation among assets.

At the macro level, it is essential for the regulator (like the Securities Exchange Commission (SEC) in the US or the Autorité des Marchés financiers (AMF) in France) to put in place tools to monitor and prevent Ponzi schemes, and to work in collaboration with the legal institutions to dissuade and to punish this type of behavior.

Useful resources

Ponzi schemes

Frankel T. (2012) The Ponzi Scheme Puzzle: A History and Analysis of Con Artists and Victims” Oxford, University Press.

Monroe H., A. Carvajal and C. Pattillo (2010) “Perils of Ponzis” Finance & development , 47(1).

Madoff’s scandal (2008)

Bernard C. and P.P. Boyle (2009) “Mr. Madoff’s Amazing Returns: An Analysis of the Split-Strike Conversion Strategy” The Journal of Derivatives, 17(1): 62-76.

Bernard Madoff’s vision about business (video)

Testimonials by Markopolos (video)

Markopolos Talks About Offering To Go Undercover To Stop Madoff (video)

Wetmann A. (2009) L’affaire Madoff, Pion.

The Rochette Affaire (1908)

Jeannenay J.-N. (1981) L’Argent caché : milieux d’affaires et pouvoirs politiques dans la France du XXe siècle Paris, Editions du Seuil.

Related posts on the SimTrade blog

   ▶ Akshit GUPTA Market manipulation

   ▶ Louis DETALLE Quick review on the most famous trading frauds ever…

About the author

Article written by Louis Viallard (ESSEC Business School, Master in Management – Economic Tracks, 2020-2022).