The abandonment of the TF1-M6 merger: what happened?

The abandonment of the TF1-M6 merger: what happened?

Louis DETALLE

In this article, Louis DETALLE (ESSEC Business School, Grande Ecole Program – Master in Management, 2020-2023) explains how the fusion of the 2 biggest French TV companies has failed…

What was planned & why?

It was in May 2021 that the project to bring together the two French television channels was announced. On the one hand, TF1, whose 2020 turnover exceeds 2 billion euros; on the other hand, M6 with a turnover of 1.2 billion euros.

In the context of the loss of speed of French television channels in the face of fierce competition from the multiplying streaming platforms such as Netflix, Disney+ and Prime Video, the two television groups had deemed it strategic to come together in a giant merger.

Indeed, if we look at TF1’s revenues in 2020, they may reach more than €2 billion, but this means a notable drop of €256 million compared to 2020, i.e., a drop of 11% in its turnover.

It is therefore in a context of loss of market share that the two French television giants announced their desire to merge. A merger would have enabled these two players to combine a total of 40% of the television audience and 70% of the television advertising market.

This risk of an ultra-dominant position in France was also the source of complications for the two groups, which estimated that they could achieve economies of scale of nearly €300 million.

What happened after the announcement?

Well, after the announcement, the French Competition Authority (l’Autorité de la concurrence in French) announced that it had started a report on the consequences of a potential merger between the two groups.

The result of this report was made known on July 27, 2022: the TV channel groups were asked to divest themselves of some of their larger channels to satisfy the market monopoly issues.

According to this report, it was suggested that the M6 group should, for example, have divested itself of the M6 channel as well as TFX, 6Ter and Paris Première, which was not possible. The Directorate-General for Competition, Consumer Affairs and Fraud Control suggested to the competition authority that the new entity should sell W9 or TMC.

Why haven’t M6 & TF1 accepted to sell some TV channels?

First of all, at the beginning of the announcement of the merger project, the management of the two groups argued that their so-called hegemony on the television advertising market was non-existent.

One of their strong arguments was to point out that the market to be considered was not only that of television advertising, but rather the market for advertising on broadcasting platforms. This market would then effectively include television but also advertising on streaming sites or on-demand content platforms.

This argument was rejected by the competition authority, which considered that the market to be considered remained that of French television advertising and that an entity with 75% of the market share was therefore unthinkable, which is why TV channels had to be sold.

Useful resources

Autorité de la concurrence

Group M6’s website

Group TF1’s website

Related posts on the SimTrade blog

   ▶ Louis DETALLE A quick presentation of the M&A job…

   ▶ Suyue MA Analysis of synergy-based theories for M&A

   ▶ Basma ISSADIK My experience as an M&A Analyst Intern at Oaklins Atlas Capital

   ▶ Raphaël ROERO DE CORTANZE In the shoes of a Corporate M&A Analyst

About the author

The article was written in October 2022 by Louis DETALLE (ESSEC Business School, Grande Ecole Program – Master in Management, 2020-2023).
What are LBOs and how do they work?

What are LBOs and how do they work?

Louis DETALLE

In this article, Louis DETALLE (ESSEC Business School, Grande Ecole Program – Master in Management, 2020-2023) explains why LBOs are so trendy and what they consist in.

What does a LBO consist in & how is it built?

LBO stands for a Leverage Buy-Out. It means a company acquisition which is funded with a lot of debt. Often, when an LBO is performed, 70% of the funds used for the acquisition come from debt, the 30% left being equity.

Figure 1. Schematic plan of the organization of an LBO.

Sans titre
Source: the author.

To perform an LBO, the company wishing to buy the company called Target in this example will have to create a Holding company specially for this purpose. The holding will then take on some debt with specific lenders (banks, debt funds) under the form of loan or bonds. After that, the holding will have both some initial equity from the company wishing to acquire Target and some debt to buy Target.

What happens after the target has been bought?

Well, after the target has been bought, since the target company has an operating activity which motivated the acquiring company to buy it, this means that the target company had great financial performance. And it better to be the case! Otherwise, the large amount of debt taken for the operation will never be reimbursed to the lenders.

The principle is that target’s financial cash flows will be redistributed to the holding in the form of dividends, and the holding will use these dividends to pay back the debt to the lenders until all debt is reimbursed.

What makes a company a good LBO target?

A good LBO target should respect a few conditions related to the target company: important operating cashflows, a mature market, A company whose development cycle is over.

Important operating cashflows

First & foremost, without great cashflows, the holding will never be able to reimburse the debt taken with the dividend if they are insufficient. For that matter, the company targeted for the LBO should have both regular & important cashflows.

A mature market

When looking at the bigger picture, the company willing to acquire a target with a LBO must make sure that the market in which the potential target evolves is stabilized. Because LBO means major financial risk due to the amount of debt involved, a company cannot also add operational risk.

A company whose development cycle is over

Once again, the target company will ensure the reimbursement of a high debt. This is why all capital expenditures (CAPEX) and major investments such as machines, fleets of vehicles should have been already done.

Useful resources

Vernimmen’s book chapters on LBOs

Youtube video on a LBO Case Study

Related posts on the SimTrade blog

   ▶ Frédéric ADAM Senior banker (coverage)

   ▶ Marie POFF Book review: Barbarians at the gate

   ▶ Akshit GUPTA Analysis of Barbarians at the Gate movie

About the author

The article was written in October 2022 by Louis DETALLE (ESSEC Business School, Grande Ecole Program – Master in Management, 2020-2023).
My experience as an intern of the Wealth Management Department in Hwabao Securities

My experience as an intern of the Wealth Management Department in Hwabao Securities

Wenxuan HU

In this article, Wenxuan HU (ESSEC Business School, Global BBA, 2021-2023) shares her internship experience as an intern in the Wealth Management Department in Hwabao Securities in China.

The Company

Hwabao Securities is a securities company of China Baowu Steel Group, one of the world’s top 500 companies. With the strong support of shareholders, Hwabao Securities adheres to the business purpose of “creating value for customers, opportunities for employees, returns for shareholders and benefits for society” and continues to provide professional, high-quality and personalized comprehensive financial services for investors.

Logo of Hwabao Securities
Logo Hwabao Securities
Source: Hwabao Securities.

Wealth Management is an important business unit of Hwabao Securities. From 2019 to 2021, approximately 80% of Hwabao Securities’ revenue is derived from wealth management business and securities proprietary business.

Headquarters of Hwabao Securities
Headquarters Hwabao Securities
Source: Hwabao Securities.

My Internship

My missions

I worked as an intern in the Wealth Management Department of Hwabao Securities. I was mainly responsible for supporting the department staff in business analysis and compliance management.

I coordinated and analyzed the company’s 2021 interim brokerage business operation. In practice, I used the Vlookup function and pivot table, etc. to count the market share of the sales department, business revenue, commission breakdown, etc., and created data visualization charts to report to the company president and other managers in the interim meeting. In addition, I calculated the performance of the marketing staff. Based on their performance I adjusted their rank.

Moreover, I was responsible for investor eligibility management (a review system that requires institutions to Know Your Customer( KYC) and identify the customer’s risk tolerance) and branch compliance training and participated in developing compliance test questions for branch heads. In addition, I created a PowerPoint presentation for the training of new regulations of positive repo risk control and compliance management work report to assist the compliance officer in personnel training. I also assisted the compliance officer in completing the company’s risk compliance management work, preparing and integrating multi-departmental internal control compliance checklists, and formulating branch compliance cross-check work plans. I wrote an article about typical case of compliance to improve the construction work of the company’s compliance system. The article was appreciated by the department manager and the staff of the Shanghai Stock Exchange (SSE).

Required skills and knowledge

The Wealth Management Department is an important department of a financial institution, directly managing all branches and sales staff, and an important line of defense to ensure business compliance. Working in the Wealth Management Department requires less computer skills and mathematical abilities but requires financial knowledge and legal background. Interns are required to keep an eye on changes in market regulations to assess the risk of financial transactions between the company and its clients. Interns also need to have strong communication skills and be willing to give advice to colleagues in different departments. In addition, departmental staff should also have a high level of ethics and self-discipline and adhere to the legal bottom line.

What I have learnt

My internship at Hwabao Securities gave me a good understanding of the composition of the entire financial institution and the operation of the financial market. This experience allowed me to master many financial terms and trading processes and raised my awareness of compliance and the different types of risks related to investments. The knowledge I learned in class was also applied during the internship, such as money and credit, macroeconomics, credit management, bank management, risk management, compliance management, and law.

While writing the article about the revision of SSE’s investor eligibility management regulations, I also found areas where compliance management could be improved. My article was called “Dispute over account opening for the visually impaired – enhancing investor satisfaction with personalized services”. In the article, the investor’s application for online account opening at the company was rejected due to the investor’s visual impairment and the company’s lack of corresponding hardware facilities. In order to effectively protect the rights and interests of vulnerable groups, the company developed a personalized off-site account opening business process applicable to the visually impaired investor. The company took several measures to take care of the physical conditions of special groups while achieving compliance. For example, the company let the investor open the account offline with professional staff, rather than online. To ensure compliance, the company informed the investor of the investment risks in detail and made a recording.

The article was adopted and commended by SSE as China’s management methods for special group investors are not yet perfect. For special groups, under the condition of meeting the requirements of regulatory laws and regulations, providing better and more humane services in a targeted manner can better protect the interests of investors. Actively fulfilling social responsibility can reflect the social responsibility of enterprises.

Three key financial concepts

Here are three useful financial concepts I learned in Wealth Management Department.

Anti-money-laundering

Money laundering is the process by which monetary gains are cleansed from their illegal origins. The money laundering process has three stages and often incorporates an important international dimension: placement, layering, and integration. Financial institutions are often used, wittingly or unwittingly, by criminals in this cleansing process.

For securities firms, there are usually a variety of measures in place to fight money laundering:

  • Establish various anti-money laundering systems.
  • Establish internal working mechanism, staff with professional personnel and improve operation process.
  • Improve business systems to meet the needs of AML work and ensure accurate and efficient information collection.
  • Identify customers and reasonably classify and adjust customer risk levels. Strengthen identification and supervision for high-risk customers or accounts.
  • Manage customer information, including identity information and transaction records.
  • Establish abnormal transaction detection indicators and models to identify large or suspicious transactions.
  • Conduct anti-money laundering assessments to provide system-wide risk prevention capabilities.
  • Organize anti-money laundering training and strengthen training for personnel in key positions to effectively communicate the latest regulatory requirements.

The Eligibility Management of Investors

The Eligibility Management of Investors is an obligation that sell-side institutions should fulfill for investors. (A sell-side institution is a party that sells its own products or services. Unlike the physical industry, sell-side institution in the financial industry sell virtual products, such as industry research reports, liquidity services, financing services, etc.) The investor eligibility management system was established by the China Securities Regulatory Commission (CSRC) and the China Financial Futures Exchange (CFFEX), taking into account the characteristics of the stock index futures market. The system requires financial institutions to understand their customers, objectively and comprehensively measure their risk appetite and risk-taking ability, and adhere to the principle of “providing the right products to the right investors”. The eligibility obligation was first introduced in the U.S. to regulate misconduct by securities firms. In recent years, the content of the appropriateness obligation has been gradually enriched and improved, and has played an increasingly important role in the trials of Chinese courts at all levels.

The eligibility management of investors has become a direct legal basis for investors to seek remedies in financial disputes. The purpose of investor suitability management is to ensure that customers can make investment decisions and bear the resulting benefits and risks on the basis of a full understanding of the risks of the relevant financial products. In essence, the investor eligibility management system is the investor protection system.

Repurchase Agreement and Reverse Repurchase Agreement

In my internship, I was responsible for compliance training for staff. I produced PowerPoints on the new regulations for Repurchase Agreement risk control.
Repurchase Agreement (Repo) is a transaction in which a party pledges a certain size of bond to raise funds and promises to repurchase the pledged bond at a later date. It is also one of the open market instruments frequently used by The People’s Bank Of China (PBC), which can achieve the effect of repatriating funds from the market by using positive repo operations. Compared with PBC bills, Repurchase Agreement will reduce operating costs, while locking in funds more effectively and reducing liquidity.

Reverse Repurchase Agreement is a transaction in which the PBC purchases marketable securities from a primary dealer and agrees to sell the marketable securities to the primary dealer on a specific date in the future. Reverse Repurchase Agreement is an operation in which the PBC puts liquidity into the market, and the expiration of Reverse Repurchase Agreement is an operation in which the PBC takes back liquidity from the market, called Repurchase Agreement. Simply put, a Reverse Repurchase Agreement is a transaction in which the investor actively lends funds and obtains a bond pledge is called a Reverse Repurchase Agreement transaction, at which time the investor is the financier who accepts the bond pledge and lends the funds.

Related posts on the SimTrade blog

   ▶ All posts about Professional experiences

   ▶ Wenxuan HU My internship experience as industry research assistant in Industrial Securities

   ▶ Alexandre VERLET Classic brain teasers from real-life interviews

Useful resources

Hwabao Securities

Shanghai Stock Exchange

The People’s Bank Of China (PBC)

China Securities Regulatory Commission (CSRC)

China Financial Futures Exchange (CFFEX)

About the author

The article was written in October 2022 by Wenxuan HU (ESSEC Business School, Global BBA, 2021-2023).
My internship experience as an industry research assistant in Industrial Securities

My internship experience as an industry research assistant in Industrial Securities

Wenxuan HU

In this article, Wenxuan HU (ESSEC Business School, Global BBA, 2021-2023) shares her internship experience as an industry research assistant in Industrial Securities which is a securities company in China.

The Company

Industrial Securities is a integrated, innovative, conglomerate and international Chinese securities company approved by the China Securities Regulatory Commission. In May 2022, Industrial Securities was listed in the Forbes 2022 Global 2000 list of companies. As of the end of June 2022, the Group had total assets of 238.2 billion RMB and over 10,000 employees at home and abroad. The company has developed into a securities and financial holding group covering securities, funds, futures, asset management, equity investment, alternative investment, industrial finance, offshore business, regional equity market and other professional fields. The company’s core businesses rank among the top in the industry.

Logo of Industrial Securities
Logo Industrial Securities
Source: Industrial Securities.

Industrial Securities adheres to the “industry-oriented” driving force, creates a unique financial ecological alliance, forming a complete ecological chain that runs through the life cycle of enterprises and industries.

Headquarters of Industrial Securities
Headquarters Industrial Securities
Source: Industrial Securities.

My Internship

My missions

During my internship, I work in the Home Appliance Group, which belongs to Industrial Securities. Home Appliance Group is composed of research analyst firm focusing in the home appliance industry.

I was mainly responsible for writing company reports and medium-term strategy reports about firms in the home appliance industry. I was also exposed to how to value companies with Excel and various databases.

I used Wind, Euromonitor and other databases, combined with expert interviews, to analyze the development dynamics of companies like Bear which produces small appliances like blenders, kettles, air fryer, etc. I wrote reports that compared the company with its peers from the perspective of products, channels and marketing, and I found out the competitive advantages of the company. I created over 20 charts in the report to demonstrate its high cost-performance ratio, multiple segmentation categories, and mature online channels. I also tracked the interim reports of leading companies in mature foreign markets, such as Electrolux, in terms of revenue and profit by region, to compare and analyze with major domestic home appliance brands.

I also studied the characteristics of the long-tail small home appliance market where it is located. Long-tail small home appliances refer to home appliances with small demand and sales scale (contrary to large home appliances like dish washers and laundry machines).

In addition, I independently collected information to analyze the market size, financial indicators, and the company’s product channels of XGIMI, a leading company in the Chinese projector industry. I assisted the analyst to create a 55-page roadshow PowerPoint.

In the process of writing the report, I not only honed my analytical and presentation skills and learned to be graphic in the report, but also learned about the market situation of China’s home appliance industry. For example, I found that the two waves of the Covid pandemic in 2020 and 2022 showed different dynamics in terms of impact on the growth of demand for home appliances in China. The first wave of the pandemic increased the home cooking scenario; young consumers purchased basic, just-needed small appliances. The first wave of the pandemic led to an outbreak of live e-commerce, with online sales becoming the main channel for home appliance consumption, which drove rapid growth in demand for small appliances (like blenders and nutri-pots). The second wave of the pandemic has hampered logistics in some areas, and after 2020, the category of basic small home appliances was gradually saturated, and the demand was not fully released. The pandemic pushed consumers to form healthy living concepts and home cooking habits, demand shifted from basic appliances to advanced appliances. This pushed the industry product structure. So, I really felt the impact of the pandemic (a Black Swan) on the market in practice. For investors and companies, any major event means both challenges and opportunities.

Required skills and knowledge

When starting out, interns usually need to learn to write meeting minutes quickly and use Excel to do some simple calculations and data summaries. This is more of a test of the student’s information gathering skills and basic computer skills.

As we become familiar with the work, we need to apply our financial knowledge, understand industry dynamics, develop market insight and learn to express our opinions clearly. This includes being able to read company financial reports, fully analyze company operations, and make predictions about the future.

What I have learnt

During my internship I worked with valuation models. Valuation modeling has always been an important section in company research or industry research reports. For investors, financial projections provide a visual representation of the underlying company’s operations and future state of development. Also, students looking for jobs in investment banks, equity research analyst firms and even consulting firms, need solid modeling skills.
The steps of valuation modeling financial projections are as follows:

  • Forecast operating income and split revenue (different products and business, domestic vs foreign, etc.). Then forecast costs and expenses to complete the income statement forecast.
  • Forecast the balance sheet and complete the forecast for all accounts except for the reserved matching items (money funds and financing gap).
  • Prepare the cash flow statement, and calculate the monetary funds and financing gap on this basis.
  • Fill in the vacant monetary funds and financing gap in the balance sheet, and match the balance sheet.

In fact, the complete financial modeling requires a lot of financial accounting knowledge and requires to be careful and conscientious, otherwise, the data can easily be wrong. On specific financial items, analysts need to mobilize financial knowledge to fill in the numbers. For example, depreciation and amortization are calculated with the fixed assets and intangible assets in the balance sheet forecast. Then we can go back to the income statement to fill in the two vacant cells. In the internship, I found that financial modeling is closely related to the financial management and financial statement courses we studied in university, so we still need to firmly grasp the basics of finance before seeking employment.

Key financial concepts

The discounted cash flow (DCF) model is a standard valuation method, which aims to calculate the value of a company based on the projected future cash flows of the company discounted to the present at the discount rate (weighted-average cost of capital or WACC).

Basic Formulas

Entreprise value formula

Where EV means the enterprise value, FCF free cash flows, WACC the weighted-average cost of capital, and TV the terminal value.

Free Cash Flow

Free cash flow

We can predict future turnover, expenses, tax rates, etc. by extrapolating the past or imagining the future of the company). Although this part of the formula is relatively complex, usually in practice the analysts will use the Excel formula or Visual Basic for Applications (VBA) to collate the various subjects, greatly simplifying the steps of financial modeling.

WACC

wacc formula

Where D represents the market value of the company’s debt, E the market value of equity capital, and t the income tax rate.
The Cost of equity can be calculated by CAPM model:

cost equity formula

Where:

Risk free rate is the rate of return that can be obtained by investing money in an investment object without any risk.
β, also known as the beta coefficient, is a risk index that measures the price volatility of an individual stock or stock fund relative to the overall stock market.
Market risk premium, also known as equity risk premium or market risk return, refers to the difference between the return on a market portfolio and the risk-free rate of return. It measures the rate at which investors are paid for taking risk.
The Risk free rate can be the yield of the country’s national debt and β can be queried through the Wind database, such as the last three years of β.
Market risk premium is sometimes a forecast value in practice.
Cost of debt is the after-tax cost of debt. It is necessary to multiply the pre-tax cost by (1-t).

Terminal Value Calculation

To calculate the terminal value, we can use the Gordon Growth method to estimate the value based on its growth rate into perpetuity.

The Gordon Model, also known as the constant-growth model, is a special case of the dividend discount model, which reveals the relationship between the stock price, the expected base period dividend, the discount rate and the fixed growth rate of the dividend. The model has three assumptions:

1. The dividend payment is permanent in time;
2. The dividend growth rate is a constant;
3. The discount rate in the model is greater than the dividend growth rate.

The terminal value is extrapolated from the Gordon model:

cost equity formula

Where g is perpetual growth rate which means that the company has perpetual growth rate and return on invested capital. The perpetual growth model assumes stable and sustainable growth in the long term. In practice, g is usually a conservative figure.

Related posts on the SimTrade blog

   ▶ All posts about professional experiences

   ▶ Wenxuan HU My experience as an intern of the Wealth Management Department in Hwabao Securities

   ▶ Alexandre VERLET Classic brain teasers from real-life interviews

Useful resources

Industrial Securities

Wind Database

China Securities Regulatory Commission

About the author

The article was written in October 2022 by Wenxuan HU (ESSEC Business School, Global BBA, 2021-2023).
Time Series Forecasting: Applications and Artificial Neural Networks

Time Series Forecasting: Applications and Artificial Neural Networks

Micha FISHER

In this article, Micha FISHER (University of Mannheim, MSc. Management, 2021-2023) discusses on the applications of time series forecasting and the use of artificial neural networks for this purpose.

This article will offer a short introduction to the different applications of time-series forecasting and forecasting in general, will then describe the theoretical aspects of simple artificial neural networks and finish with a practical example on how to implement a forecast based on these networks.

Overview

The American economist and diplomat John Kenneth Galbraith once said: “The function of economic forecasting is to make astrology look respectable”. Certainly, the failure of mainstream economics to predict several financial crises is testimony to this quote.

However, on a smaller scale, forecast can be very useful in different applications and this article describes several use cases for the forecasting of time series data and a special method to perform such analyses.

Different Applications of Time Series Forecasting

Different methods of forecasting are used in various settings. Central banks and economic research institutes use complex forecasting methods with a vast amount of input factors to forecast GDP growth and other macroeconomic figures. Technical analysts forecast the evolution of asset prices based on historical patterns to make trading gains. Businesses forecast the demand for their products by including seasonal trends (e.g., utility providers) and economic developments.

This article will deal with the latter two applications of forecasting that is focused on the analysis of historical patterns and seasonality. Using different input factors to come up with a prediction, like for example a multivariate regression analysis does, can be a successful way of making prediction. However, it also inherently includes the problem of determining those input factors as well in the first place.

The practical methods described in this article circumvent this problem by exclusively using historical time series data (e.g., past sales per month, historical electricity demand per hour of the day, etc.). This makes the use of those methods easy and both methods can be used to predict helpful input parameters of DCF models for example.

Artificial neural networks

Artificial Intelligence (AI) is a frequently used buzzword in the advertising of products and services. However, the concept of artificial intelligence is going back to the 1940s, when mathematicians McCulloch and Pitts first presented a mathematical model that was based on the neural activity of the human brain.

Before delving into the practical aspects of an exemplary simple artificial neural network, it is important to understand the terminology. These networks are one – although not the only one – of the key aspects of “Machine Learning”. Machine Learning itself is in turn a subtopic of Artificial Intelligence, which itself employs different tools besides Machine Learning.

Figure 1. Neural network.
Neural network
Source: internet.

To give a simple example of an artificial neural network we will focus on a so-called feedforward neural network. Those networks deliver and transform information from the left side to the right side of the schematic picture below without using any loops. This process is called Forward Propagation. Historic time series data is simply put into the first layer of neurons. The actual transformation of the data is done by the individual neurons of the network. Some neurons simply put different weights on the input parameter. Neurons of the hidden layers then use several non-linear functions to manipulate the data given to them by the initial layer. Eventually the manipulated data is consolidated in the output layer.

This sounds all very random and indeed it is. At the beginning, a neural network is totally unaware of its actual best solution and the first computations are done via random weights and functions. But after a first result is compiled, the algorithm compares the result with the actual true value. Of course, this is not possible for values that lye in the future. Therefore, the algorithm divides the historic time series into a section used for training (data that is put into the network) and into a section for testing (data that can be compared to the transformed training data). The deviation between compiled value and true value is then minimized via the process of so-called backpropagation. Weights and functions are changed iteratively until an optimal solution is reached and the network it sufficiently trained. This optimal solution then servers to compute the “real” future values.

This description is a very theoretical presentation of such an artificial neural network and the question arises, how to handle such complex algorithms. Therefore, the last part of this article focuses on the implementation of such a forecasting tool. One very useful tool for statistical forecasting via artificial neural networks is the programming language R and the well-known development environment RStudio. RStudio enables the user to directly download user-created packages, to import historical data from Excel sheets and to export graphical presentations of forecasts.

A very easy first approach is the nnetar function of R. This function can be simply used to analyze existing time series data and it will automatically define an artificial neural network (number of layers, neurons etc.) and train it. Eventually it also allows to use the trained model to forecast future data points.

The chart below is a result of this function used on simulated sales data between 2015 and 2021 to forecast the sales of 2022. In this case the nnetar function used one layer of hidden neurons and correctly recognized a 12-month seasonality in the data.

Figure 2. Simulated sales data.
Simulated sales data
Source: internet.

Why should I be interested in this post?

Artificial neural networks are a powerful tool to forecast time-series data. By using development environments like RStudio, even users without a sophisticated background in data science can make apply those networks to forecast data they might need for other purposes like DCF models, logistical planning, or internal financial modelling.

Useful resources

RStudio Official Website

Rob Hyndman and George Athanasopoulos Forecasting: Principles and Practice

Related posts on the SimTrade blog

   ▶ All posts about financial techniques

   ▶ Jayati WALIA Logistic regression

   ▶ Daksh GARG Use of AI in investment banking

About the author

The article was written in October 2022 by Micha FISHER (University of Mannheim, MSc. Management, 2021-2023).
My job in the Investors Relations department at SAP

My job in the Investors Relations department at SAP

Micha FISHER

In this article, Micha FISHER (University of Mannheim, MSc. Management, 2021-2023) shares his experience as an employee in the Investors Relations department at SAP, Europe’s largest software company.

SAP

SAP is a curious case within the DAX 40 index. Unlike many of the well-known German enterprises, it is not a company built around the automotive sector, machinery, or chemicals. Instead, SAP is one of the very few European software companies, that can match the dominant players from the USA.

SAP
Logo SAP
Source: SAP.

However, SAP is not known for its consumer products, and its business is purely focused on the business-to-business (B2B) sector. As one of the leading providers of Enterprise Resource Planning (ERP) systems, SAP provides other companies with the opportunity to transform themselves into intelligent enterprises with integrated processes. Applications cover all possible business processes from supply-chain management to finance through supporting functions like human resources.

In the 2020s, SAP’s current main challenge is to transform its business and its large and international client base from mainly locally managed systems (on premise) to remotely managed systems (cloud services). This presents a great opportunity and comes with many benefits not only for SAP’s customers but also for SAP shareholders, as cloud contracts provide the business with stable and more recurring revenues.
My Work Experience

As a multinational enterprise, SAP offers various jobs in areas like development, consulting, or sales. Due to my proclivity for Finance and Communication, I choose to work for SAP’s Investor Relations department. This department works closely with the CFO and CEO of the company to facilitate an ongoing dialogue with the investor community, to prepare the publication of quarterly results and to manage the annual general meeting of shareholders.

While some colleagues deal with matters of retail shareholders or with matters of ESG investors specifically, I was mostly supporting the institutional side of the team. This means listening to the sell-side analysts of the large investments firms that are covering the company (UBS, GS, JPM, etc.), preparing meetings with those analysts or with portfolio managers and in general keeping an eye on the current sentiment of the market.

Knowledge and skills needed

A good Investor Relations Officer should have a diverse and broad background. Of course, financial knowledge and the skills to analyze financial statements is key, as those topics are part of the daily discussions with external analysts as well as with internal stakeholders.

However, a good general understanding of the industry and of the product landscape is necessary as well. And finally, sufficient communication skills are a must: it is not enough to advertise the company to future potential shareholders, it is also critical to listen to the concerns of existing shareholders and to relay this information back into the board room of the company.

What I learned

The market is always right. This is a very confrontative statement and I suppose not everyone would agree with this initially. However, in my experience, an honest and transparent approach to financial communication is the most successful one in the long term. Investor Relations should not sugarcoat its messages to the market. At the end, the value of the company is fundamentally decided by its potential to generate cash flows (and especially cash flows for shareholders with dividends). Changing the messaging can only delay a change of the stock price. One of my colleagues with a lot of experience loves to quote President Abraham Lincoln on this matter (although nobody knows if he really said that): “You can fool some of the people all of the time, and all of the people some of the time, but you cannot fool all of the people all of the time.”.

Financial concepts

To work in Investor Relations, you should be aware of several financial concepts: Firm valuation and modelling are at the heart of the job. General knowledge about M&A activities and divestitures can also be very helpful. But the most important concept is to understand the different players on the equity market:

Sell side

The sell side represents all the third-party analysts from investment banks or independent research firms that do not actually trade the stock of the company but sell their reports and insights to those who do. These analysts have a very deep understanding of the industry and the business model and there are excellent at modelling firm valuations.

Buy side

The buy side consists of large private funds, insurance companies and sovereign state funds. These are the actual shareholders of the company and often the portfolio managers of these companies are generalists with various industries in their portfolios. They are a diverse group of firms and while some of them are very passive investors, others are actively trying to influence the decision processes within the company.

Proxy advisors

Proxy advisors provide advisory services to institutional investors. They advise the buy side investors on how to vote during the annual general meeting of a corporation. As the market for proxy advisory is heavily concentrated, it is of utmost importance for Investor Relations to keep an ongoing dialogue with these firms. Well-known proxy advisors are “Glass, Lewis & Co” and “Institutional Shareholder Services (ISS)”.

Why should I be interested in this post?

Investor Relations is a developing function in public companies and the discipline must be better studied in the academic field. It is a key function within every publicly traded company to minimize the information asymmetries between investors and management and thus in my opinion a very interesting area to work in.

Related posts on the SimTrade blog

   ▶ All posts about Professional experiences

   ▶ Anna BARBERO Career in finance

   ▶ Alexandre VERLET Classic brain teasers from real-life interviews

Useful resources

SAP

SAP Investor Relations

National Investor Relations Institute (US-focused association)

About the author

The article was written in October 2022 by Micha FISHER (University of Mannheim, MSc. Management, 2021-2023).
Simple interest rate and compound interest rate

Simple interest rate and compound interest rate

 Sébastien PIAT

In this article, Sébastien PIAT (ESSEC Business School, Grande Ecole Program – Master in Management, 2021-2024) explains the difference between simple interest rate and compound interest rate.

Introduction

When dealing with interest rates, it can be useful to be able to switch from a yearly rate to a period rate that is used to compute interests on a period for an investment or a loan. But you should be aware that the computation is different when working with simple interests and compounded interests.

Below is the method to switch back and forth between a period rate and a yearly rate.

With simple interests

If you think of an investment that generates yearly incomes at a rate of 6%, you might want to know what your monthly return is.

As we deal with simple interests, the monthly rate of this investment will be 0.5% (=6/12).

With simple interests, the interests on a given period are computed with the initial capital:

Interests computed a simple rate

Assuming that the interests are computed over p periods during the year, the capital of the investment at the end of the year is equal to

Interests computed a simple rate

The equivalent yearly rate of return Ry gives the same capital value at the end of the year

Interests computed a simple rate

By equating the two formulas for the capital at the end of the year, we obtain a relation between the period rate Rp and the equivalent yearly rate Ry:

Formula to switch from a period rate to the equivalent yearly rate with simple interests

 Formula to switch from a yearly rate to the corresponding period rate with simple interests

With compound interests

Things get a little trickier when dealing with compound interests as interests get reinvested period after period.

Compounded interests can be considered by the following equation:

Interests computed a compound rate

Where Rp is the period rate of the investment and Cn is your capital at the end of the nth period.

Assuming that the interests are computed over p periods during the year, the capital of the investment at the end of the year is equal to

Interests computed a compound rate

The equivalent yearly rate of return Ry gives the same capital value at the end of the year

Interests computed a compound rate

By equating the two formulas for the capital at the end of the year, we obtain a relation between the period rate Rp and the equivalent yearly rate Ry:

Formula to switch from a period rate to the equivalent yearly rate with compound interests

 Formula to switch from a yearly rate to the corresponding period rate with compound interests

Excel file to compute interests of an investment

You can download below the Excel file for the computation of interests with simple and compound interests and the equivalent yearly interest rate.

Download the Excel file to compute interests with simple and compound interest rates

You can download below the Excel file to switch from a period interest rate to a yearly interest rate and vice versa.

Download the Excel file to compute interests with simple and compound interest rates

Why should I be interested in this post?

This post should help you switch between a period rate and the equivalent yearly rate of an investment.

This is particularly useful when we deal with cash flows that do not appear with a yearly frequency but with a monthly or quarterly frequency. With non-yearly cash flows, it is necessary to consider a period rate to compute the present value (PV), net present value (NPV) and internal rate of return (IRR).

Useful resources

longin.fr website Cours Gestion financière (in French).

Related posts on the SimTrade blog

   ▶ Raphaël ROERO DE CORTANZE The Internal Rate of Return

   ▶ Léopoldine FOUQUES The IRR, XIRR and MIRR functions in Excel

   ▶ Jérémy PAULEN The IRR function in Excel

   ▶ William LONGIN How to compute the present value of an asset?

   ▶ Maite CARNICERO MARTINEZ How to compute the net present value of an investment in Excel

About the author

The article was written in October 2022 by Sébastien PIAT (ESSEC Business School, Grande Ecole Program – Master in Management, 2021-2024) .

Why Berlin could be the new Silicon Valley for startups?

Why Berlin could be the new Silicon Valley for startups?

Jessica BAOUNON

In this article, Jessica BAOUNON (ESSEC Business School, Executive Master in Direction Financière et Contrôle de Gestion, 2020-2022) explores the latest trends which is transforming the the startups world and the venture capital in Berlin, the capital of Germany.

These last decades, with the rise of internet and new technologies, startups rapidly boomed. Some of them became very famous. You may be familiar with AirBnb, Instagram or Uber; they all started from scratch in a grungy basement before flourishing at a global scale. BytheDance, with 2 billion users in 150 countries recorded 58 billion of dollars in revenues for 2021, an example of success story that creates a high interest of curiosity for tech-investors everywhere in the world. However, only a few cities are among the most attractive for entrepreneurs. Berlin is on the path to become the most popular city for startups. But first of all, let’s go back to the basics by defining what a startup is.

What is a startup ?

Startups are companies that are in the first stages of its business operations. They are often founded by young people. They work in a collaborative way to scale up quickly their innovative products or services. They are looking for disruption opportunities to change the world and industries. They want to bring new ideas. As a result, the startup ecosystem is known to be a very fast-paced environment but also valuable for investors that expect a high return on their investment. On the other side, corporate operate with a different approach. They are most of the time, well-established. They work with a pyramidal organization and focus on the productivity rather than taking risks to grow fast.

Startups costs are usually very high with a low revenue at the start. They need funds to finance innovation and their entry in the markets. This is the reason why they turn to venture capitalist, but it can also come from various sources. The venture capitalist is a private investor. He provides capital in exchange for equity stake when they don’t have access to equity markets. Startup can then graduate by going public with an initial public offering (IPO), making them purchasable on the stock exchange.

How is the Berlin Startup Ecosystem?

Berlin counts 4 500 startups among well-known organizations such as SoundCloud, Tier Mobility or Babbel and employ over 80 000 people. Software as a Service (Saas), FinTechs and healthcare startups represent most of the business models. For the next coming years, the forecast expects a shift towards the green industry with the new climate neutrality challenges.

Figure 1. Number of Berlin startups by “industries”.
Number of Berlin startups by industries
Source: Dealroom.co

With over 10 billion euros invested in total in startups in 2021, the city is also among the top 10 locations for startup investment worldwide (1). Berlin is leading the investments in Germany “Three out of five euros invested in start-ups in Germany (60%) were invested in Berlin startups in 2021” (2) and Berlin records the most financing rounds” (3) in 2021 and 2022. The funding is diverse coming from public, private and institutional actors. Startups are the engine of Berlin’s economy. The new government state has detailed the plan for the next four years. They want to pursue the development of Berlin’s startup ecosystem into one of the first technology location.

Figure 2. Berlin: leader for startups in Germany.
Berlin startups
Source: Ernst & Young Startup Barometer (2022)

Why Berlin is attractive for startups

Berlin offers a lot of favorable conditions. The startup ecosystem benefits from an important aspect of the capital: the diversity. The city offers a wide network of high-quality professional talents coming from all over the world. 44% of entrepreneurs are not German (4). Indeed, Berlin has a strong historical with several countries such as France, Great Britain, The United States. The geographical location, almost in the middle of the European Union, facilitates the connections between the north, south, east, and west side but also for people outside of the region.

Indeed, the diverse sources of financing from private to public actors enable a positive investment climate for entrepreneurs. They are business incubators, universities, technology centers, regular meetups, and the greatest number of coworking spaces in Germany to ensure an outstanding infrastructure. Most of the entrepreneurs don’t want to follow the classic corporate path. Berlin as a creative and dynamic city offers the opportunity to express their ideas and freedom. The city is constantly in transformation in all areas: technology, art, music, architecture which attract people who aspire to change and innovation. Although rental prices rise in Berlin, it keeps one of the most affordable in term of living cost. Berlin’s startups and the venture capital scene promises to grow at a high dynamic for the next coming years.

Why should I be interested in this post

If you are considering working abroad and interested to work for a startup or a capital venture, this article is for you. This article presents the Berlin startup scene and explains why Berlin is considered as one of the most attractive cities for entrepreneurs and venture capital.

Related posts on the SimTrade blog

   ▶ Louis DETALLE A quick presentation of the Private Equity field…

Ressources utiles

Startup Map Berlin

Startup Capital Berlin

Startup Barometer Germany E&Y

Startup Ecosystem

About the author

The article was written in October 2022 by Jessica BAOUNON (ESSEC Business School, Executive Master in Direction Financière et Contrôle de Gestion 2020-2022).

Enjeux de la pratique de la pleine conscience et de l’intelligence émotionnelle dans la fonction de contrôle de gestion

Enjeux de la pratique de la pleine conscience et de l’intelligence émotionnelle dans la fonction de contrôle de gestion

Jessica BAOUNON

Dans cet article, Jessica BAOUNON (ESSEC Business School, Executive Master in Direction Financière et Contrôle de Gestion, 2020-2022) explique les enjeux de la pratique de la pleine conscience et de l’intelligence émotionnelle dans la fonction contrôle de gestion. Le monde de l’entreprise s’est considérablement transformé avec la crise du COVID-19. L’appel à l’intelligence émotionnelle n’a jamais été aussi important pour faire face aux situations les plus complexes.

La fonction contrôle de gestion est en pleine évolution. Ses missions ne portent plus uniquement sur la production et la communication d’indicateurs financiers. Son rôle consiste désormais à accompagner dirigeants et managers dans l’amélioration de la performance financière, c’est-à-dire à les conseiller sur les décisions d’orientations stratégiques.

La crise Covid-19 a projeté le contrôle de gestion davantage vers un rôle de « coach. En effet, en étant proche de ceux qui ont dû garantir la continuité des activités, le contrôle de gestion a dû se pencher sur l’empathie dans sa relation établie avec dirigeants et managers. On attend de lui une attitude d’écoute, de disponibilité, une capacité à se placer dans le contexte de son interlocuteur pour agir avec efficacité et désamorcer des situations de crise.

En d’autres termes, acquérir des compétences relationnelles et se doter d’un capital émotionnel sont aujourd’hui des qualités recherchées. L’action d’un contrôleur de gestion s’inscrit de plus en plus dans un état d’esprit collaboratif. Il remplit une fonction de business partner.

Or comment imaginer qu’un contrôleur de gestion puisse construire une relation de partenariat pérenne s’il n’est lui-même pas pleinement conscient de l’environnement dans lequel il évolue ? Sa prise de conscience de soi et des autres doit faciliter ses interactions sociales.

A ce titre, s’exercer à une pratique régulière de méditation de pleine conscience peut s’avérer efficace pour travailler son intelligence émotionnelle. En effet, l’exercice de la pleine conscience implique avant tout de ressentir et comprendre les émotions en portant une qualité d’attention sur une expérience vécue. C’est une attitude qui propose d’ouvrir un espace d’observation sans filtre, sans attente, de ses sensations, pensées, émotions d’une action, d’un évènement dans l’acceptation et sans jugement.

Ce processus d’observation permet ainsi de mieux aller vers l’autre en apportant une réponse adaptée et clairvoyante dans des dialogues de gestion. Elle permet notamment de reprendre possession de soi dans des situations de stress ou de gestion de conflit.

Origines et impact de la pratique de la pleine conscience dans la fonction contrôle de gestion

Jon Kabat Zin, professeur de médecine à l’Université du Massachussetts et docteur en biologie, est le père-fondateur de la méditation de pleine conscience. Intitulé Mindfullness-Based Stress Reduction (MBSR), ce programme laïque inspiré du bouddhisme, offre une initiation à la méditation sur une période de huit semaines.

Cette pratique, à l’origine millénaire, s’est progressivement répandue avec succès dans les écoles scientifiques, philosophiques et psychologiques. Elle émerge depuis quelques années dans les entreprises telle que chez EDF, Google ou L’Oréal au travers de formations certifiées.

Google, précurseur, propose à ses collaborateurs depuis 2007 un programme de méditation nommé « Search Inside Yourself ». Chade-Meng Tan, ingénieur chez Google, a réuni une équipe d’experts en technique de pleine conscience et intelligence émotionnelle pour construire cette formation. L’objectif est de développer des compétences d’intelligence émotionnelle pour créer une cohésion sociale favorable à l’épanouissement individuelle et collectif chez Google. Ces cours ont été dispensés auprès de plus de 10 000 personnes et dans plus de 50 pays.

Cette pratique se démocratise et est perçue de moins en moins comme une bizarrerie. Face à un contexte de crises successives, burn out, démotivation des collaborateurs, rééquilibrer les esprits pour évoluer dans un environnement sain devient un enjeu de performance cruciale. Plus que jamais, et en témoigne la récente crise du Covid-19, la responsabilité sociale d’une entreprise est de créer les conditions qui permettront une cohésion sociale durable.

En outre, face à l’ampleur d’imprévisibles changements, la mission du contrôle de gestion consistant à assurer la stabilité des processus de gestion doit s’accompagner d’une réflexion constante sur l’évolution des outils et systèmes d’information. Si les solutions d’automatisation des processus de gestion gagnent du terrain pour répondre à une volonté de rapidité d’exécution, elle ne doit pas pour autant conduire à un mode de pilotage automatique des taches d’un contrôleur de gestion.

Cette approche machinale de la fonction contrôle de gestion doit être signe d’alerte. En effet, le danger de cette posture est de se laisser gouverner, de ne plus observer activement les choses sous un regard nouveau et d’en perdre le sens. Dans un monde où l’humain rivalise de plus en plus avec les machines, développer un état d’esprit créatif et stimuler sa conscience d’esprit est un enjeu essentiel. La pleine conscience, en tant qu’outil, agit comme un accélérateur de créativité. Elle oblige à se libérer d’un mode de fonctionnement mécanique des processus en étant attentif à ce que l’on fait et à ce qui nous entoure pour cheminer vers des nouvelles idées. Avec la montée en puissance des technologies, cette qualité encore absente du langage courant, se retrouvera plus encore demain, dans les exigences de compétences requises en contrôle de gestion.

Innover avec un style de management durable

Dans cette même dynamique de changement, on assiste à une « reconnaissance accrue du rôle des émotions comme action et effet dans les organisations » (1). Celle-ci questionne les modèles de management classiques jugé trop bureaucratique et militaire « dans leur tentative de contrôler, supprimer toute émotion qui interférer la rationalité d’actions souhaitées » (1). L’essoufflement du modèle tayloriste est en train de laisser progressivement place à de nouveaux paradigmes. Cette transformation s’explique par une logique de revalorisation du capital humain subordonnée à celle de l’efficience productive. En outre, la montée en puissance de la Responsabilité Sociale des Entreprises (RSE) a donné lieu à d’importants renversements.

« La recherche de profit n’est pas en soi problématique, ce qui l’est c’est de ne souligner que le profit au détriment de la complexité de réalités humaines » (Bibard Laurent). En témoigne l’affaire Bhopal ou Orange qui ont eu pour effet de révéler une profonde dévalorisation des conditions de travail. Un renversement de rôle qui renvoie également à la question du sens, d’une humanité en prise de conscience sur ce qui ne fonctionne plus, sur la nécessité de l’entreprise à s’ancrer dans un monde durable et servir l’intérêt général.

Pour arriver à cet objectif de durabilité, reconstruire un modèle de management responsable en s’appuyant sur les acquis de la psychologie cognitive et sociale constitue une première solution. Les émotions ont été rejeté pendant très longtemps des visions managériales des entreprises. Or les récentes découvertes en psychologie démontrent que développer des compétences en intelligence émotionnelle permet de développer de réelles qualités relationnelles, de prendre de meilleures décisions et de se montrer bien plus créatif.

Dans un monde incertain rythmé par des crises financières, environnementales et sociales, chaque individu doit être en mesure de pouvoir se défaire de biais cognitifs, en se libérant de ses croyances limitantes pour contribuer à une vision d’un monde juste et responsable. La pratique de la pleine conscience et de l’intelligence émotionnelle contribue à mobiliser une connaissance de soi. Elle permet aux contrôleurs de gestion ainsi qu’à l’ensemble des collaborateurs de questionner la pertinence de leurs actions et décisions sous l’angle de leurs émotions. Cette pratique invite ainsi à nous rappeler ce que nous sommes : des êtres humains.

En quoi ça m’intéresse ?

Dans un monde où l’humain rivalise de plus en plus avec les machines, développer un état d’esprit créatif et stimuler sa conscience d’esprit est essentiel. Cet article présente les bénéfices de la pratique de la pleine conscience et de l’intelligence émotionnelle dans la fonction contrôle de gestion afin d’y apporter d’un éclairage sur ces nouvelles compétences recherchées.

Articles sur le blog SimTrade

   ▶ POUZOL Chloé Mon expérience de contrôleuse de gestion chez Edgar Suites

Ressources utiles

Teneau, Gilles, Empathie et compassion en entreprise, 2014, ISTE Editions.

Tan, Cheng-Made, Search Inside Yourself, 2015, Harper Collins Libri

Kotsou, Ilios – « Intelligence émotionnelle & management », 2016, De Boeck

Cappelletti, Laurent. Le management de la relation client des professions : un nouveau sujet d’investigation pour le contrôle de gestion, 2010, Revue Management et Avenir.

A propos de l’auteure

Cet article a été écrit en octobre 2022 par Jessica BAOUNON (ESSEC Business School, Executive Master in Direction Financière et Contrôle de Gestion 2020-2022).

Extreme Value Theory: the Block-Maxima approach and the Peak-Over-Threshold approach

Extreme Value Theory: the Block-Maxima approach and the Peak-Over-Threshold approach

Shengyu ZHENG

In this article, Shengyu ZHENG (ESSEC Business School, Grande Ecole Program – Master in Management, 2020-2023) presents the extreme value theory (EVT) and two commonly used modelling approaches: block-maxima (BM) and peak-over-threshold (PoT).

Introduction

There are generally two approaches to identify and model the extrema of a random process: the block-maxima approach where the extrema follow a generalized extreme value distribution (BM-GEV), and the peak-over-threshold approach that fits the extrema in a generalized Pareto distribution (POT-GPD):

  • BM-GEV: The BM approach divides the observation period into nonoverlapping, continuous and equal intervals and collects the maximum entries of each interval. (Gumbel, 1958) Maxima from these blocks (intervals) can be fitted into a generalized extreme value (GEV) distribution.
  • POT-GPD: The POT approach selects the observations that exceed a certain high threshold. A generalized Pareto distribution (GPD) is usually used to approximate the observations selected with the POT approach. (Pickands III, 1975)

Figure 1. Illustration of the Block-Maxima approach
BM-GEV
Source: computation by the author.

Figure 2. Illustration of the Peak-Over-Threshold approach

POT-GPD
Source: computation by the author.

BM-GEV

Block-Maxima

Let’s take a step back and have a look again at the Central Limit Theorem (CLT):

 Illustration of the POT approach

The CLT describes that the distribution of sample means approximates a normal distribution as the sample size gets larger. Similarly, the extreme value theory (EVT) studies the behavior of the extrema of samples.

The block maximum is defined as such:

 Illustration of the POT approach

Generalized extreme value distribution (GEV)

 Illustration of the POT approach

The GEV distributions have three subtypes corresponding to different tail feathers [von Misès (1936); Hosking et al. (1985)]:

 Illustration of the POT approach

POT-GPD

The block maxima approach is under reproach for its inefficiency and wastefulness of data usage, and it has been largely superseded in practice by the peak-over-threshold (POT) approach. The POT approach makes use of all data entries above a designated high threshold u. The threshold exceedances could be fitted into a generalized Pareto distribution (GPD):

 Illustration of the POT approach

Illustration of Block Maxima and Peak-Over-Threshold approaches of the Extreme Value Theory with R

We now present an illustration of the two approaches of the extreme value theory (EVT), the block maxima with the generalized extreme value distribution (BM-GEV) approach and the peak-over-threshold with the generalized Pareto distribution (POT-GPD) approach, realized with R with the daily return data of the S&P 500 index from January 01, 1970, to August 31, 2022.

Packages and Libraries

 packages and libraries

Data loading, processing and preliminary inspection

Loading S&P 500 daily closing prices from January 01, 1970, to August 31, 2022 and transforming the daily prices to daily logarithm returns (multiplied by 100). Month and year information are also extracted from later use.

 data loading

Checking the preliminary statistics of the daily logarithm series.

 descriptive stats data

We can get the following basic statistics for the (logarithmic) daily returns of the S&P 500 index over the period from January 01, 1970, to August 31, 2022.

Table 1. Basic statistics of the daily return of the S&P 500 index.
Basic statistics of the daily return of the S&P 500 index
Source: computation by the author.

In terms of daily return, we can observe that the distribution is negatively skewed, which mean the negative tail is longer. The kurtosis is far higher than that of a normal distribution, which means that extreme outcomes are more frequent compared with a normal distribution. the minimum daily return is even more than twice of the maximum daily return, which could be interpreted as more prominent downside risk.

Block maxima – Generalized extreme value distribution (BM-GEV)

We define each month as a block and get the maxima from each block to study the behavior of the block maxima. We can also have a look at the descriptive statistics for the monthly downside extrema variable.

 block maxima

With the commands, we obtain the following basic statistics for the monthly minima variable:

Table 2. Basic statistics of the monthly minimal daily return of the S&P 500 index.
Basic statistics of the monthly minimal daily return of the S&P 500 index
Source: computation by the author.

With the block extrema in hand, we can use the fevd() function from the extReme package to fit a GEV distribution. We can therefore get the following parameter estimations, with standard errors presented within brackets.

GEV

Table 3 gives the parameters estimation results of the generalized extreme value (GEV) for the monthly minimal daily returns of the S&P 500 index. The three parameters of the GEV distribution are the shape parameter, the location parameter and the scale parameter. For the period from January 01, 1970, to August 31, 2022, the estimation is based on 632 observations of monthly minimal daily returns.

Table 3. Parameters estimation results of GEV for the monthly minimal daily return of the S&P 500 index.
Parameters estimation results of GEV for the monthly minimal daily return of the S&P 500 index
Source: computation by the author.

With the “plot” command, we are able to obtain the following diagrams.

  • The top two respectively compare empirical quantiles with model quantiles, and quantiles from model simulation with empirical quantiles. A good fit will yield a straight one-to-one line of points and in this case, the empirical quantiles fall in the 95% confidence bands.
  • The bottom left diagram is a density plot of empirical data and that of the fitted GEV distribution.
  • The bottom right diagram is a return period plot with 95% pointwise normal approximation confidence intervals. The return level plot consists of plotting the theoretical quantiles as a function of the return period with a logarithmic scale for the x-axis. For example, the 50-year return level is the level expected to be exceeded once every 50 years.

gev plots

Peak over threshold – Generalized Pareto distribution (POT-GPD)

With respect to the POT approach, the threshold selection is central, and it involves a delicate trade-off between variance and bias where too high a threshold would reduce the number of exceedances and too low a threshold would incur a bias for poor GPD fitting (Rieder, 2014). The selection process could be elaborated in a separate post and here we use the optimal threshold of 0.010 (0.010*100 in this case since we multiply the logarithm return by 100) for stock index downside extreme movement proposed by Beirlant et al. (2004).

POT

With the following commands, we get to fit the threshold exceedances to a generalized Pareto distribution, and we obtain the following parameter estimation results.

Table 4 gives the parameters estimation results of GPD for the daily return of the S&P 500 index with a threshold of -1%. In addition to the threshold, the two parameters of the GPD distribution are the shape parameter and the scale parameter. For the period from January 01, 1970, to August 31, 2022, the estimation is based on 1,669 observations of daily returns exceedances (12.66% of the total number of daily returns).

Table 4. Parameters estimation results of the generalized Pareto distribution (GPD) for the daily return negative exceedances of the S&P 500 index.
Parameters estimation results of GEV for the monthly minimal daily return of the S&P 500 index
Source: computation by the author.

Download R file to understand the BM-GEV and POT-GPD approaches

You can find below an R file (file with txt format) to understand the BM-GEV and POT-GPD approaches.

Illustration_of_EVT_with_R

Why should I be interested in this post

Financial crises arise alongside disruptive events such as pandemics, wars, or major market failures. The 2007-2008 financial crisis has been a recent and pertinent opportunity for market participants and academia to reflect on the causal factors to the crisis. The hindsight could be conducive to strengthening the market resilience faced with such events in the future and avoiding dire consequences that were previously witnessed. The Gaussian copula, a statistical tool used to manage the risk of the collateralized debt obligations (CDOs) that triggered the flare-up of the crisis, has been under serious reproach for its essential flaw to overlook the occurrence and the magnitude of extreme events. To effectively understand and cope with the extreme events, the extreme value theory (EVT), born in the 19th century, has regained its popularity and importance, especially amid the financial turmoil. Capital requirements for financial institutions, such as the Basel guidelines for banks and the Solvency II Directive for insurers, have their theoretical base in the EVT. It is therefore indispensable to be equipped with knowledge in the EVT for a better understanding of the multifold forms of risk that we are faced with.

Related posts on the SimTrade blog

▶ Shengyu ZHENG Optimal threshold selection for the peak-over-threshold approach of extreme value theory

▶ Gabriel FILJA Application de la théorie des valeurs extrêmes en finance de marchés

▶ Shengyu ZHENG Extreme returns and tail modelling of the S&P 500 index for the US equity market

▶ Nithisha CHALLA The S&P 500 index

Resources

Academic research (articles)

Aboura S. (2009) The extreme downside risk of the S&P 500 stock index. Journal of Financial Transformation, 2009, 26 (26), pp.104-107.

Gnedenko, B. (1943). Sur la distribution limite du terme maximum d’une série aléatoire. Annals of mathematics, 423–453.

Hosking, J. R. M., Wallis, J. R., & Wood, E. F. (1985) “Estimation of the generalized extreme-value distribution by the method of probability-weighted moments” Technometrics, 27(3), 251–261.

Longin F. (1996) The asymptotic distribution of extreme stock market returns Journal of Business, 63, 383-408.

Longin F. (2000) From VaR to stress testing : the extreme value approach Journal of Banking and Finance, 24, 1097-1130.

Longin F. et B. Solnik (2001) Extreme correlation of international equity markets Journal of Finance, 56, 651-678.

Mises, R. v. (1936). La distribution de la plus grande de n valeurs. Rev. math. Union interbalcanique, 1, 141–160.

Pickands III, J. (1975). Statistical Inference Using Extreme Order Statistics. The Annals of Statistics, 3(1), 119– 131.

Academic research (books)

Embrechts P., C. Klüppelberg and T Mikosch (1997) Modelling Extremal Events for Insurance and Finance.

Embrechts P., R. Frey, McNeil A. J. (2022) Quantitative Risk Management, Princeton University Press.

Gumbel, E. J. (1958) Statistics of extremes. New York: Columbia University Press.

Longin F. (2016) Extreme events in finance: a handbook of extreme value theory and its applications Wiley Editions.

Other materials

Extreme Events in Finance

Rieder H. E. (2014) Extreme Value Theory: A primer (slides).

About the author

The article was written in October 2022 by Shengyu ZHENG (ESSEC Business School, Grande Ecole Program – Master in Management, 2020-2023).
Activist Funds

Activist Funds

Akshit Gupta

This article written by Akshit GUPTA (ESSEC Business School, Grande Ecole Program – Master in Management, 2019-2022) introduces activist funds which is a type of fund based on shareholder activism to influence a company’s board and top management decisions.

Introduction

Activist funds use an investment strategy where they buy shares in a publicly listed company with the aim to influence a company’s board and top management decisions. A large shareholding provides the activist fund with high power to influence the decision making of these firms at the management level. The aim of an active fund is to push for decisions or changes that would increase the share price and thus, the value of its portfolio.

Activist funds target companies which are poorly managed or have untapped value which if explored, can lead to significant increase in the stock price. They typically buy the equity shares of these companies which provides them with ownership and the rights to vote during the shareholders’ General Meetings to influence the board and top management decisions. Activist funds propose and help implement changes that favourably impact the stock prices and helps them to generate absolute market returns that are generally higher than the market benchmarks. These changes include changes in business strategy, operational decisions, capital structure, corporate governance and the day-to-day practices of the management.

Activist investors are normally seen operating either a private equity firm or a hedge fund and specialising in specific industries or businesses. High-net worth individuals and family offices are majorly involved in activist investing as they have access to huge investments and expertise.

Benefits of activist funds

Like other types of hedge funds and private equity firms, activist funds aim at providing their clients (investors) with investments managed in an efficient manner to optimize expected returns and risk. They try to generate alpha on the clients’ investment by actively participating in company’s board and top management decisions. So, activist funds are often acknowledged as the alternative funds in the asset management industry.

Concerns associated with activist funds

Although the investments in activist funds are handled by professionals and can generate absolute performance, they also come with some concerns for the investors. Some of the commonly associated concerns with activist fund investments are:

  • Narrow-sighted approach – Activist funds invest in companies with the aim to maximize the shareholder’s wealth. The approach has serious concerns as it doesn’t fully take into account the effects of the decision on the company’s workers and society.
  • Investment horizon – The investment horizon of activist funds is not very well defined as the changes propose d by the funds can either take shape immediately or may run over a couple of years before the effects are seen.

Example of activist fund

GameStop – Shareholder activism

The infamous GameStop stock rally that happened in 2021 drew people’s attention from around the world and it became the talk of the town. During the same time, the company also went through a change in its management. The event sheds light on the importance and impact of shareholder activism in today’s world.

Ryan Cohen is a famous activist investor who declared 10% stock ownership in GameStop through his investment firm, RC Ventures, in September 2020. This named him amongst the company’s biggest individual investor. He saw a huge opportunity for video games in the e-commerce market and wanted GameStop to evolve from a gaming company to a technology company and also change from traditional brick-and-mortar stores to online channels. To implement the changes, he made efforts to privately engage with the firm to review their strategic vision and change the company’s business model via . But the efforts yielded little success, following which he sent an open letter to the company’s Board of Directors (A copy of the letter can be seen below)

Ryan Cohen Letter to the Board of GameStop in November 2020

The letter was taken seriously by the company’s management and Ryan Cohen was appointed on the Board of Directors of the company in January 2021. Later, he was promoted as the Chairman of the Board to reshape the company’s strategic vision to become a technology-driven business rather than merely a gaming company.

Useful resources

Academic resources

Pedersen, L. H., 2015. Efficiently Inefficient: How Smart Money Invests and Market Prices Are Determined. Princeton University Press, Chapter 7, Discretionary Equity Investing.

Business resources

Business Insider Article on GameStop

Frick W. (2016) The Case for Activist Investors Harvard Business Review, 108–109.

Desjardine M., R. Durand (2021) Activist Hedge Funds: Good for Some, Bad for Others? Knowledge@HEC.

CNBC Article

Forbes Article

Related posts on the SimTrade blog

   ▶ Akshit GUPTA Asset management firms

   ▶ Akshit GUPTA Macro funds

   ▶ Akshit GUPTA Hedge funds

   ▶ Youssef LOURAOUI Introduction to hedge funds

About the author

Article written in August 2022 by Akshit GUPTA (ESSEC Business School, Grande Ecole Program – Master in Management, 2019-2022).

Currency overlay

Jayati WALIA

In this article, Jayati WALIA (ESSEC Business School, Grande Ecole Program – Master in Management, 2019-2022) explains currency overlay which is a mechanism to effectively manage currency risk in asset portfolios.

Overview

Currency risk, also known as exchange-rate risk, forex exchange or FX risk, is a kind of market risk that is caused by the fluctuations in currency exchange rates.

Both individual and institutional investors are diversifying their portfolios through assets in international financial markets, but by doing so they also introduce currency risk in their portfolios.

Consider an investor in the US who decides to invest in the French equity market (say in the CAC 40 index). The investor is now exposed to currency risk due to the movements in EURUSD exchange rate. You can download the Excel file below which illustrates the impact of the EURUSD exchange rate on the overall performance of the investor’s portfolio.

Download the Excel file to illustrate the impact of currency risk on portfolio

This exercise demonstrates the importance of currency risk in managing an equity portfolio with assets dominated in foreign currencies. We can observe that over a one-month time-period (July 19 – August 19, 2022), the annual volatility of the American investor’s portfolio with FX risk included is 12.96%. On the other hand, if he hedges the FX risk (using a currency overlay strategy), the annual volatility of his portfolio is reduced to 10.45%. Thus, the net gain (or loss) on the portfolio is significantly reliant on the EURUSD exchange-rate.

Figure 1 below represents the hedged an unhedged returns on the CAC 40 index. The difference between the two returns illustrates the currency risk for an unhedged position of an investor in the US on a foreign equity market (the French equity market represented by the CAC 40 index.

Figure 1 Hedged and unhedged returns for a position on the CAC 40 index.
Hedged an unhedged return Source : computation by the author.

Currency overlay is a strategy that is implemented to manage currency exposures by hedging against foreign exchange risk. Currency overlay is typically used by institutional investors like big corporates, asset managers, pension funds, mutual funds, etc. For such investors exchange-rate risk is indeed a concern. Note that institutional investors often outsource the implementation of currency overlays to specialist financial firms (called “overlay managers”) with strong expertise in foreign exchange risk. The asset allocation and the foreign exchange risk management are then separated and done by two different persons (and entities), e.g., the asset manager and the overlay manager. This organization explains the origin of the world “overlay” as the foreign exchange risk management is a distinct layer in the management of the fund.

Overlay managers make use of derivatives like currency forwards, currency swaps, futures and options. The main idea is to offset the currency exposure embedded in the portfolio assets and providing hedged returns from the international securities. The implementation can include hedging all or a proportion of the currency exposure. Currency overlay strategies can be passive or active depending on portfolio-specific objectives, risk-appetite of investors and currency movement viewpoint.

Types of currency overlay strategies

Active currency overlay

Active currency overlay focuses on not just hedging the currency exposure, but also profiting additionally from exchange-rate movements. Investors keeps a part of their portfolio unhedged and take up speculative positions based on their viewpoint regarding the currency trends.

Passive currency overlay

A passive overlay focuses only on hedging the currency exposure to mitigate exchange-rate risk. Passive overlay is implemented through derivative contracts like currency forwards which are used to lock-in a specific exchange-rate for a fixed time-period, thus providing stability to asset values and protection against exchange-rate fluctuations.

Passive overlay is a simple strategy to implement and generally uses standardized contracts, however, it also eliminates the scope of generating any additional profits for the portfolio through exchange-rate fluctuations.

Implementing currency overlays

Base currency and benchmark

Base currency is generally the currency in which the portfolio is dominated or the investor’s domestic currency. A meaningful benchmark selection is also essential to analyze the performance and assess risk of the overlay. World market indices such as those published by MSCI, FTSE, S&P, etc. can be appropriate choices.

Hedge ratio

Establishing a strategic hedge ratio is a fundamental step in implementing a currency overlay strategy. It is the ratio of targeted exposure to be currency hedged by the overlay against the overall portfolio position. Different hedge ratios can have different impact on the portfolio returns and determining the optimal hedge ratio can depend on various factors such as investor risk-appetite and objectives, portfolio assets, benchmark selection, time horizon for hedging etc.

Cost of overlay

The focus of overlays is to hedge the fluctuations in foreign exchange rates by generating cashflows to offset the foreign exchange rate movements through derivatives like currency forwards, currency swaps, futures and options. The use of these derivatives products generates additional costs that impacts the overall performance of the portfolio strategy. These costs must be compared to the benefits of portfolio volatility reduction coming from the overlay implementation.

This cost is also an essential factor in the selection of the hedge ratio.

Note that passive overlays are generally cheaper than active overlays in terms of implementation costs.

Related posts on the SimTrade blog

   ▶ Jayati WALIA Credit risk

   ▶ Jayati WALIA Fixed income products

   ▶ Jayati WALIA Plain Vanilla Options

   ▶ Akshit GUPTA Currency swaps

Useful resources

Academic articles

Black, F. (1989) Optimising Currency Risk and Reward in International Equity Portfolios. Financial Analysts Journal, 45, 16-22.

Business material

Pensions and Lifetime Savings Association Currency overlay: why and how? video.

About the author

The article was written in September 2022 by Jayati WALIA (ESSEC Business School, Grande Ecole Program – Master in Management, 2019-2022).

Reverse Convertibles

Reverse Convertibles

Shengyu ZHENG

In this article, Shengyu ZHENG (ESSEC Business School, Grande Ecole Program – Master in Management, 2020-2023) explains reverse convertibles, which are a structured product with a fixed-rate coupon and downside risk.

Introduction

The financial market has been ever evolving, witnessing the birth and flourish of novel financial instruments to cater to the diverse needs of market participants. On top of plain vanilla derivative products, there are exotic ones (e.g., barrier options, the simplest and most traded exotic derivative product). Even more complex, there are structured products, which are essentially the combination of vanilla or exotic equity instruments and fixed income instruments.

Amongst the structured products, reverse convertible products are one of the most popular choices for investors. Reverse convertible products are non-principal protected products linked to the performance of an underlying asset, usually an individual stock or an index, or a basket of them. Clients can enter into a position of a reverse convertible with the over-the-counter (OTC) trading desks in major investment banks.

In exchange for an above-market coupon payment, the holder of the product gives up the potential upside exposure to the underlying asset. The exposure to the downside risks still remains. Reserve convertibles are therefore appreciated by the investors who are anticipating a stagnation or a slightly upward market trend.

Construction of a reverse convertible

This product could be decomposed in two parts:

  • On the one hand, the buyer of the structure receives coupons on the principal invested and this could be considered as a “coupon bond”;
  • On the other hand, the investor is still exposed to the downside risks of the underlying asset and foregoes the upside gains, and this could be achieved by a short position of a put option (either a vanilla put option or a down-and-in barrier put option).

Positions of the parties of the transaction

A reverse convertible involves two parties in the transaction: a market maker (investment bank) and an investor (client). Table 1 below describes the positions of the two parties at different time of the life cycle of the product.

Table 1. Positions of the parties of a reverse convertible transaction

t Market Maker (Investment Bank) Investor (Client)
Beginning
  • Enters into a long position of a put (either a vanilla put or a down-and-in barrier put)
  • Receives the nominal amount for the “coupon” part
  • Invests in the amount (nominal amount plus the premium of the put) in risk-free instruments
  • Enters into a short position of a put (either a vanilla put or a down-and-in barrier put)
  • Pays the nominal amount for the “coupon” part
Interim
  • Pays pre-specified interim coupons in respective interim coupon payment dates (if any)
  • Receives interest payment from risk-free investments
  • Receives the pre-specified interim coupons in respective interim coupon payment dates (if any)
End
  • Receives the payoff (if any) of the put option component
  • Pays the pre-specified final coupon in the final coupon payment date
  • Pays the payoff (if any) of the put option component
  • Receives the pre-specified final coupon in the final coupon payment date

Based on the type of the put option incorporated in the product (either plain vanilla put option or down-and-in barrier put option), reserve convertibles could be categorized as plain or barrier reverse convertibles. Given the difference in terms of the composition of the structured product, the payoff and pricing mechanisms diverge as well.

Here is an example of a plain reverse convertible with following product characteristics and market information.

Product characteristics:

  • Investment amount: USD 1,000,000.00
  • Underlying asset: S&P 500 index (Bloomberg Code: SPX Index)
  • Investment period: from August 12, 2022 to November 12, 2022 (3 months)
  • Coupon rate: 2.50% (quarterly)
  • Strike level : 100.00% of the initial level

Market data:

  • Current risk-free rate: 2.00% (annualized)
  • Volatility of the S&P 500 index: 13.00% (annualized)

Payoff of a plain reverse convertible

As is presented above, a reverse convertible is essentially a combination of a short position of a put option and a long position of a coupon bond. In case of the plain reverse convertible product with the aforementioned characteristics, we have the blow payoff structure:

  • in case of a rise of the S&P 500 index during the investment period, the return for the reverse convertible remains at 2.50% (the coupon rate);
  • in case of a drop of the S&P 500 index during the investment period, the return would be equal to 2.50% minus the percentage drop of the underlying asset and it could be negative if the percentage drop is greater than 2.5%.

Figure 1. The payoff of a plain reverse convertible on the S&P 500 index
Payoff of a plain reverse convertible
Source: Computation by author.

Pricing of a plain reverse convertible

Since a reverse convertible is essentially a structured product composed of a put option and a coupon bond, the pricing of this product could also be decomposed into these two parts. In terms of the pricing a vanilla option, the Black–Scholes–Merton model could do the trick (see Black-Scholes-Merton option pricing model) and in terms of pricing a barrier option, two methods, analytical formula method and Monte-Carlo simulation method, could be of help (see Pricing barrier options with analytical formulas; Pricing barrier options with simulations and sensitivity analysis with Greeks).

With the given parameters, we can calculate, as follows, the margin for the bank with respect to this product. The calculated margin could be considered as the theoretical price of this product.

Table 2. Margin for the bank for the plain reverse convertible
Margin for the bank for the plain reverse convertible
Source: Computation by author.

Download the Excel file to analyze reverse convertibles

You can find below an Excel file to analyze reverse convertibles.
Download Excel file to analyze reverse convertibles

Why should I be interested in this post

As one of the most traded structured products, reverse convertibles have been an important instrument used to secure return amid mildly negative market prospect. It is, therefore, helpful to understand the product elements, such as the construction and the payoff of the product and the targeted clients. This could act as a steppingstone to financial product engineering and risk management.

Related posts on the SimTrade blog

   ▶ All posts about options

   ▶ Jayati WALIA Black-Scholes-Merton option pricing model

   ▶ Akshit GUPTA The Black Scholes Merton Model

   ▶ Shengyu ZHENG Barrier options

   ▶ Shengyu ZHENG Pricing barrier options with analytical formulas

   ▶ Shengyu ZHENG Pricing barrier options with simulations and sensitivity analysis with Greeks

Resources

Academic references

Broadie, M., Glasserman P., Kou S. (1997) A Continuity Correction for Discrete Barrier Option. Mathematical Finance, 7:325-349.

De Bellefroid, M. (2017) Chapter 13 (Barrier) Reverse Convertibles. The Derivatives Academy. Accessible at https://bookdown.org/maxime_debellefroid/MyBook/barrier-reverse-convertibles.html

Haug, E. (1997) The Complete Guide to Option Pricing. London/New York: McGraw-Hill.

Hull, J. (2006) Options, Futures, and Other Derivatives. Upper Saddle River, N.J: Pearson/Prentice Hall.

Merton, R. (1973). Theory of Rational Option Pricing. The Bell Journal of Economics and Management Science, 4:141-183.

Paixao, T. (2012) A Guide to Structured Products – Reverse Convertible on S&P500

Reiner, E. S. (1991) Breaking down the barriers. Risk Magazine, 4(8), 28–35.

Rich, D.R. (1994) The Mathematical Foundations of Barrier Option-Pricing Theory. Advances in Futures and Options Research: A Research Annual, 7, 267-311.

Business references

Six Structured Products. (2022). Reverse Convertibles et barrier reverse Convertibles

About the author

The article was written in August 2022 by Shengyu ZHENG (ESSEC Business School, Grande Ecole Program – Master in Management, 2020-2023).
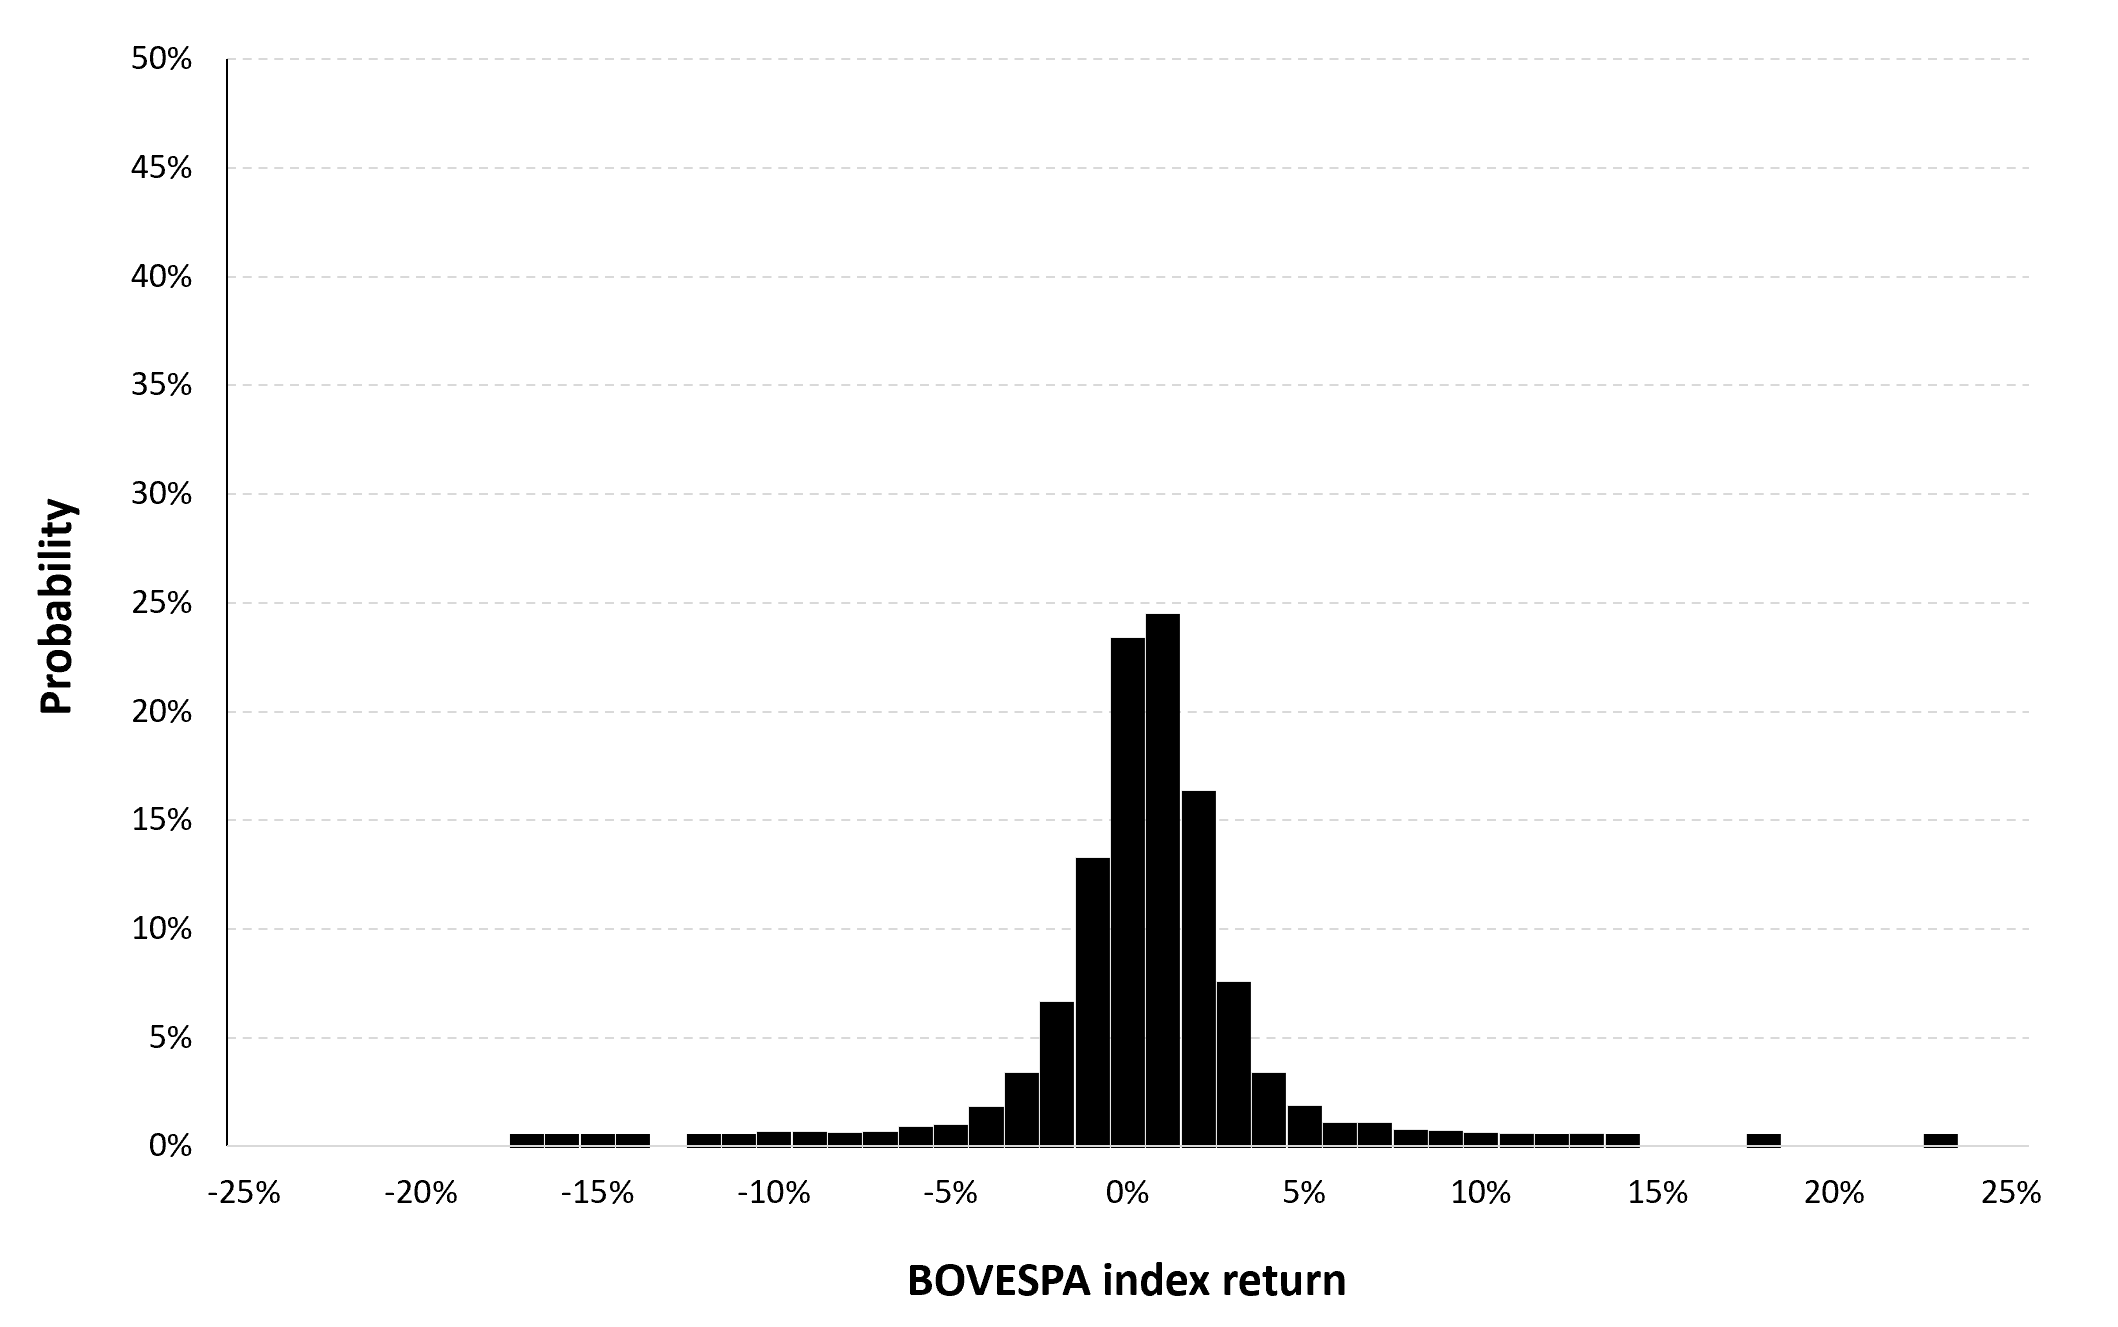
Macro Funds

Macro Funds

Akshit Gupta

This article written by Akshit GUPTA (ESSEC Business School, Grande Ecole Program – Master in Management, 2019-2022) explains marco funds which is a type of hedge fund based on the analysis of macroeconomic or political events.

Introduction

Macro funds, also known as global macro funds, are actively managed alternative investment vehicles (hedge funds) whose strategy profits from the broad market movements caused by macroeconomic (economic, fiscal and monetary) or geopolitical events. These funds typically invest in asset classes including equity, fixed income, currencies, and commodities. They invest in both the spot and derivatives markets. They use a mix of long and short positions in these asset classes to implement their market views to achieve superior returns (higher than a given benchmark).

Some key elements impacting the decisions taken by macro funds include:

  • Economic factors – Macro funds constantly monitor the economic data across different countries including interest rates, inflation rates, GDP growth, unemployment rates and industrial/retail growth rates to make investment decisions.
  • Mispricing – Macro funds try to arbitrage markets based on perceived mispricing.
  • Political situations – The political situations in different countries also play a major role in the investment decisions made by macro funds as unstable political situations can lead to low investor confidence and thus cause a decline in the financial markets.

Benefits of a macro funds

Like other types of hedge funds, macro funds aim at providing their clients (investors) with investments managed in an efficient manner to optimize expected returns and risk. Such funds are especially expected to diversify the clients’ portfolios. So, macro funds are often acknowledged as the alternative funds in the industry.

Other characteristics of macro funds

Other characteristics of macro funds (clients, fee structure, investment constraints) are similar to other types of hedge funds (see the posts Introduction to Hedge Funds and Hedge Funds).

Examples of macro funds strategies

A commonly used asset class in macro fund strategy includes currencies. Their exchange rates are affected by several factors including monetary and fiscal policies, economic factors like GDP growth and inflation and geopolitical situation. Black Wednesday is an example of an infamous event, where we can understand the different factors and use of macro fund strategies.

Black Wednesday

During the 1970s, an European Exchange Rate Mechanism (ERM) was set up to reduce exchange rate variability and stabilize the monetary policies across the continent. Also, a stage was being set to introduce a unified common currency named Euro. The United Kingdom joined ERM in 1990 due to political instability in the country raising fears of higher currency fluctuations.

The pound sterling shadowed the German mark but owing to challenges faced by Britain at that point in time, including lower interest rates, higher inflation rates and an unstable economy, the currency traders weren’t satisfied with the decision.

Seeing the economic situation, George Soros, one of the most famous investors, used the macro fund strategy during 1992 when he took a short position in the pound sterling for $10 billion and made a $1 billion profit from his position.

Related Posts

   ▶ Akshit GUPTA Asset management firms

   ▶ Akshit GUPTA Hedge Funds

   ▶ Youssef LOURAOUI Introduction to Hedge Funds

   ▶ Akshit GUPTA Portrait of George Soros: A famous investor

Useful resources

Academic resources

Pedersen, L. H., 2015. Efficiently Inefficient: How Smart Money Invests and Market Prices Are Determined. Princeton University Press, Chapter 11, Global macro Investing.

Business resources

JP. Morgan Asset Management

DeChesare Brian “Global Macro Hedge Funds: Living in an FX Traders’ Paradise?”

About the author

Article written in August 2022 by Akshit GUPTA (ESSEC Business School, Grande Ecole Program – Master in Management, 2019-2022).

Initial and maintenance margins in stocks

Initial and maintenance margins in stocks

Akshit Gupta

This article written by Akshit GUPTA (ESSEC Business School, Grande Ecole Program – Master in Management, 2019-2022) explains the mechanisms of initial and maintenance margin used in stocks.

Introduction

In financial markets, margin requirements are present in leveraged positions in stock trading. They refer to a percentage of assets that an investor must put aside with his or her own cash or assets (collateral) as a means of protection against the risk exposure to its potential default for the other counterpart.

Margin requirements serve as a guarantee that the investor providing the margins will fulfill its trade obligations. Many exchanges across the world provide leverage facilities to investors for trading in different assets. For example, an investor can use leverage facilities for trading in equities, bonds, exchange rates, commodities, etc. It usually takes the form of derivatives contracts like futures and options. Whenever an investor buys or sells stocks using leverage, it is called buying or selling on margin.

Margin requirements can be categorized as initial and maintenance margin requirements.

Initial margin

Initial margin (or IM) refers to the initial deposit required when an investor opens a position in an underlying asset and amounts to a percentage of the nominal contract value. The amount for the initial margin requirement is calculated in accordance with approved margin models that are based on the market’s regulatory rules. The determination of the initial margin requirement is essentially based on the volatility of the asset being covered. The more volatile the asset, the higher the initial margin requirement.

You can download below the file to learn about the different initial margin requirements at Euronext Clearing used in stock trading (PDF document).

Maintenance margin

When an investor holds an underlying asset on margin, she is required to maintain a minimum margin amount of that asset position in her portfolio to keep her position open and this is known as the maintenance margin. Maintenance margin requirements aim to protect against excess losses and ensure the broker has enough capital to cover any losses the investor may incur. In case the investor is unable to fulfill the maintenance margin requirements, she receives a margin call initiated from the broker to deposit a further amount in order to keep her position open. If she fails to provide adequate maintenance margins, the broker has the power to close her position.

Mechanism of initial and maintenance margins

Now, we will see how initial and maintenance margins work in the financial markets with the concept of short selling used in equity trading. Since the short sell involves borrowing stock, the investor is required by its broker to post an initial margin at the time the trade is initiated. For instance, this initial margin is set to 50% of the value of the short sale. This money is essentially the collateral on the short sale to protect the lender of the stocks in the future against the default of the borrower (the investor).

Followed by this, a maintenance margin is required at any point of time after the trade is initiated. The maintenance is taken as 30% of the total value of the position. The short seller has to ensure that any time the position falls below this maintenance margin requirement, he will get a margin call and has to increase funds into the margin account.

Example

Here is an example of a typical case of short selling and its margin mechanism:

 Margin call on stocks

You can download below the Excel file for the computation of the Intial and Maintenance Margins for the stocks.

Download the Excel file to compute the initial and maintenance margins on stocks

Useful resources

Euronext Clearing

Maintenance margin

Initial Margin

Financial Industry Regulatory Authority (FINRA)

Related posts

   ▶Akshit GUPTA Initial and Maintenance margin in futures contracts

   ▶ Youssef LOURAOUI Introduction to Hedge Funds

   ▶ Akshit GUPTA Analysis of the Big Short movie

   ▶ Akshit GUPTA Analysis of the Margin call movie

   ▶ Akshit GUPTA Analysis of the Trading places movie

About the author

Article written in August 2022 by Akshit GUPTA (ESSEC Business School, Grande Ecole Program – Master in Management, 2019-2022).

Initial and maintenance margins in futures contracts

Initial and maintenance margins in futures contracts

Akshit Gupta

This article written by Akshit GUPTA (ESSEC Business School, Grande Ecole Program – Master in Management, 2019-2022) explains the mechanisms of initial and maintenance margin used in futures contracts.

Introduction

In financial markets, margin requirements are present in leveraged positions in derivative products. They refer to a percentage of assets that an investor must pay for with his or her own cash or assets (collateral) as a means of protection against the risk exposure to its potential default for the other counterpart.

Margin requirements serve as a guarantee that the investor providing the margins will fulfil its trade obligations. Many exchanges across the world provide leverage facilities to investors for trading in different derivative assets. For example, an investor can use leverage facilities for trading in futures contracts across different asset classes like equities, bonds, currencies, interest rates, etc.

Margin requirements can be categorized as initial and maintenance margin requirements.

Initial margin

Initial margin (or IM) refers to the initial deposit required when an investor opens a position in a derivative product and amounts to a percentage of the nominal contract value. The amount for initial margin requirement is calculated in accordance with approved margin models that are based on the market’s regulatory rules. The determination of the initial margin requirement is essentially based on the volatility of the underlying asset of the derivative product being covered. The more volatile the underlying asset, the higher the initial margin requirement.

You can download below the file to learn about the different Euronext Clearing margin requirements used in derivatives trading.

Maintenance margin

When an investor holds an underlying asset on margin, she is required to maintain a minimum margin amount of that asset position in her portfolio to keep her position open and this is known as the maintenance margin. Maintenance margin requirements aim to protect against excess losses and ensures the broker has enough capital to cover any losses the investor may incur. Maintenance margin is generally calculated on a daily mark-to-market basis between the period starting from the trading date to the contract expiration date.

In case the investor is unable to fulfil the maintenance margin requirements, she receives a margin call initiated from the broker to deposit further amount in order to keep her position open. If she fails to provide adequate maintenance margins, the broker has the power to close her positions.

Mechanism of initial and maintenance margins

Now, we will see how initial and maintenance margins work in the financial markets using S&P 500 mini futures contract. Since the investor has bought the futures contract, he/she is required by its broker to post an initial margin at the time the trade is initiated. For instance, this initial margin is set to 40% of the nominal value of the contract. This money is essentially the collateral on the purchase to protect the seller of the contract in the future against the default of the buyer (the investor).

Followed by this, a maintenance margin is required at any point of time after the trade is initiated. The maintenance margin call is triggered when the value of the initial margin falls below the 30% threshold (i.e. 70% of the initial margin). The buyer has to ensure that any time the position falls below this maintenance margin requirements, he will get a margin call and has to increase funds into the margin account.

Example with initial margin

Here is an example of a typical case of buying a futures contract and its margin mechanism:

The characteristics of the contract and market data include:

 Margin call on futures

 Margin call on long futures

The final value of the investor’s brokerage account is equal to $253,000. At the end of the contract, the investor can get back its initial margin of $158,000 leaving $95,000 on its account. The gain is equal to $10,000 which is the amount left on the account ($95,000) minus the sum of the margin calls ($85,000).

Here is an example of a typical case of selling a futures contract and its margin mechanism using the same characteristics and market data:

 Margin call on short futures

The final value of the investor’s brokerage account is equal to $178,000. At the end of the contract, the investor can get back its initial margin of $158,000 leaving $20,000 on its account. The loss is equal to $10,000 which is the amount left on the account ($20,000) minus the sum of the margin calls ($30,000).

You can download below the Excel file for the computation of the Intial and Maintenance Margins for the futures contracts.

Download the Excel file to compute the initial margins for futures

Related posts in the SimTrade blog

   ▶ Akshit GUPTA Initial and Maintenance margin in stocks

   ▶ Akshit GUPTA Analysis of the Big Short movie

   ▶ Akshit GUPTA Analysis of the Margin call movie

   ▶ Akshit GUPTA Analysis of the Trading places movie

Useful resources

Maintenance margin

Initial Margin

Financial Industry Regulatory Authority (FINRA)

Prof. Longin’s website Margin Call mechanism for a futures contract (in French).

About the author

Article written in August 2022 by Akshit GUPTA (ESSEC Business School, Grande Ecole Program – Master in Management, 2019-2022).

My experience as a credit analyst at Amundi Asset Management

My experience as a credit analyst at Amundi Asset Management

Jayati WALIA

In this article, Jayati WALIA (ESSEC Business School, Grande Ecole Program – Master in Management, 2019-2022) shares her apprenticeship experience as an assistant credit analyst in Amundi which is a leading European asset management firm.

About Amundi

Amundi is a French asset management firm with currently over €2 trillion asset under management (AUM). It ranks among the top 15 asset managers in the world (see Table 1 below). Amundi is a public company quoted on Euronext with the highest market capitalization in Europe among asset management firms (€10.92 billion as of May 20, 2022). Amundi was founded in 2010 following a merger between Crédit Agricole Asset management and Société Générale Asset management.

Table 1. Rank of asset management firms by asset under management (AUM).
Top asset management firms rankings Source: www.advratings.com

Amundi has over 100 million clients (retail, institutional and corporate) and it offers a range of savings and investment solutions, services, advice, and technology in active and passive management, in both traditional and real assets.

Amundi logo Source: Amundi

My apprenticeship

My team at Amundi, Fixed Income Solutions, works in coordination with all the teams of the firm’s global bond management platform. The team’s work revolves majorly around product development on Amundi’s Fixed Income offerings including technological work, generating new investment ideas, and bringing them to clients both institutional and distributors. My position in the team is Assistant Credit Analyst.

Missions

My work primarily involves setting up tools and procedures linked to various investment solutions and portfolios handled by team. The tools are developed through algorithms in programming languages (mainly Python) and their functionalities range from analysis of market signals for investment, pricing of securities, risk monitoring and reporting. I worked on fixed-income portfolio construction and optimization algorithms implementing modern portfolio theory.

My daily responsibilities include report production related to daily fund activity such as monitoring fund balance and calculation of regulatory financial ratios to check for alignment against specific risk constraints. Additionally, I also participate in market research for new investment ideas through analysis of various fixed-income securities and derivatives.

Required skills and knowledge

The work and missions involved in my role require technical knowledge especially programming skills in Python, quantitative modelling and an understanding of financial markets, products and concepts of valuation, various types of risks and financial data analysis. Other behavioral skills such as project management, autonomy and interpersonal communication are also essential.

Three key financial concepts

The following are three key concepts that are used regularly in my work at Amundi:

Credit ratings

Credit ratings are extensively used in fixed income. They reflect the creditworthiness of a borrower entity such as a company or a government, which has issued financial debt instruments like loans and bonds.

Credit risk assessment for companies and governments is generally performed by rating agencies (such as S&P, Moody’s and Fitch) which analyze the internal and external, qualitative and quantitative attributes that drive the economic future of the entity.
Bonds can be grouped into the following categories based on their credit rating:

  • Investment grade bonds: These bonds are rated Baa3 (by Moody’s) or BBB- (by S&P and Fitch) or higher and have a low rate of default.
  • Speculative grade bonds: These bonds are rated Ba1 (by Moody’s) or BB+ (by S&P and Fitch) or lower and have a higher rate of default. They are thus riskier than investment grade bonds and issued at a higher yield. Speculative grade bonds are also referred to “high yield” and “junk bonds”.

Often, some bonds are designated “NR” (“not rated”) or “WR” (“withdrawn rating”) if no rating is available for them due to various reasons, such as lack of credible information.

Credit spreads

Credit spread essentially refers to the difference between the yields of a debt instrument (such as corporate bonds) and a benchmark (government or sovereign bond) with similar maturities but contrasting credit ratings. It is measured in basis points and is indictive of the premium of a risky investment over a risk-free one.

Credit spreads can tighten or widen over time depending on economic and market conditions. For instance, times of financial stress cause an increase in credit risk which leads to spread widening. Similarly, when markets rally, and credit risk is low, spreads tighten. Thus, credit spreads are an indicator of current macro-economic and market conditions.

Credit spreads are used by market participants for investment analysis and bond valuations.

Duration and convexity

Bond prices and interest rates share an inverse relationship, i.e., if interest rates go up, bond prices move down and similarly if interest rates go down, bond prices move up. Duration measures this price sensitivity of bonds with respect to interest rates and helps analyze interest-rate risk for bonds. Bonds with higher duration are more sensitive to interest rate changes and hence more volatile. Duration for a zero-coupon bond is equal to its time to maturity.

While duration is linear measure of bond price-interest rates relationship, in real life, the curve of bond prices against interest rates is convex i.e., the duration of the bonds also changes with change in interest-rates. Convexity measures this duration sensitivity of bonds with respect to interest rates.

Related posts on the SimTrade blog

   ▶ All posts about Professional experiences

   ▶ Alexandre VERLET Classic brain teasers from real-life interviews

   ▶ Louis DETALLE My professional experience as a Credit Analyst at Société Générale.

   ▶ Jayati WALIA Credit risk

   ▶ Jayati WALIA Fixed-income products

Useful resources

Amundi

About the author

The article was written in August 2022 by Jayati WALIA (ESSEC Business School, Grande Ecole Program – Master in Management, 2019-2022).

The impact of the Russian invasion of Ukraine on Shell

The impact of the Russian invasion of Ukraine on Shell

 Talia HAMMOUD

In this article, Talia HAMMOUD (The George Washington University, BBA, 2019-2023) discusses the impact of the Russian invasion on Shell, a large multinational oil company.

What is Shell?

Shell PLC is a British publicly traded multinational oil and gas company headquartered at in London, United Kingdom. It is one of the largest energy and petrochemical companies in the world, supplying all over the world.

What happened?

The relationship between Ukraine and Russia was tense since Ukraine gained its independence from the USSR in 1991. Since then, Russia annexed Crimea claiming it belonged to them as well as massing soldiers on the Ukraine-Russia border in 2021. On the 24th of February 2022, Russia invaded Ukraine, starting a full-blown war in Eastern Europe. In an effort to condemn Russia, many multinational companies announced they would withdraw or completely halt operations in the country.

Shell announced plans to withdraw from Russian oil just as people close to the matter say a plan is in the works by the Biden administration to ban Russian oil imports into the U.S. Due to this withdrawal, Shell announced that it anticipates account charges from $4 billion to $5 billion in its first quarter of 2022. This move caused American depositary shares of Shell to rise by 2.7% Tuesday, 8th March.

Stock market reaction

When it was first revealed that Shell was still buying discounted Russian oil after other oil companies announced their withdrawal on March 4th, Shell’s market shares plummeted by 5.73%. This shows that the market is efficient and was informed of Shell’s decision as many condemned them for still supporting Russia. There was increased market pressure for Shell to cut ties with all Russian oil suppliers. On March 8th, Shell apologized and announce its withdrawal from Russia as well as stopping all oil purchases from there. Thus, the market increased by 1.05% on March 8th.

Evolution of Shell stock market share price
hell stock market share price
Source: CNBC

Why this is important?

Firstly, it shows how volatile the oil market is as short-term demand for energy responds much faster to changes in growth than to price changes, especially due to the current Russian invasion of Ukraine, and how an act of war can impact millions around the world due to price increases of oil. This inherently impacts a big oil company such as Shell. However, I think that the market stocks rose in support of Shell withdrawing from Russian contracts and territories even though it is very costly as shown by the almost $5 billion in accounting costs for the first quarter. I think that this is an efficient market as stocks began to rise right before the announcement of this withdrawal was revealed showing that people were expecting Shell and other big oil companies to withdraw from Russia due to immense public pressure to condemn the Russian invasion of Ukraine.

Market efficiency

The market is quite efficient as the stock chart reflects all relevant information about Shell and its actions. For example, the announcement of Shells withdrawal in Russia is reflected in the market price of the day it was announced.

Key concepts

American depositary shares (ADS)

American depositary shares (ADS) are shares in foreign companies that are held in American depositary banks and can be traded in the U.S and on major exchanges. Shell Plc has an ADS facility managed by JPMorgan Chase Bank. Each American depositary share is equal to two Shell ordinary shares.

Market efficiency

Market efficiency refers to the degree how which many market prices reflect all relevant information available. If a market is efficient, it means all traders are well-informed and all the information available is reflected in the price of shares.

Volatility

Volatility represents the rate at which the price of a stock increases or decreases over a particular period. Higher stock price volatility often means higher risk and helps an investor to estimate the fluctuations that may happen in the future.

Useful resources

CNBC Shell PLC share price

Wall Street Journal Shell, BP to Withdraw From Russian Oil, Gas

Shell (March 8th, 2022) Shell announces intent to withdraw from Russian oil and gas

Related posts on the SimTrade blog

   ▶ All posts about financial news

   ▶ All posts about market efficiency

   ▶ Ines ILLES MEJIAS Netflix’s announcement impacts Disney’s stock price

   ▶ Aastha DAS Why is Apple’s new iPhone 14 release line failing in the first few months?

   ▶ Aamey MEHTA Market efficiency: the case study of Yes bank in India

About the author

The article was written in August 2022 by Talia HAMMOUD (The George Washington University, BBA, 2019-2023).
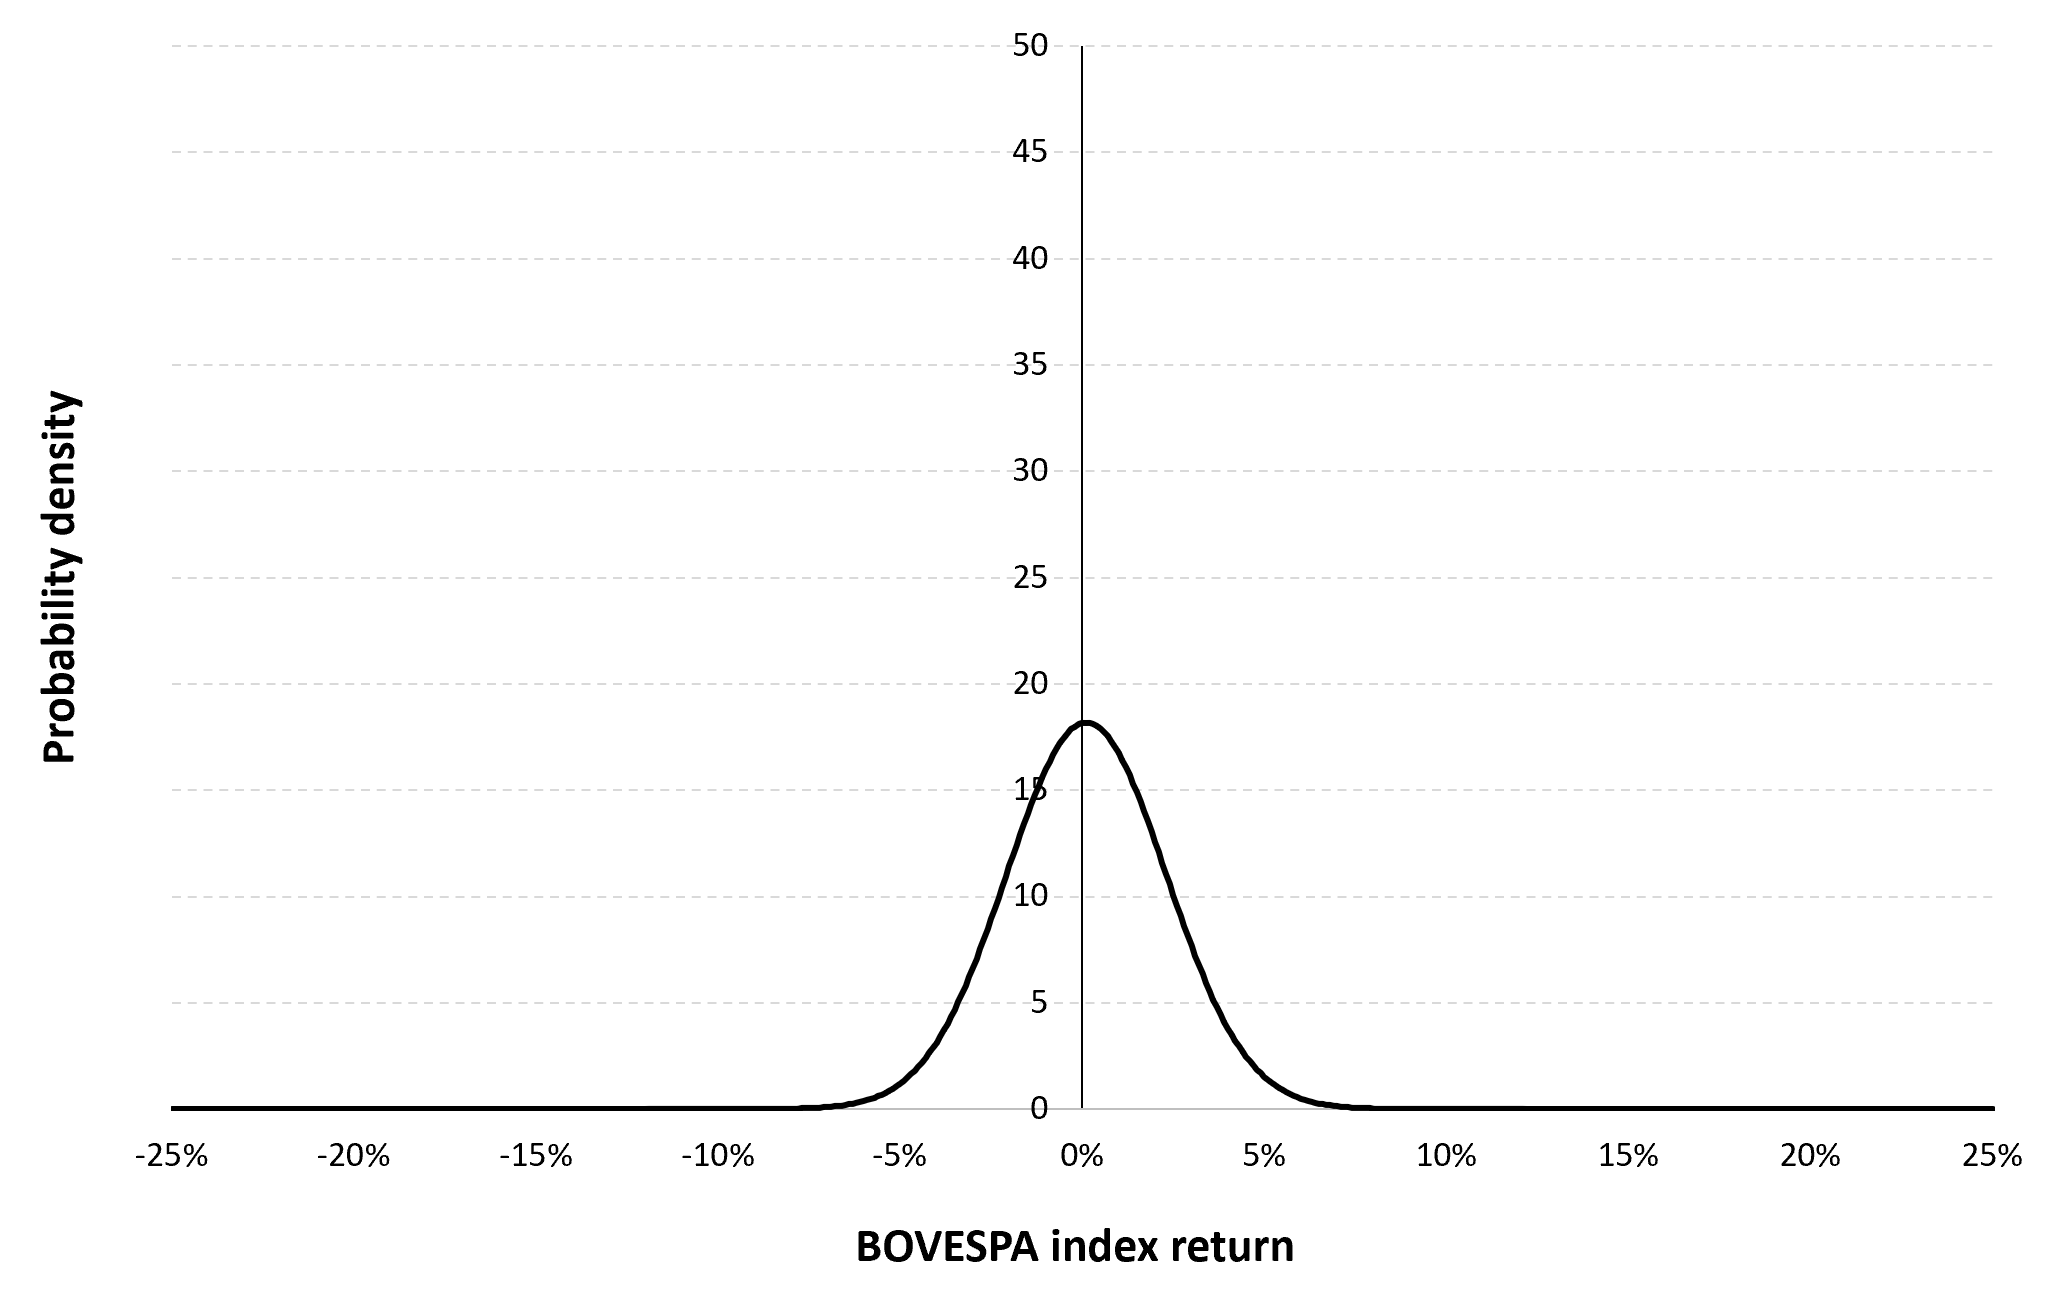
My internship experience at Little Friends for Peace

My internship experience at Little Friends for Peace

 Talia HAMMOUD

In this article, Talia HAMMOUD (The George Washington University, BBA, 2019-2023) shares her experience as an intern at a non-governmental organization Little Friends for Peace.

Little Friends for Peace

Little Friends for Peace (LFFP) is a small-medium-sized non-profit organization, based in Washington, D.C., that welcomes youth and adults to experience, learn and practice peace through various peace education programs. Started by MJ and Jerry Park in 1981, LFFP believes that all people can create homes, classrooms, teams, and workplaces where everyone gives, everyone gains, and everyone wins. Named for the “little” part we can all play in spreading peace, LFFP seeks to eradicate violence by teaching skills for peace. Some ways they can do this are by hosting ‘peace circles’, summer camps for children, and weekly visits to the McKenna Center, an organization that helps incarcerated men get back on their feet. Furthermore, they have international programming to certain parts of the world such as China, the Middle East, and Latin America.

Logo of Little Friends for Peace
Little Friends for Peace
Source: Little Friends for Peace

My Internship Experience

Since my internship experience took place during the unprecedented pandemic, it was not quite the same as other people’s internship experiences. Firstly, we met weekly on zoom as a team for updates, to-dos, and any exciting news about the NGO. Then we had the option to choose what tasks we wanted to be a part of or lead. For example, I chose to lead the Halloween fundraising event as well as lead in-person peace circles for children between the ages of 6-10 every Monday.

Knowledge and skills needed

Some of the skills required for the internship include organization, fundraising skills, and communication via e-mails, meetings, and social media. I had to organize a fundraising event and create an itinerary for the night. I also had to create advertising and marketing materials to spread awareness and attract attention to the event. This proved difficult as it required the use of a lot of social media outlets to stimulate interest.

What I learned

Operating a non-profit organization is very difficult in terms of financing it. Since a lot of the services they provide are pro bono (meaning for free), the non-profit must find other sources of income to keep the program running. Thus, LFFP must make use of donations, host fundraising events, request grants, and other methods of public funding. Despite this, Little Friends for Peace can maintain operating the business successfully.

Financial Concepts

Interdependence: Non-profits are very dependent on governments and donors which requires them to well connect all parts of operations such as planning, programs, evaluations, etc., to ensure that they receive the right amount of funding and to please potential donors.

Another thing to note is that non-profits must have a substantial amount of cash in operating reserves in case of any downturn or opportunities. For example, due to the pandemic, the government had significant delays in handing out grants and donations to NGOs, thus many organizations had to turn to their reserves to keep business operating.

Why should I be interested in this post?

I think it is very important for all students studying business to experience or learn about all different types of businesses, especially non-profit organizations. I feel that the business behind NGOs and the difficulties of running one is not discussed enough. Therefore, I encourage all business students to consider learning more about the behind-the-scenes of a non-profit organization.

Related posts on the SimTrade blog

   ▶ All posts about Professional experiences

Useful resources

Little Friends for Peace

Non-Profit Finance: 12 Golden Rules

About the author

The article was written in August 2022 by Talia Hammoud (The George Washington University, BBA, 2019-2023).
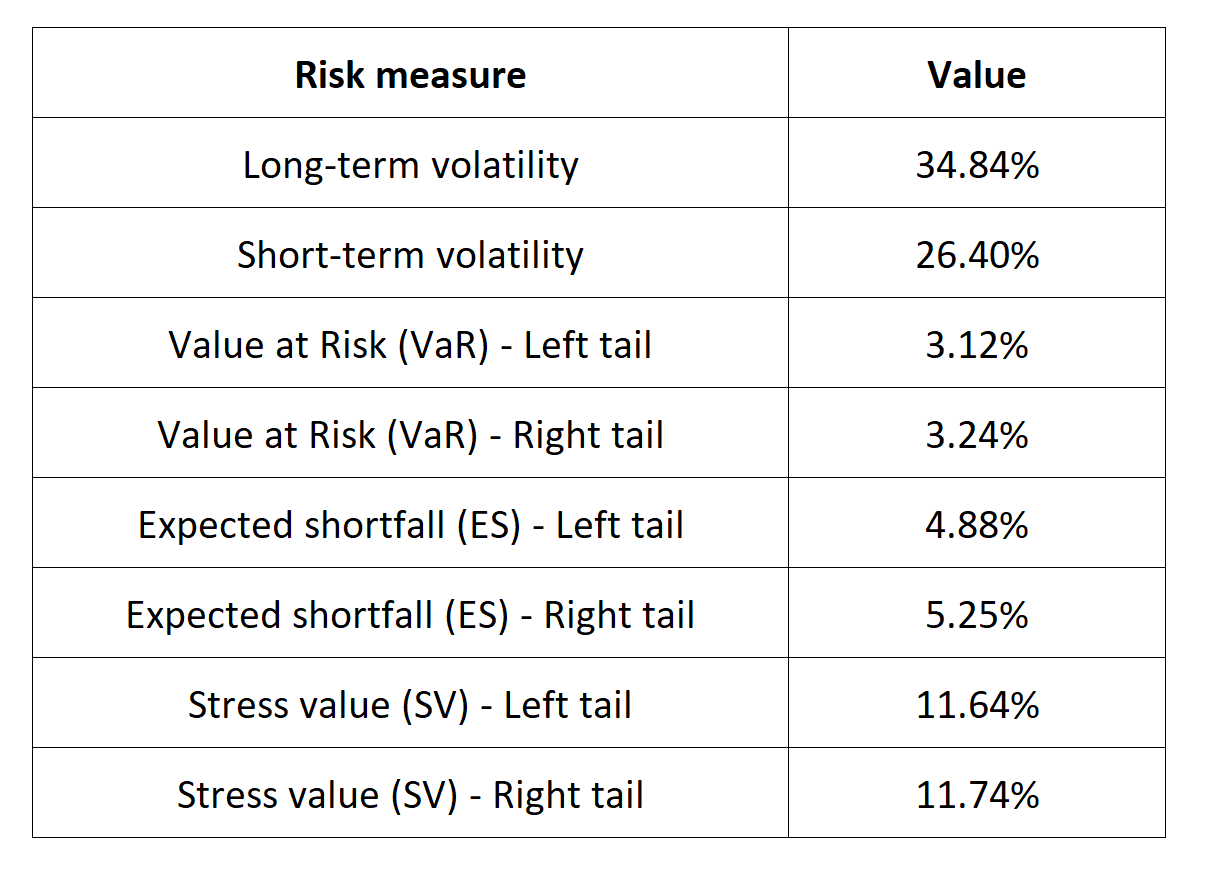
Muhammad Yunus

Muhammad Yunus

Louise Pizon

In this article, Louise PIZON (ESSEC Business School, Master in Strategy & Management of International Business (SMIB), 2020-2022) presents the portrait of Muhammad Yunus a well-known economist.

Muhammad Yunus or the “banker to the poor” was born in June 1940 in Bangladeshi in the city of Chittagong. He is a social entrepreneur, banker, economist and civil society leader. In 1976, he founded Grameen Bank, a micro finance organization and a community development bank. Microcredit is a delivery system to provide banking services to the rural poor. He is a pioneer of micro funding and microfinance concepts. In 2006, Muhammad Yunus was awarded Nobel Peace prize for these concepts.

Muhammad Yunus
Portrait Yunus
Source: Wikipédia

After his studies in United States, he came back to Bangladesh and worked for three months for the government’s Planning Commission. He quitted to join Chittagong University as head of the Economics department. He started to be involved in poverty reduction in 1974 when famine has struck Bangladesh.

Grameen bank (“village bank”)

It is in 1976, while visiting a poor village of Jobra next to Chittagong University that Muhammad Yunus has the idea of micro funding. He offered the opportunity to women to take a very small loan to create their business. He explains that at the beginning it was complicated to convince women to take loans because they were afraid of not being able to repay the loan. Also, he faced cultural problem; indeed, male didn’t agree to let women manage money.

Grameen Bank consists in constituting groups of solidarity within the villages of people who know each other. The risk of non-refunding is very low because the shame of mismanaging the loan money, naturally prevented borrowers from being dishonest with the Grameen Bank. At the very beginning groups were formed of five people, with one with the role of president and another one of secretary. Women are so proud to be part of these groups and they are meeting every week to check the status of their finance. Grameen bank allowed them to have an easier and more secure access to their money. It never had a shortage of funds for its loans. It was always local money for the poor women in the area. Members were always told that they had to create, operate and develop their branches with their own money.

Six years after the creation of Grameen Bank, the equality gender of the member rose to a 50/50 ratio. The bank observed that the impact on the family was significantly better in families where women were the borrowers compared to families where the borrowers were men. After this the priority for women borrower was set up and it became a common policy for all microcredit programs worldwide.

Link to VICOBA

Grameen Bank has many similarities with Village Community Bank (VICOBA). VICOBA is a savings and loan fund for members who have joined together and formed a group for economic improvement purposes. The system started in Tanzania twenty years ago and has shown great success for its members in being able to lend to each other, helping each other to solve various problems as well set up joint economic projects.
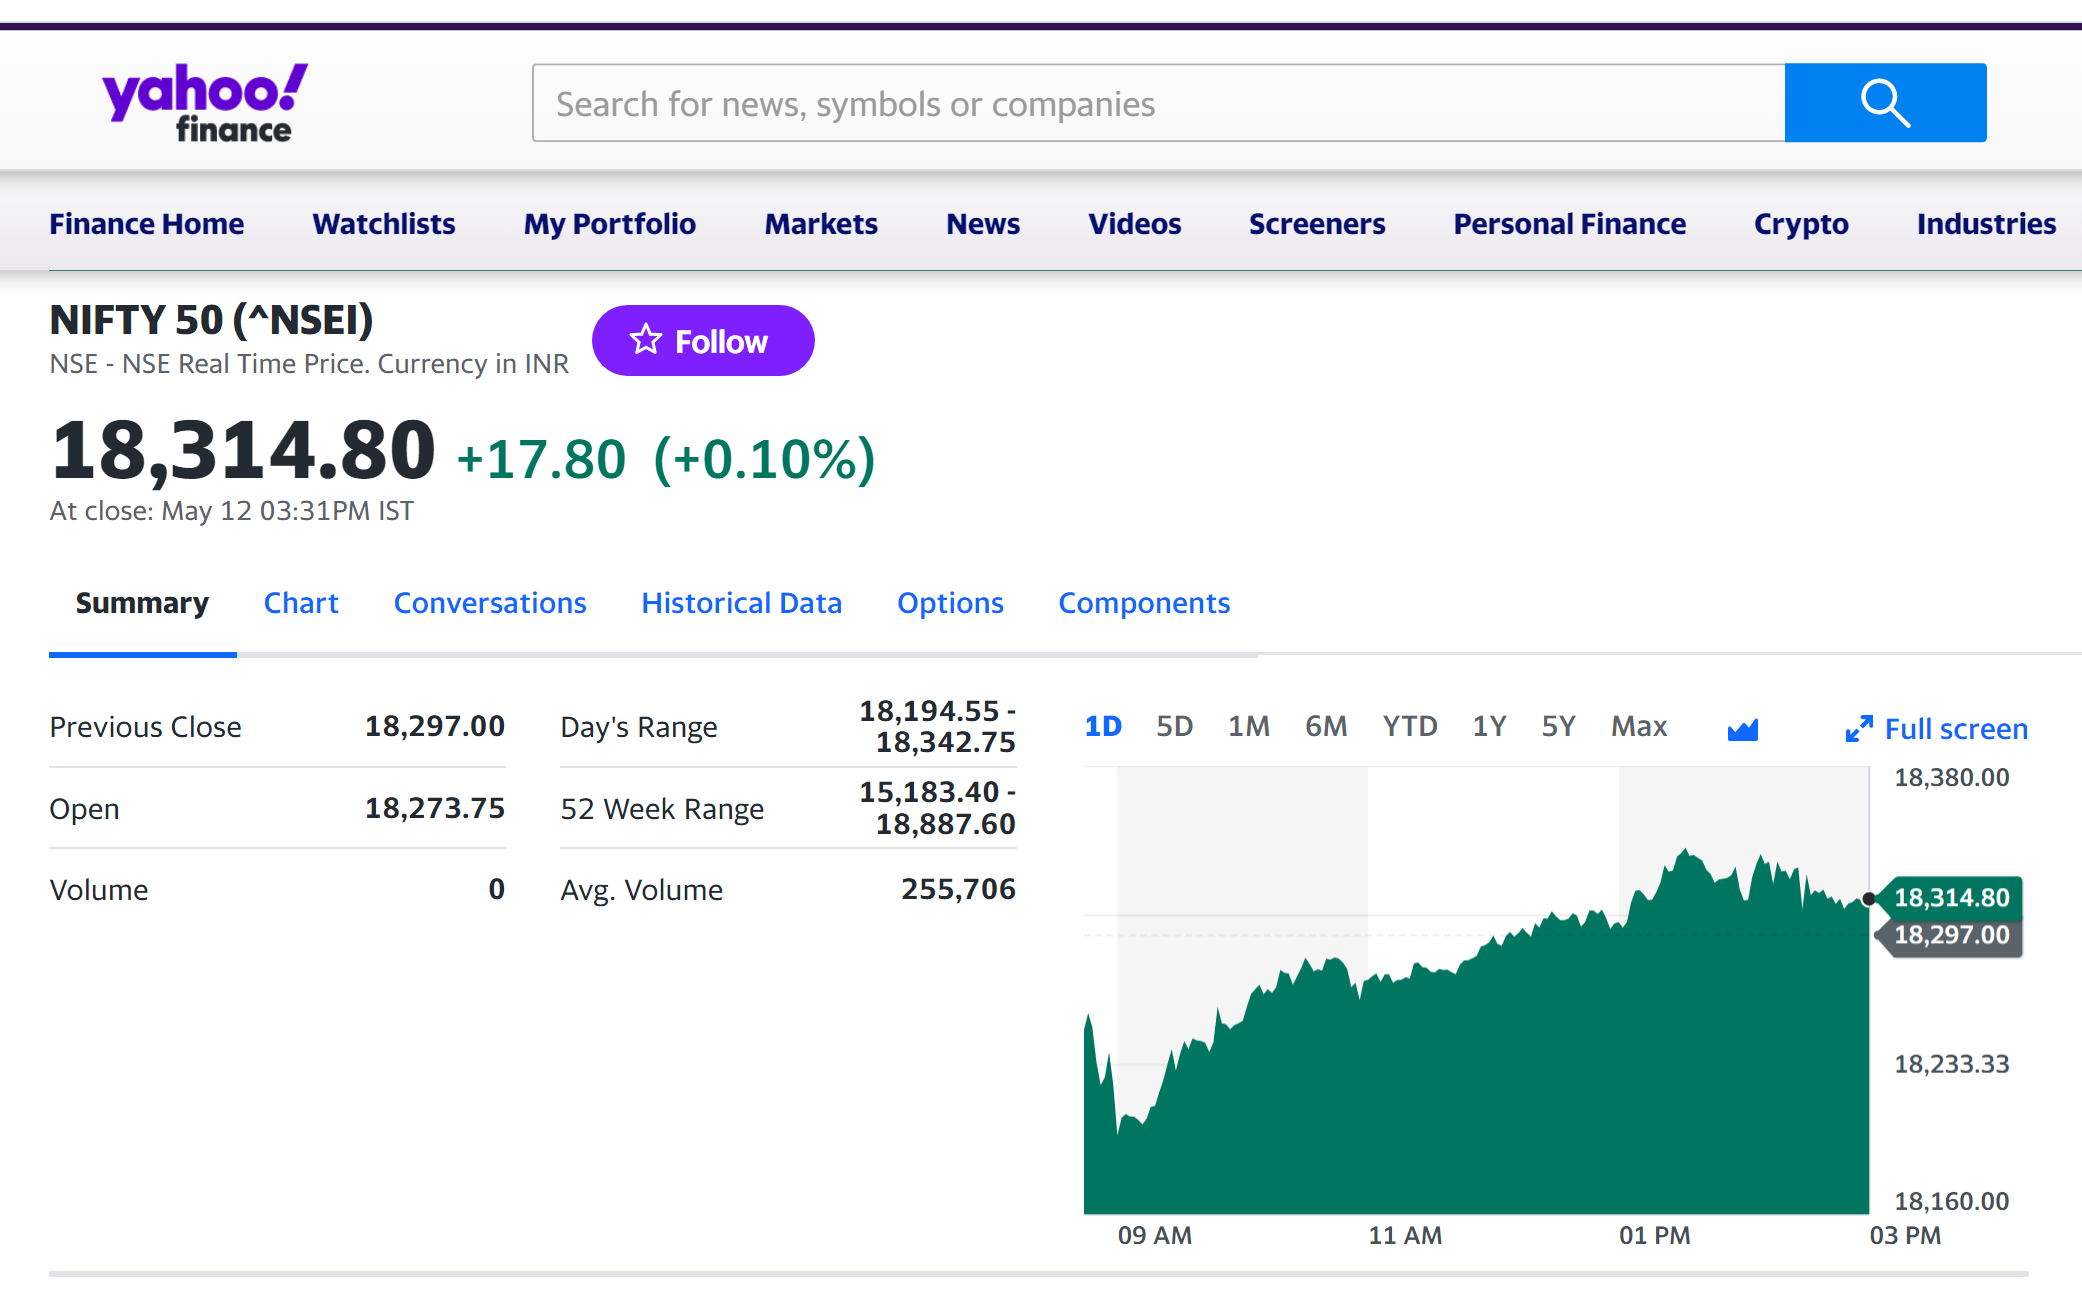
Both forms of micro funding aim at empowering women and lifting families out of poverty by allowing them to borrow a small amount of money to be able to start a business and generate more money. In both cases, the groups are formed in the same way: members come from the same village and in general it is group of close friends or family members. Within the group, a steering committee of five people is elected annually with the roles of chairperson, secretary, treasurer and two accountants. Both village community banks have weekly meetings to manage the accounts and ensure that people repay on time their loans.

However, there are some differences such as the number of members in the groups: five for Grameen bank versus fifteen to thirty members for VICOBA.

The biggest difference between Grameen and VICOBA is that people part of Grameen bank must open a bank account in Grameen bank whereas VICOBA is completely manage by the members of the group and the money is lock in a box by the treasurer of the group. In VICOBA they also have the possibility to follow business trainings to help them to build their businesses.

Why should I be interested in this post?

Do you want to know how an economist won a Nobel Peace Price? Find out the story of Muhammed Yunus or “the banker to the poor” who created the concept of micro funding to help the poor rural to lift out of the poverty and let them a chance to live in better conditions. Besides being a brilliant economist, he is also a humanitarian and a successful businessman whose purpose in life is creating a World without poverty.

Related posts on the SimTrade blog

   ▶ Louise PIZON Vicoba

   ▶ Louise PIZON My professional experience as a business developer at AJISO

Useful resources

Forbes Muhammed Yunus (Prix Nobel) (in French).

About the author

The article was written in August 2022 by Louise PIZON (ESSEC Business School, Master in Strategy & Management of International Business (SMIB), 2020-2022).