In this article, Nithisha CHALLA (ESSEC Business School, Grande Ecole Program – Master in Management (MiM), 2021-2024) provides an overview of ETFs on gold, the major types gold ETFs in market, and the advantages and disadvantages of investing on gold ETFs.
Introduction
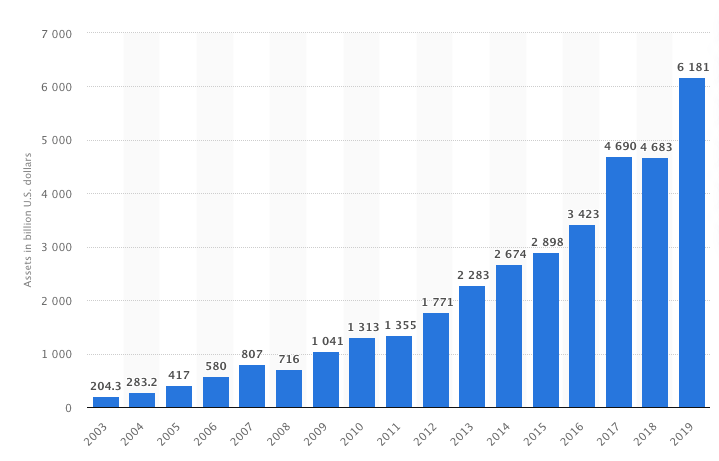
Gold ETFs are financial instruments that track the price of gold and allow investors to buy shares representing a fraction of physical gold holdings. The first gold ETF was launched in March 2003. Later, State Street Corporation launched SPDR Gold Shares (NYSE: GLD) in 2004, which became the largest gold-backed ETF in the world by 2019. In 2020, the Royal Mint issued the first gold ETC issued by HANetf Securities Plc, from a European sovereign entity. And after that, Wilshire Phoenix launched the wShares Enhanced Gold Trust (NYSE: WGLD) in 2021. This ETF tracks the Wilshire Gold Index, which automatically rebalances physical gold and cash based on market conditions.
Types of Gold ETFs
There are two types of gold ETFs, namely Physically Backed Gold ETFs and Synthetic gold ETF’s.
Physically Backed Gold ETFs: These ETFs invest in physical gold, held in a secure vault by the ETF provider. The units of the ETF represent a specific amount of gold. For example, one unit of a physically backed gold ETF might represent 1 gram of gold. Examples include SPDR Gold Shares (GLD) and iShares Gold Trust (IAU).
Synthetic Gold ETFs: These ETFs do not invest in physical gold. Instead, they use financial instruments, such as futures contracts or swaps, to track the price of gold. This means the ETF provider does not need to hold any physical gold.
Major Gold ETFs in the Market
SPDR Gold Shares (GLD)
SPDR offers investors an innovative, relatively cost-efficient, and secure way to access the gold market. Originally listed on the New York Stock Exchange in November of 2004, and traded on NYSE Arca (the top U.S. exchange for the listing and trading of exchange-traded funds (ETFs) ) since December 13, 2007, SPDR Gold Shares is the largest physically backed gold exchange-traded fund (ETF) in the world. SPDR Gold Shares also trade on the Singapore Stock Exchange, the Tokyo Stock Exchange, The Stock Exchange of Hong Kong, and the Mexican Stock Exchange (BMV).
Figure 1 below gives GLD share price dated from January 1, 2024, to October 11, 2024.
Figure 1. SPDR share price
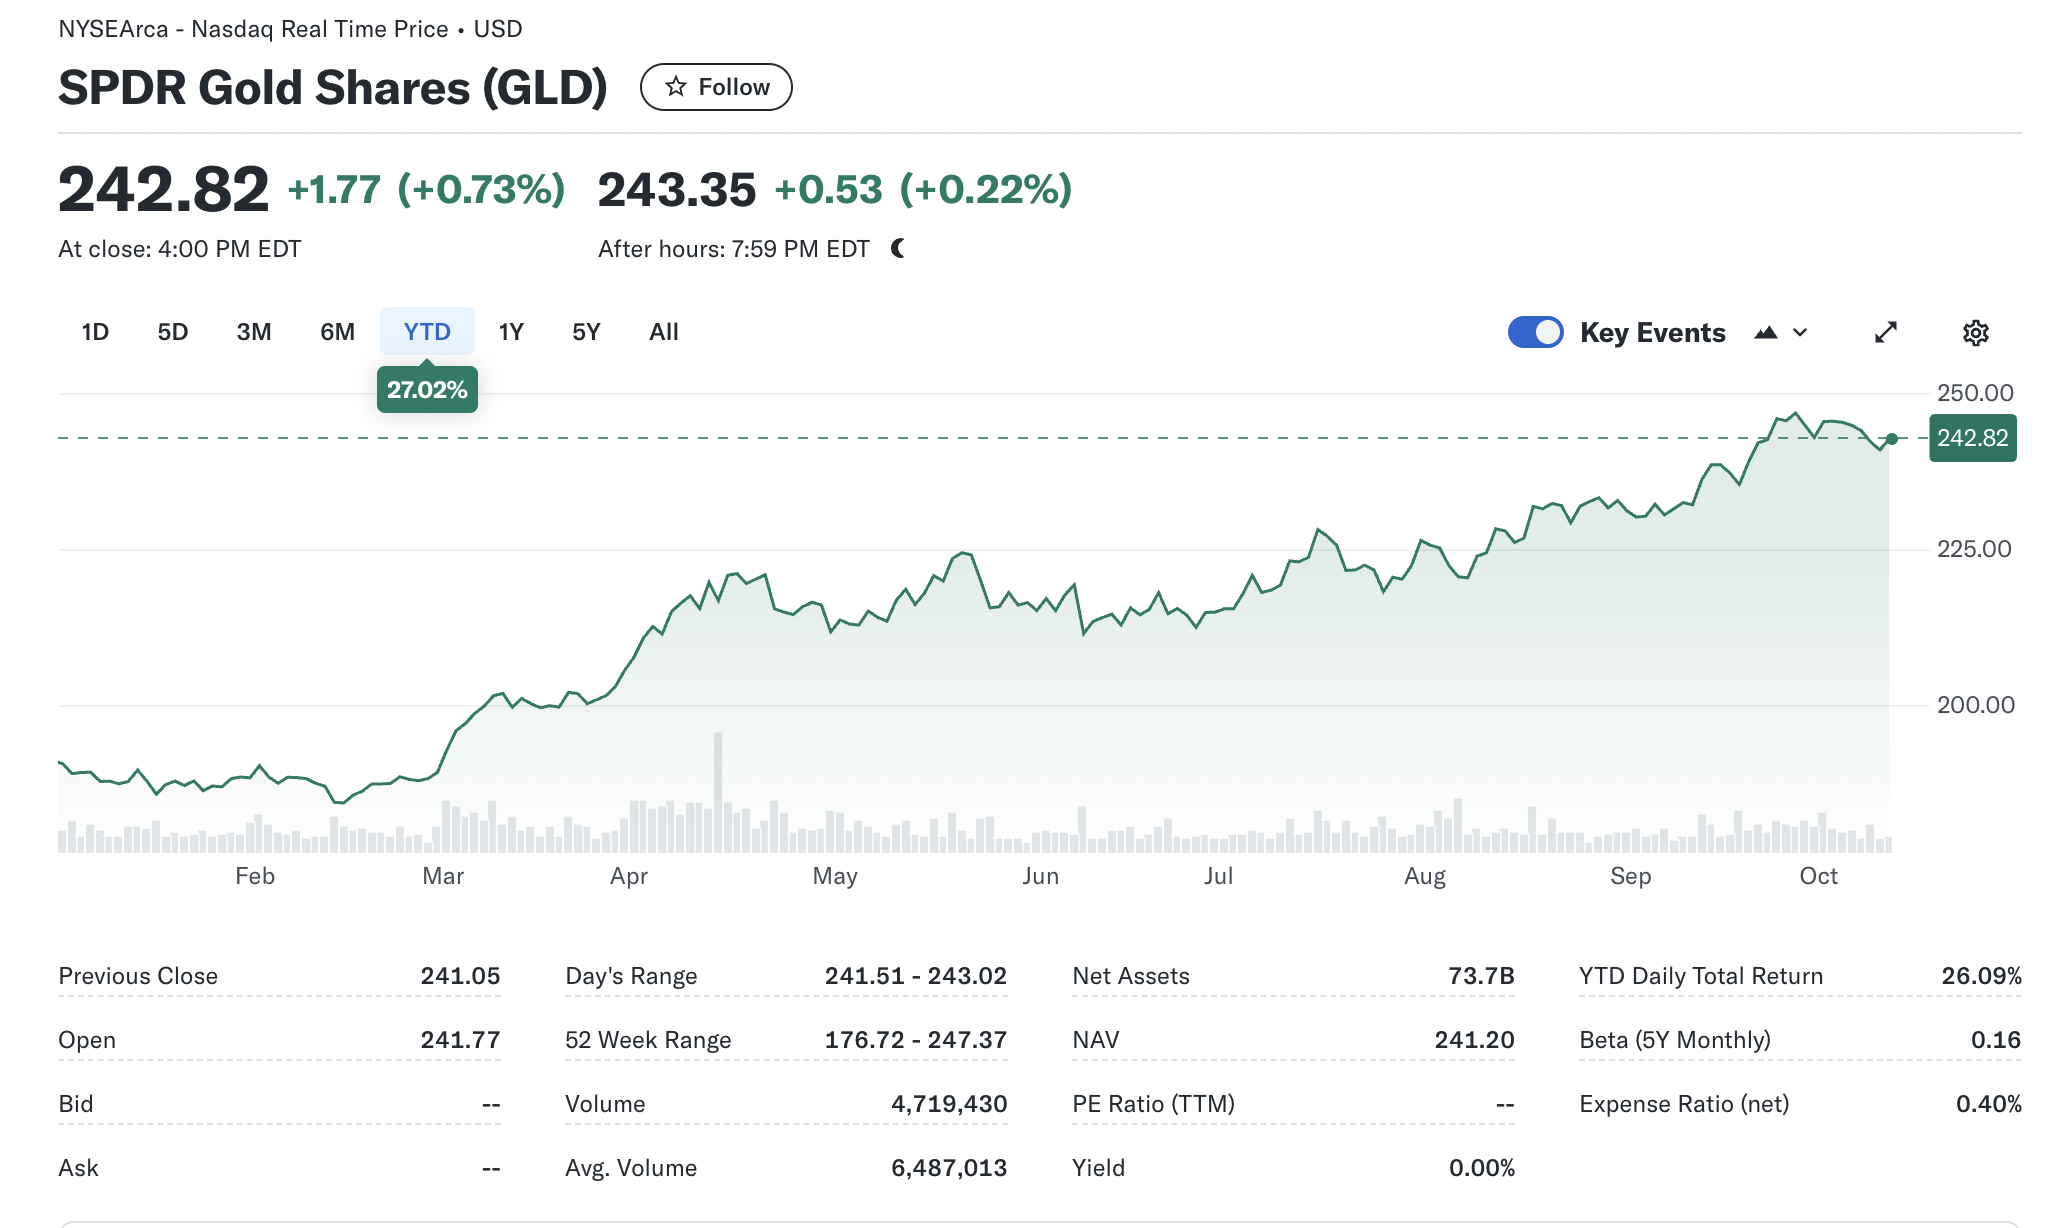
Source: Yahoo Finance
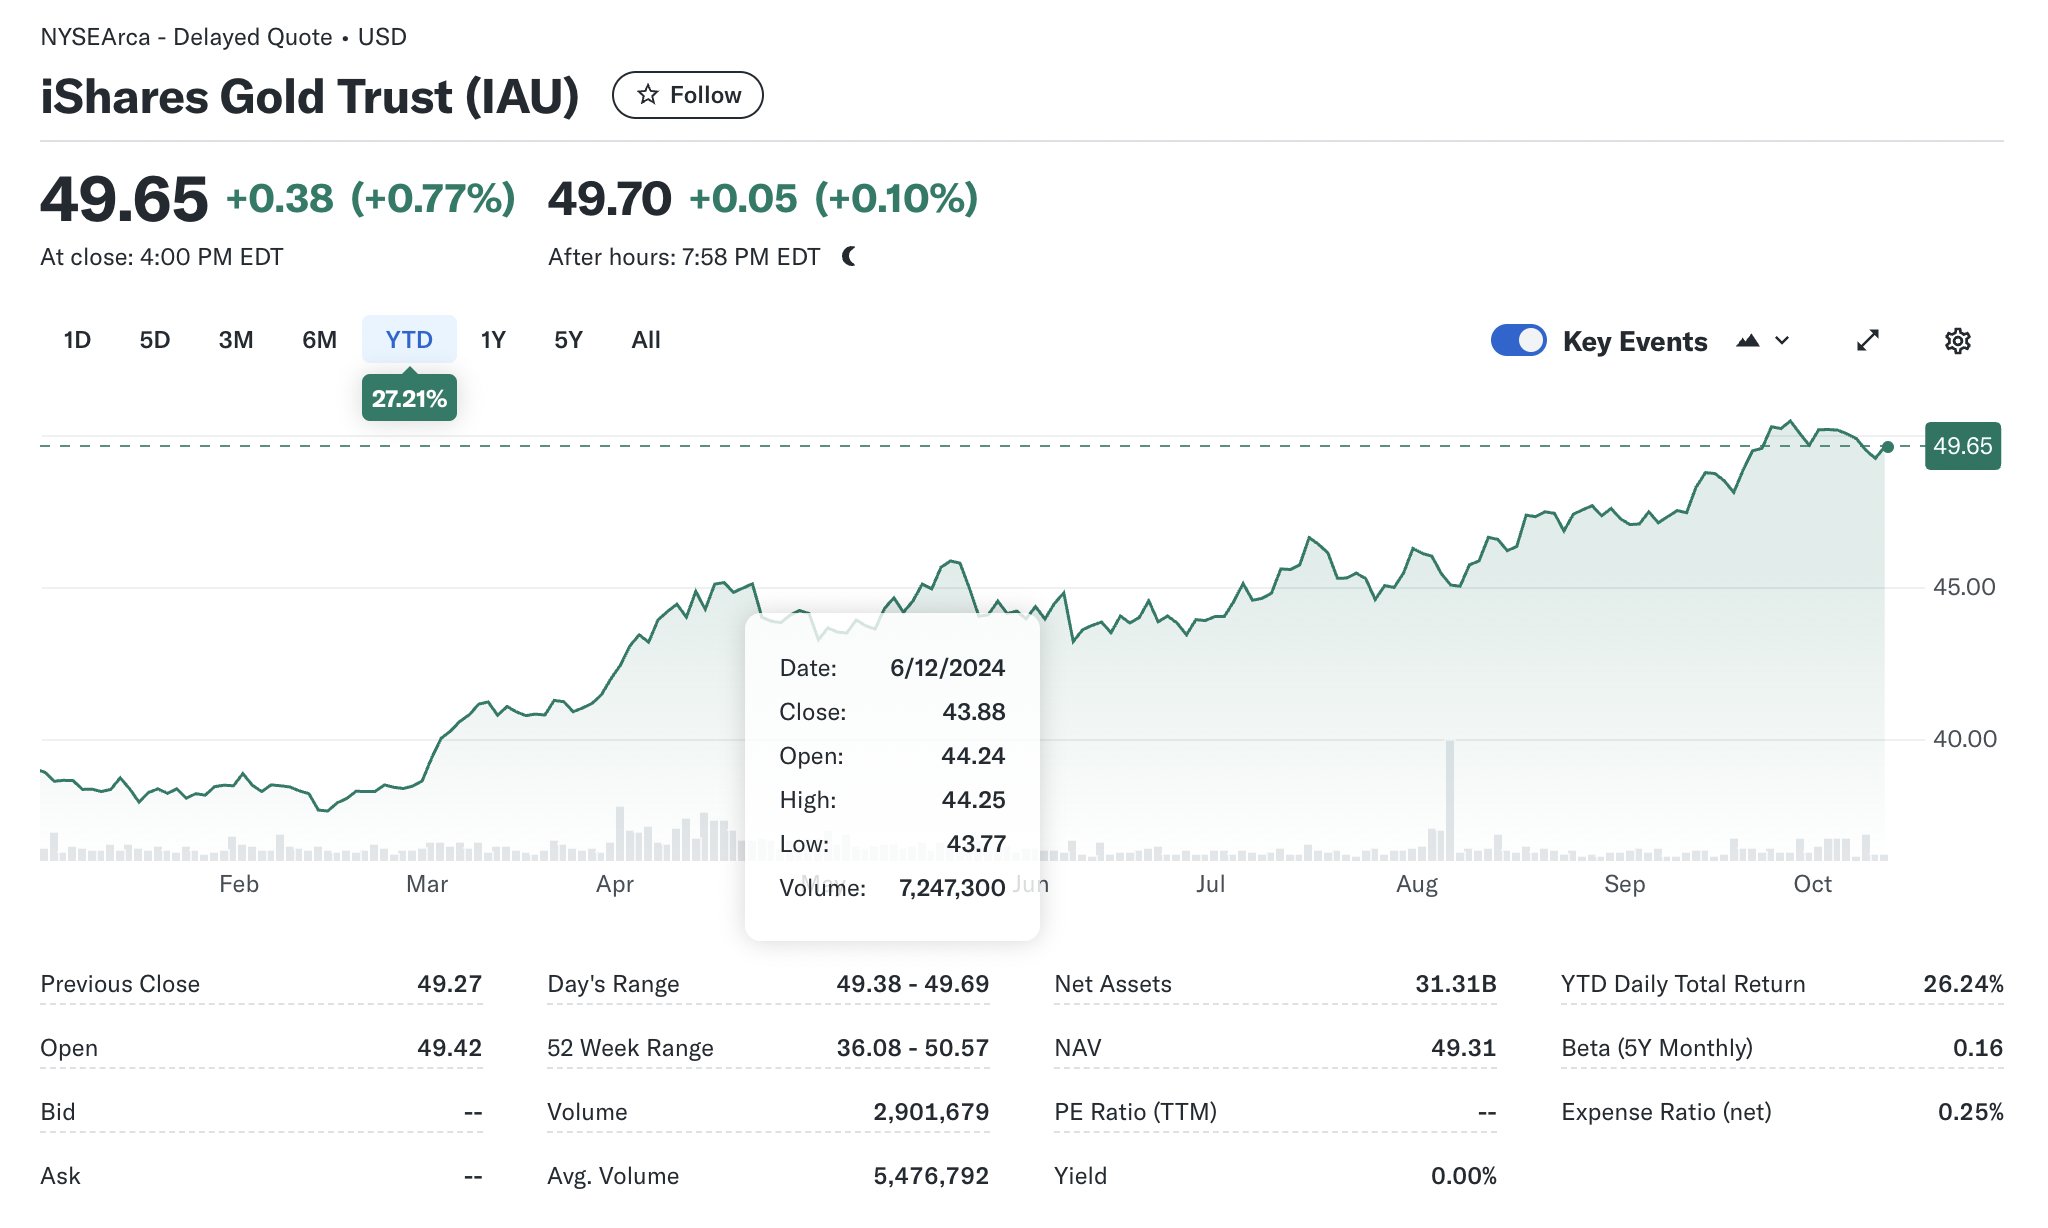
iShares Gold Trust (IAU)
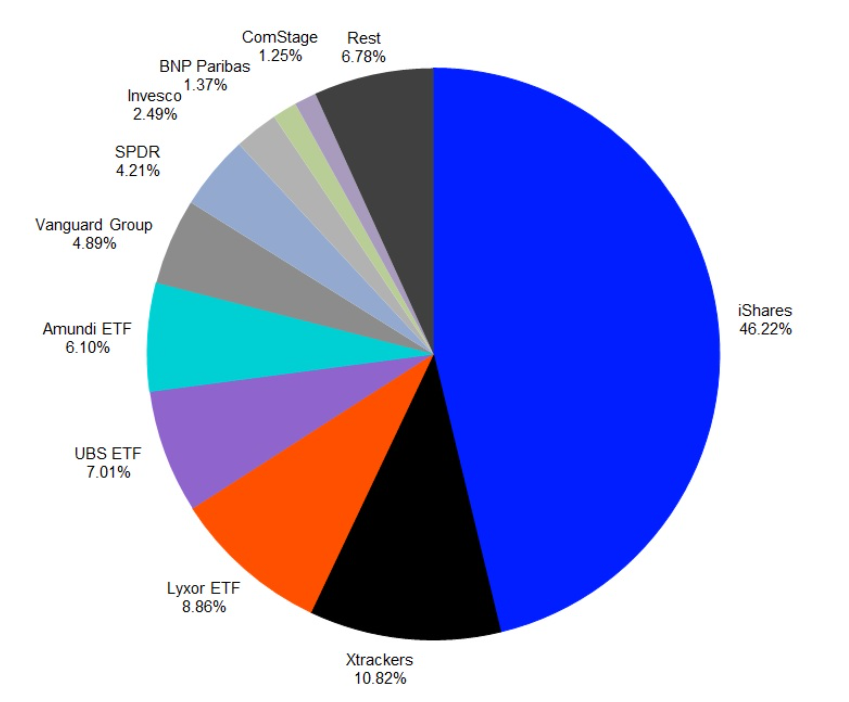
With a global lineup of 1,400+ Exchange Traded Funds (ETFs), iShares has been a leader in the ETF marketplace for more than two decades, and as a part of BlackRock, their products are engineered by investment professionals with discipline and deep risk management expertise. It has a lower expense ratio (It is the fee that investors pay to own a mutual fund or exchange-traded fund (ETF)) compared to GLD.
Figure 2 below gives the IAU share price dated from January 1, 2024, to October 11, 2024.
Figure 2. SiShares Gold Trust (IAU) share price
Source: Yahoo Finance
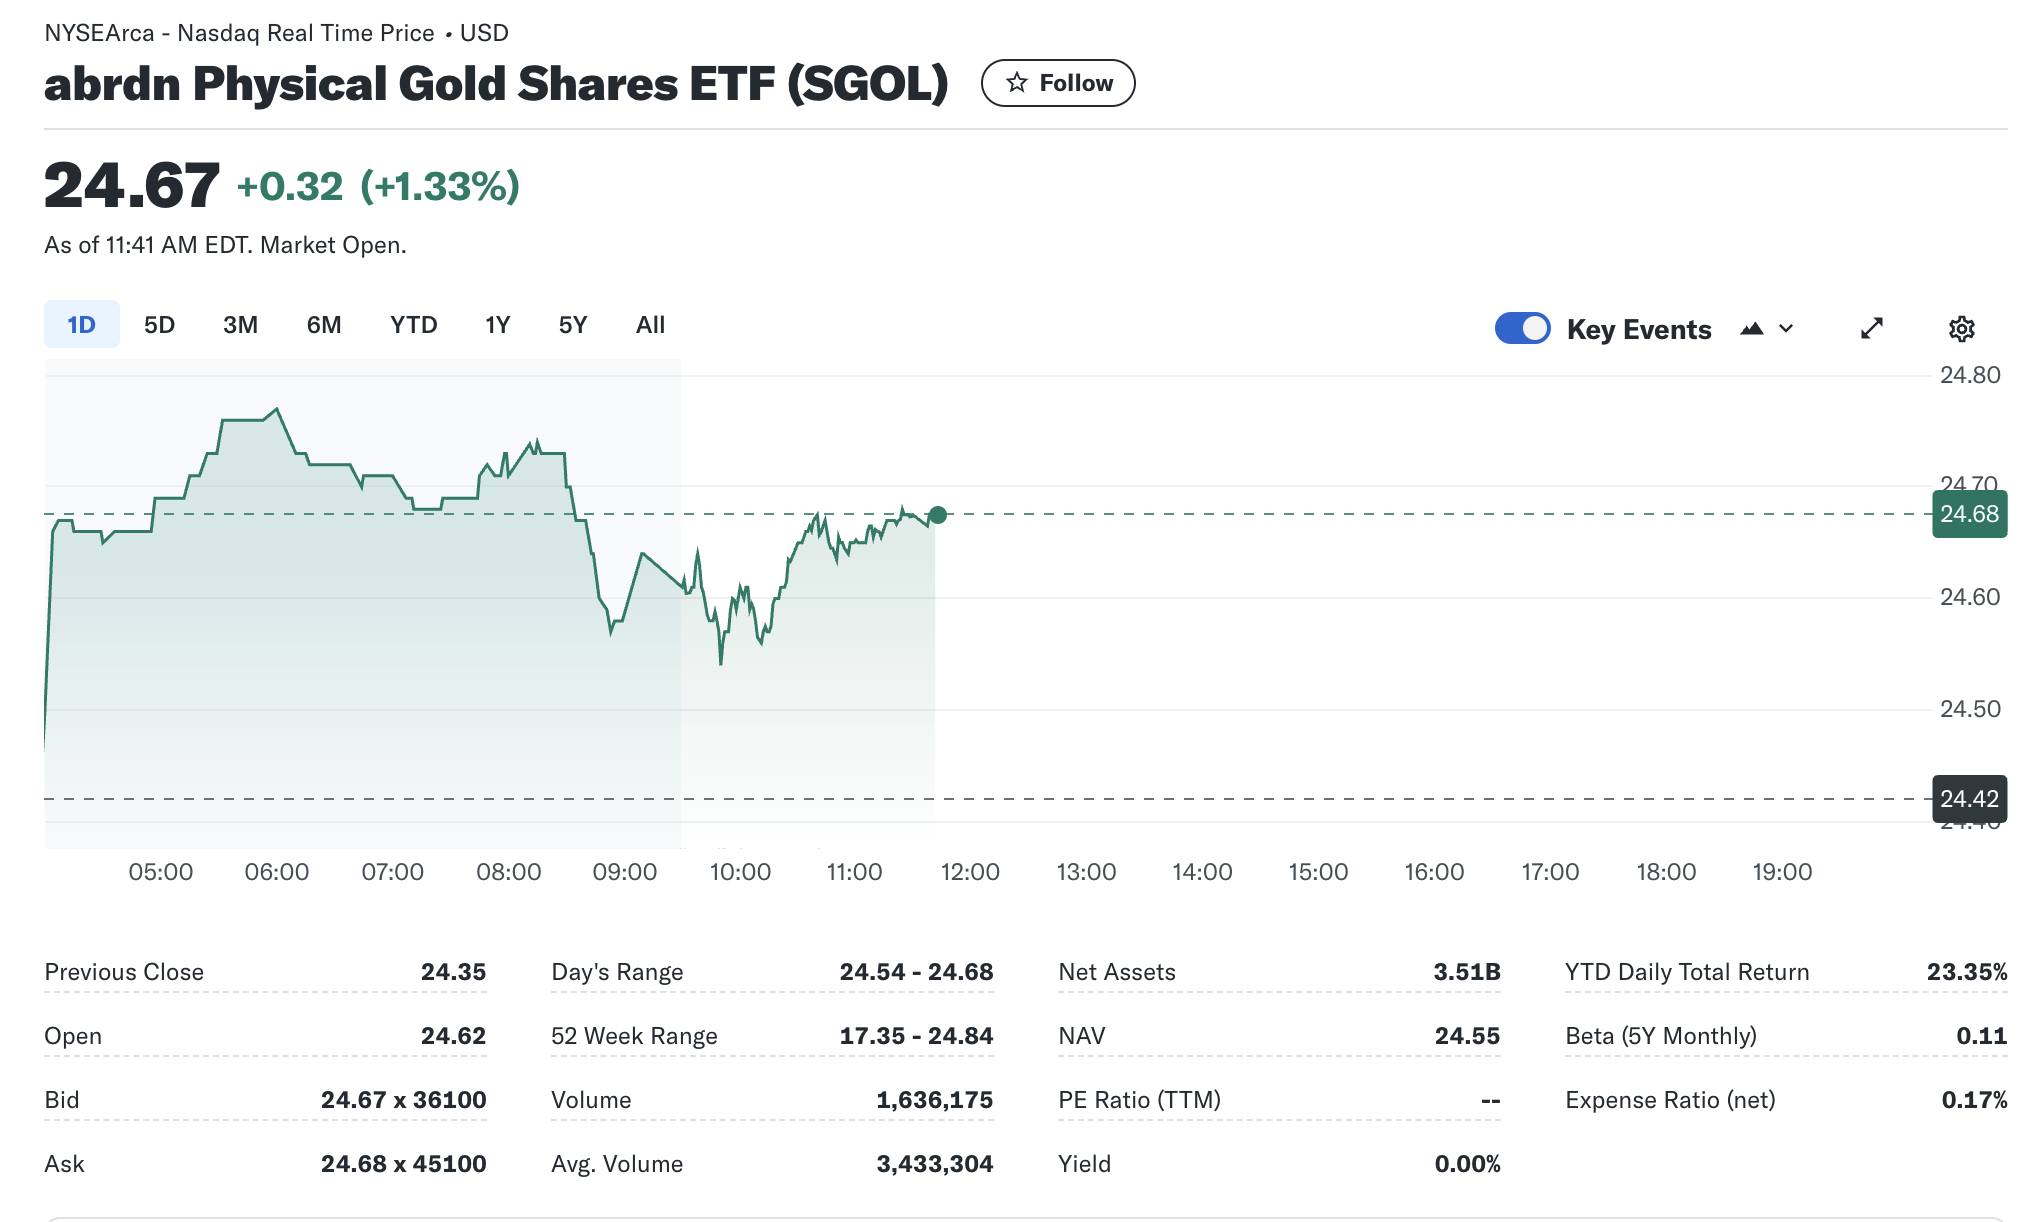
Aberdeen Standard Physical Gold Shares ETF (SGOL)
SGOL is designed to track the spot price of gold bullion by holding gold bars in a secure vault in Switzerland. The company also posts the serial numbers of the bars, giving investors further security over the status of their investment. While SGOL isn’t the most liquid way to gain exposure to gold, it could be a solid choice for investors seeking greater peace of mind regarding their precious metals investment.
Now how do we trust the data here? To maintain the authenticity of the gold ETF’s the data is monitored in three ways, independent audits, periodic physical verifications or regulatory oversights. By ensuring the accuracy of the fund’s financial reporting and the security of its gold holdings, audits help to protect investors from fraud, mismanagement, and other risks. For example, SGOL is Audited twice a year.
Figure 3. Aberdeen Standard Physical Gold Shares ETF (SGOL) share price
Source: Yahoo Finance
Comparative Analysis of Gold ETFs
Gold ETFs provide a convenient way to invest in gold without the need to physically own it. They offer benefits like easy trading, lower costs, and the ability to diversify your portfolio. However, not all gold ETFs are created equal. Here’s a comparative analysis of key factors to consider when choosing a gold ETF:
- Expense Ratios: The annual fee charged to manage the ETF. A lower expense ratio means more of your investment goes towards buying gold, rather than paying fees. Compare the expense ratios of different gold ETFs to find one with the lowest cost.
- Liquidity and Trading Volume: The ease with which an ETF can be bought or sold at a fair price. High liquidity means you can buy or sell shares quickly without significantly affecting the price. Look for ETFs with high trading volumes to ensure liquidity.
- Tracking Accuracy: The difference between an ETF’s performance and the performance of its underlying benchmark (usually the spot gold price). A lower tracking error indicates the ETF is more closely following the gold price.
- Tax Considerations: How efficiently an ETF is taxed, Tax-efficient ETFs can help you minimize your tax burden. So researching the tax implications of different gold ETFs to find one that aligns with your tax strategy is highly beneficial.
The annual management fees are different for different ETFs, which is also a key factor for the investors to choose a certain ETF to invest in. For example, SPDR Gold Shares and iShares Gold Trust charge 0.25%, Invesco Gold ETF charge 0.15% and WisdomTree Physical Gold ETF charge 0.20%.
Advantages and disadvantages of Investing in Gold ETFs
Whether the advantages or disadvantages outweigh each other depends on your circumstances and investment goals.
Advantages of Investing in Gold ETFs
High liquidity: Gold ETFs are easily tradable on stock exchanges, providing investors with quick entry and exit options. They offer a convenient way to invest in gold without the need to physically store or transport the metal.
Low costs: Investors don’t need to worry about storage and security issues associated with physical gold. Additionally, the expense ratios are generally lower than mutual funds.
Diversification: Investing in gold ETFs offers a way to diversify portfolios with exposure to gold prices, often serving as a hedge against inflation and market volatility.
Disadvantages and Risks of Gold ETFs
Counterparty Risk: If the issuer of the ETF becomes insolvent, investors may face losses.
Taxes: Capital gains taxes may apply when you sell your ETF shares.
Volatility: The price of gold can be highly volatile, and gold ETFs are no exception. Investors should be prepared for potential price fluctuations.
Storage: While gold ETFs typically store their gold in secure vaults, there’s always a risk of theft or loss.
Considerations for gold investment strategies
In the end, the best investment strategy for you will depend on your circumstances and risk tolerance. By carefully considering these factors and the potential benefits and risks associated with gold ETFs, you can make informed decisions about how to incorporate them into your investment portfolio.
Portfolio diversification: A common strategy is to add gold ETFs to your investment portfolio for diversification. Gold’s price movements often correlate negatively with stocks and bonds, providing a potential haven during market downturns. By including gold in your portfolio, you can reduce overall risk and potentially improve returns over the long term.
Hedging Against Inflation: One popular strategy is to use gold ETFs as a hedge against inflation, as gold prices tend to rise when inflation is high. This can help protect your portfolio from the eroding purchasing power of your currency. Note that academic studies (see Erb and Harvey, 2013) have shown that gold may not be a good hedge against inflation.
Conclusion
Gold remains the top choice for many investors for portfolio diversification or protection against economic instability. This precious metal has held (more or less) its value over centuries. While market prices fluctuate, many still choose to buy gold to secure their financial future.
Why should I be interested in this post?
Gold has been a key financial asset for centuries, acting as a store of value, a hedge against inflation, and a safe-haven asset during economic crises. Understanding its investment options helps students grasp fundamental market dynamics and investor behavior, especially during periods of economic uncertainty.
Related posts on the SimTrade blog
▶ Nithisha CHALLA History of Gold
▶ Nithisha CHALLA Gold resources in the world
▶ Youssef LOURAOUI ETFs in a changing asset management industry
▶ Micha FISCHER Exchange-traded funds and Tracking Error
Useful resources
Academic research
Erb, C.B., and C.R. Harvey (2013) The Golden Dilemma. Financial Analysts Journal 69 (4): 10–42. Erb, C.B., and C.R. Harvey (2024) Is there still a Golden Dilemma Working paper.Business
Gold Avenue What is a gold ETF?
SPDR Gold shares Bringing the gold market to investors
iShares gold trust (IAU) Why IAU?
Other
Wikipedia Gold
About the author
The article was written in October 2024 by Nithisha CHALLA (ESSEC Business School, Grande Ecole Program – Master in Management (MiM), 2021-2024).