In this article, Snehasish CHINARA (ESSEC Business School, Grande Ecole Program – Master in Management, 2022-2024) explains the stable coin USD Coin.
Historical context and background
USD Coin (USDC) is a type of cryptocurrency known as a stablecoin, designed to maintain a stable value relative to the US dollar (USD). It was launched in September 2018 by Centre Consortium, a collaboration between cryptocurrency exchange Coinbase and blockchain technology company Circle. The primary goal of USDC is to provide a digital asset that can be easily transferred between users and used for transactions, while minimizing the volatility typically associated with other cryptocurrencies like Bitcoin or Ethereum.
The need for stablecoins like USDC arose due to the inherent volatility of many cryptocurrencies. While Bitcoin and other digital assets have gained significant attention and adoption, their prices can fluctuate dramatically over short periods, which can make them less practical for everyday transactions and financial contracts. Stablecoins like USDC offer a solution to this problem by pegging their value to a stable asset, such as the US dollar, thereby providing stability and predictability for users.
USDC operates on the Ethereum blockchain as an ERC-20 token, making it compatible with a wide range of decentralized applications (dApps) and enabling seamless integration with the broader cryptocurrency ecosystem. This infrastructure allows users to easily send and receive USDC tokens across various platforms and services, including exchanges, wallets, and payment processors.
Since its launch, USDC has seen significant growth in adoption and usage. It has become one of the most widely used stablecoins in the cryptocurrency market, with billions of dollars worth of USDC tokens in circulation. Its stability and liquidity have made it a popular choice for traders, investors, and businesses looking to transact in digital assets without exposure to the volatility of other cryptocurrencies.
USD Coin Logo
Source: Yahoo! Finance.
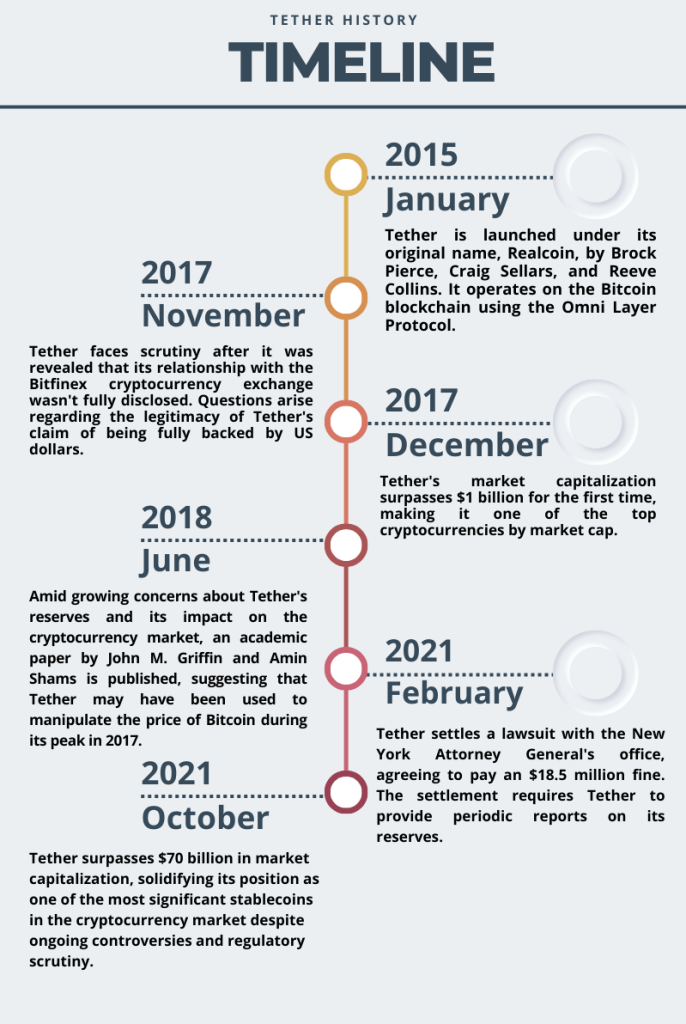
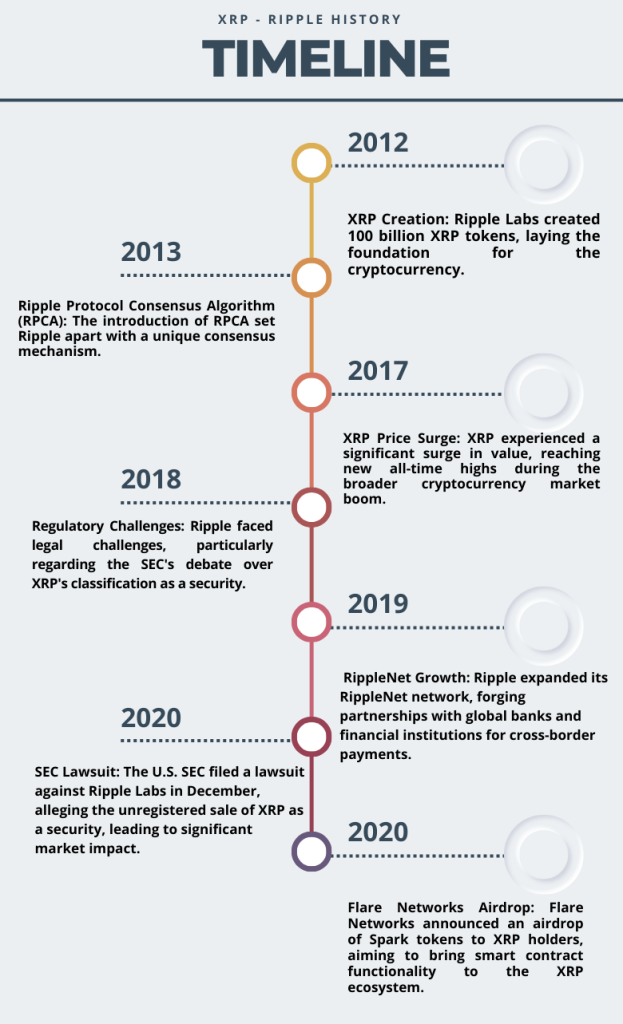
Figure 1. Key Dates in USDC History
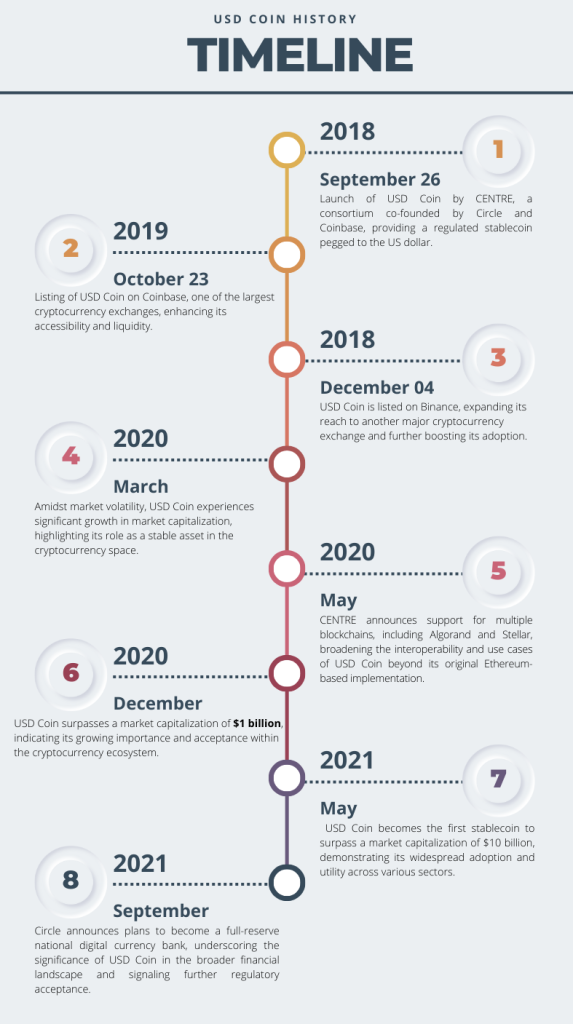
Source: Yahoo! Finance.
Key features
Stability
USD Coin is a stablecoin, meaning it is pegged to the value of the US dollar on a 1:1 basis. This stability is maintained through regular audits and backing by reserves of US dollars held in custody by regulated financial institutions.
Transparency
USDC operates on blockchain technology, providing transparency and immutability of transactions. Every USDC token is backed by an equivalent number of US dollars held in reserve, which is regularly audited and transparently reported to ensure trust among users.
Speed and Efficiency
Transactions involving USDC can be executed quickly and efficiently on blockchain networks, enabling near-instantaneous settlement compared to traditional banking systems, which may take days for cross-border transactions.
Global Accessibility
USDC enables borderless transactions, allowing users to send and receive payments globally without the need for intermediaries such as banks. This accessibility empowers individuals and businesses, particularly in regions with limited access to traditional financial services.
Interoperability
USDC is compatible with various blockchain platforms and protocols, including Ethereum, Algorand, and Solana, among others. This interoperability facilitates its integration into a wide range of decentralized applications (DApps) and decentralized finance (DeFi) ecosystems.
Use cases
Remittances and Cross-Border Payments:
USDC provides a cost-effective and efficient solution for remittance payments and cross-border transactions, enabling individuals and businesses to transfer value across borders quickly and securely without the need for traditional banking intermediaries.
Stable Value Storage
Due to its stable value pegged to the US dollar, USDC serves as a reliable store of value and a hedge against volatility in the cryptocurrency market. Users can hold USDC as a stable asset to preserve purchasing power and mitigate the risks associated with price fluctuations in other cryptocurrencies.
Decentralized Finance (DeFi) Applications
USDC is widely used as a liquidity provider and collateral asset in various DeFi protocols and applications such as decentralized exchanges (DEXs), lending platforms, yield farming, and liquidity pools. Users can leverage USDC to earn interest, borrow assets, or participate in yield farming strategies within the DeFi ecosystem.
Commerce and Payments
Merchants and businesses can accept USDC as a form of payment for goods and services, leveraging its fast transaction settlement times and low transaction fees compared to traditional payment methods. Integrating USDC payments can streamline cross-border commerce and reduce friction associated with fiat currency conversions.
Financial Inclusion
USDC plays a crucial role in expanding financial inclusion by providing access to digital financial services for individuals and communities underserved by traditional banking infrastructure. By utilizing blockchain technology and stablecoins like USDC, individuals without access to traditional banking services can participate in the global economy and access a wide range of financial products and services.
Technology and underlying blockchain
USD Coin (USDC) operates on a blockchain-based infrastructure, primarily leveraging the Ethereum blockchain as its foundation. Utilizing Ethereum’s smart contract functionality, USDC tokens are issued, transferred, and redeemed in a transparent and trustless manner. The ERC-20 standard, a set of rules and protocols defining interactions between tokens on the Ethereum network, governs the behavior of USDC tokens, ensuring compatibility with a wide range of wallets, exchanges, and decentralized applications (DApps). Moreover, USDC employs a consortium model for governance and operation, with regulated financial institutions serving as members responsible for the issuance, custody, and redemption of USDC tokens. These institutions adhere to strict regulatory compliance measures and conduct regular audits to verify that each USDC token is fully backed by an equivalent reserve of US dollars held in custody. This combination of blockchain technology, smart contracts, and regulatory oversight ensures the integrity, transparency, and stability of USD Coin, making it a trusted and widely adopted stablecoin within the cryptocurrency ecosystem.
ERC-20 Standard of Ethereum for USD Coin
The ERC-20 standard, short for Ethereum Request for Comment 20, is a widely adopted technical specification governing the creation and implementation of fungible tokens on the Ethereum blockchain. Introduced by Fabian Vogelsteller and Vitalik Buterin in 2015, ERC-20 defines a set of rules and functions that enable seamless interoperability between different tokens, ensuring compatibility with various decentralized applications (DApps) and wallets. Tokens adhering to the ERC-20 standard are characterized by a consistent set of methods, including transfer, balance inquiry, and approval mechanisms, facilitating easy integration and widespread adoption across the Ethereum ecosystem. This standardization has played a pivotal role in the proliferation of tokenization, empowering developers to create diverse tokenized assets, conduct crowdfunding campaigns through Initial Coin Offerings (ICOs), and establish decentralized exchanges (DEXs) where ERC-20 tokens are traded autonomously. Additionally, ERC-20 compliance enhances security and interoperability, fostering trust and usability within the Ethereum network.
Supply of coins
The supply dynamics of USD Coin (USDC) are governed by its underlying smart contract protocol and the management of its issuer, Centre Consortium, a collaboration between Circle and Coinbase. USDC operates on a principle of full backing, where each USDC token issued is backed by an equivalent number of US dollars held in reserve. This backing ensures a 1:1 peg to the US dollar, maintaining its stability. The issuance and redemption of USDC are facilitated through regulated financial institutions that hold the corresponding fiat reserves. Moreover, USDC’s supply is transparently audited on a regular basis, with attestations provided by reputable auditing firms to verify the adequacy of reserves. Through these mechanisms, the supply of USDC remains elastic, expanding or contracting based on market demand while preserving its stability and trustworthiness as a stablecoin in the digital asset ecosystem.
Historical data for USDC
How to get the data?
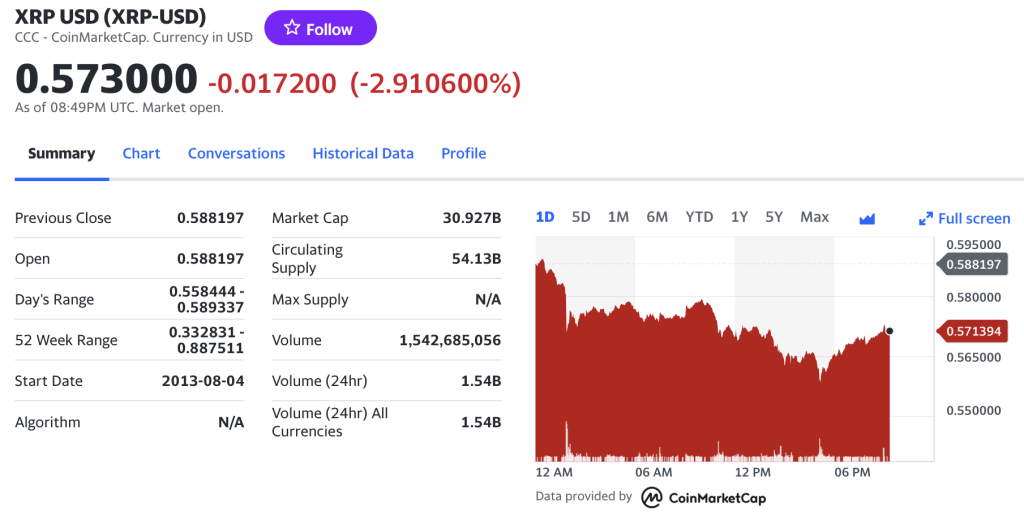
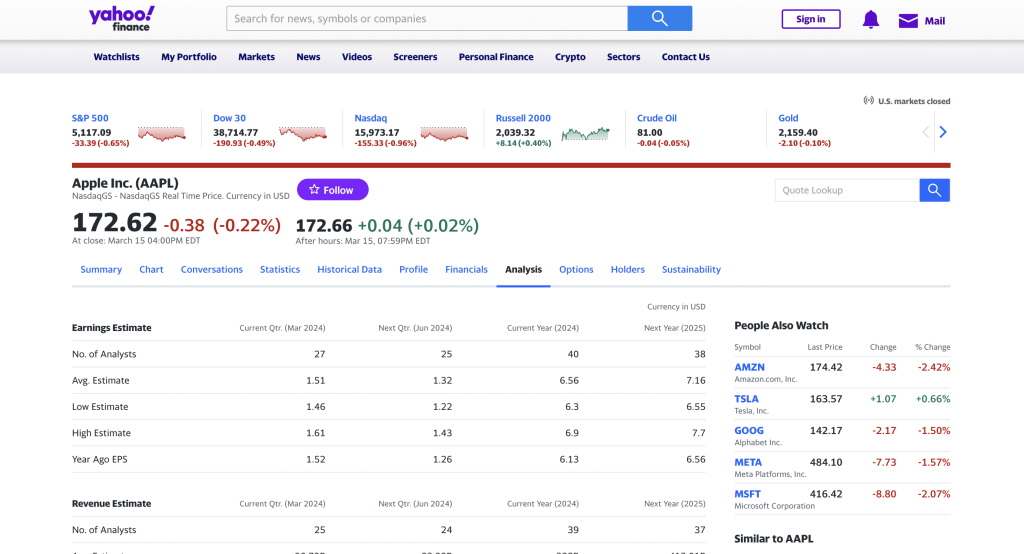
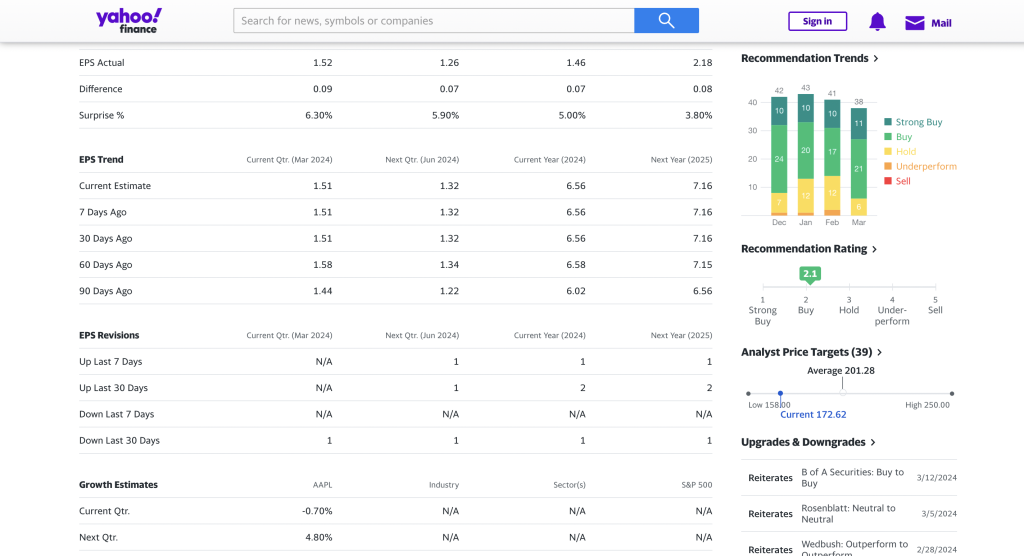
The USDC is popular cryptocurrency on the market, and historical data for the USDC such as prices and volume traded can be easily downloaded from the internet sources such as Yahoo! Finance, Blockchain.com & CoinMarketCap. For example, you can download data for USDC on Yahoo! Finance (the Yahoo! code for USD Coin is USDC-USD).
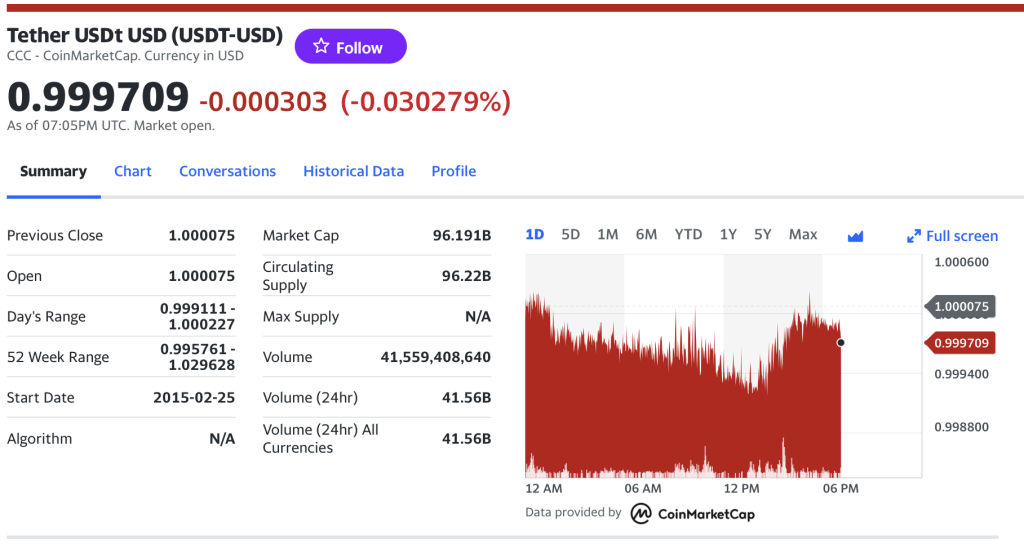
Figure 2. USD Coin data
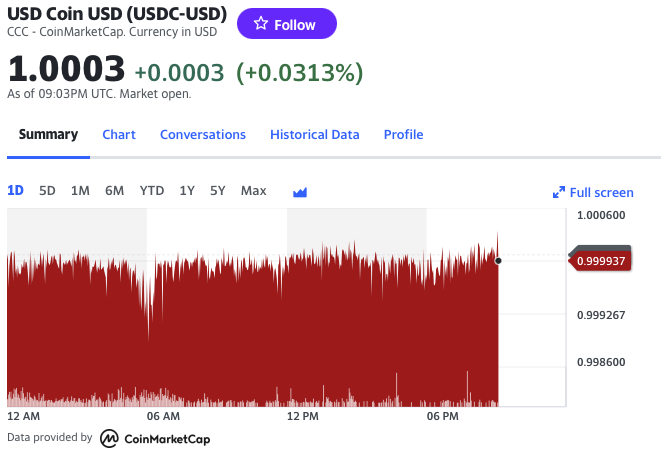
Source: Yahoo! Finance.
Historical data for the USD Coin market prices
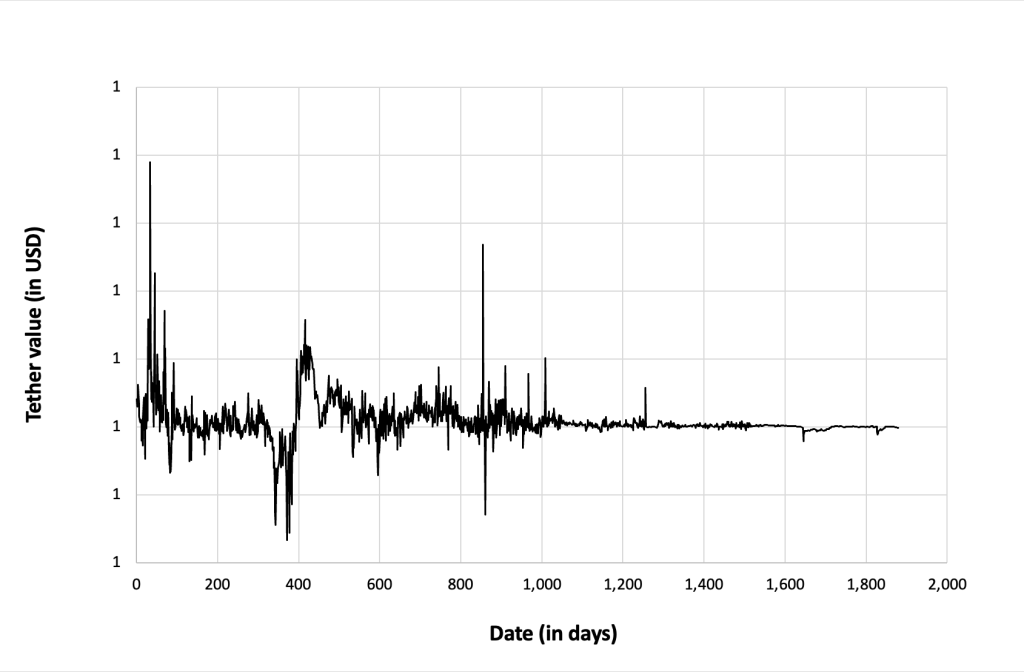
The historical market price of USD Coin (USDC) has remained relatively stable, as its primary function is to maintain a value pegged to the US dollar at a 1:1 ratio. Since its inception, USDC has consistently traded around the $1 mark, with minor fluctuations typically attributed to market dynamics and liquidity conditions. Investors and traders often utilize USDC as a safe haven asset or a means of temporarily exiting volatile cryptocurrency markets, contributing to its stability. This stability has made USDC a preferred choice for individuals and institutions seeking to hedge against cryptocurrency volatility or facilitate seamless transitions between digital and fiat currencies. Additionally, the transparent backing of USDC by reserves of US dollars held in custody by regulated financial institutions further enhances market confidence and contributes to its stable market price over time.The historical market price of USD Coin (USDC) has remained relatively stable, as its primary function is to maintain a value pegged to the US dollar at a 1:1 ratio. Since its inception, USDC has consistently traded around the $1 mark, with minor fluctuations typically attributed to market dynamics and liquidity conditions. Investors and traders often utilize USDC as a safe haven asset or a means of temporarily exiting volatile cryptocurrency markets, contributing to its stability. This stability has made USDC a preferred choice for individuals and institutions seeking to hedge against cryptocurrency volatility or facilitate seamless transitions between digital and fiat currencies. Additionally, the transparent backing of USDC by reserves of US dollars held in custody by regulated financial institutions further enhances market confidence and contributes to its stable market price over time.
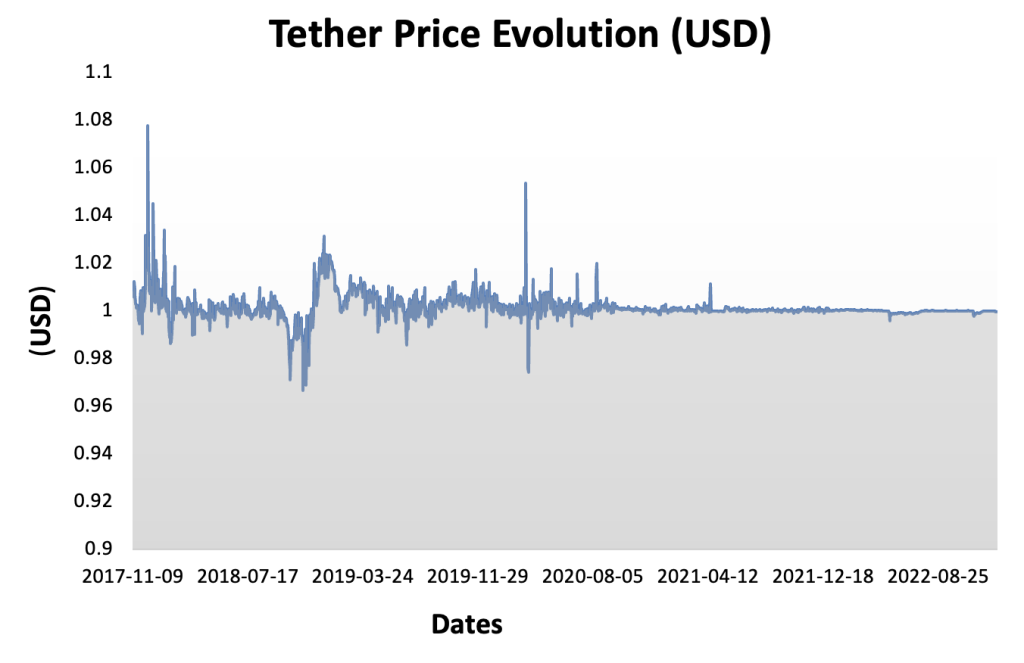
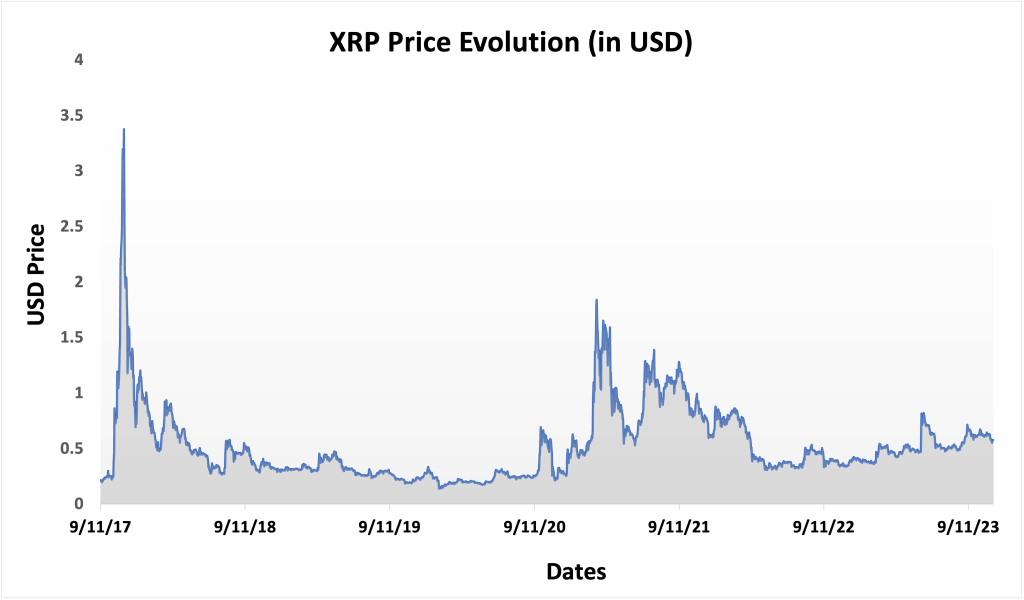
Figure 3 below represents the evolution of the price of USD Coin in US dollar over the period Oct 2018 – Dec 2022. The price corresponds to the “closing” price (observed at 10:00 PM CET at the end of the month).
Figure 3. Evolution of the USD Coin price
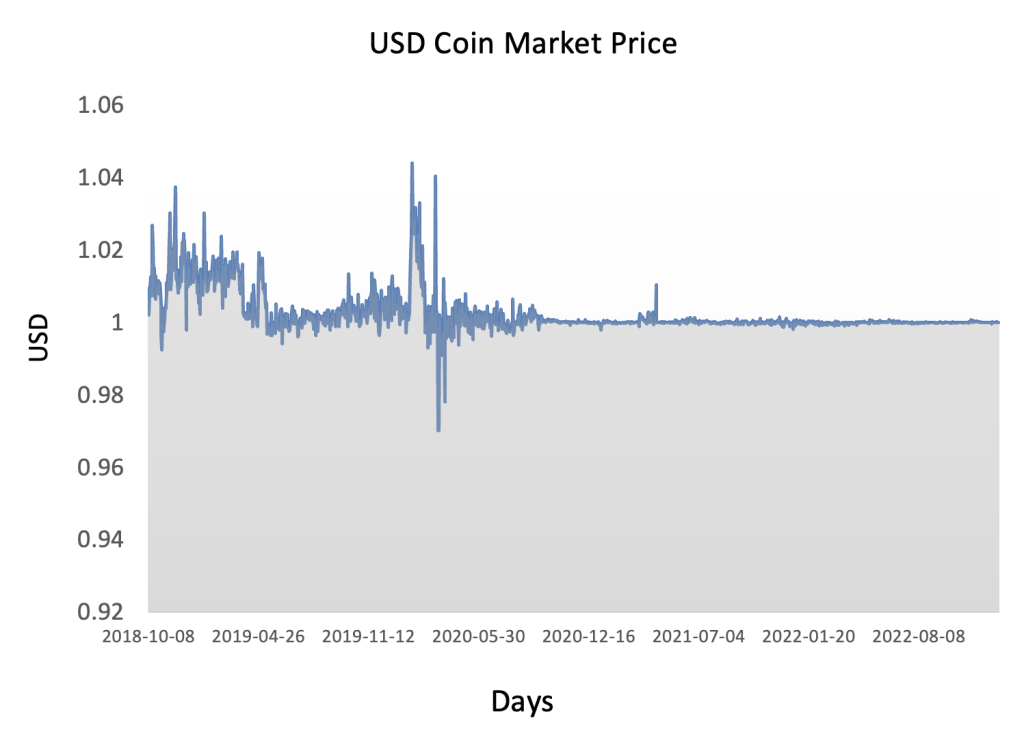
Source: Yahoo! Finance.
R program
The R program below written by Shengyu ZHENG allows you to download the data from Yahoo! Finance website and to compute summary statistics and risk measures about the USD Coin.

Data file
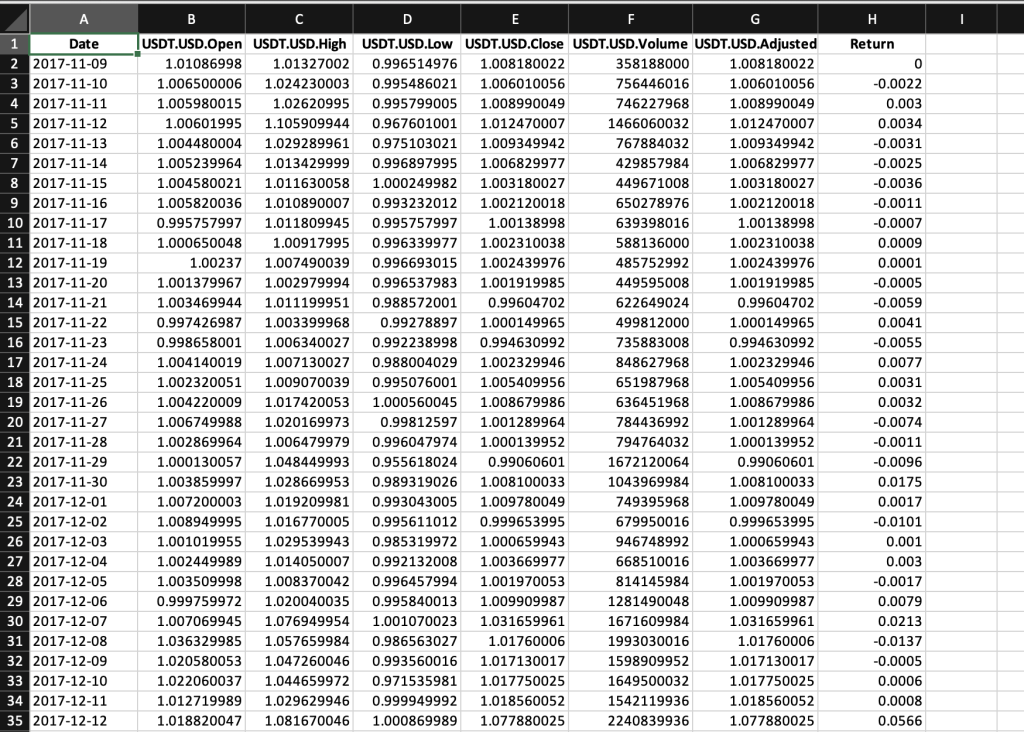
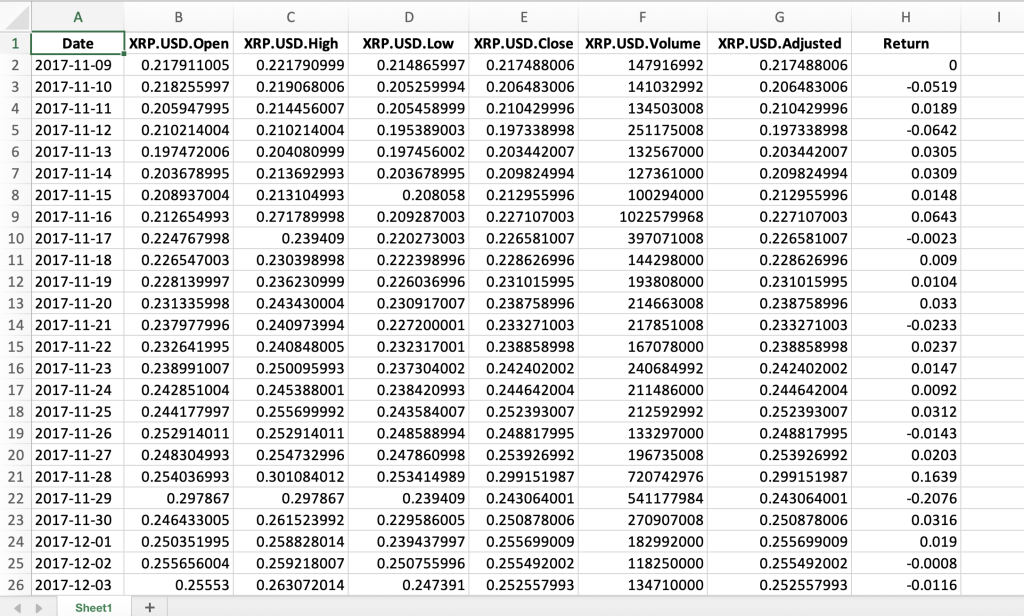
The R program that you can download above allows you to download the data for the USD Coin from the Yahoo! Finance website. The database starts on Oct, 2018. Table 1 below represents the top of the data file for the USD Coin downloaded from the Yahoo! Finance website with the R program.
Table 1. Top of the data file for the USD Coin
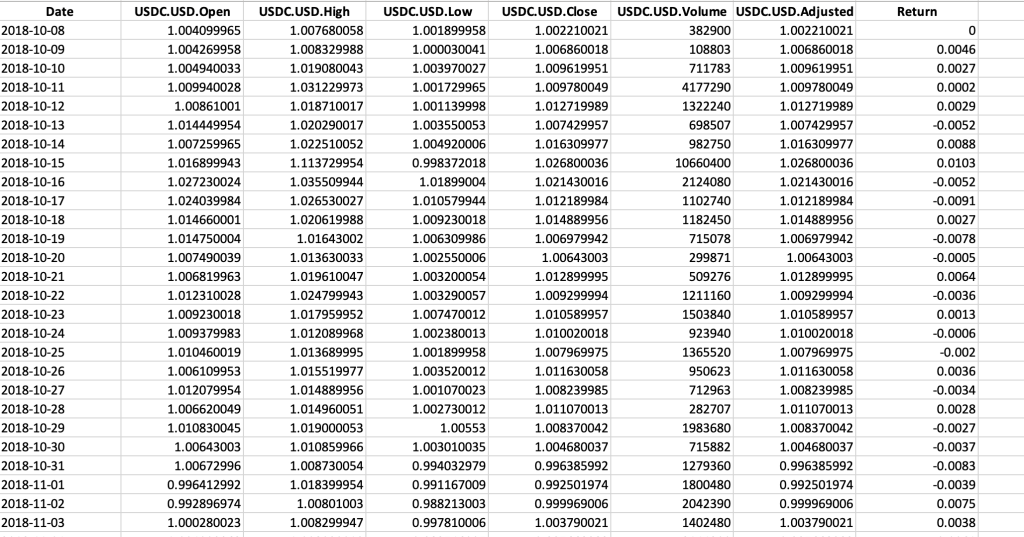
Source: computation by the author (data: Yahoo! Finance website).
Python code
You can download the Python code used to download the data from Yahoo! Finance.

Python script to download USD Coin historical data and save it to an Excel sheet::
import yfinance as yf
import pandas as pd
# Define the ticker symbol for USD Coin
usdc_ticker = “USDC-USD”
# Define the date range for historical data
start_date = “2020-01-01”
end_date = “2022-01-01”
# Download historical data using yfinance
usdc_data = yf.download(usdc_ticker, start=start_date, end=end_date)
# Create a Pandas DataFrame from the downloaded data
usdc_df = pd.DataFrame(usdc_data)
# Define the Excel file path
excel_file_path = “USDC_historical_data.xlsx”
# Save the data to an Excel sheet
usdc_df.to_excel(excel_file_path, sheet_name=”USDC Historical Data”)
print(f”Data saved to {excel_file_path}”)
# Make sure you have the required libraries installed and adjust the “start_date” and “end_date” variables to the desired date range for the historical data you want to download.
Evolution of the USD Coin
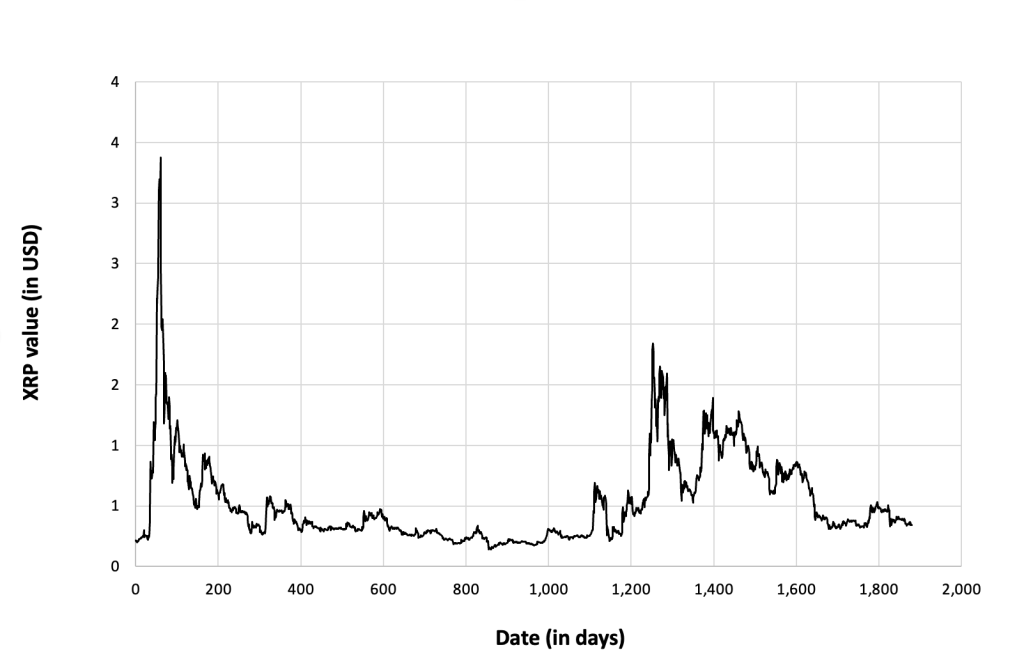
Figure 4 below gives the evolution of the USDC on a daily basis.
Figure 4. Evolution of the USD Coin.
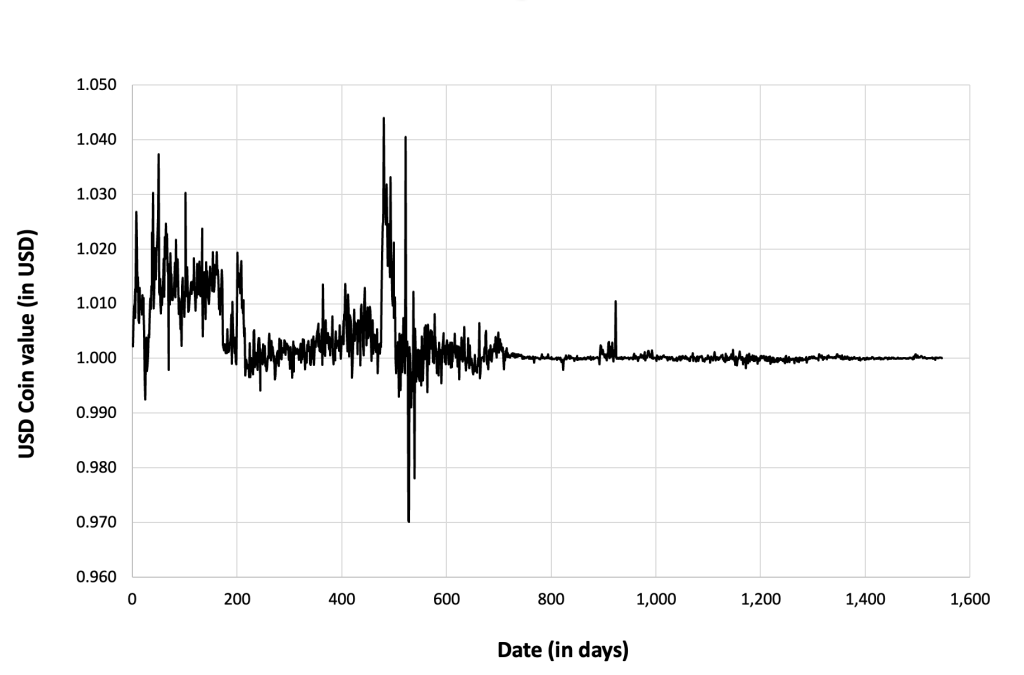
Source: computation by the author (data: Yahoo! Finance website).
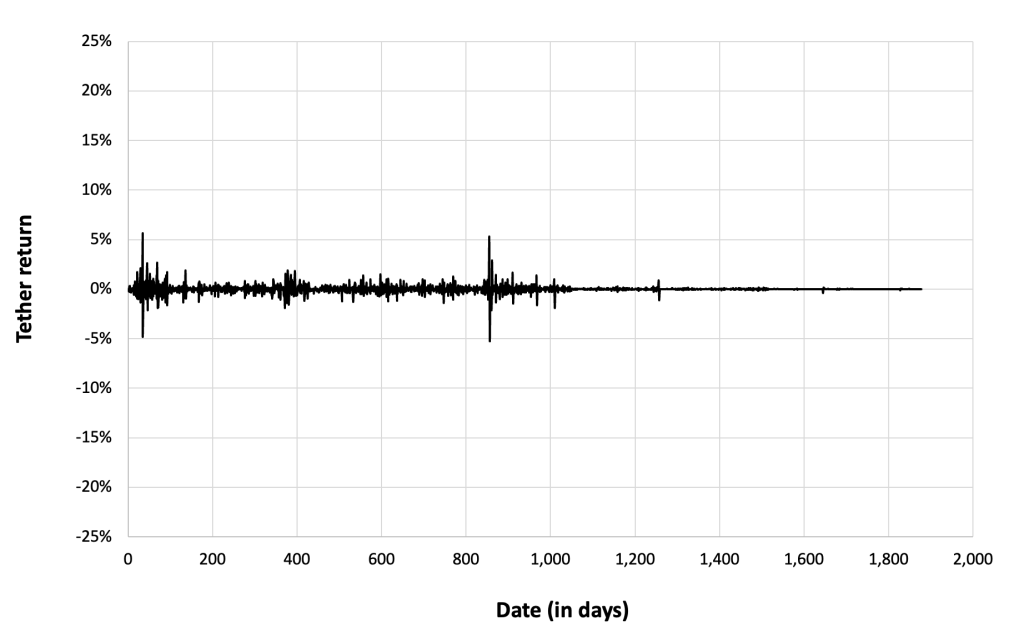
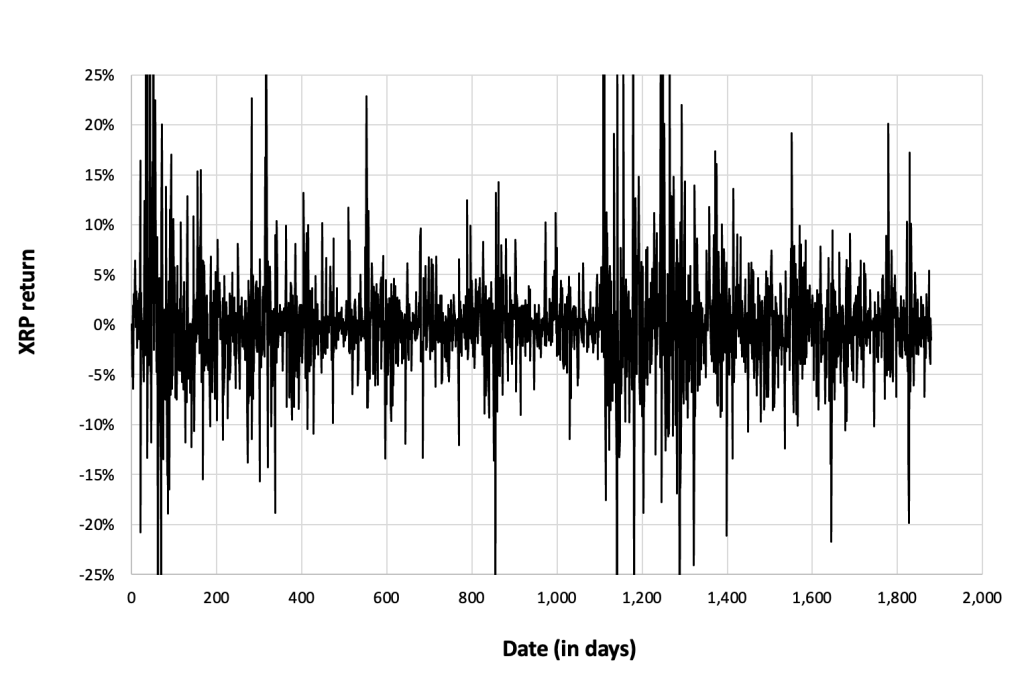
Figure 5 below gives the evolution of the USD Coin returns from Oct, 2018 to December 31, 2022 on a daily basis.
Figure 5. Evolution of the USD Coin returns
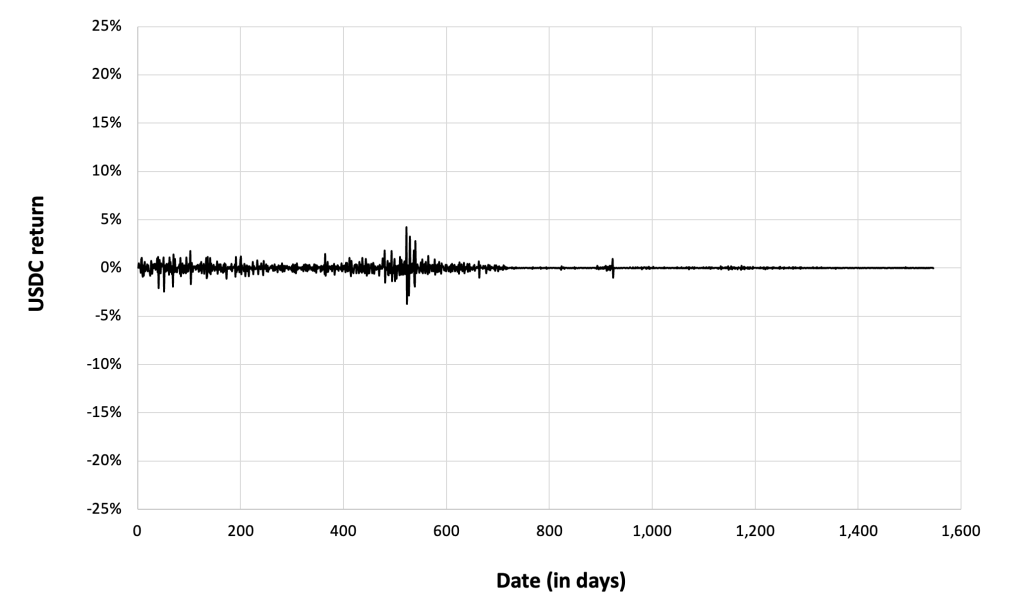
Source: computation by the author (data: Yahoo! Finance website).
Summary statistics for the USD Coin
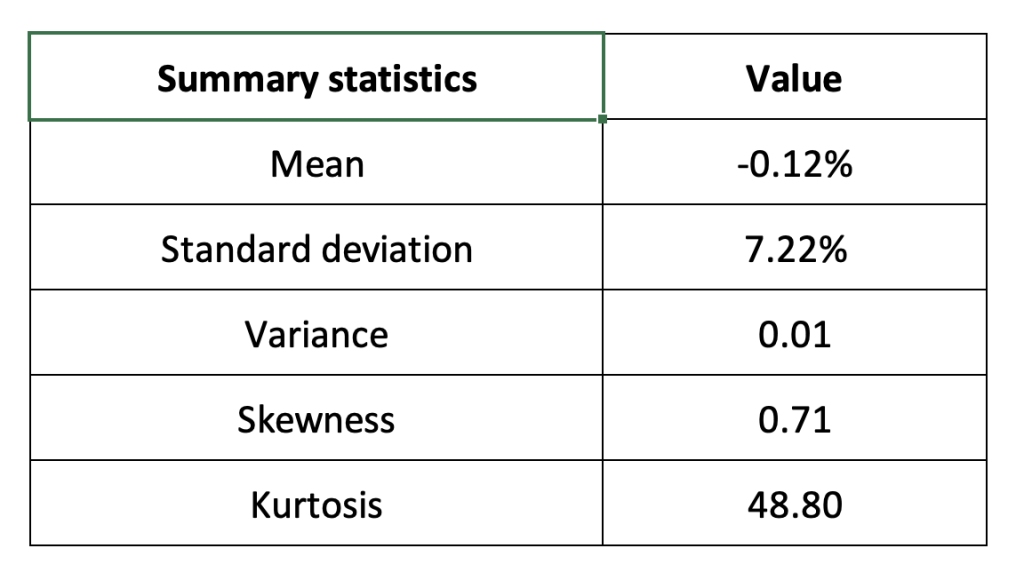
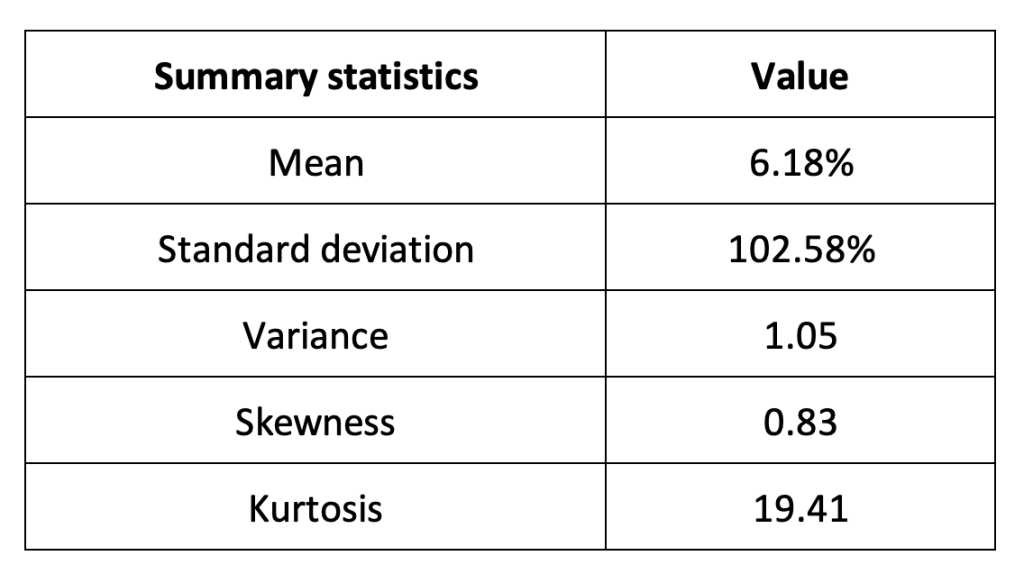
The R program that you can download above also allows you to compute summary statistics about the returns of the USD Coin. Table 2 below presents the following summary statistics estimated for the USD Coin:
- The mean
- The standard deviation (the squared root of the variance)
- The skewness
- The kurtosis.
The mean, the standard deviation / variance, the skewness, and the kurtosis refer to the first, second, third and fourth moments of statistical distribution of returns respectively.
Table 2. Summary statistics for USDC.
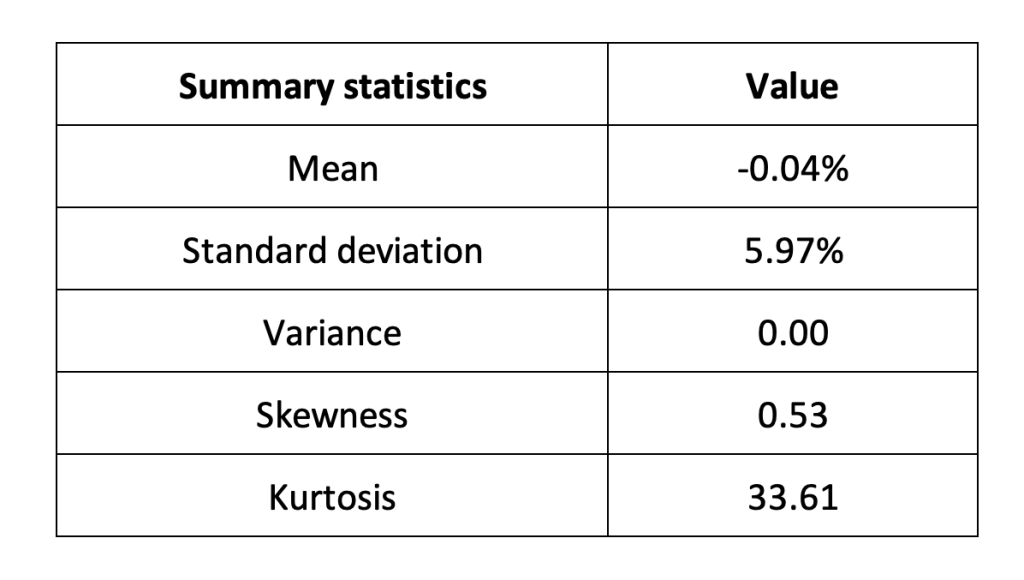
Source: computation by the author (data: Yahoo! Finance website).
Statistical distribution of the USD Coin returns
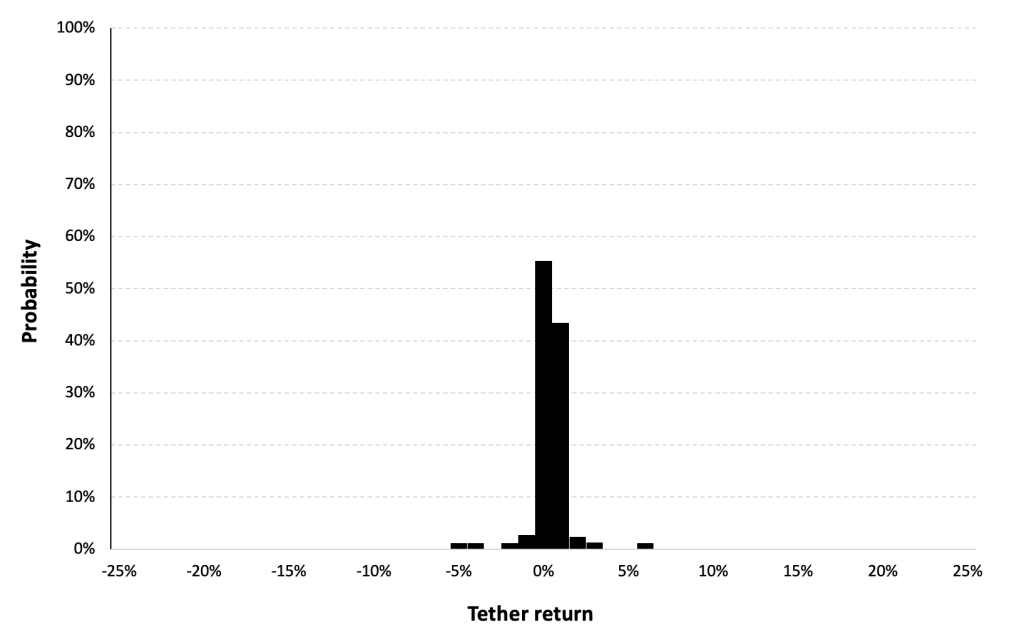
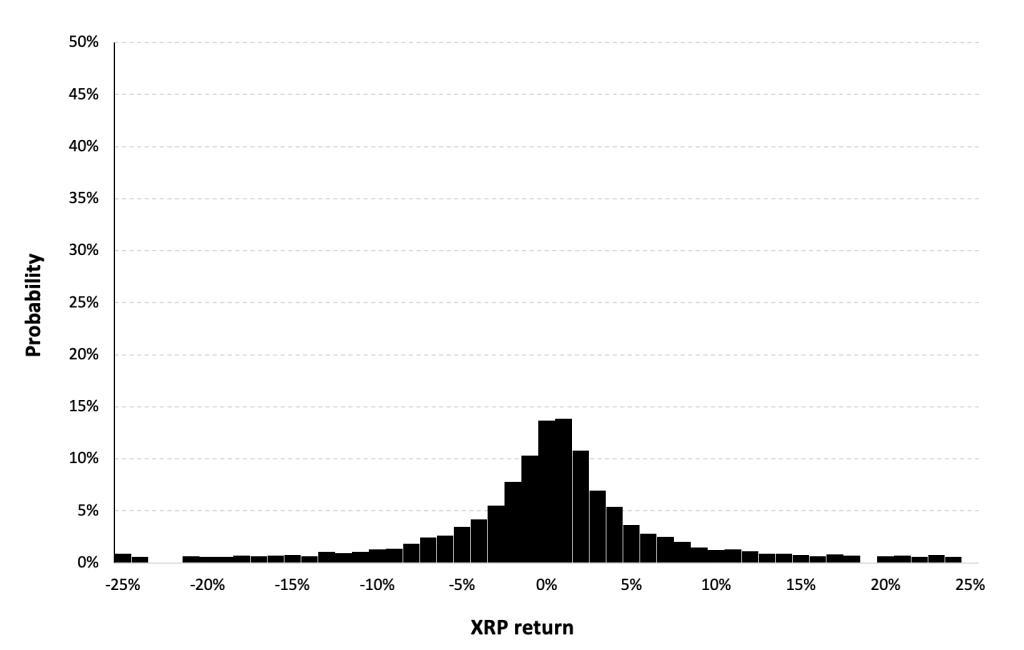
Historical distribution
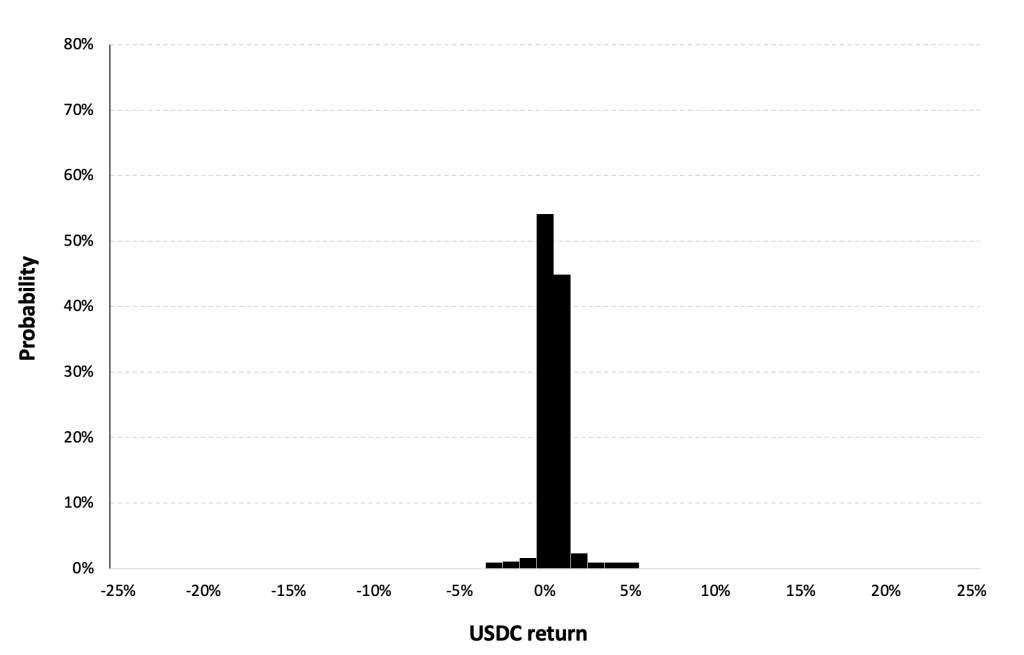
Figure 6 represents the historical distribution of the USD Coin daily returns for the period from Oct, 2018 to December 31, 2022.
Figure 6. Historical USDC distribution of the returns.
Source: computation by the author (data: Yahoo! Finance website).
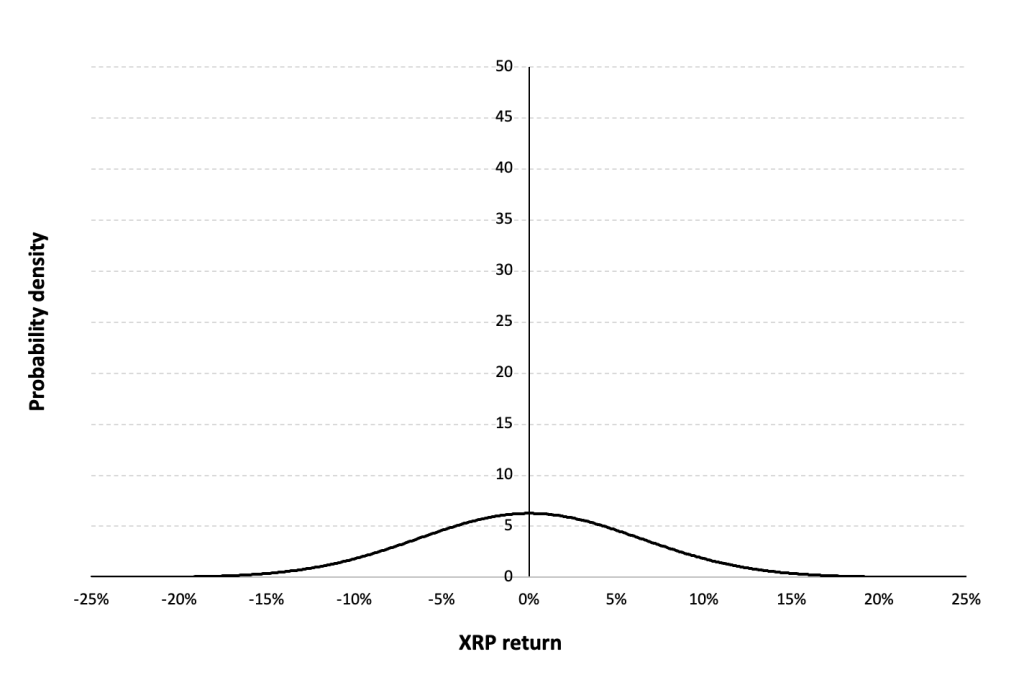
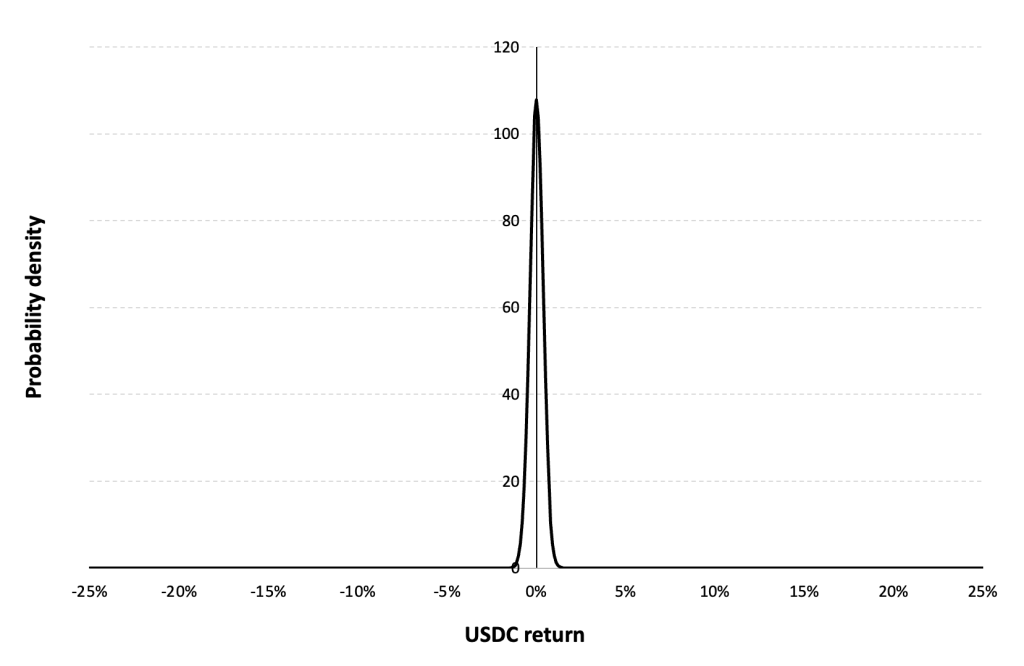
Gaussian distribution
The Gaussian distribution (also called the normal distribution) is a parametric distribution with two parameters: the mean and the standard deviation of returns. We estimated these two parameters over the period from October, 2018 to December 31, 2022.
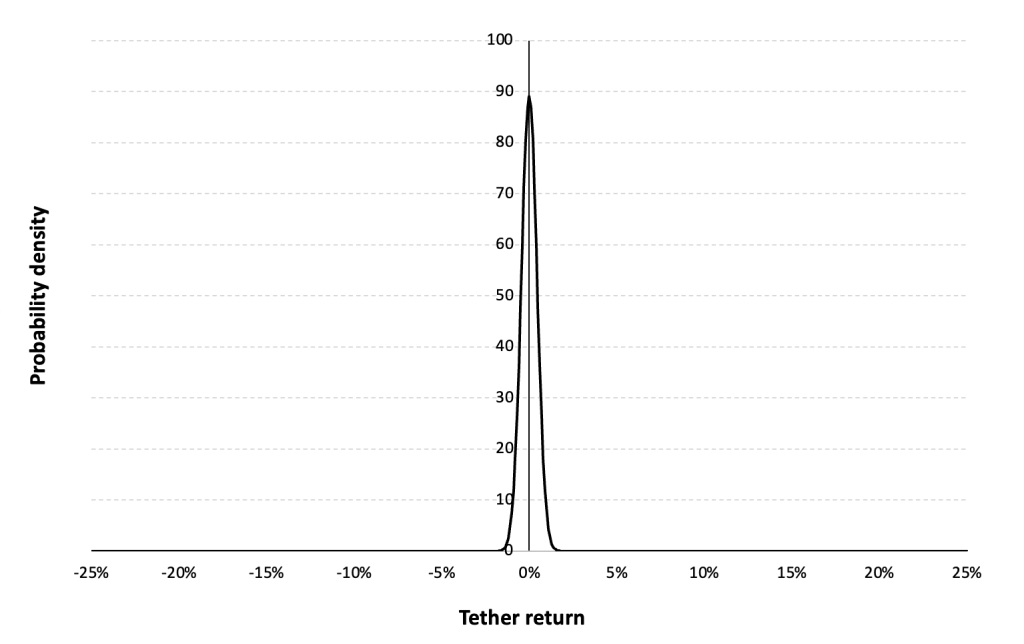
Figure 7 below represents the Gaussian distribution of the USD Coin daily returns with parameters estimated over the period from October, 2018 to December, 2022.
Figure 7. Gaussian distribution of the USDC returns.
Source: computation by the author (data: Yahoo! Finance website).
Risk measures of the USD Coin returns
The R program that you can download above also allows you to compute risk measures about the returns of the USD Coin.
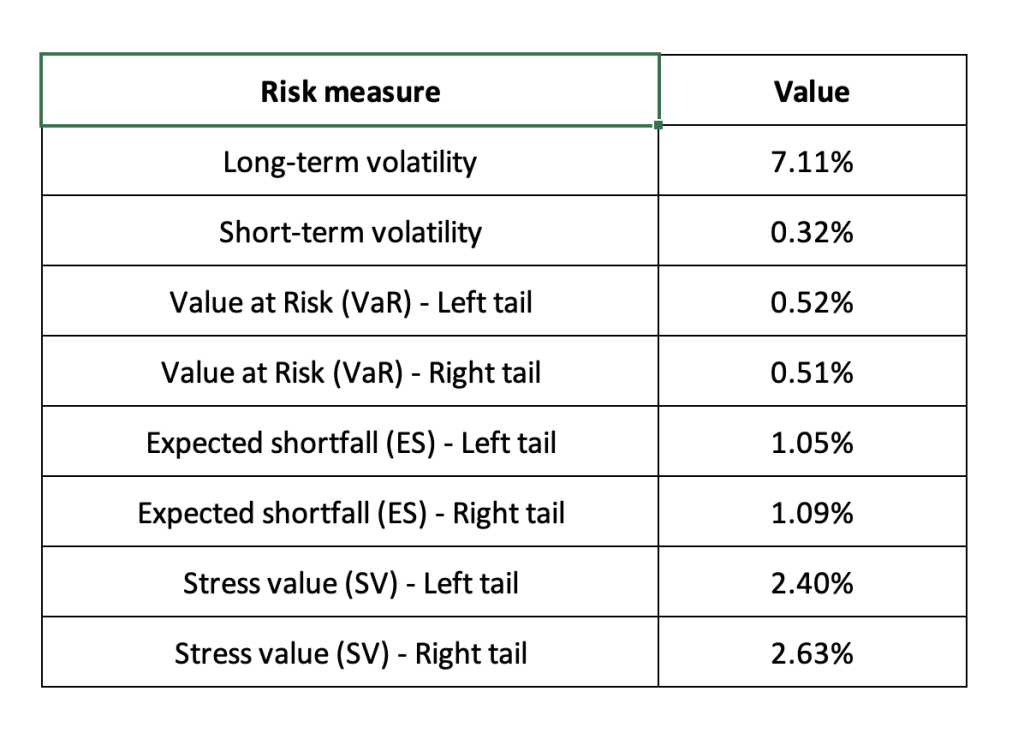
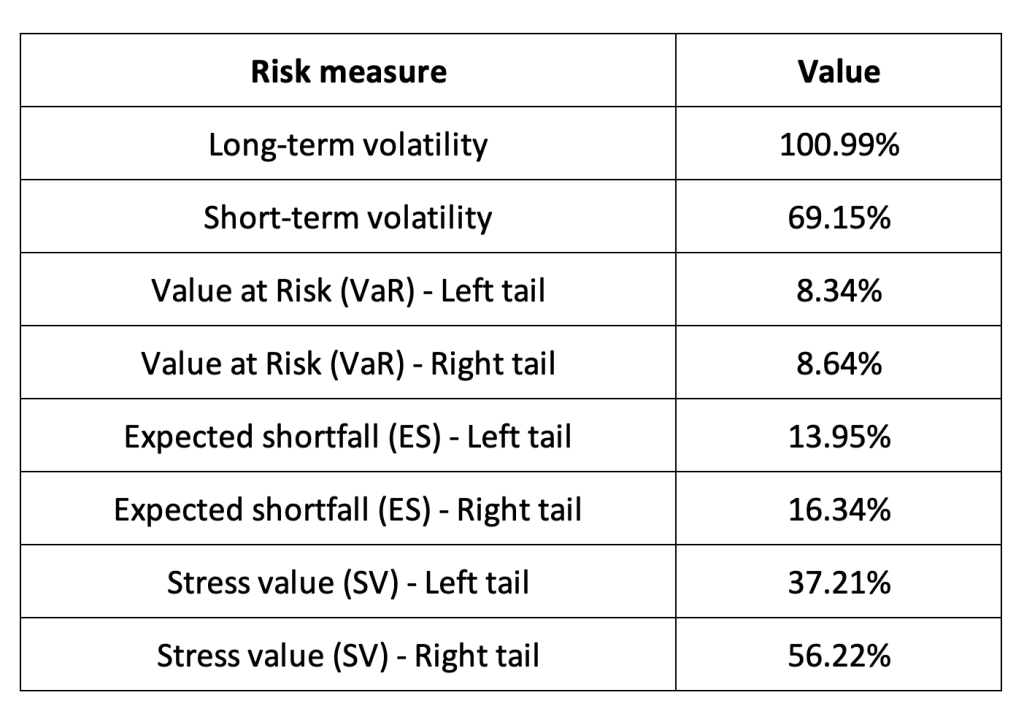
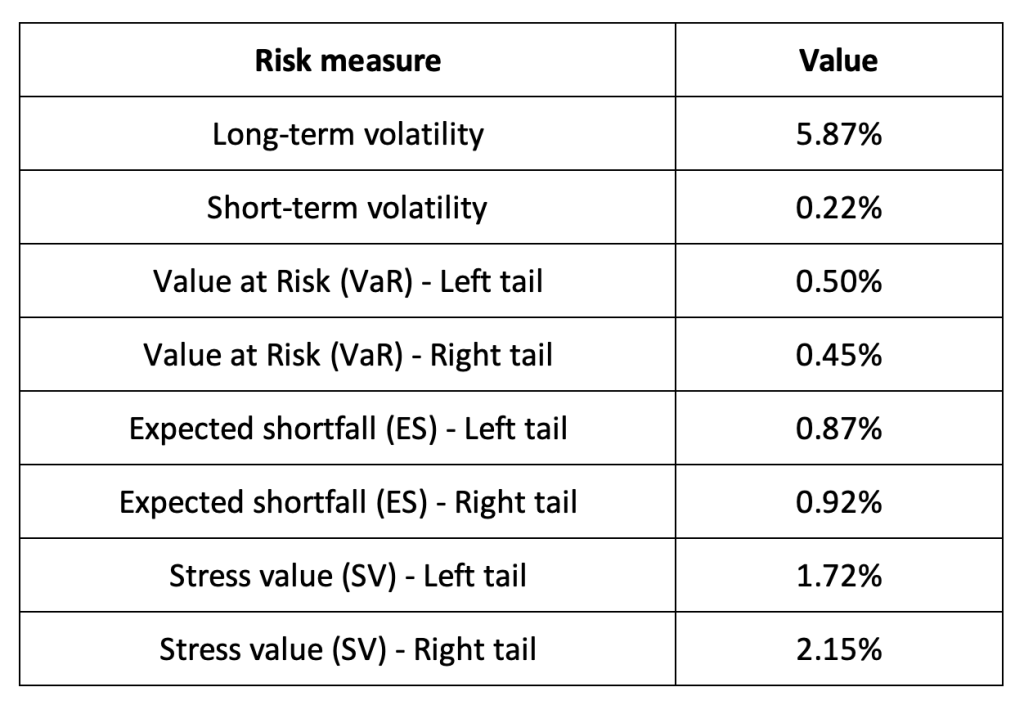
Table 3 below presents the following risk measures estimated for the USD Coin:
- The long-term volatility (the unconditional standard deviation estimated over the entire period)
- The short-term volatility (the standard deviation estimated over the last three months)
- The Value at Risk (VaR) for the left tail (the 5% quantile of the historical distribution)
- The Value at Risk (VaR) for the right tail (the 95% quantile of the historical distribution)
- The Expected Shortfall (ES) for the left tail (the average loss over the 5% quantile of the historical distribution)
- The Expected Shortfall (ES) for the right tail (the average loss over the 95% quantile of the historical distribution)
- The Stress Value (SV) for the left tail (the 1% quantile of the tail distribution estimated with a Generalized Pareto distribution)
- The Stress Value (SV) for the right tail (the 99% quantile of the tail distribution estimated with a Generalized Pareto distribution)
Table 3. Risk measures for the USDC.
Source: computation by the author (data: Yahoo! Finance website).
The volatility is a global measure of risk as it considers all the returns. The Value at Risk (VaR), Expected Shortfall (ES) and Stress Value (SV) are local measures of risk as they focus on the tails of the distribution. The study of the left tail is relevant for an investor holding a long position in the XRP while the study of the right tail is relevant for an investor holding a short position in the XRP.
Why should I be interested in this post?
The post offers an opportunity for both newcomers and seasoned cryptocurrency enthusiasts to delve into the concept of stablecoins, gaining insights into how digital assets maintain stability amidst market volatility. Furthermore, the post highlights USDC’s role in fostering financial inclusion by enabling borderless transactions, appealing to readers passionate about democratizing finance. Additionally, exploring USDC’s significance in the burgeoning realm of decentralized finance (DeFi) could intrigue those interested in innovative financial technologies and investment opportunities. Examining USDC’s historical performance and market dynamics can offer valuable insights for investors and traders, while shedding light on its compliance measures and regulatory landscape can address concerns regarding legal risks, contributing to readers’ understanding and confidence in this digital asset.
Related posts on the SimTrade blog
About cryptocurrencies
▶ Snehasish CHINARA Bitcoin: the mother of all cryptocurrencies
▶ Snehasish CHINARA How to get crypto data
▶ Alexandre VERLET Cryptocurrencies
▶ Youssef EL QAMCAOUI Decentralised Financing
▶ Hugo MEYER The regulation of cryptocurrencies: what are we talking about?
About statistics
▶ Shengyu ZHENG Moments de la distribution
▶ Shengyu ZHENG Mesures de risques
▶ Jayati WALIA Returns
Useful resources
Academic research about risk
Longin F. (2000) From VaR to stress testing: the extreme value approach Journal of Banking and Finance, N°24, pp 1097-1130.
Longin F. (2016) Extreme events in finance: a handbook of extreme value theory and its applications Wiley Editions.
Data
Yahoo! Finance Historical data for USDC
CoinMarketCap Historical data for USDC
About the author
The article was written in March 2024 by Snehasish CHINARA (ESSEC Business School, Grande Ecole Program – Master in Management, 2022-2024).