CRSP

CRSP

Nithisha CHALLA

In this article, Nithisha CHALLA (ESSEC Business School, Grande Ecole Program – Master in Management (MiM), 2021-2024) examines the history, features, applications, and relevance of CRSP, with a special focus on why it matters to finance professionals and students.

Introduction

CRSP (Center for Research in Security Prices) is a leading financial database renowned for its comprehensive collection of security price data, returns, and market indexes. It is a trusted resource for academics, researchers, and professionals who rely on historical datasets for empirical research and strategic decision-making. With a focus on U.S. markets, CRSP has set the gold standard for securities data, supporting countless studies in finance and economics.

Mastering CRSP not only deepens a student’s understanding of financial markets but also signals to potential employers a commitment to analytical rigor and excellence in finance—a key advantage in a competitive job market.

The History of CRSP

Established in 1960 at the University of Chicago, CRSP was founded to provide accurate and comprehensive data on U.S. stock markets for academic research. Its first dataset covered securities listed on the New York Stock Exchange (NYSE), laying the foundation for rigorous empirical research in finance. Over time, CRSP expanded to include data from other exchanges, such as the American Stock Exchange (AMEX) and NASDAQ, creating an unparalleled repository of historical market information.

Logo of CRSP
Logo of CRSP
Source: the company.

CRSP’s pioneering methodologies in data collection and standardization have significantly contributed to advancements in financial theory and practice. Its datasets have been integral to groundbreaking studies, including those that led to Nobel Prizes in Economics like Eugene Fama.

Key Features

Certain key features of CRSP make it very useful as a database such as its Comprehensive Market Data, High-Quality Data, Unique Identifiers, Event Studies and Analytics, and Customizable Datasets.

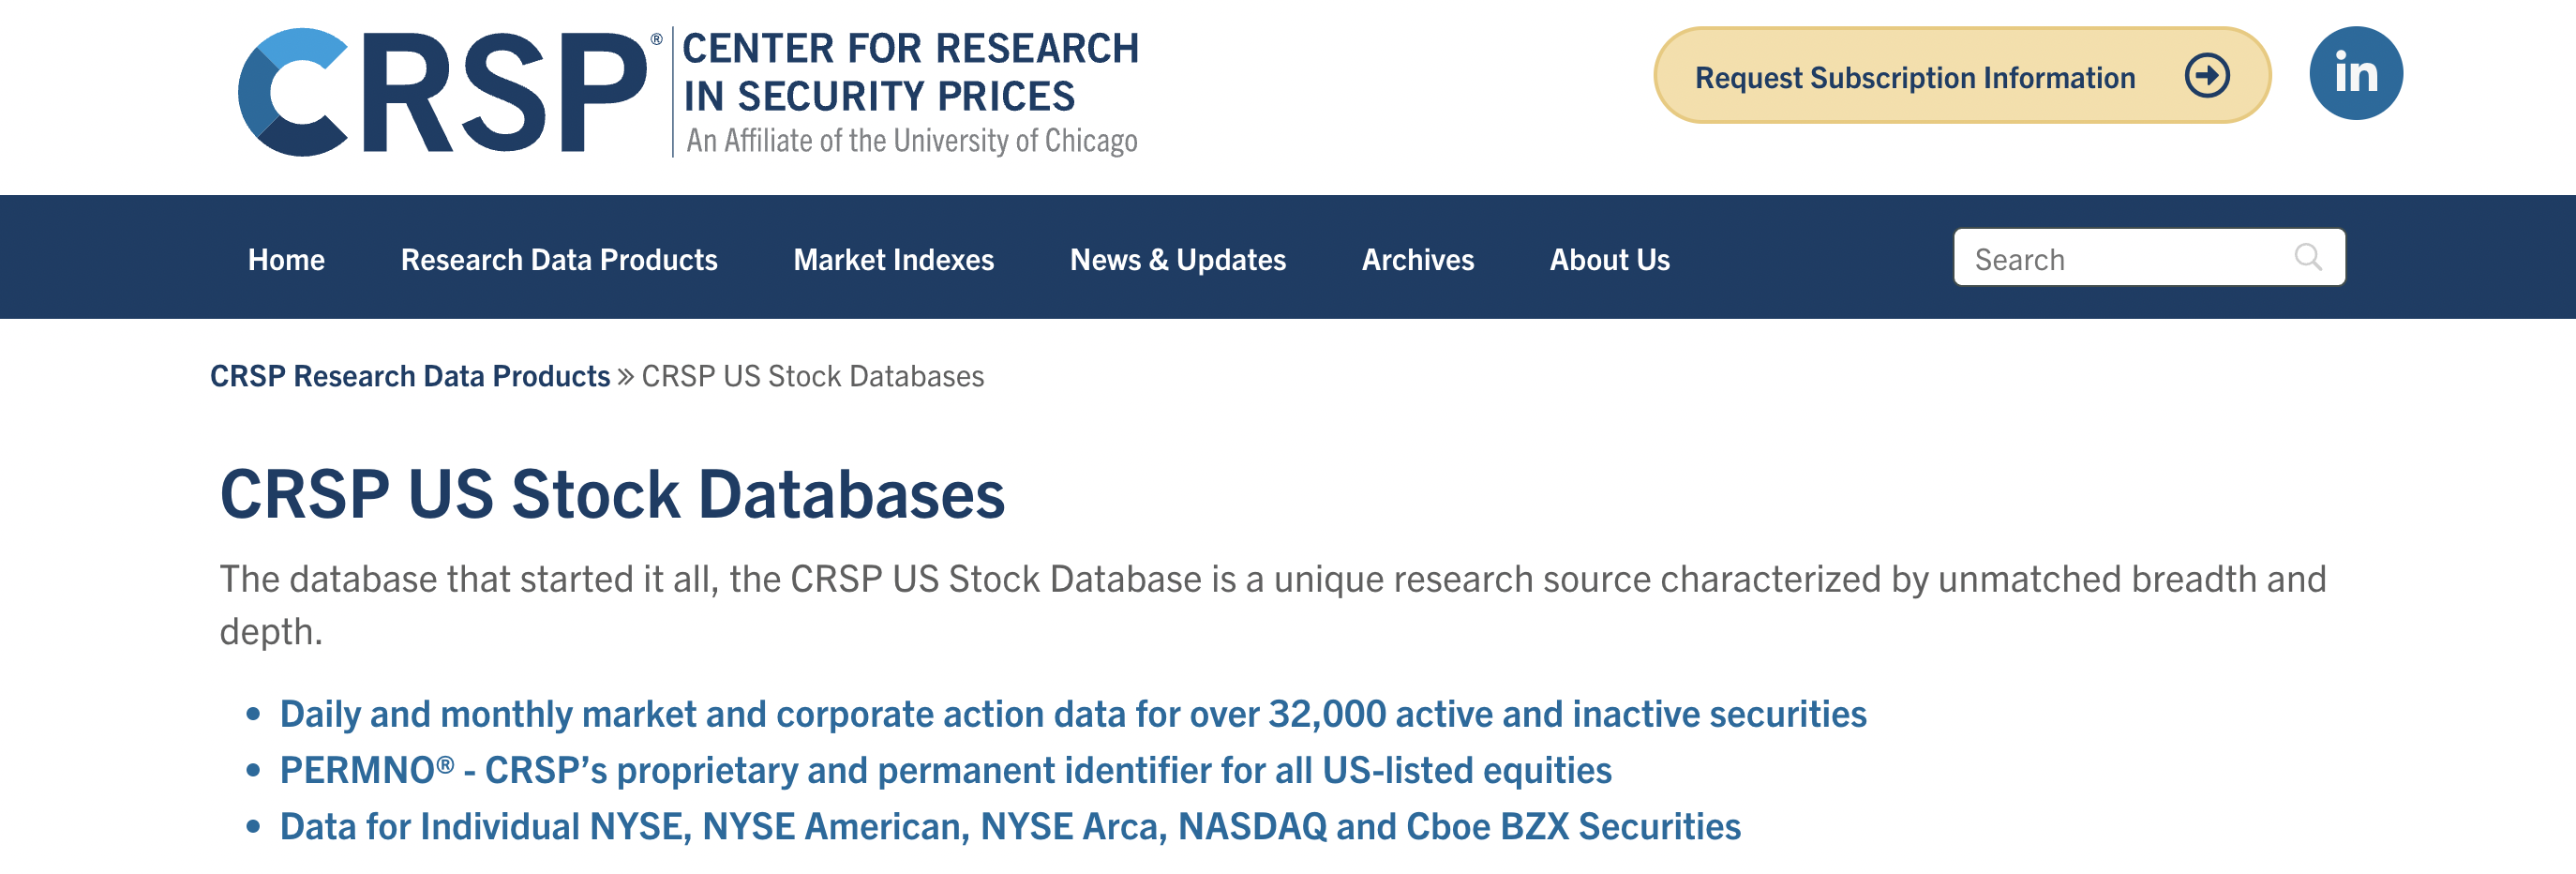
As an example, the picture below presents the CRSP website Interface.

CRSP website Interface
CRSP Interface
Source: the company.

Comprehensive Market Data

In the domain of finance, where historical accuracy and data consistency are critical, the Center for Research in Security Prices (CRSP) database has established itself as an invaluable resource. Maintained by the University of Chicago Booth School of Business, CRSP provides high-quality financial and market data, widely recognized for its rigor and reliability.

CRSP provides historical data on stock prices, returns, and dividends dating back to 1926. It includes data on U.S. equity, fixed-income securities, mutual funds, and market indexes.

High-Quality Data

Known for its accuracy and reliability, CRSP meticulously cleans and standardizes data for research-grade quality.

Unique Identifiers

Employs permanent and unique identifiers for securities, ensuring seamless tracking across corporate events such as mergers or name changes.</p

Event Studies and Analytics

CRSP supports event-based analyses, including stock splits, delistings, and corporate actions. It enables users to study the impact of specific events on stock performance.

Customizable Datasets

CRSP allows users to tailor data queries based on timeframes, security types, or specific indices.

Applications in Finance and Business

There are several applications of CRSP in finance and business such as Market Benchmarks, Strategic Planning, academic research, and Corporate Finance.

  • Academic Research: CRSP is the backbone of empirical finance, aiding studies on asset pricing, portfolio theory, and market efficiency.
  • Investment Strategies: Asset managers and analysts use CRSP data to backtest trading strategies, analyze market trends, and optimize portfolios.
  • Market Benchmarks: CRSP provides widely used benchmarks like the CRSP Indexes, which are integral to understanding market dynamics.
  • Corporate Finance: Researchers and professionals leverage CRSP for analyses on mergers, acquisitions, and the impact of financial policies.

Advantages and Limitations of CRSP

Though there are multiple advantages of using this database there are also certain limitations that we have to consider:

Advantages of CRSP

  • Historical Depth: CRSP’s long-term datasets enable robust time-series analyses and longitudinal studies.
  • Reliability: Trusted by academics and practitioners for its meticulous approach to data accuracy.
  • Comprehensive Coverage: Includes data on a broad range of financial instruments and corporate actions.

Challenges and Limitations

  • Cost: Access to CRSP is subscription-based and can be expensive for individual users or smaller institutions.
  • U.S.-Centric Focus: While exhaustive for U.S. markets, it offers limited data on international securities.
  • Technical Complexity: Requires expertise to navigate and analyze its extensive datasets effectively.

Why CRSP Matters in 2024

In 2024, as financial markets grow increasingly complex, CRSP’s role as a reliable data source is more critical than ever. The database supports cutting-edge research on topics such as algorithmic trading, behavioral finance, and the impact of ESG factors on market performance. With its legacy of contributing to financial innovation, CRSP remains a vital resource for understanding and navigating modern markets.

Conclusion

CRSP stands as a testament to the power of high-quality data in shaping financial research and practice. Its depth, precision, and historical scope make it indispensable for academics, researchers, and industry professionals. As markets evolve, CRSP continues to provide the tools and insights needed to analyze trends, test hypotheses, and drive informed decisions.

Why should I be interested in this post?

For finance students, CRSP is more than a database—it’s an educational gateway to understanding market behavior, testing financial theories, and developing data-driven insights. Familiarity with CRSP equips students with the skills to conduct empirical research and enhances their readiness for roles in asset management, investment banking, and academia.

Related posts on the SimTrade blog

   ▶ Nithisha CHALLA Datastream

   ▶ Nithisha CHALLA Factiva

   ▶ Nithisha CHALLA Compustat

   ▶ Nithisha CHALLA Statista

Useful resources

CRSP CRSP research data products

CRSP CRSP US Stock Databases

Wikipedia Center for Research in Security Prices

About the author

The article was written in December 2024 by Nithisha CHALLA (ESSEC Business School, Grande Ecole Program – Master in Management (MiM), 2021-2024).

Compustat

Compustat

Nithisha CHALLA

In this article, Nithisha CHALLA (ESSEC Business School, Grande Ecole Program – Master in Management (MiM), 2021-2024) delves into Compustat, its origins and history, features, applications, and its critical role in shaping modern finance.

Introduction

In an era where data drives decision-making, having access to reliable and standardized financial information is essential for academics, analysts, and professionals in finance. Compustat is a comprehensive database that offers detailed financial and economic data on publicly traded companies across the globe. Renowned for its standardized and comparable datasets, it is extensively used for financial modeling, investment research, and academic studies. It is especially valued in environments where precision, consistency, and historical depth of data are paramount.

Investing time in learning how to navigate and apply insights from Compustat is not merely an academic exercise; it’s a practical step toward becoming a data-savvy finance professional ready to tackle real-world challenges.

The History of Compustat

Compustat traces its origins to the 1960s when Standard & Poor’s developed it as a digital repository for corporate financial data. Initially focused on U.S. companies, the database expanded its scope to include international firms, establishing itself as a global standard for financial information. Over decades, Compustat evolved with technological advancements, incorporating tools for analytics and data visualization, thus maintaining its relevance in an increasingly complex financial landscape.

The acquisition of Compustat by S&P Global(Standard and Poor) further solidified its position, ensuring integration with other S&P products like Capital IQ, enhancing both usability and depth.

Key Features of Compustat

Certain key features of Compustat make it very useful as a database such as its extensive financial data, global reach, standardized metrics, customizable data access, and integration capabilities

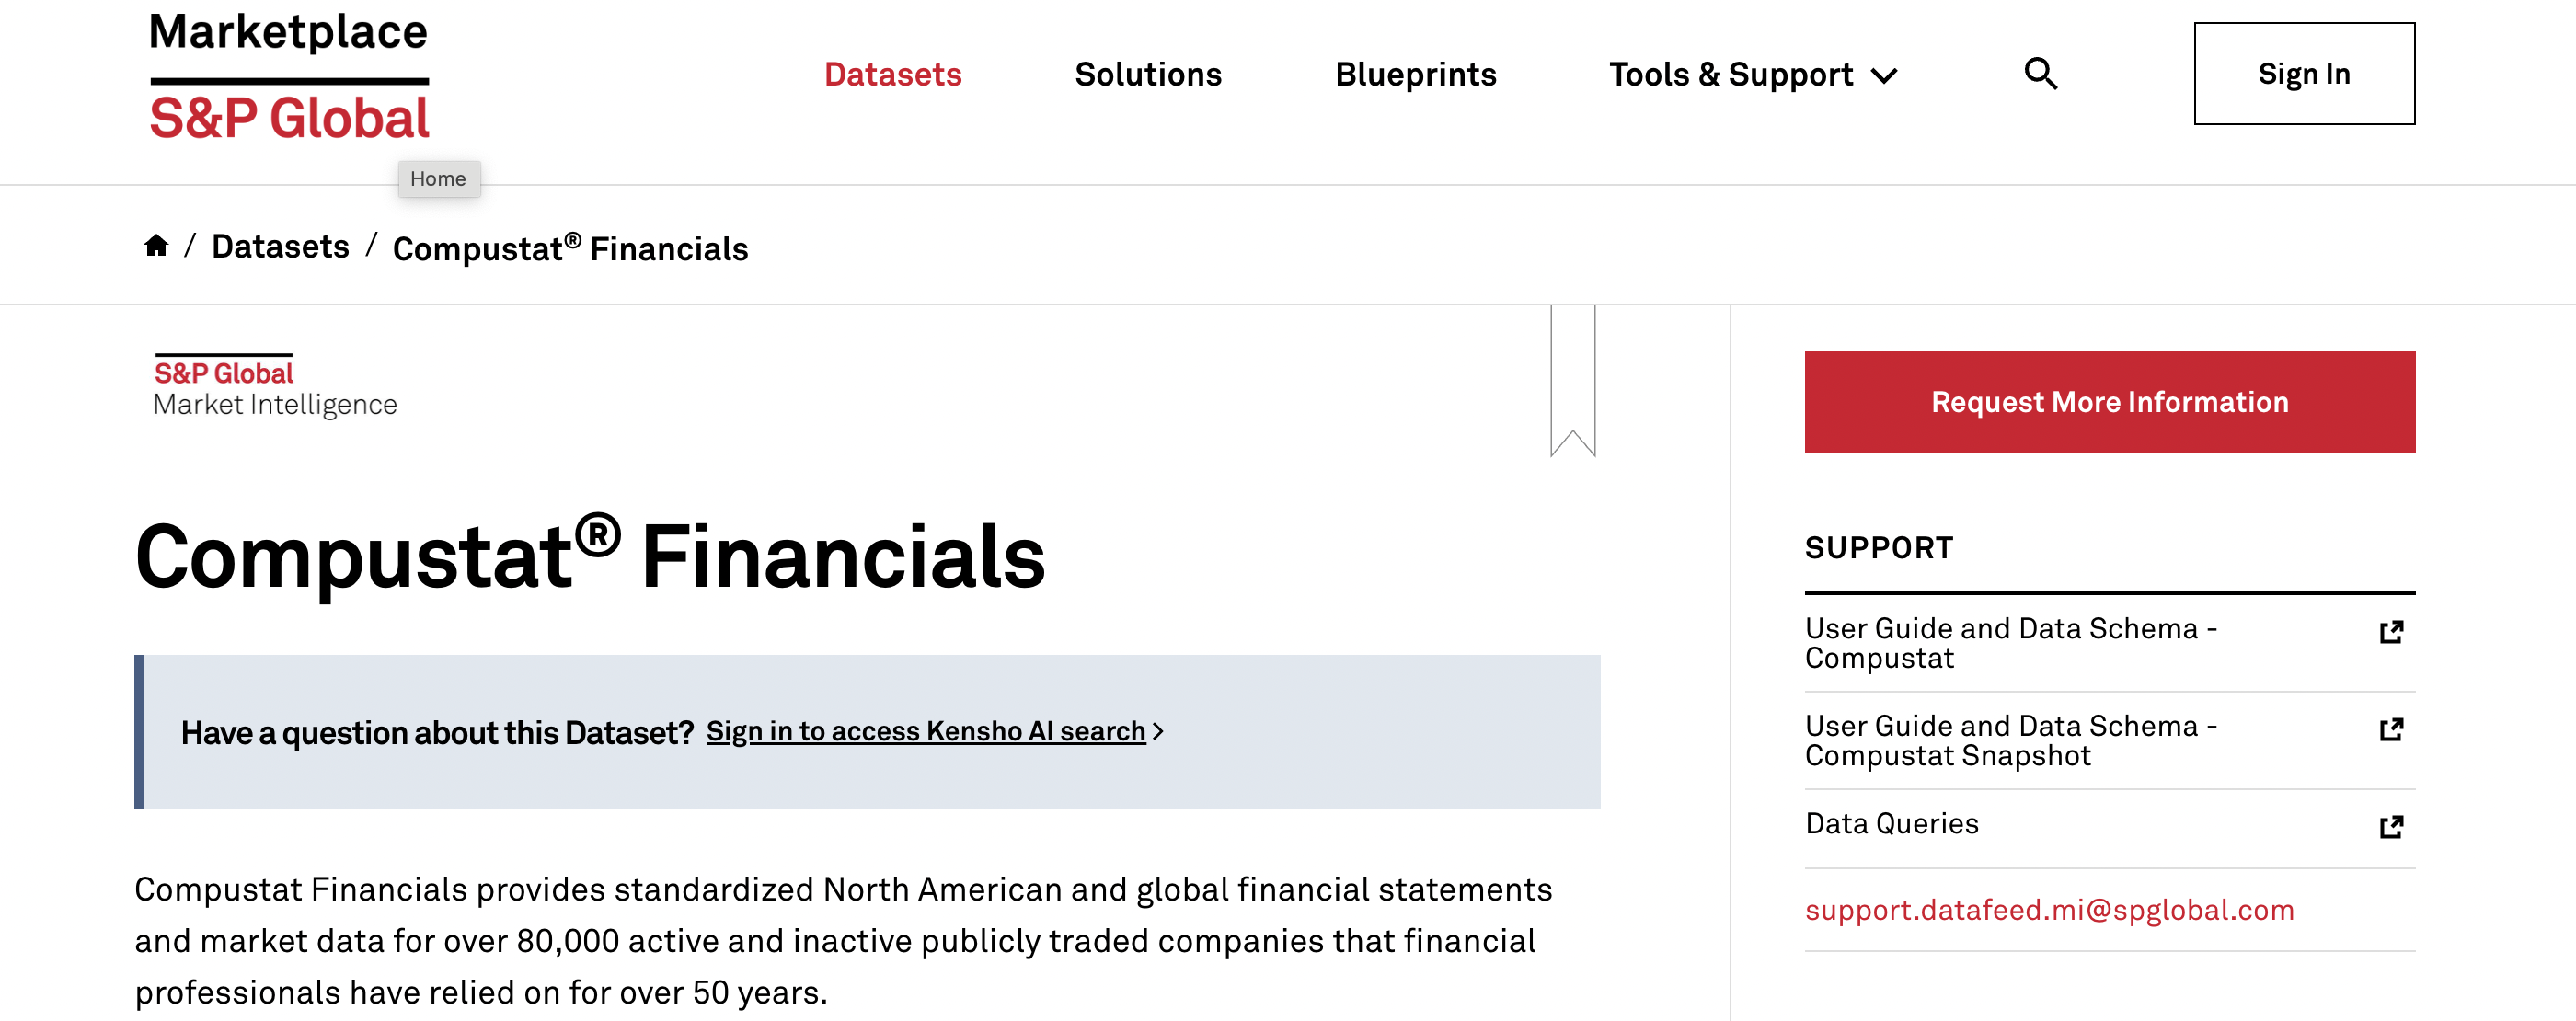
As an example, the picture below presents the screenshot of the Compustat website.

Compustat website Interface
Source: the company.

Extensive Financial Data

Compustat, a product of S&P Global, is a robust database that provides financial, economic, and market data, making it a cornerstone for those engaged in quantitative research and corporate analysis. Compustat covers thousands of companies’ income, balance sheets, and cash flow statements. It includes detailed information on assets, liabilities, revenues, expenses, and equity.

Global Reach

Compustat provides data on companies from North America, Europe, Asia-Pacific, and emerging markets. It also features coverage of both active and inactive companies for historical analysis.

Standardized Metrics

Compustat ensures consistency and comparability across industries and geographies. It adheres to accounting standards, enabling uniform analysis.</p

Customizable Data Access

Allows users to tailor datasets according to specific time frames, industries, or financial metrics.

Integration Capabilities

Compustat is compatible with statistical software like R, Python, and MATLAB for advanced analytics. It can be integrated with S&P Global’s broader suite of tools, enhancing data utility.

Applications in Finance and Business with Compustat

There are several applications of Compustat in finance and business such as equity research and valuation, credit analysis, academic research, corporate strategy, and benchmarking

  • Equity Research and Valuation: Investment professionals use Compustat to build financial models, perform company valuations, and assess market performance.
  • Credit Analysis: Lenders and credit analysts utilize Compustat’s data to evaluate borrowers’ financial health and creditworthiness.
  • Academic Research: Scholars rely on Compustat for empirical studies on market behavior, corporate performance, and economic trends.
  • Corporate Strategy and Benchmarking: Businesses use the database for competitive analysis and to benchmark their performance against peers.

Advantages and Limitations of Compustat

Though there are multiple advantages of using this database there are also certain limitations that we have to consider:

Advantages of Compustat

  • Depth of Data: Historical records spanning decades provide valuable insights for longitudinal studies.
  • Reliability: Maintained by S&P Global, Compustat is a trusted source of financial information.
  • Customization: The ability to filter and extract tailored datasets enhances its utility across various applications.

Challenges and Limitations

  • Cost: The subscription fee is substantial, which may limit access for small organizations or individual users.
  • Complexity: Navigating the platform and interpreting data may require specialized training.
  • Limited Non-Financial Metrics: Focuses primarily on financial data, with less emphasis on qualitative aspects like ESG (Environmental, Social, Governance) metrics.

Why Compustat Matters in 2024

In the rapidly evolving financial landscape of 2024, Compustat remains a vital resource. With the growing complexity of global markets, the need for standardized and reliable data has never been greater. As businesses increasingly adopt AI-driven analytics, Compustat’s clean, structured datasets are a foundation for machine learning models and predictive analytics. Furthermore, its historical archives enable researchers to analyze economic trends and market cycles with unparalleled depth.

Conclusion

Compustat stands as a benchmark in financial databases. Its extensive features, historical depth, and global reach make it indispensable for professionals and academics. Compustat empowers users to make informed decisions in a data-driven economy by bridging the gap between raw data and actionable insights.

Why should I be interested in this post?

For finance students, understanding and utilizing Compustat can be a game-changer. Mastery of this database enhances research capabilities and provides a competitive edge in the job market. Familiarity with Compustat signals to employers a proficiency in handling large-scale financial data and performing advanced analytics skills highly sought after in finance, investment banking, and consulting.

Related posts on the SimTrade blog

   ▶ Nithisha CHALLA Datastream

   ▶ Nithisha CHALLA S&P Global Market Intelligence

   ▶ Nithisha CHALLA Factiva

   ▶ Nithisha CHALLA Statista

   ▶ Nithisha CHALLA CRSP

Useful resources

S&P Global Compustat Financials

Fidelity Investments Introduction to Standard & Poor’s Compustat

European University Institute (EUI) Compustat – Standard and Poor’s

Wikipedia Compustat

About the author

The article was written in December 2024 by Nithisha CHALLA (ESSEC Business School, Grande Ecole Program – Master in Management (MiM), 2021-2024).

Statista

Statista

Nithisha CHALLA

In this article, Nithisha CHALLA (ESSEC Business School, Grande Ecole Program – Master in Management (MiM), 2021-2024) explores Statista, its origin, features, applications, and its value as a go-to resource for data and insights.

Introduction

Statista is a leading provider of market and consumer data, presenting information in an intuitive, visually appealing format. Known for its user-friendly interface and comprehensive coverage, Statista aggregates data from over 22,500 trusted sources, making it a one-stop shop for global statistics, market trends, and industry reports.

Moreover, familiarity with Statista demonstrates to employers a capacity for leveraging data to inform decisions—a skill highly sought after in finance, consulting, and analytics roles. By mastering Statista, students not only enhance their academic experience but also gain a competitive edge in their professional journey.

The History of Statista

Founded in 2007 in Hamburg, Germany, Statista was created to simplify access to data and transform complex information into actionable insights. The platform initially focused on German-speaking markets but quickly expanded to serve a global audience. Over the years, Statista has grown into one of the largest statistics portals worldwide, providing data in fields ranging from technology and finance to healthcare and consumer behavior.

Logo of Statista
Logo of Statista
Source: the company.

Statista’s innovative approach to presenting data visually has set it apart. By combining academic rigor with business-friendly accessibility, the platform has become indispensable for decision-makers across industries.

Key Features of Statista

Certain key features of Statista make it very useful as a database such as its Extensive Data Coverage, Interactive Visualizations, Comprehensive Reports, Global Consumer Survey, and Ease of Access

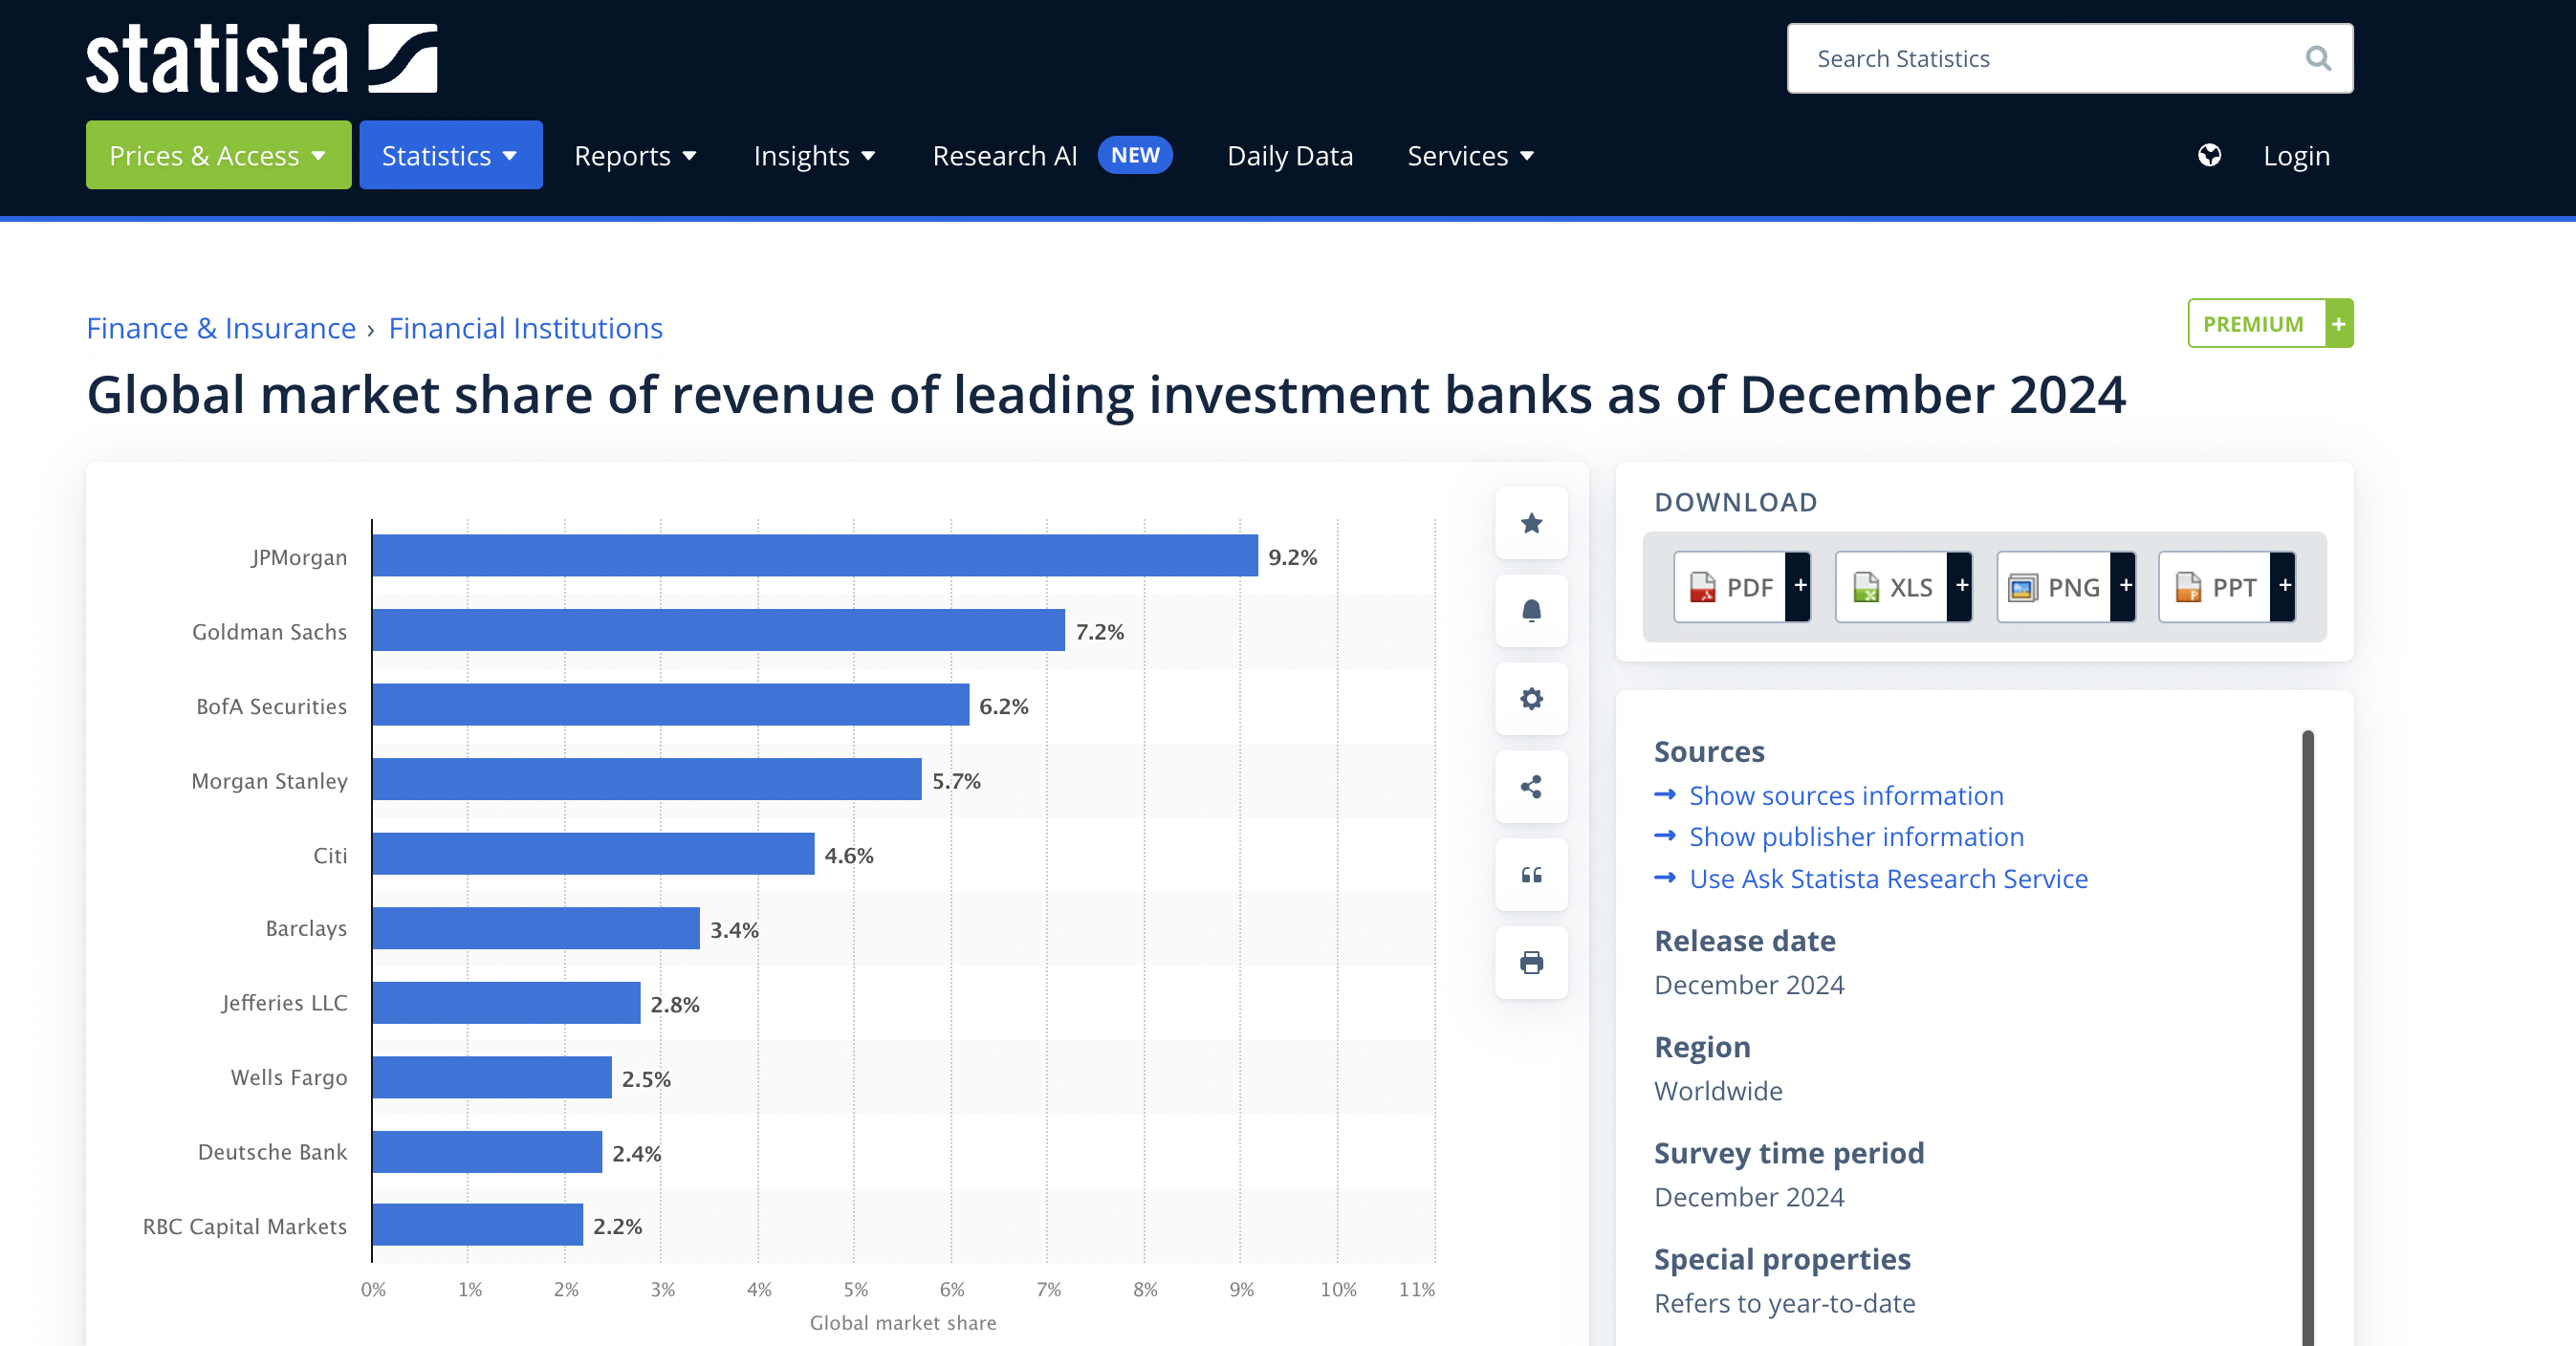
As an example, the picture below presents the Statista website Interface.

Statista website interface
Source: the company.

Extensive Financial Data

Statista, a renowned online statistics and market research platform offers a treasure trove of data for professionals, researchers, and students alike. Statista offers over 1.5 million statistics across 170 industries and 150+ countries. It includes data on demographics, consumer behavior, market trends, and economic indicators.

Interactive Visualizations

Statista provides charts, infographics, and dashboards to make data interpretation easier. Its users can customize visualizations to suit their needs.

Comprehensive Reports

In Statista, industry reports, market forecasts, and trend analyses are available. There are also special reports that focus on emerging topics like digitalization, sustainability, and AI.

Global Consumer Survey

Statista has a unique feature that offers insights into consumer attitudes and preferences across regions and industries.

Ease of Accessibility to data

Statista supports export in multiple formats, including PDF, Excel, and PowerPoint, for seamless integration into presentations and reports. And it features a powerful search engine and intuitive navigation tools.

Applications in Finance and Business with Statista

There are several applications of Statista in finance and business such as Market Research, Strategic Planning, academic research, and Public Policy, and Advocacy

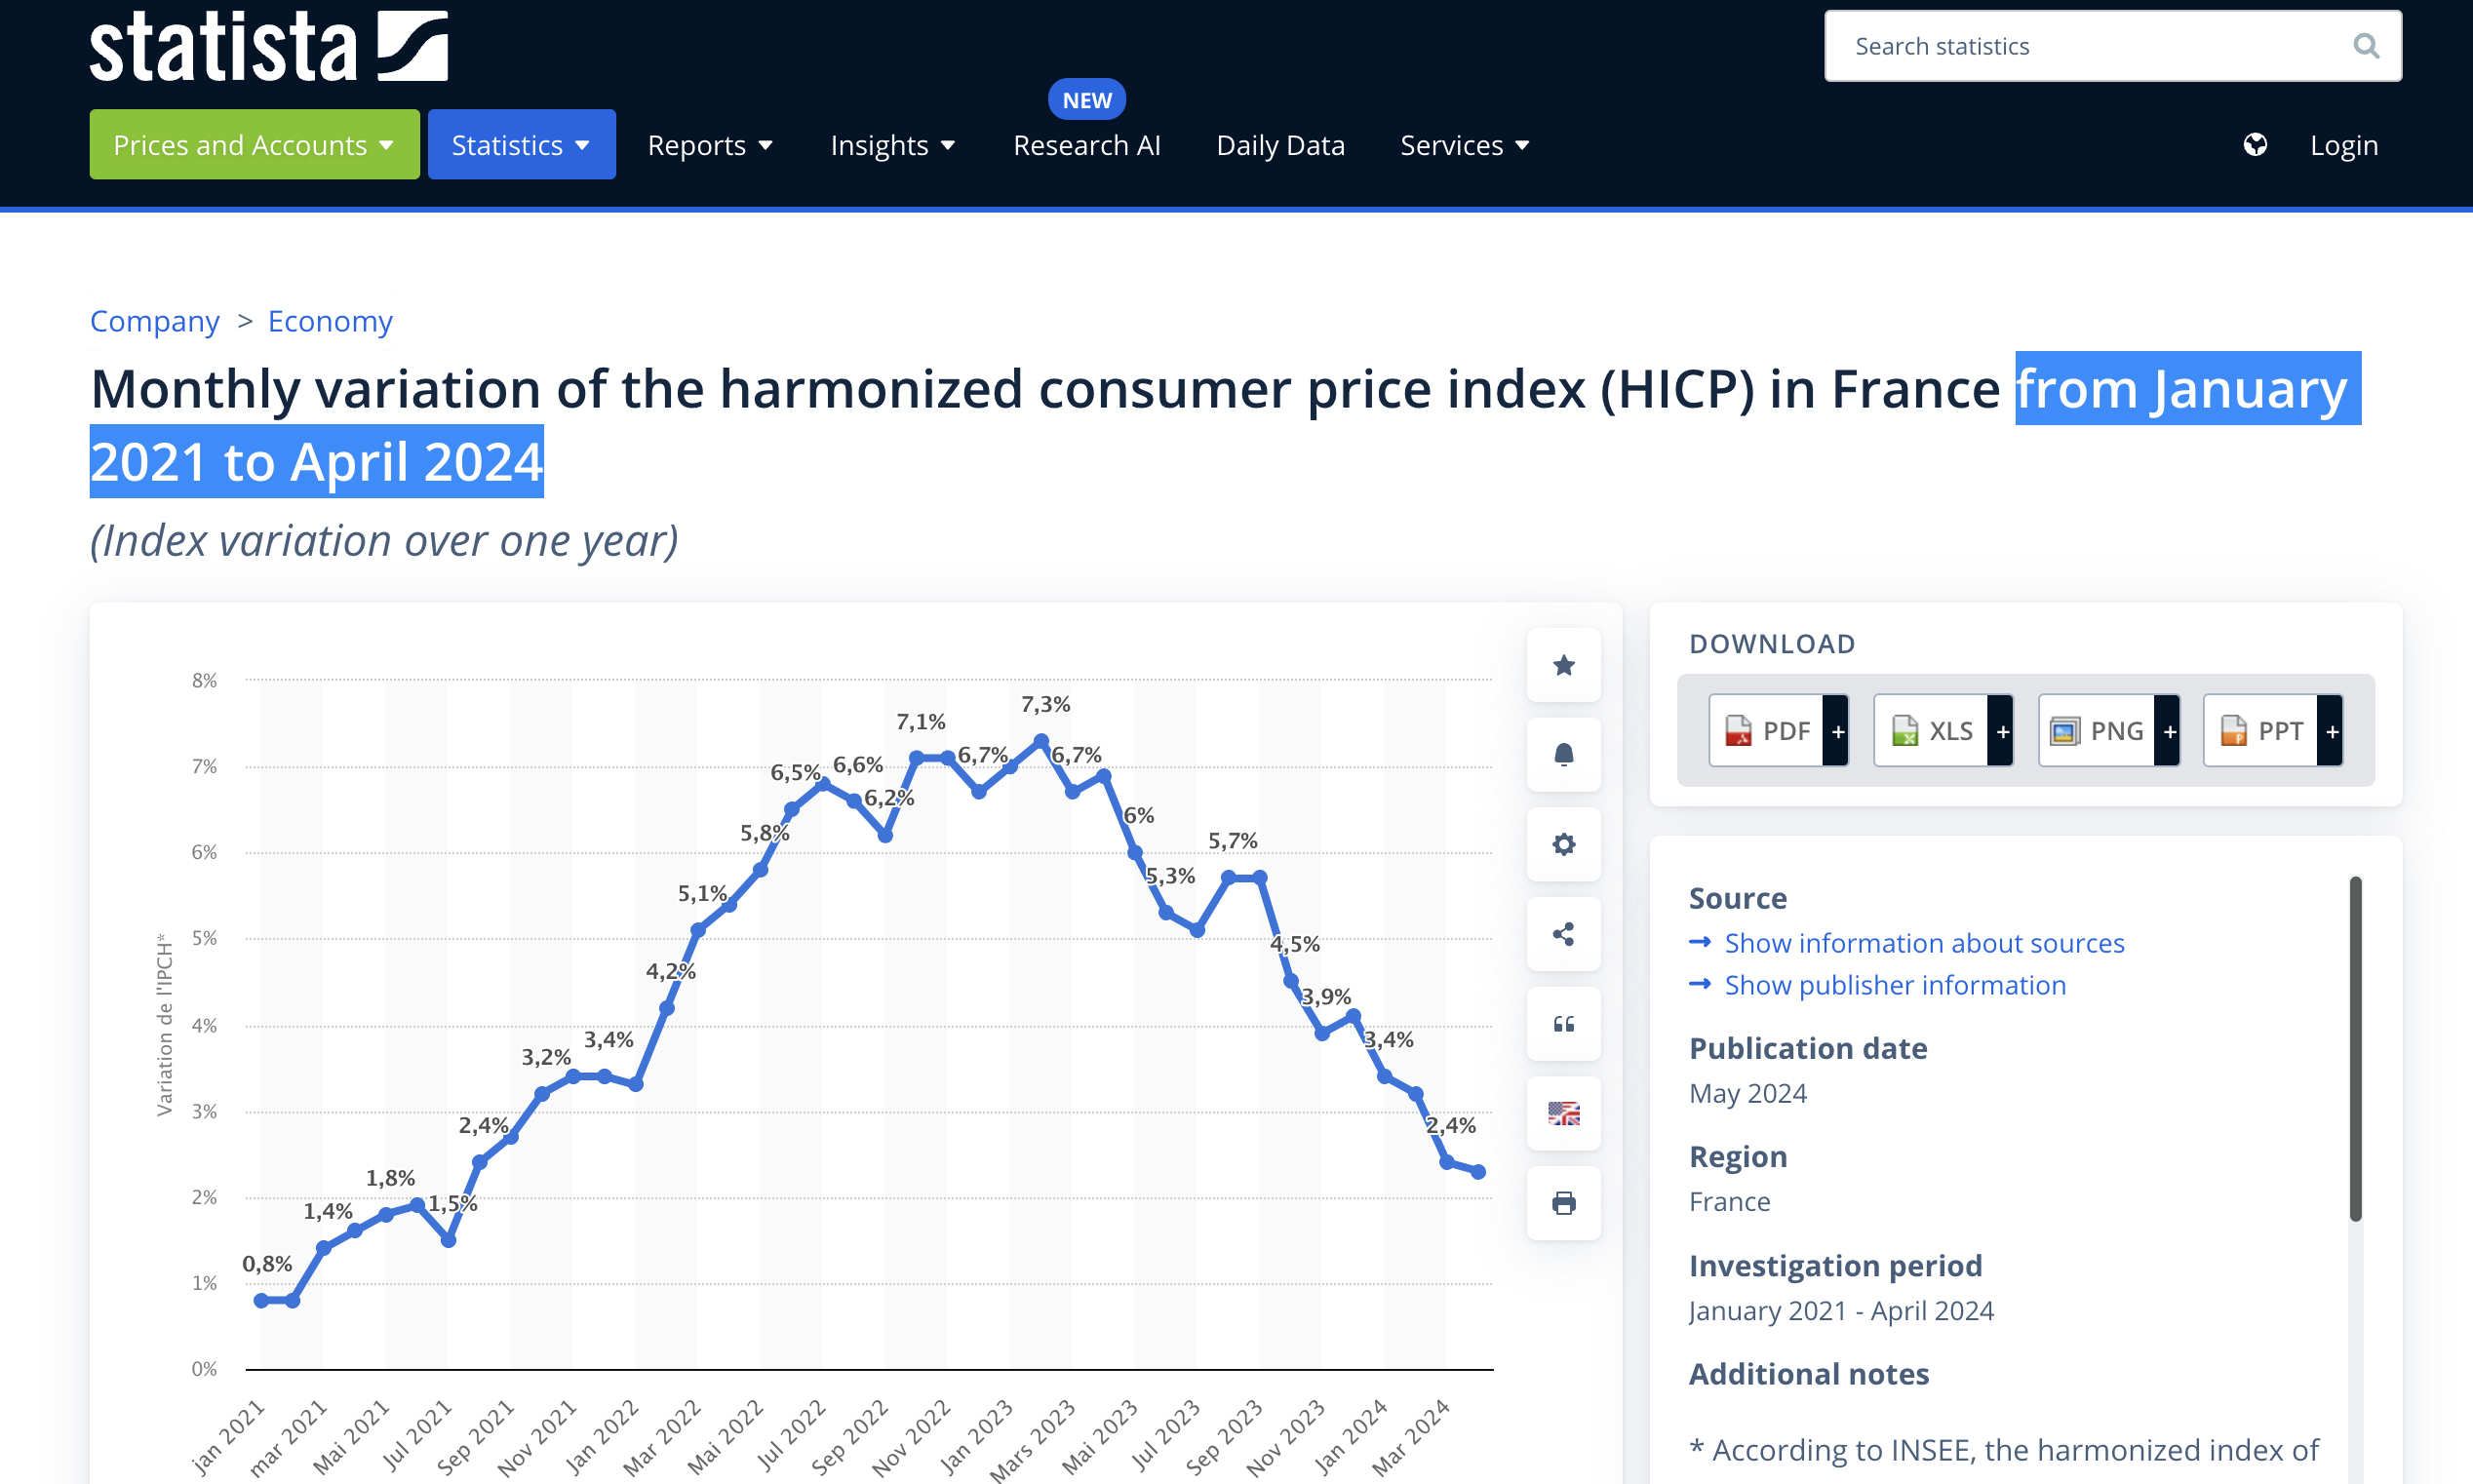
As an example, the picture below presents the news about the monthly variation of the harmonized consumer price index (HICP) in France from January 2021 to April 2024.

Statista news on harmonized consumer price index(HICP)
Statista Interface
Source: the company.

  • Market Research: Businesses use Statista to understand market dynamics, consumer preferences, and industry trends.
  • Strategic Planning: Statista’s insights help organizations make informed decisions about investments, product launches, and expansions.
  • Academic Research: Students and researchers rely on Statista for data-driven studies in fields like economics, business, and social sciences.
  • Public Policy and Advocacy: Policymakers use Statista to analyze economic indicators and societal trends, aiding in policy formulation and advocacy efforts.

Advantages and Limitations of Statista

Though there are multiple advantages of using this database there are also certain limitations that we have to consider:

Advantages of Statista

  • Broad Scope: Covers a wide range of topics, industries, and geographies.
  • User-Friendly: Simplifies complex data with visual tools and intuitive navigation.
  • Trusted Sources: Aggregates data from reputable organizations, ensuring reliability.

Challenges and Limitations

  • Subscription Costs: Comprehensive access requires a paid subscription, which might be prohibitive for some users.
  • Limited Raw Data: Focuses more on aggregated and processed data rather than raw datasets.
  • Depth vs. Breadth: While broad, some topics may lack the depth found in specialized databases.

Why Statista Matters in 2024

In 2024, as data becomes the backbone of strategic decision-making, Statista’s role is more vital than ever. Its ability to present real-time insights and long-term trends in a visually engaging manner caters to the increasing demand for actionable intelligence. With industries navigating challenges like digital transformation and global economic shifts, Statista serves as a reliable ally in staying informed and competitive.

Conclusion

Statista has revolutionized how data is accessed and utilized. Its blend of breadth, reliability, and user-friendly design makes it a versatile tool for anyone needing data-driven insights. Whether you’re exploring new markets, conducting academic research, or shaping public policy, Statista equips you with the knowledge needed to succeed in a complex world.

Why should I be interested in this post?

For finance students, Statista offers a wealth of resources to support academic projects, case studies, and career preparation. The platform provides access to financial metrics, market trends, and consumer insights that are invaluable for coursework and internships.

Related posts on the SimTrade blog

   ▶ Nithisha CHALLA Datastream

   ▶ Nithisha CHALLA Factiva

   ▶ Nithisha CHALLA CRSP

   ▶ Nithisha CHALLA Compustat

Useful resources

Statista Empowering people with data

Statista Global stories vividly visualized

Wikipedia Statista

European University Institute (EUI) Statista

About the author

The article was written in December 2024 by Nithisha CHALLA (ESSEC Business School, Grande Ecole Program – Master in Management (MiM), 2021-2024).

Datastream

Datastream

Nithisha CHALLA

In this article, Nithisha CHALLA (ESSEC Business School, Grande Ecole Program – Master in Management (MiM), 2021-2024) presents information referring to a global financial dataset, which plays a vital role in today’s financial markets for making informed investment decisions.

Introduction

Datastream is a global financial dataset that contains current and historical time series data on stocks, indices, bonds, funds, futures, options, interest rates, commodities, currencies, and economic indicators for 175 countries and 60 markets. It is accessible via two platforms: WRDS and LSEG Workspace.

It is an industry-leading analytical data source that enables detailed exploration of relationships between data series: perform correlation and relationship analysis, test investment and trading ideas, and research countries, regions and industries with time series sometime available from the 1900s onwards.

History

Datastream was developed by Thomson Reuters, now part of Refinitiv, and has been a vital tool for financial professionals for several decades. It has continually evolved to incorporate more data and improve its user interface, reflecting advancements in technology and the increasing demand for comprehensive financial information.

With over 35 million individual instruments or indicators across all major asset classes, including 8.5 million active economic indicators and over 14 million economic time series every day. It features 120 years of data, across 175 countries – the information and tools you need to interpret market trends, economic cycles and the impact of world events.

Its history extends as far back as the 1900s for G7 countries, the 1970s for other major markets and the 1980s for smaller countries.

Uses of Datastream

There are different uses of Datastream such as for investment research, economic analysis, portfolio management, academic research and financial reporting.

Investment Research

Investors and analysts use Datastream to research and evaluate potential investments by analyzing historical performance and financial health. Refinitiv offers in-depth coverage of more than 12,500 global companies across 74 countries, with over 630 metrics and history dating back to 2002.

For example, Refinitiv MarketPsych ESG Analytics (a part of Datastream) are real-time data series which can easily be incorporated into your investment and analysis process, whether quantitative or qualitative. Refinitiv MarketPsych ESG data is available on 100,000+ public and private companies and 252 countries and regions, covering more than 250 strategic ESG data measures, structured into 10 categories underlying the four areas of corporate performance.

Economic Analysis

Economists and policy makers use the database to monitor economic trends, make forecasts, and formulate economic policies.

Economists uses Datastream to access historical GDP data, inflation rates, employment figures, and other relevant economic indicators.

Portfolio Management

Portfolio managers use Datastream to track the performance of assets, optimize asset allocation, and manage risks of their portfolios or funds.

The risk manager uses Datastream to analyze historical price volatility, correlations between assets, and economic indicators that impact market risk. Datastream has had a number of marked firsts within the industry and was a pioneer when it came to calculating indices’ relative data on a daily basis. Thanks to their vast coverage of constituents across the major asset classes, users can construct benchmarks tailored to their respective strategies. This means a fund’s relative performance can be tracked more accurately.

Datastream also offers extensive global coverage of historical end-of-day fund data, with over 30 years of history and a range of measures including net asset value, dividends and performance metrics, plus supporting and operating data such as classifications, identifiers and legal entity all sourced directly from Refinitiv Lipper.

Academic Research

Scholars and students in finance and economics use the extensive data for empirical research, thesis work, and academic publications.

Financial Reporting

Financial institutions use the data for internal reporting, regulatory compliance, and strategic planning.

Finance teams use Datastream to pull data on the company’s stock performance, compare it with industry benchmarks, and include relevant economic indicators.

Advantages of Datastream

To achieve their goals, Datastream is used by various entities and individuals for various reasons: comprehensive coverage, historical depth, user-friendly interface, reliable and timely data, and customization.

  • Comprehensive Coverage: One of the most extensive databases available, covering a wide range of financial instruments and global markets.
  • Historical Depth: Offers deep historical data, essential for long-term analyses and trend identification.
  • User-Friendly Interface: Intuitive tools and interfaces for data extraction, charting, and analysis.
  • Reliable and Timely Data: Provides accurate and up-to-date information, crucial for making informed financial decisions.
  • Customization: Users can customize data queries and reports to meet specific research and analysis needs.

Challenges of using Datastream

Given that Datastream deals with real-time or near-real-time data, there are several challenges in processing the streaming data:

  • Data Overload: The vast amount of financial data available can be overwhelming, making it difficult to filter relevant information.
  • Data Quality: Ensuring the accuracy and reliability of financial data is crucial, as incorrect data can lead to poor investment decisions.
  • Cybersecurity: Protecting financial data from cyber threats and unauthorized access is a significant concern for financial institutions and data providers.
  • Cost: Access to premium financial data services can be expensive, posing a challenge for individual investors and smaller firms.

Conclusion

Datastream plays a critical role in the modern financial ecosystem. By providing real-time access to a wide array of financial data, it empowers investors, analysts, and institutions to make informed decisions, enhance market transparency, and drive economic growth. As technology continues to evolve, the accessibility and quality of financial data will only improve, further transforming the landscape of financial markets.

Why should I be interested in this post?

This article provides a comprehensive overview of Datastream, with clear examples and explanations of key concepts. For management students, understanding and analyzing the corporate world is equally important as being a part of it and making changes in it.

Related posts on the SimTrade blog

   ▶ Louis DETALLE The importance of data in finance

Other financial data

   ▶ Nithisha CHALLA Bloomberg

   ▶ Nithisha CHALLA Morningstar

   ▶ Nithisha CHALLA S&P Global Market Intelligence

Useful resources

LSEG Refinitiv datastream

Princeton University Library Datastream

Thomson Reuters Thomson Reuters Datastream Economics

NYU libraries Datastream Guide

European University Institute (EUI) Datastream description

About the author

The article was written in June 2024 by Nithisha CHALLA (ESSEC Business School, Grande Ecole Program – Master in Management (MiM), 2021-2024).

Zacks Investment Research

Zacks Investment Research

Nithisha CHALLA

In this article, Nithisha CHALLA (ESSEC Business School, Grande Ecole Program – Master in Management (MiM), 2021-2024) presents Zacks Investment Research, which provides financial data, news and analytics for the financial community.

Introduction

Zacks Investment Research (ZIR) is a prominent financial services company known for its stock research, analysis, and investment tools. Zacks is best known for its proprietary Zacks Rank stock-rating system, which uses earnings estimate revisions to identify stocks that are assured to outperform the market. This system, along with a wide array of financial tools and resources, has made Zacks a trusted name among individual investors, financial advisors, and institutional investors alike.

Logo of Zacks Investment Research
Source: Zacks Investment Research

History

Zacks Investment Research has a rich history that began in 1978 when it was founded by Len Zacks, a Ph.D. in mathematics from MIT. Len Zacks was driven by a pioneering idea that earnings estimate revisions are the most powerful force impacting stock prices. His vision was to develop a research methodology and tools that leverage this insight to help investors make better investment decisions.

In 1978, Len Zacks founded Zacks Investment Research with a focus on earnings revisions. His research suggested that changes in analysts’ earnings estimates had a significant impact on stock prices, and he aimed to harness this insight to create a predictive stock-rating system.

In 1981, Zacks developed the Zacks Rank, a proprietary quantitative model that ranks stocks based on changes in analysts’ earnings estimates. It became the cornerstone of the company’s product offerings, known for its ability to identify stocks likely to outperform the market. In 1986, The Zacks Rank system was made available to institutional investors. It gained credibility and popularity due to its consistent performance in predicting stock price movements.

In 1992, Zacks Investment Research expanded its offerings to individual investors. In 1996, The company launched its website, Zacks.com, making its research and stock ratings accessible to a broader audience.

In 2002, Zacks introduced its mutual fund ranking system, applying its earnings revision methodology to mutual funds. This allowed investors to identify funds with strong earnings potential. In 2004, The company expanded its research offerings to include ETF (Exchange-Traded Fund) ratings and analysis, catering to the growing interest in ETF investing.

In 2015, Zacks Investment Research expanded its institutional services, offering advanced analytics, data feeds, and customized research solutions for hedge funds, asset managers, and financial institutions.

In 2023, Zacks Investment Research still remains a leading provider of financial research, known for its robust stock ranking system, comprehensive research reports, and a wide range of tools that help investors make informed decisions.

Key Components of Zacks Investment Research

Earnings Estimates

Zacks’ early contribution to investment analysis was the discovery that Earnings Per Share (EPS) estimate revisions are the most powerful force affecting stock prices. This discovery gave birth to the Zacks Indicator which, along with being the first to calculate consensus EPS estimates of quarterly earnings and to create the concept of EPS surprises, as well as the first to analyze price response to EPS surprises placed Zacks among the top innovating pioneers in the investment industry.

Zacks gathers earnings estimates from a wide range of sources like Wall Street Analysts, Company Reports, and Economic Indicators. Earnings estimates play a crucial role in the proprietary Zacks Rank system, which ranks stocks from top 5 strong buys to strong sells. The Zacks Rank system leverages these revisions to identify stocks that are likely to outperform or underperform the market.

Earnings estimates are a foundational element of the Zacks Rank system. The Zacks Rank is a proprietary stock rating model that uses changes in earnings estimates to rank stocks.

Model portfolio

The Zacks Investment Committee has maintained a model portfolio since 1996. This portfolio called the Zacks Focus List, is designed for long-term investors and reflects the opinions of Zacks Director of Research Mr. Sheraz Mian. It is published weekly and will list any additions or deletions to the portfolio from the previous week.

Zacks Chief Equity Strategist, John Blank PhD., publishes this monthly report that provides the Zacks forecasts for all major asset classes and the details of Zacks outlook. This report is derived from several resources to come up with individual asset class forecasts.

Forecasts for Key Financial Metrics

In the early 1990s, Zacks developed consensus estimates of other key investment metrics such as brokerage analyst stock ratings, forecasts of future sales, and target prices. More recently, Zacks have expanded again the set of items for which they calculate consensus estimates to include many of the line items and ratios that can be determined from income statements such as ROE, Margins, Net Income, etc.

The Zacks Fundamental database includes 260 operational metric items covering over 900 companies in 32 different industries. The history of the metrics items goes back to 2003. For more details on the operational metrics, download the overview document below.

Coverage

In 1981, Zacks began processing, organizing, and evaluating research produced by US brokerage firms. Today Zacks receives daily electronic data feeds and printed research reports on over 8,500 North American publicly traded companies from over 185 brokerage firms, produced by more than 3,200 analysts amounting to over 500,000 pages of brokerage research. Zacks’s extensive data sets give you access to over 25 years of data history on over 16,000 active and inactive US and Canadian equities.

In addition, ZIR records 25,000 earnings estimate revisions and changes in broker recommendations weekly. This information is made available through institutional and non-institutional product lines and websites such as MSN MoneyCentral, Quicken.com, Bloomberg.com, and FoxBusiness.com, as well as our websites.

On the whole it covers 6,000 US companies, plus 550 non-US companies traded as ADRs on US exchanges from 35 foreign countries, plus 200 Canadian companies trading on US exchanges.

Period

Zacks began in 1978 collecting the individual EPS estimates for over 4,400 US and Canadian companies made by 3,000 analysts employed by 180 US brokerage firms.

Frequency

Zacks maintains a history of annual EPS estimates going back to 1979 and quarterly estimates going back to 1982. Zacks consensus ratings history goes back to 1985. Consensus Sales estimates and Price Targets are maintained back to 2000.

Sales Estimates – 2000 to Present – Monthly, Weekly, Daily Frequency.

Price Targets – 2000 to Present – Monthly, Weekly, Daily Frequency

Zacks data is accessible through raw data feeds for both history files and updates, as hosted web pages that can be framed into finance-oriented websites, as APIs in XML or JSON format, and through partners providing on-demand data-as-a-service (DaaS) platforms.

Firms and Financial analysts

For the 3,800 largest companies Zacks provides over 500 fields of annual standardized data from 2001 forward, and 87 fields from 1979 to 2001. For the 2,800 smaller companies and ADRs, ZIR provide 87 fields of annual standardized data from 1979 to the present.

Zacks employs a rigorous quality control process to make sure all data points are recorded accurately. For each company, a trained analyst enters the data from SEC filings, which is then double-checked by a senior analyst. Once the data is entered, a senior analyst signs off on final completion after reviewing all the data. In addition, the data is subjected to a battery of automated checks to verify balancing relationships and correct errors. All data items are reviewed by multiple sets of trained eyes as well as automated computer checks.

Pricing

There are several types of pricing offered by Zacks Investment Research namely Zacks premium, Zacks Investor Collection, Zacks Ultimate.

Zacks Premium features daily updates of the Zacks Rank, full access to the Zacks #1 Rank List, Equity Research Reports, Focus List portfolio of 50 longer-term stocks, Premium screens and much more. The subscription fee for this per year is $249.

Zacks Investor Collection is a bundle of top subscription services for long-term investors. Customers can access to all of the real-time buy and sell signals from all of Zacks long-term investor portfolios, including the exclusive stocks under the $10 strategy which isn’t available to the general public. Customers can also get full access to all the premium research tools and reports for finding winning stocks, ETFs, and mutual funds. For this program they give access to all the data for $1 in the first 30 days and later prices at $59 per month and $495 per year.

Zacks Ultimate program gives customers access to Zacks’ market insights and the most private picks from Zacks portfolio recommendation services for only $1 in the first 30 days and later they price at $299 per month or $2,995 per year.

Use of Zacks Investment Research by the Financial Community

Benchmark for Analysis

Financial professionals often use Zacks Investment Research as a benchmark for analyzing stocks and making investment decisions. The company’s data and analytical tools provide a reliable foundation for comparative analysis. Investors use the Zacks Rank system to screen for stocks that are expected to outperform the market based on earnings estimate revisions.

According to the company website, it states that “The Zacks Mutual Fund Rank is a rating system that will help you find the best mutual funds to outperform the market. Use the Zacks Mutual Fund Rank to evaluate your current funds, find better funds, and track your funds. In addition, you can follow top-ranked funds featured in daily articles from Zacks’ team of analysts.” which shows how an investor can use their analyses as a benchmark.

Market Expectations

Zacks aggregates earnings estimates from multiple analysts to form a consensus estimate. By monitoring changes in earnings estimates, investors can understand shifts in market sentiment and expectations. Upward revisions typically indicate positive market sentiment, while downward revisions may signal potential concerns.

Zacks tracks earnings surprises, which occur when actual earnings differ significantly from consensus estimates. These surprises can lead to significant market movements and are closely watched by investors.

Earnings Season Preparation

Before earnings announcements, Zacks offers previews that include analysts’ expectations, historical earnings performance, and key factors to watch. After earnings reports are released, Zacks provides detailed analyses comparing actual results to estimates, offering insights into the implications for the company’s stock price and future performance.

Zacks Investment Research and Tests of Market Efficiency

Academic works

Zacks Investment Research is a valuable resource for academic researchers studying market efficiency and other financial theories. Researchers analyze how markets react to earnings announcements and other significant events, using Zacks’ data to test hypotheses about market efficiency.

Information Dissemination

Zacks Investment Research excels in providing up-to-date data and insights to its users. Zacks provides real-time updates on earnings estimates, stock ratings, and market news. Users can set up custom alerts for specific stocks or market events.

Zacks research and data are accessible through various platforms, including its website, mobile apps, and third-party financial services, making it easy for users to stay informed.

Pros and Cons

The Zacks Rank system and earnings estimates are known for their accuracy in predicting stock performance. Zacks offers extensive and detailed financial data, covering a wide range of companies and metrics.

On the other side, Zacks’ premium services can be expensive, potentially limiting access for smaller firms or individual investors. And the depth of information and tools available may require a learning curve for new users.

Conclusion

Zacks offers a wealth of data and analysis that helps in making informed investment decisions. By focusing on earnings estimates and revisions, Zacks helps investors predict stock performance more accurately. The user-friendly tools and real-time updates make it accessible for both beginners and experienced investors.

Why should I be interested in this post?

For management students, understanding and utilizing tools like Zacks Investment Research can provide a significant edge in the financial world. Learning to use such resources effectively can enhance our analytical skills and prepare us for a successful career in finance and investment management.

Related posts on the SimTrade blog

   ▶ Aamey MEHTA Market efficiency: the case study of Yes bank in India

   ▶ Louis DETALLE The importance of data in finance

   ▶ Bijal GANDHI Earnings per share

Useful resources

Zacks Investment Research Zacks Fundamental Data – Company Profile and Financial Statement Data

Zacks Investment Research Our Research. Your Success.

Fidelity Research Firm: Zacks Investment Research

Zacks Investment Research Find the Service That’s Right For You

Zacks Investment Research Zacks Mutual Fund Rank

About the author

The article was written in May 2024 by Nithisha CHALLA (ESSEC Business School, Grande Ecole Program – Master in Management (MiM), 2021-2024).

Bloomberg

Bloomberg

Nithisha CHALLA

In this article, Nithisha CHALLA (ESSEC Business School, Grande Ecole Program – Master in Management (MiM), 2021-2024) presents Bloomberg, which provides financial data, news and analytics for the financial community.

Bloomberg

Bloomberg is a company that provides financial data, news, and analytics to people in finance and other industries. The company was created to address the need for better financial data and analytics access in the business world. Bloomberg’s flagship product is the Bloomberg Terminal, a computer software system that provides real-time data on financial markets, economic indicators, and news.

Logo of Bloomberg
Logo of Bloomberg
Source: Bloomberg

History

Bloomberg LP was founded in 1981 by Michael Bloomberg, a former investment banker who recognized the growing demand for reliable financial information and analytics. The company initially focused on developing and selling computer terminals that provided real-time data on stocks, bonds, and other financial instruments.

Bloomberg’s key innovation, Bloomberg Terminal, was introduced in the early 1980s. This groundbreaking platform revolutionized the way financial professionals accessed market data and news, offering a comprehensive toolset for trading, analysis, and research.

Over the years, Bloomberg expanded its offerings beyond terminals to include data analytics, financial software, and media services. Bloomberg News, launched in 1990, became a prominent source of business and financial journalism, providing timely news coverage and insightful analysis to subscribers worldwide.

In the 21st century, Bloomberg continued to innovate and diversify its business, introducing new products and services tailored to the evolving needs of the financial industry. The company expanded its global presence with offices in major financial centers across North America, Europe, Asia, and beyond.

Today, the company’s commitment to innovation, integrity, and excellence has solidified its position as a trusted partner for businesses, governments, and institutions seeking reliable financial information and insights.

Bloomberg has evolved since its introduction in 1981 and has grown the company from a single location to 176 locations and with 20000 employees. Bloomberg with over 40 years of history, facilitates bottom-up and top-down analysis to better assess potential growth and risk as well as future value across industry, sector, index, country, and region.

Bloomberg covers a wide range of firms across different industries, sectors, and regions. According to Chen (2023), Bloomberg grew to a leading financial company with over 325,000 subscriptions to its professional services, almost 1 million global circulations of Bloomberg Businessweek, and over 150 news bureaus internationally. To support this massive network of financial information, data encryption, messaging, and trading, Bloomberg employs over 4,000 computer engineers around the globe.

Key Components of Bloomberg

Earnings Estimates

Bloomberg provides estimates and forecasts about how companies will perform financially. It collects data from many sources and use it to predict things like earnings and revenue for different businesses.

According to Guttmann from Statista (2022), Bloomberg LP, which operates within the business of information services, news services, broadcasting, streaming, and print, generated an estimated 12.2 billion U.S. dollars. A year earlier, the company’s revenue results stood at 10 billion dollars.

Revenue Projections

Alongside earnings estimates, Bloomberg provides forecasts on how much revenue companies are expected to generate. This helps stakeholders analyze and project the growth and performance of businesses over specific periods.

For example, on June 01, 2023, Bloomberg Intelligence released an expected revenue projection on the AI industry for the next ten years stating “Rising demand for generative AI products could add about $280 billion of new software revenue and the Emerging Industry Could Grow at a CAGR of 42% Over the Next 10 Years”. This helps stakeholders of the respective industry to analyze, project, and invest accordingly.

Forecasts for Key Financial Metrics

Bloomberg’s platform includes forecasts for various important financial metrics beyond earnings and revenue, such as cash flow, profit margins, and growth rates. These forecasts assist in assessing the overall financial health and prospects of companies.

In April 2024, Bloomberg launched a point-in-time data solution that gives quants a competitive edge. By pre-ingesting, mapping, and linking many different data sources together, Bloomberg allows customers to significantly reduce the time needed to generate signals or insights. With this launch, Bloomberg is responding to customers’ need for differentiated, value-adding data with standardized company-level fundamentals, estimates, and deep industry-specific metrics, alongside macro information.

Coverage

Bloomberg covers a wide range of companies across different industries, from large corporations to smaller businesses. This extensive coverage ensures that users have access to comprehensive financial data and insights.

Bloomberg Markets maintains coverage of stocks, bonds, commodities, emerging markets, and forex markets from more than 160 countries. Bloomberg Politics holds the largest news agency in the world in US politics and major global events with more than 1000 reporters and staff. Bloomberg News publishes around 5000 stories daily.

Period

Bloomberg usually provides data with the longest available time period. For example, for Bitcoin data starts in 2010.

Frequency

The period and frequency of forecasts on Bloomberg vary based on user needs and market dynamics. Users can access real-time updates and forecasts as frequently as necessary to stay informed about market changes and company performance.

Bloomberg offers the only cloud-native real-time data delivery option suitable for capital markets use. It delivers B-PIPE through an intra-cloud connection to a managed virtual private cloud on Amazon Web Services (AWS) via AWS Private Link. This low-latency option provides speed, reliability, and security via connectivity that remains solely in AWS.

Pricing

The specific pricing for accessing Bloomberg data is mentioned on the Bloomberg website and it states to have categories like all-in access, limited access, and also has special student access for limited data. The cost likely varies based on the package and offerings selected, which can include different data sets, yearly or monthly subscriptions, and access methods. For detailed pricing information, it is recommended to directly go through the Bloomberg website as it includes very precise information that pretty much caters to all the needs based on the functionality.

Bloomberg charges a fee for its services, usually on a subscription basis. The cost can be high, but many financial professionals find it worth it for the valuable information they receive.

Use of Bloomberg by the Financial Community

Benchmark for Analysis

Professionals rely on Bloomberg’s extensive database of financial data, economic indicators, and market news to conduct in-depth analyses of companies, industries, and markets. The platform provides powerful tools and customizable features that enable users to create detailed financial models, perform comparative analysis, and track key performance metrics.

Market Expectations

Financial professionals use Bloomberg to stay informed about market expectations and sentiment. The platform aggregates market forecasts, including earnings estimates, revenue projections, and economic indicators, allowing users to assess consensus expectations and potential market trends. Bloomberg’s real-time updates and customizable alerts enable users to monitor shifts in market sentiment and adjust investment strategies accordingly.

Earnings Season Preparation

During earnings seasons, Bloomberg becomes an essential tool for financial professionals preparing for corporate earnings releases. The platform’s earnings analysis tools help users interpret financial results, identify underlying trends, and make informed decisions based on earnings reports.

Bloomberg and Tests of Market Efficiency

Academic works

Researchers and scholars leverage Bloomberg’s vast dataset and analytics tools to conduct empirical studies on market behavior, information dissemination, and the efficiency of asset pricing models. By analyzing historical market data and real-time information flow, academics assess the degree to which markets reflect all available information and efficiently incorporate new information into asset prices.

Information Dissemination

One key aspect of market efficiency is the speed and accuracy of information dissemination. Bloomberg facilitates the rapid dissemination of market news, economic data, and corporate announcements to a global audience of financial professionals. Researchers use Bloomberg to study how quickly information is incorporated into asset prices and whether markets efficiently reflect public and private information.

Pros and Cons

Given its history and operations in widely known industries and markets, we certainly need to know the pros and cons of Bloomberg.

Bloomberg provides users with access to extensive financial data and analytics, enabling rigorous empirical studies on market efficiency. Bloomberg’s customizable tools and advanced features facilitate complex analyses and modeling for testing various market efficiency hypotheses. The platform offers real-time updates and historical data, allowing researchers to analyze market behavior over different periods and market conditions.

On the other side, Bloomberg’s subscription costs may limit access to users with limited budgets or academic institutions with constrained resources. The complexity of Bloomberg’s interface and data structure may also present a learning curve for users new to the platform.

Conclusion

Bloomberg’s impact extends across the financial community, serving as a trusted resource for investors, traders, analysts, and corporate professionals worldwide.

Why should I be interested in this post?

According to me, mastering Bloomberg can equip management students with valuable skills and knowledge that are directly applicable to careers in finance, business analysis, and strategic management. It offers a practical way to enhance analytical capabilities, stay updated with industry trends, and build a strong foundation for future professional success.

Related posts on the SimTrade blog

   ▶ Aamey MEHTA Market efficiency: the case study of Yes bank in India

   ▶ Louis DETALLE The importance of data in finance

   ▶ Bijal GANDHI Earnings per share

Useful resources

Bloomberg

Wikipedia Bloomberg L.P.

Statista Estimated revenue generated by Bloomberg LP worldwide from 2015 to 2022

Bloomberg Generative AI to Become a $1.3 Trillion Market by 2032, Research Finds

Bloomberg Bloomberg Launches Point-in-Time Data Solution that Gives Quants a Competitive Edge

About the author

The article was written in May 2024 by Nithisha CHALLA (ESSEC Business School, Grande Ecole Program – Master in Management (MiM), 2021-2024).
FactSet

FactSet

Nithisha CHALLA

In this article, Nithisha CHALLA (ESSEC Business School, Grande Ecole Program – Master in Management (MiM), 2021-2024) presents FactSet, which provides financial data, news and analytics for the financial community.

Introduction

FactSet also known as FactSet Research Systems Inc. is a leading provider of financial data and analytics solutions, catering to professionals in the investment industry. Whether you are a financial analyst, portfolio manager, or student of finance, FactSet offers powerful tools and resources to analyze markets, evaluate companies, and make informed investment decisions.

Logo of Factset
Logo of Factset
Source: Factset

History

Founded in 1978 by Howard Wille and Charles Snyder, FactSet began as a startup aiming to revolutionize financial data analysis. The company initially focused on providing financial analysis software for investment professionals, aiming to streamline data processing and analysis in the rapidly evolving financial industry.

Throughout the 1980s and 1990s, FactSet expanded its product offerings and market presence, catering to a growing demand for sophisticated financial data and analytics solutions. In its journey of growth and expansion, FactSet has made several strategic acquisitions to enhance its product portfolio and expand its market reach.

In 2007, FactSet acquired Market Metrics, a provider of market research and consulting services for asset managers. In 2015, FactSet acquired Portware LLC, a leading provider of multi-asset trade automation solutions for asset managers and institutional traders. In 2020, FactSet acquired Truvalue Labs, a pioneer in AI-driven environmental, social, and governance (ESG) data and analytics.

From its humble beginnings in the late 1970s to its current status as a global leader in financial data and analytics, FactSet has continually evolved to meet the evolving needs of the investment community.

Key Components of FactSet Research Systems

Earnings Estimates

Earnings estimates refer to predictions made by financial analysts and experts regarding how much profit a company is expected to generate in the future.FactSet gathers and provides these estimates, which are crucial for investors and analysts to assess a company’s potential performance.

According to Factset, 2024, the company’s consensus estimates are aggregated from a wide base of contributors and cover 19,000+ active companies across 90+ countries.

Revenue Projections

Revenue projections indicate how much revenue a company is expected to generate over a specific period. FactSet’s revenue projections are based on industry trends, market conditions, and company-specific factors, providing users with valuable insights into sales performance and revenue drivers.

For example, in June 2024, Factset released an expected revenue projection for S&P 500 companies stating “The blended (companies that reported and the estimation of the companies yet to report)earnings growth rate for the S&P 500 for Q4 2023 is 3.2%. It should be noted that analysts are currently projecting (year-over-year) revenue growth for all four quarters of 2024. For Q1 2024 through Q4 2024, the current estimates for revenue growth are 3.5%, 4.6%, 5.0%, and 5.7%, respectively.”. This helps stakeholders of the respective industry to analyze, project, and invest accordingly.

Forecasts for Key Financial Metrics

In addition to earnings estimates, FactSet offers forecasts for key financial metrics such as revenue growth rates, cash flow projections, and profit margins. These forecasts provide insights into overall financial health and performance metrics, helping users assess business strategies, identify growth opportunities, and make informed investment decisions. By analyzing financial forecasts, users can anticipate market trends and evaluate the potential impact on investment portfolios.

Coverage

FactSet covers a wide range of companies across different industries, from large corporations to smaller businesses. This extensive coverage ensures that users have access to comprehensive financial data and insights.

FactSet provides access to 200+ data items, including 100+ metrics across 18 industries encompassing airlines, banking, insurance, oil/gas, and retail. It leverages estimates that are collected directly from the research reports and flat file feeds of 800+ contributors across 55 countries.

Period

Factset has evolved since its introduction in 1978 and in 2023, Factset has expanded its client base to over 7,900 and increased its user base by 6%, surpassing 189,000 users. Factset with over 45 years of history, facilitates top-down analysis to better assess potential growth and risk as well as future value across industry, sector, index, country, and region.

Frequency

The period and frequency of forecasts on Factset vary based on user needs and market dynamics. FactSet incorporates quarterly and annual financial reports from companies, including earnings releases, revenue figures, balance sheets, and cash flow statements. Users can access real-time updates and forecasts based on two categories that are data frequency and update frequency, where they provide quarterly data frequency and an intraday update frequency.

FactSet also includes on a timely basis event-driven updates such as corporate actions (e.g., mergers, acquisitions, dividends) and regulatory filings (e.g., SEC filings), providing comprehensive coverage of market events impacting investment decisions.

Firms and Financial analysts

According to James Chen (2023à, FactSet is broken down into three business units: one in the United States, one in Europe, and one in Asia-Pacific. The business unit located in the United States provides financial solutions to financial professionals as well as domestic financial institutions. The European and Asia-Pacific business units only service financial professionals in the regions in which each unit operates.

As of 2023, FactSet services over 200,000 users in more than 8,000 companies and organizations. FactSet has 37 offices in 20 countries. The company reports it has had a client retention rate of 95% with 43 years of revenue growth.

Pricing

FactSet’s pricing model varies based on subscription plans and user requirements. Students can explore different pricing tiers to access specific data sets, analytical tools, and premium features tailored to their academic or research needs. Understanding FactSet’s pricing structure is essential for management students evaluating the cost-benefit of utilizing its services for financial analysis and research purposes.

FactSet provides its services for a lower price than some of its competitors because the company uses multiple sources to provide its data, which creates pricing competition between suppliers.

Use of FactSet by the Financial Community

Benchmark for Analysis

FactSet serves as a benchmark for financial analysis, offering a comprehensive suite of tools for analyzing companies, industries, and markets. Management students can use FactSet to perform detailed financial modeling, comparative analysis, and valuation assessments, gaining practical experience in fundamental analysis techniques.

Market Expectations

FactSet provides access to economic data and forecasts that shape market expectations. Users can track indicators such as GDP growth, inflation rates, unemployment figures, and interest rate projections to anticipate broader economic trends.

Earnings Season Preparation

During earnings seasons, by leveraging FactSet’s capabilities, users can navigate earnings announcements with confidence, interpret financial results effectively, and make well-informed investment decisions based on fundamental analysis and market intelligence.

FactSet and Tests of Market Efficiency

Academic works

Academic researchers use FactSet’s extensive database and analytical tools to conduct empirical studies on various topics in finance, economics, and investment management. FactSet’s rich dataset allows researchers to analyze market behavior, asset pricing models, and the impact of economic indicators on financial markets. Researchers use FactSet to assess whether asset prices reflect all available information, conducting event studies and anomaly detection to identify market inefficiencies.

Information Dissemination

Information dissemination refers to the process of distributing financial data, market insights, and analytical reports to users within the investment community using FactSet’s platform. FactSet provides real-time market data on stock prices, indices, commodities, currencies, and other financial instruments. Users can access live updates and monitor market movements as they occur, enabling timely decision-making and risk management.

FactSet disseminates earnings releases, corporate news, and press releases from companies within its coverage universe. Users receive alerts and notifications about important announcements, enabling them to stay informed about company developments and assess potential market impacts.

Pros and Cons

Given its history and operations in so many industries and markets, we certainly need to know the pros and cons of the FactSet.

FactSet provides researchers with access to extensive financial data and analytics, and comprehensive financial data coverage across global markets. FactSet provides a user-friendly interface and intuitive features. It has very well-known powerful tools for financial analysis and investment research.

On the other side, FactSet subscription costs may limit access to users with limited budgets or in academic institutions with constrained resources. The complexity of mastering advanced functionalities may also present a learning curve for users new to the platform.

Conclusion

FactSet impact extends across the financial community, serving as a trusted resource for investors, traders, analysts, and corporate professionals worldwide.

Why should I be interested in this post?

As a management master’s student focusing on finance or strategic analysis, understanding and utilizing financial data platforms like FactSet can greatly enhance your skills and career prospects.

Related posts on the SimTrade blog

   ▶ Aamey MEHTA Market efficiency: the case study of Yes bank in India

   ▶ Louis DETALLE The importance of data in finance

   ▶ Bijal GANDHI Earnings per share

   ▶ Nithisha CHALLA Bloomberg

Useful resources

FactSet

Truvalue Labs

Wikipedia FactSet

FactSet FactSet Estimates – Consensus

FactSet FactSet Annual Report 2023

FactSet Earnings Insight

About the author

The article was written in May 2024 by Nithisha CHALLA (ESSEC Business School, Grande Ecole Program – Master in Management (MiM), 2021-2024).