In this article, Snehasish CHINARA (ESSEC Business School, Grande Ecole Program – Master in Management, 2022-2024) explains the evolution of high performance blockchain powered cryptocurrency, Solana.
Historical context and background
Solana, a relatively new entrant in the cryptocurrency arena, emerged against the backdrop of an increasingly crowded and competitive landscape in the digital currency space. Founded in 2020 by Anatoly Yakovenko, a former engineer at Qualcomm, Solana sought to address some of the inherent scalability and speed limitations plaguing earlier blockchain platforms like Ethereum. The platform is named after the Solana Beach in California, where Yakovenko often surfed, symbolizing the project’s ambition to ride the waves of innovation and technological advancement.
Unlike many other cryptocurrencies that primarily rely on Proof of Work (PoW) or Proof of Stake (PoS) consensus mechanisms, Solana introduced a novel consensus mechanism known as Proof of History (PoH). This mechanism aims to optimize transaction processing speed by organizing transactions into a series of chronological events, enabling parallel transaction processing, and significantly enhancing scalability. Solana’s emphasis on scalability and throughput has positioned it as a promising platform for decentralized applications (dApps) and decentralized finance (DeFi) projects seeking high-performance blockchain infrastructure. Its innovative approach has garnered attention and support from investors and developers alike, propelling Solana into the spotlight as one of the leading contenders in the cryptocurrency space.
Solana Logo
Source: Google.
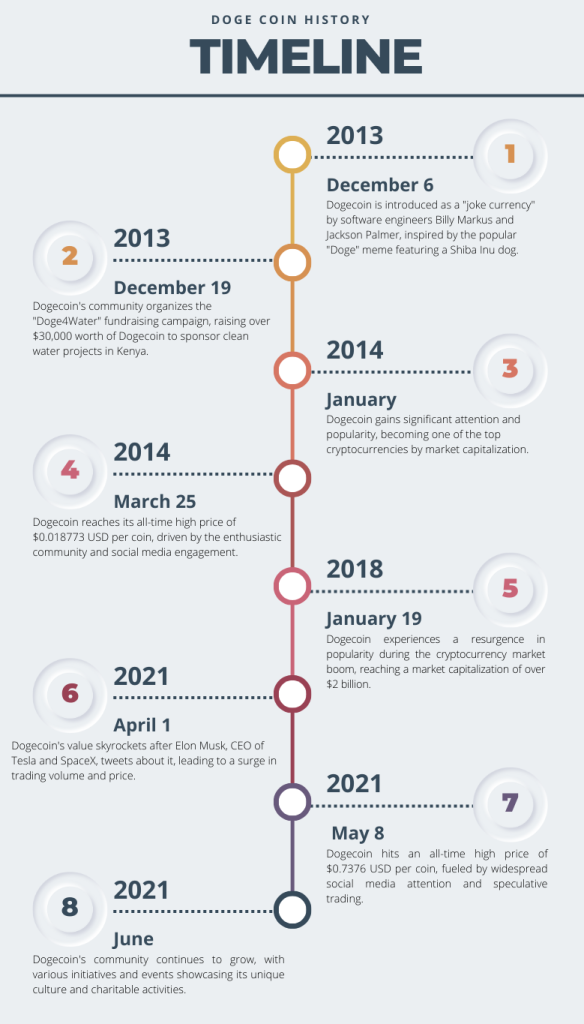
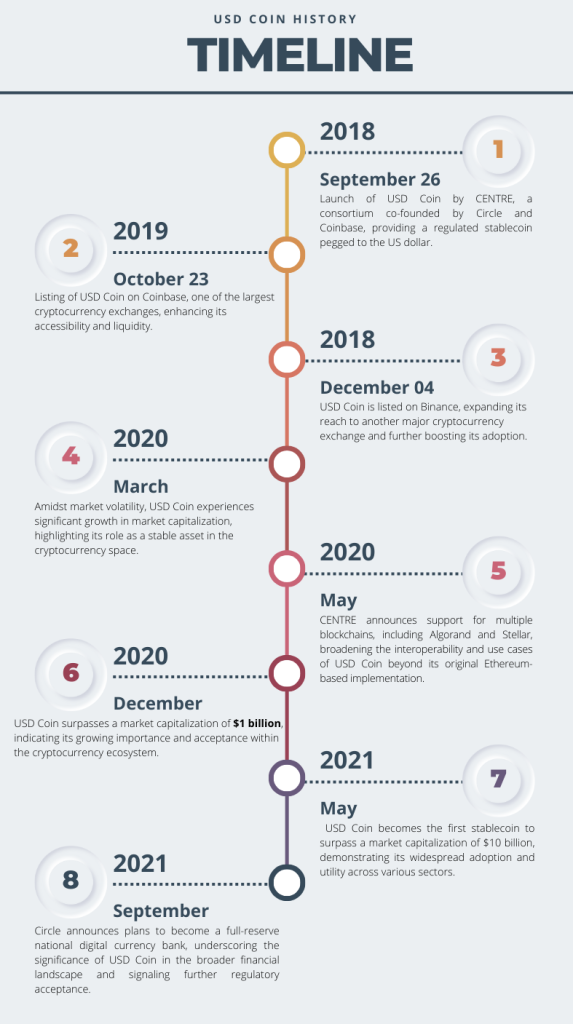
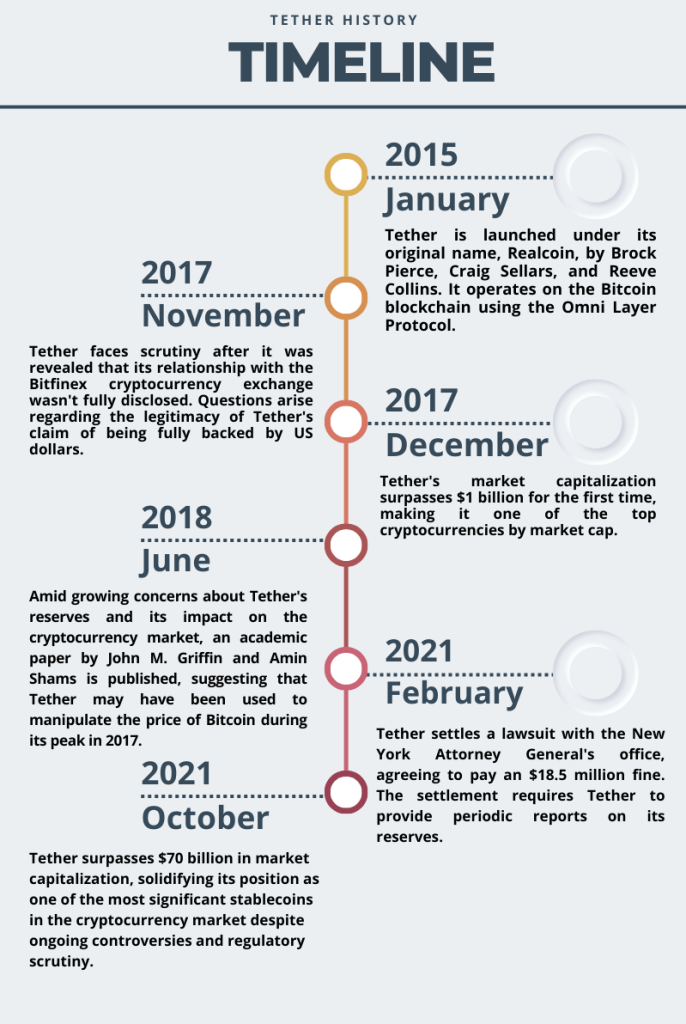
Figure 1. Key Dates in Solana History.
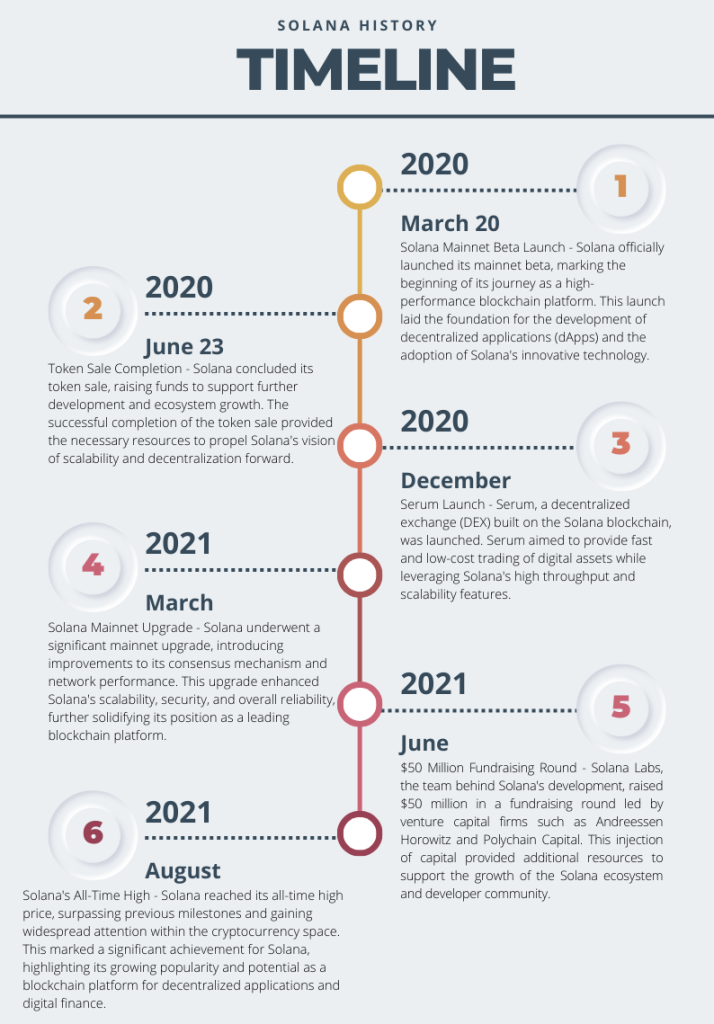
Source: Yahoo! Finance.
Key features
Scalability
Solana is designed to be highly scalable, capable of processing thousands of transactions per second. Its unique consensus mechanism, Proof of History (PoH), combined with a network of nodes running parallel processing, enables Solana to handle a high throughput of transactions efficiently.
Fast Transaction Speeds
With its focus on scalability, Solana boasts incredibly fast transaction speeds. Transactions can be confirmed in milliseconds, making it suitable for applications requiring rapid transaction processing, such as decentralized finance (DeFi) platforms and high-frequency trading.
Low Transaction Costs
Solana aims to keep transaction costs low, even during periods of high network activity. Its efficient use of resources and high throughput allow for cost-effective transactions, making it accessible to users and developers alike.
Proof of History (PoH)
Solana’s unique consensus mechanism, PoH, serves as a historical record for the ordering and time-stamping of transactions. By leveraging PoH, Solana achieves high throughput without sacrificing decentralization or security.
Support for Smart Contracts
Solana is compatible with smart contracts, allowing developers to build decentralized applications (dApps) and execute programmable transactions on the blockchain. It supports smart contract languages like Rust and Solidity, enabling a wide range of developers to build on the platform.
Ecosystem and Development Tools
Solana boasts a growing ecosystem of projects and development tools to support developers in building decentralized applications. Its developer-friendly environment includes tools such as Solana Studio, a web-based IDE for building and deploying smart contracts, and libraries for interacting with the Solana blockchain.
Interoperability
Solana is designed to be interoperable with other blockchains and protocols, facilitating seamless communication and asset transfer between different networks. This interoperability opens up possibilities for cross-chain decentralized applications and enhances the overall utility of the Solana ecosystem.
Use cases
Non-Fungible Tokens (NFTs)
Solana provides an efficient infrastructure for minting, trading, and storing NFTs. Artists, creators, and collectors are utilizing Solana-based marketplaces like Solanart to buy and sell digital collectibles, artwork, and virtual assets. Solana’s high throughput enables seamless NFT transactions, while its low fees make it appealing for creators seeking an alternative to Ethereum’s congested network.
Gaming and Virtual Worlds
Solana’s high-performance blockchain is well-suited for gaming applications and virtual worlds that require fast transaction processing and scalability. Game developers are leveraging Solana’s infrastructure to create blockchain-based games, in-game assets, and decentralized gaming platforms. Projects like Star Atlas, a space-themed massively multiplayer online game (MMO) built on Solana, demonstrate the platform’s potential to disrupt the gaming industry.
Decentralized Autonomous Organizations (DAOs)
Solana provides a robust framework for building decentralized autonomous organizations (DAOs) that enable community governance and decision-making. DAOs on Solana leverage smart contracts to automate voting mechanisms, distribute governance tokens, and execute proposals transparently and efficiently. These DAOs empower communities to collectively manage and govern decentralized protocols, platforms, and resources.
Tokenization of Real-World Assets
Solana facilitates the tokenization of real-world assets such as real estate, stocks, and commodities, enabling fractional ownership and increased liquidity. Projects are exploring Solana’s blockchain to tokenize and trade various asset classes, unlocking new investment opportunities and reducing barriers to entry for traditional markets.
Technology and underlying blockchain
At the core of Solana’s architecture is the Proof of History (PoH) consensus mechanism, which orders transactions before they are processed into blocks. This deterministic sequencing allows for parallel transaction processing and enhances overall network efficiency. Additionally, Solana utilizes a Byzantine Fault Tolerance (BFT) consensus algorithm called Tower BFT, which further ensures network security and integrity.
Solana’s blockchain implements a novel data structure known as the “Solana Architecture,” which includes a combination of a single global state, a high-speed networking stack, and a high-performance virtual machine (VM). This architecture enables Solana to achieve impressive transaction throughput, with the capability to process thousands of transactions per second (TPS) and sub-second transaction finality. Furthermore, Solana leverages a unique mechanism called “Turbine” to optimize block propagation and reduce network latency, enhancing the overall scalability and performance of the platform.
The Solana ecosystem also features a built-in decentralized exchange (DEX), supporting seamless token swaps and liquidity provision directly on-chain. Smart contracts on Solana are executed using a high-performance VM called Sealevel, which is designed to efficiently process complex computations while maintaining low transaction costs. Overall, Solana’s technology stack, comprising innovative consensus mechanisms, advanced data structures, and optimized networking protocols, positions it as a leading blockchain platform capable of supporting a wide range of decentralized applications (dApps) and use cases at scale.
Supply of coins
Solana (SOL) operates on a fixed supply model, with a maximum supply of 489,026,837 SOL tokens. Unlike traditional fiat currencies, Solana’s tokenomics are governed by the principles of cryptocurrency protocols. The initial distribution of SOL tokens occurred through a combination of token sales, strategic partnerships, ecosystem incentives, and network validators’ rewards. Notably, Solana employs a deflationary economic model, wherein a portion of transaction fees is burned, reducing the overall token supply over time. This deflationary mechanism is designed to counterbalance any potential inflationary pressures as the network expands, ensuring the long-term sustainability and scarcity of SOL tokens. Additionally, SOL tokens are used to facilitate various functions within the Solana ecosystem, including transaction fees, staking rewards, governance participation, and decentralized application interactions. As Solana continues to grow and gain adoption, the controlled and predictable token supply dynamics play a crucial role in maintaining the network’s integrity and value proposition.
Historical data for Solana
How to get the data?
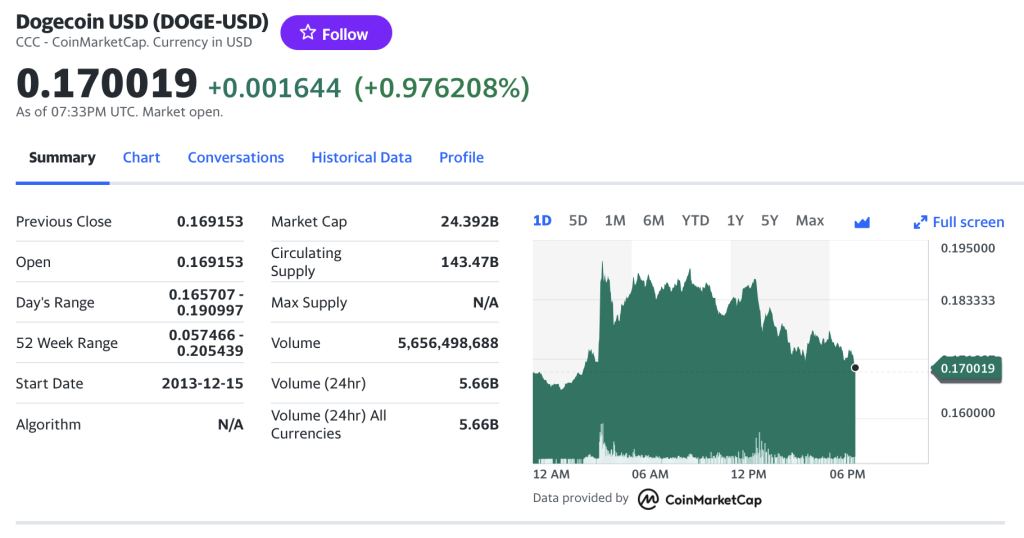
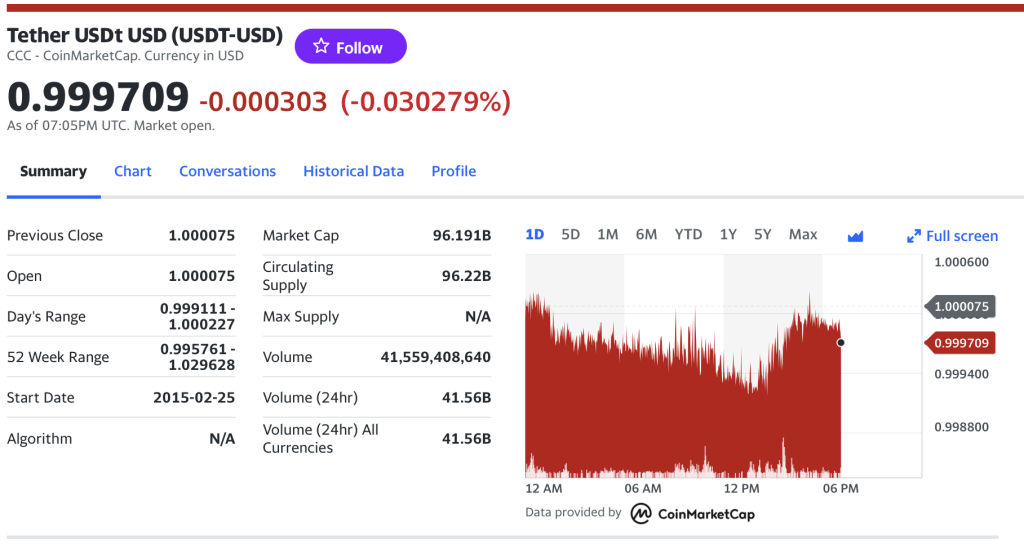
The Solana (SOL) is a popular cryptocurrency on the market, and historical data for the Solana such as prices and volume traded can be easily downloaded from the internet sources such as Yahoo! Finance, Blockchain.com & CoinMarketCap. For example, you can download data for Solana on Yahoo! Finance (the Yahoo! code for Solana is SOL-USD).Figure 2. Solana data
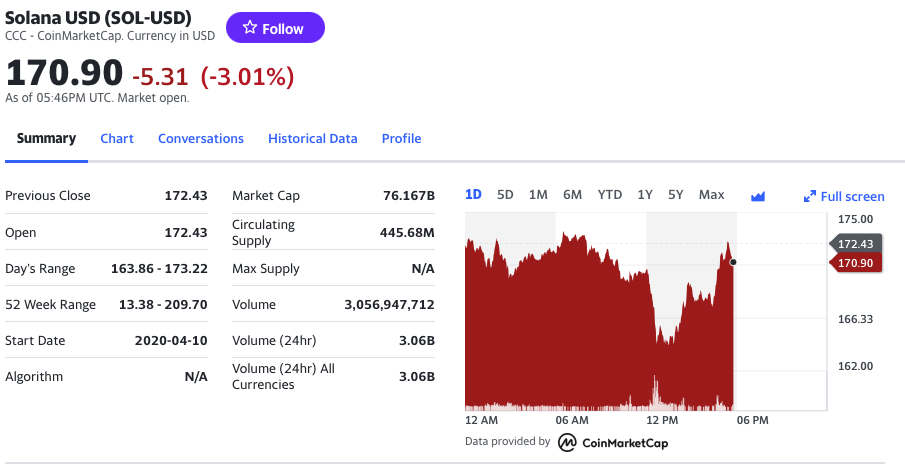
Source: Yahoo! Finance.
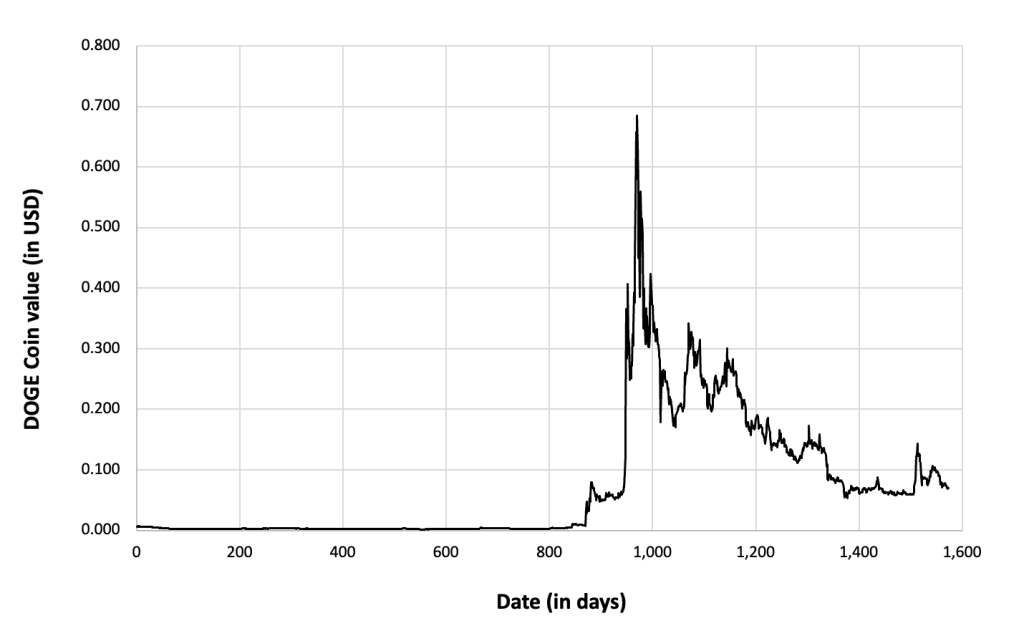
Historical data for the Solana market prices
The historical data for Solana market prices demonstrates a dynamic evolution marked by significant fluctuations and notable trends since its inception. Initially, SOL experienced modest trading activity and price levels, but as Solana gained recognition for its innovative blockchain architecture and scalability features, its market value began to ascend. Early adopters and investors drove demand for SOL tokens, leading to periods of rapid appreciation interspersed with corrections and consolidation phases. Milestones such as protocol upgrades, partnerships, and successful dApp launches often coincided with significant price movements. Moreover, broader market trends and sentiment towards cryptocurrencies influenced SOL’s price dynamics, contributing to both bullish and bearish cycles over time. Overall, SOL’s price trajectory reflects Solana’s journey from its early stages to becoming a prominent player in the blockchain space, highlighting its potential to revolutionize decentralized applications and digital finance despite the inherent volatility of the cryptocurrency market.
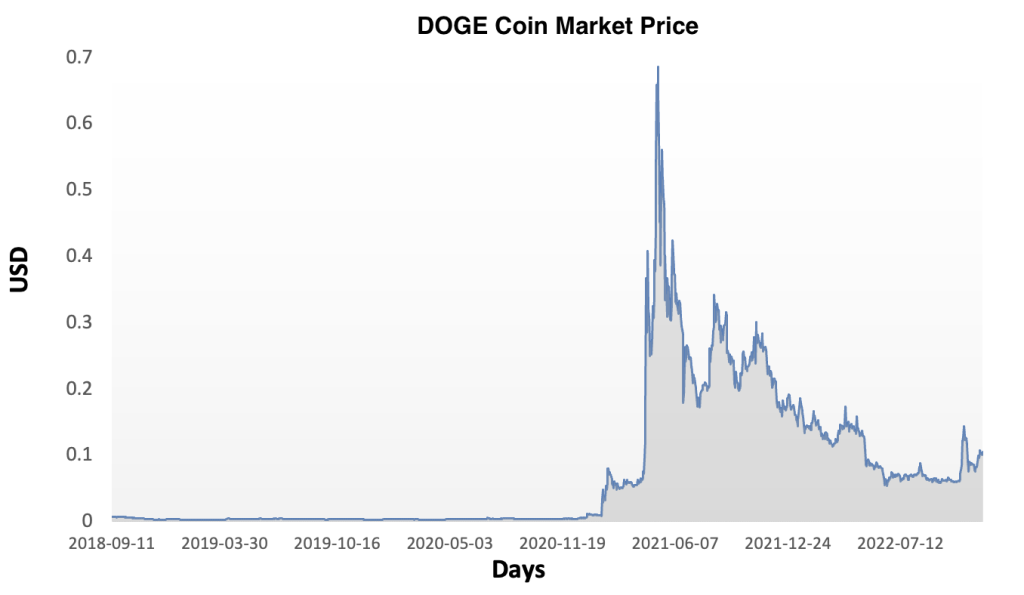
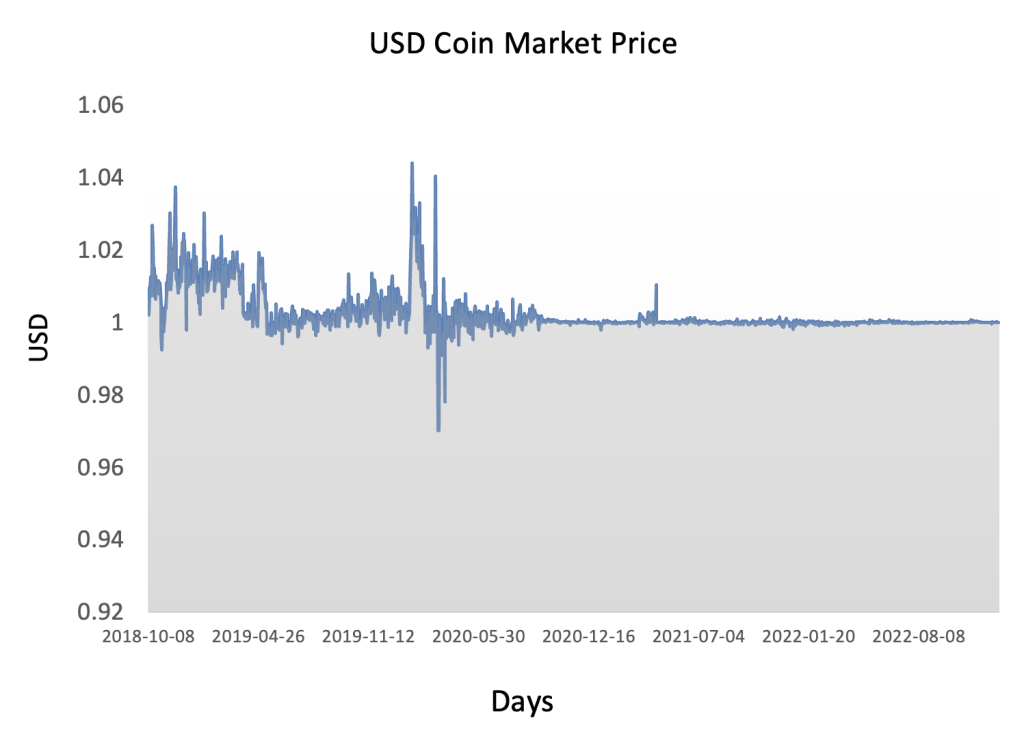
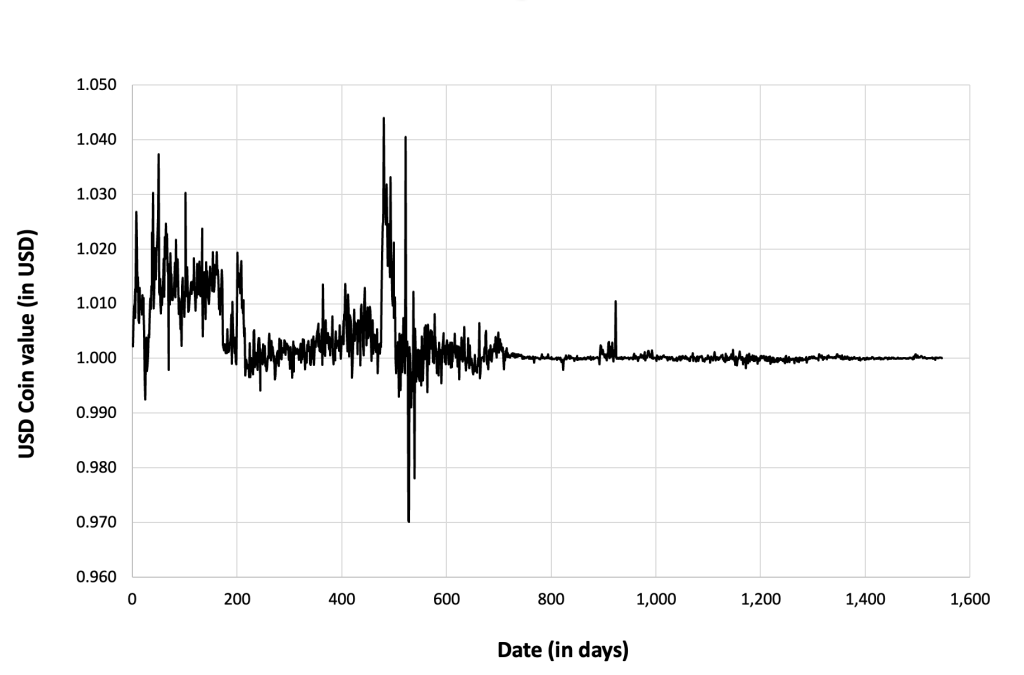
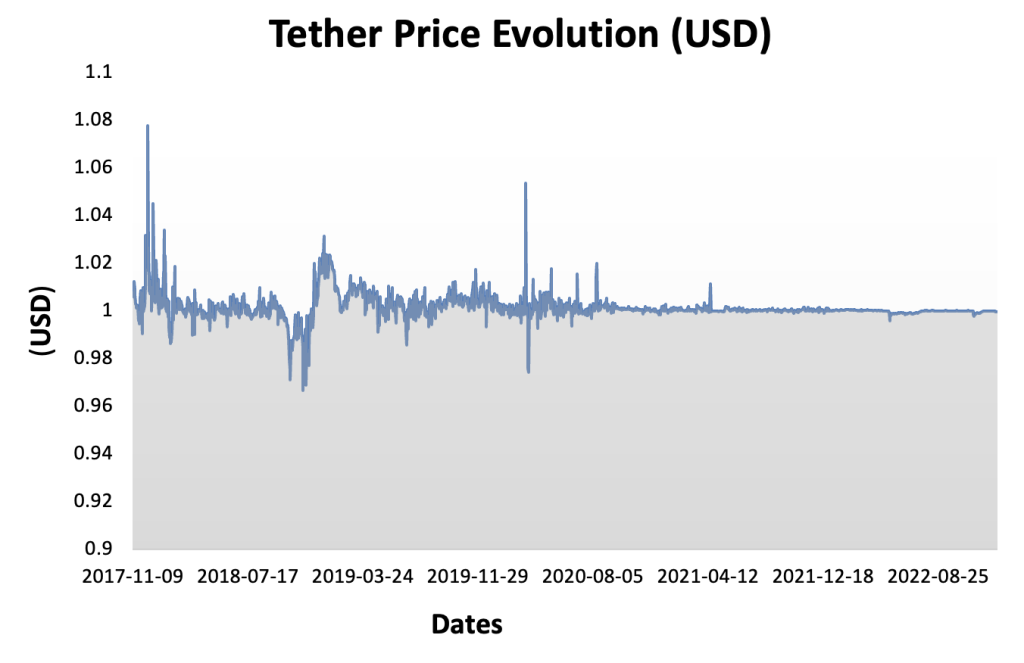
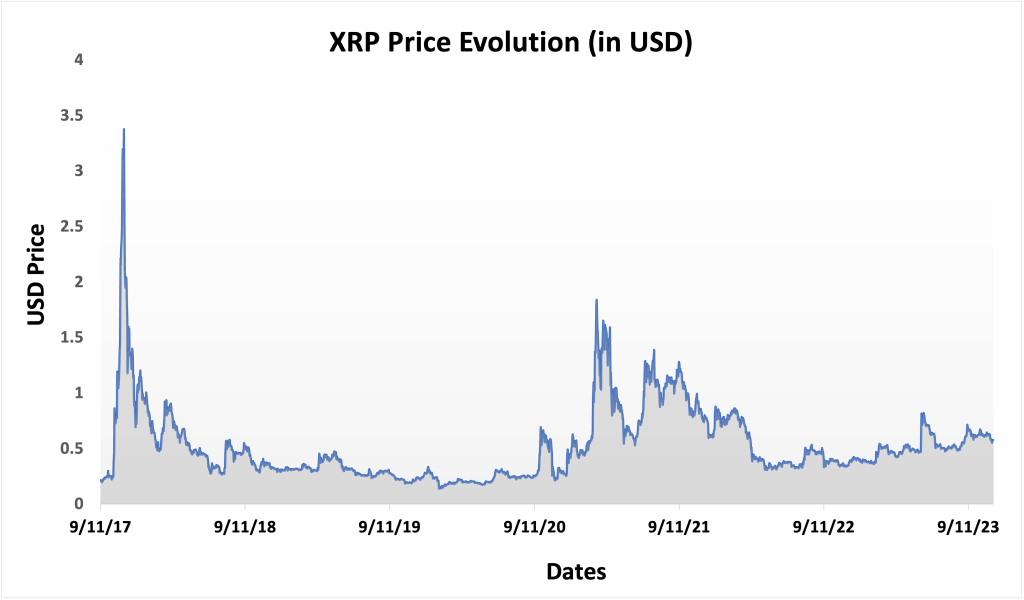
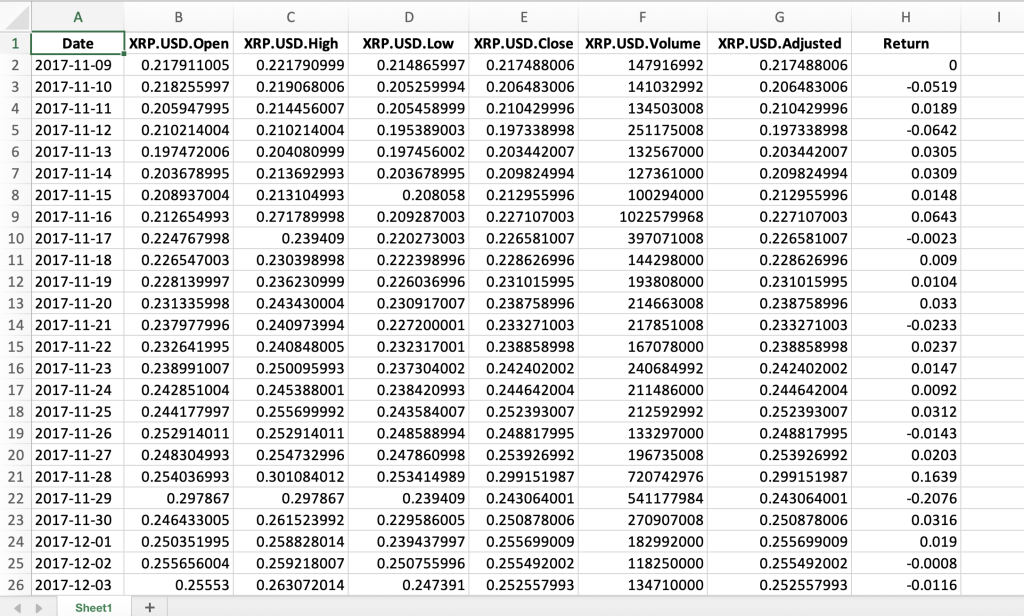
Figure 3 below represents the evolution of the price of Solana (SOL) in US dollar over the period April 2020 – December 2023. The price corresponds to the “closing” price (observed at 10:00 PM CET at the end of the month).
Figure 3. Evolution of the Solana (SOL) price
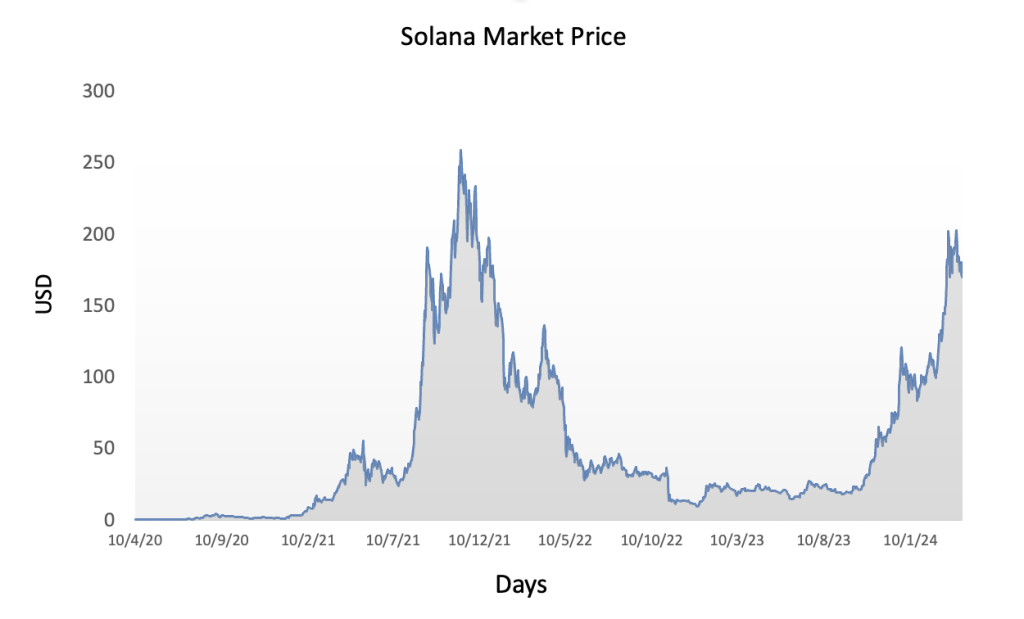
Source: Yahoo! Finance.
R program
The R program below written by Shengyu ZHENG allows you to download the data from Yahoo! Finance website and to compute summary statistics and risk measures about the Solana (SOL).

The R program that you can download above allows you to download the data for the Solana (SOL) from the Yahoo! Finance website. The database starts on April, 2020.
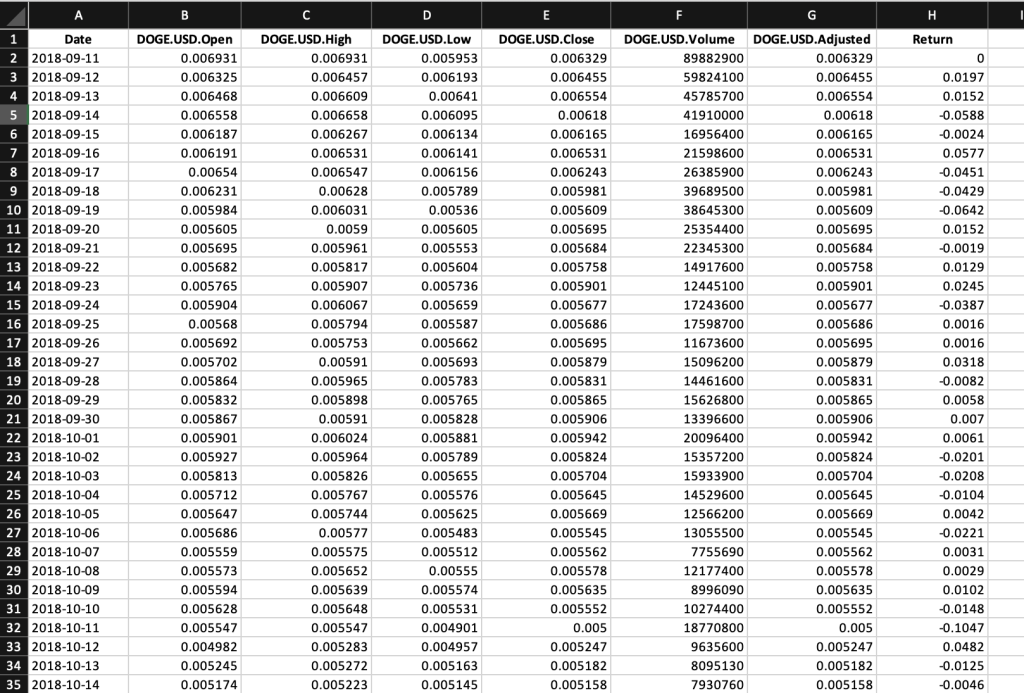
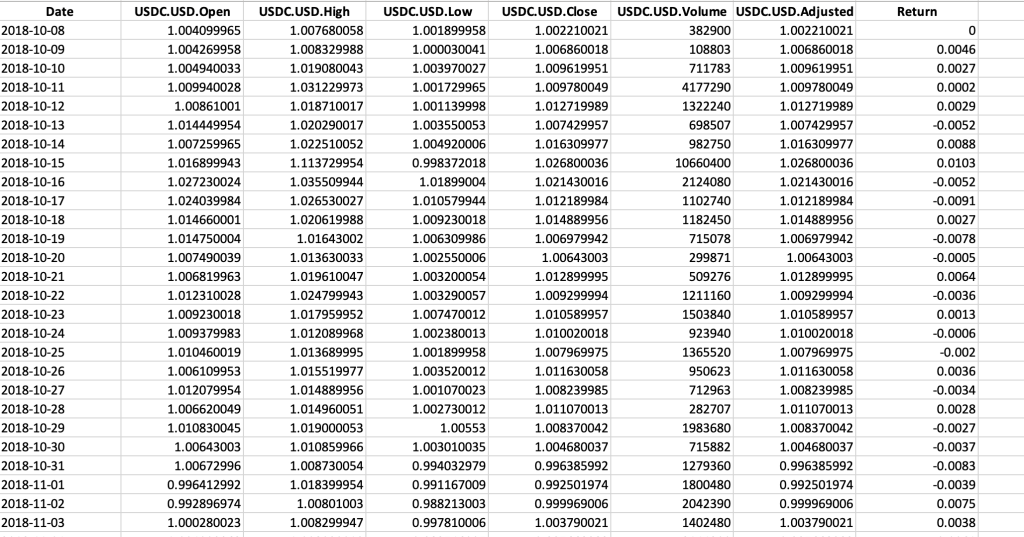
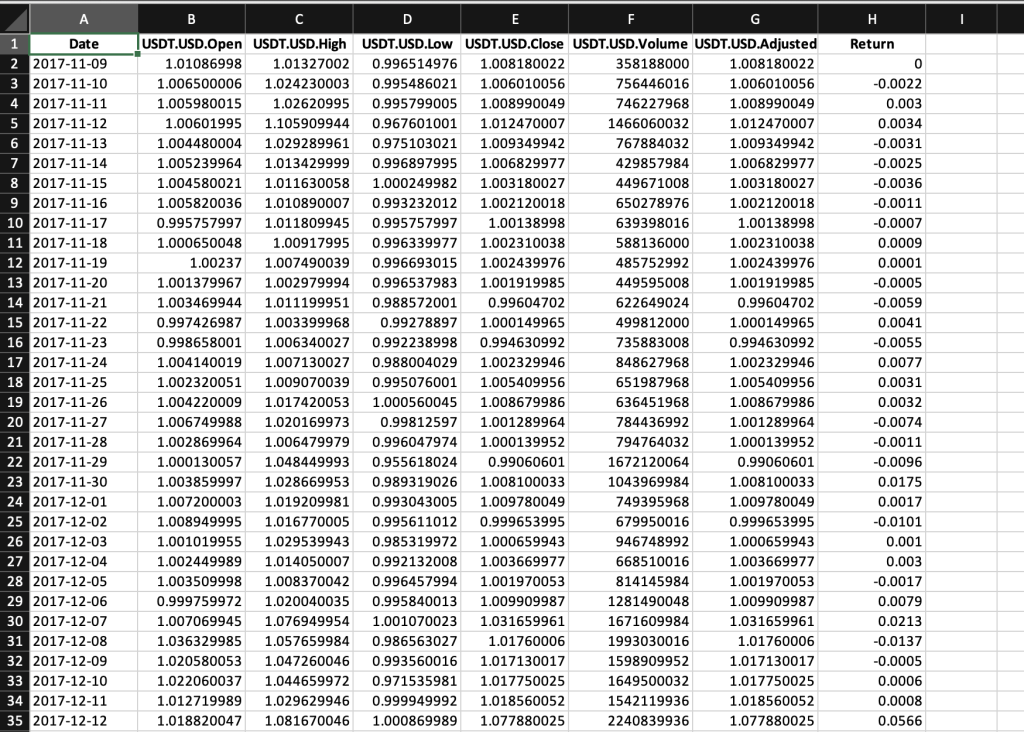
Table 1 below represents the top of the data file for the Solana (SOL) downloaded from the Yahoo! Finance website with the R program.
Table 1. Top of the data file for the Solana (SOL)
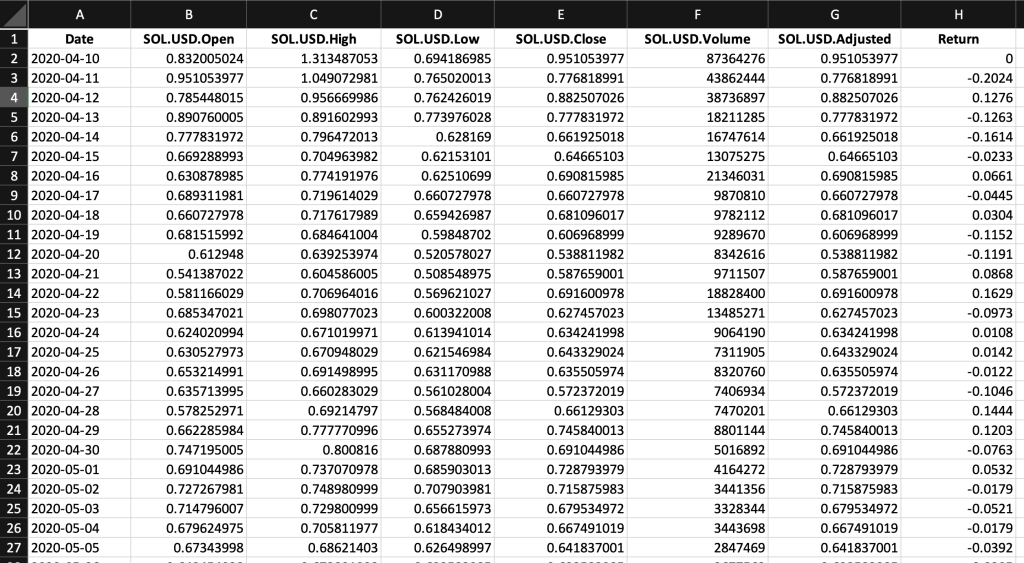
Source: computation by the author (data: Yahoo! Finance website).
Python code
You can download the Python code used to download the data from Yahoo! Finance.

Python script to download Solana (SOL) historical data and save it to an Excel sheet::
import yfinance as yf
import pandas as pd
# Define the ticker symbol for Solana Coin
SOL_ticker = “SOL-USD”
# Define the date range for historical data
start_date = “2020-01-01”
end_date = “2022-01-01”
# Download historical data using yfinance
SOL_data = yf.download(SOL_ticker, start=start_date, end=end_date)
# Create a Pandas DataFrame from the downloaded data
doge_df = pd.DataFrame(SOL_data)
# Define the Excel file path
excel_file_path = “SOL_historical_data.xlsx”
# Save the data to an Excel sheet
SOL_df.to_excel(excel_file_path, sheet_name=”SOL_historical_data”)
print(f”Data saved to {excel_file_path}”)
# Make sure you have the required libraries installed and adjust the “start_date” and “end_date” variables to the desired date range for the historical data you want to download.
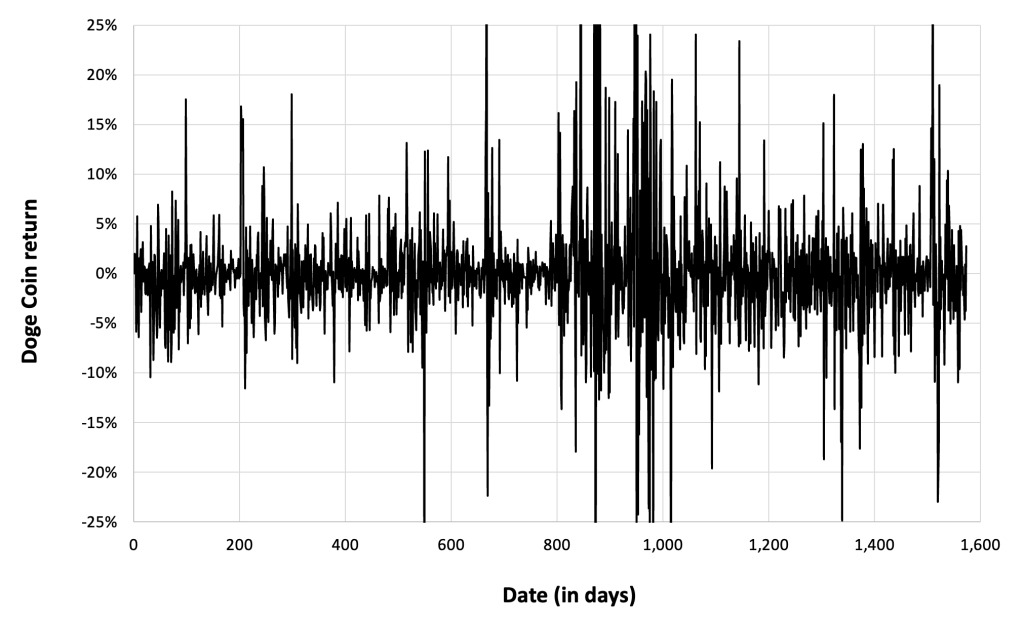
Evolution of the Solana (SOL)
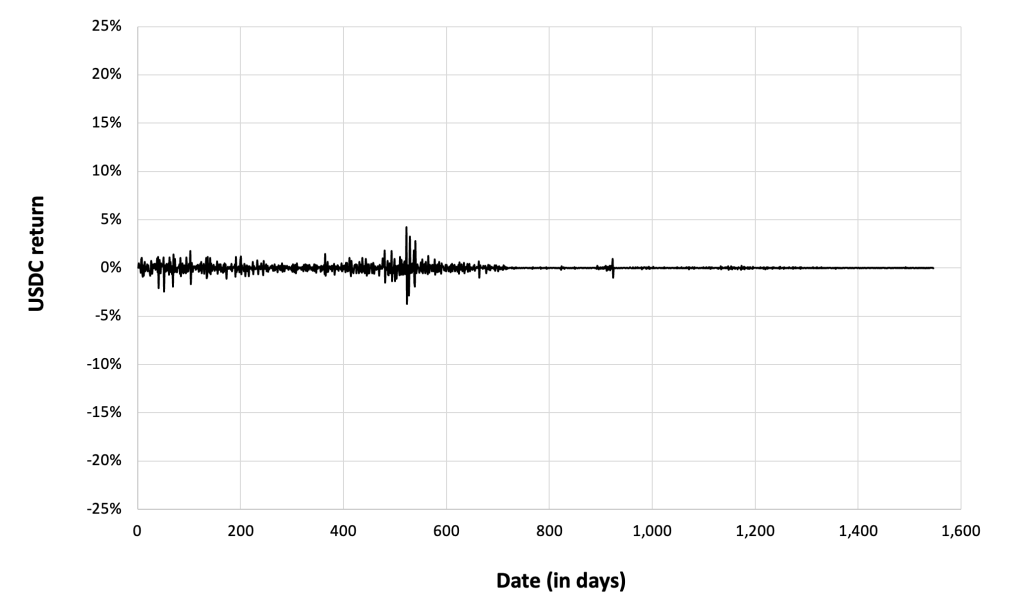
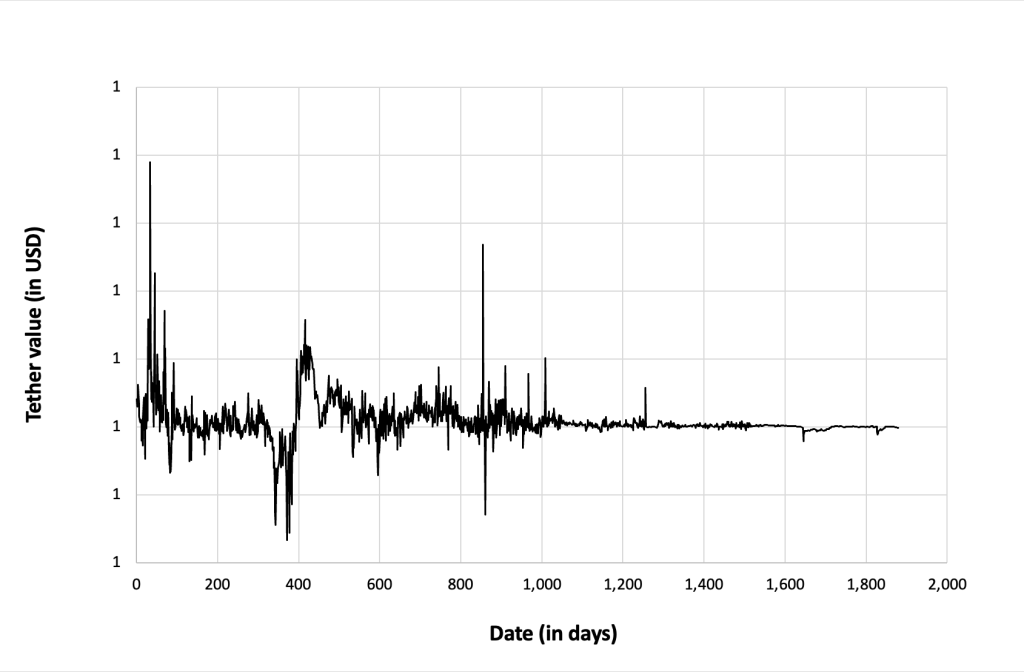
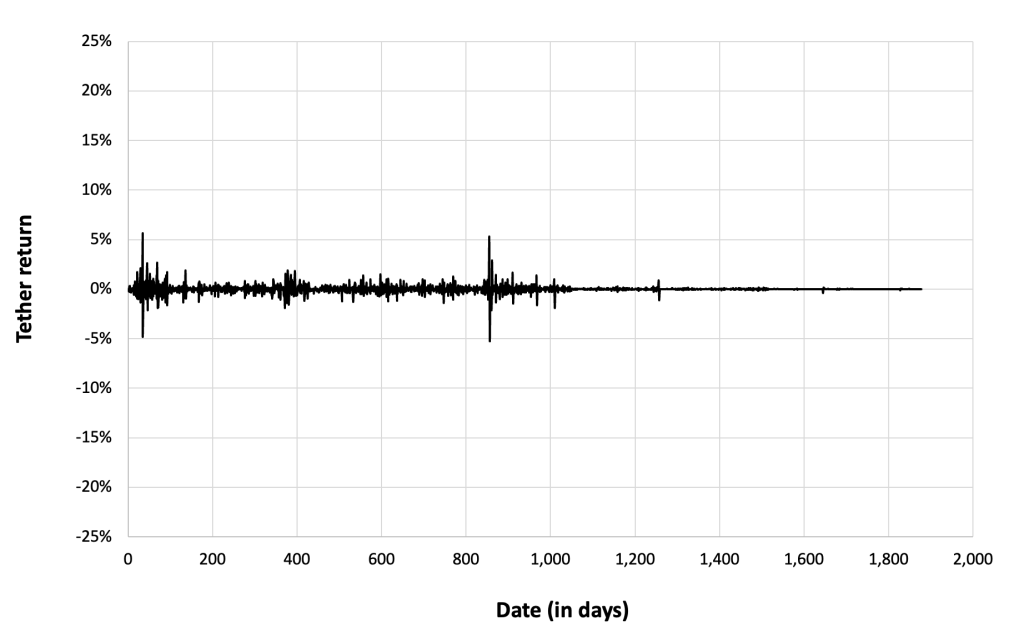
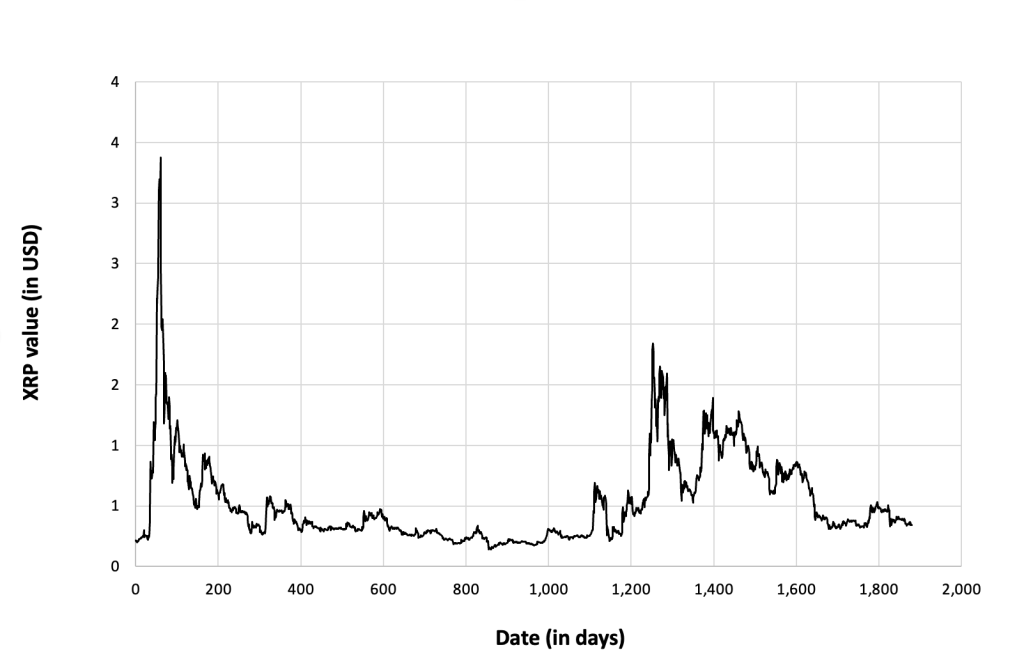
Figure 4 below gives the evolution of the Solana (SOL) returns from April, 2020 to December 31, 2023 on a daily basis.
Figure 4. Evolution of the Solana (SOL) returns.
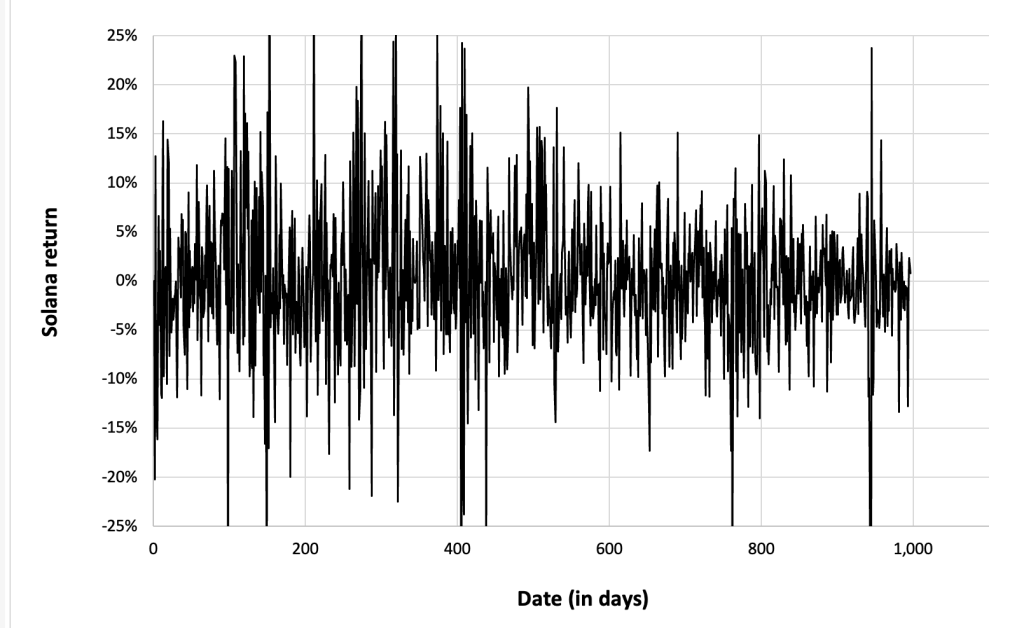
Source: computation by the author (data: Yahoo! Finance website).
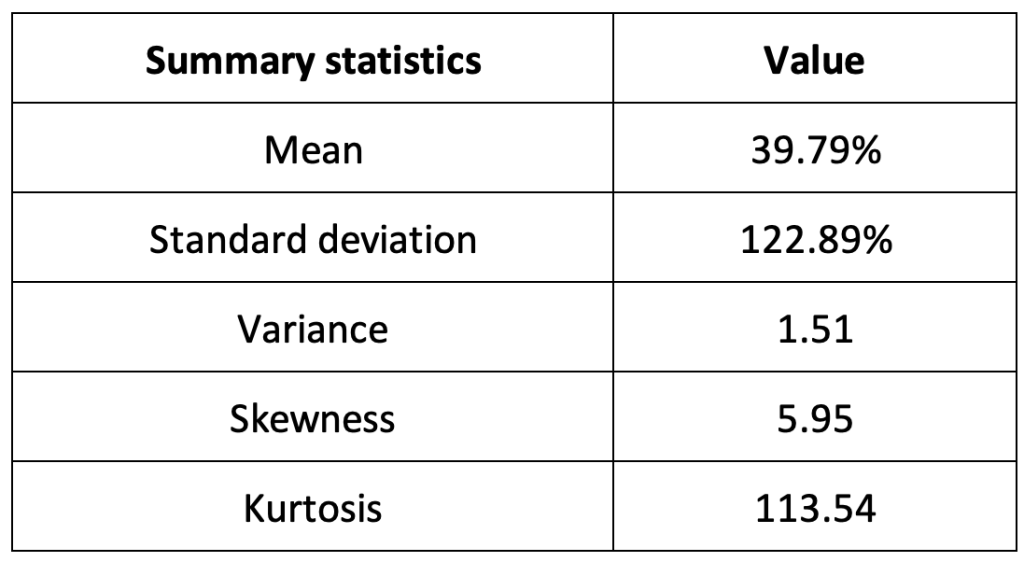
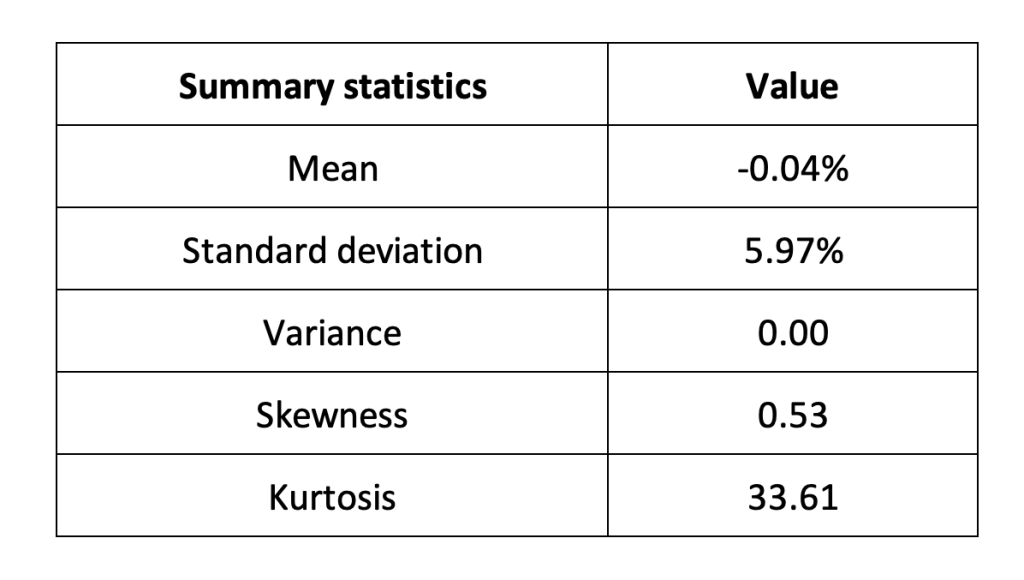
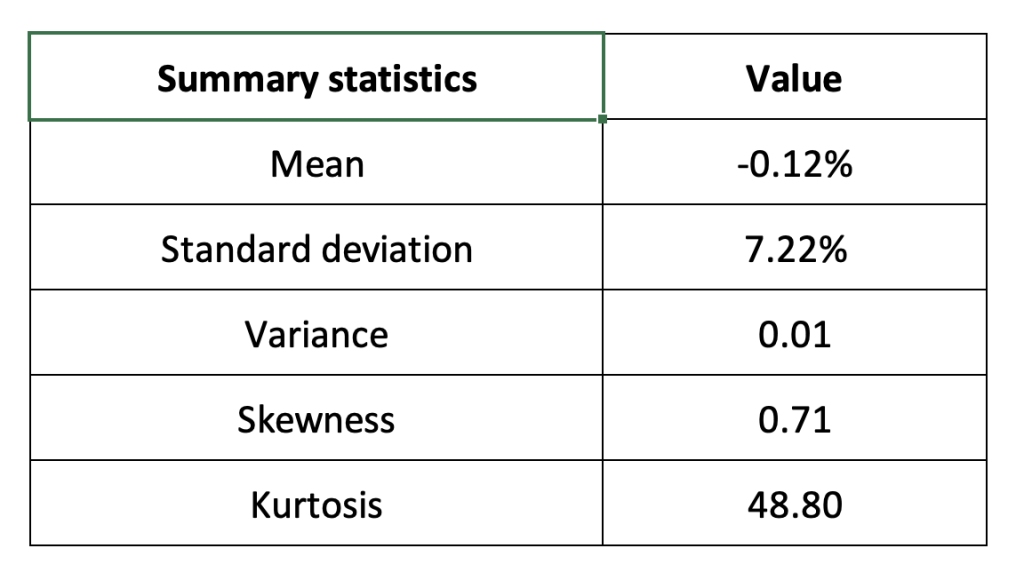
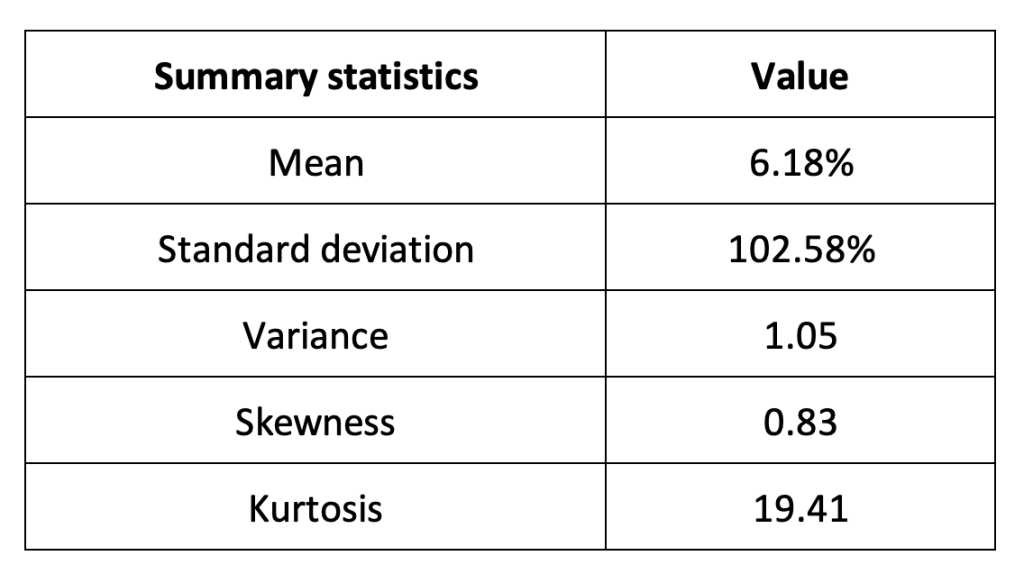
Summary statistics for the Solana (SOL)
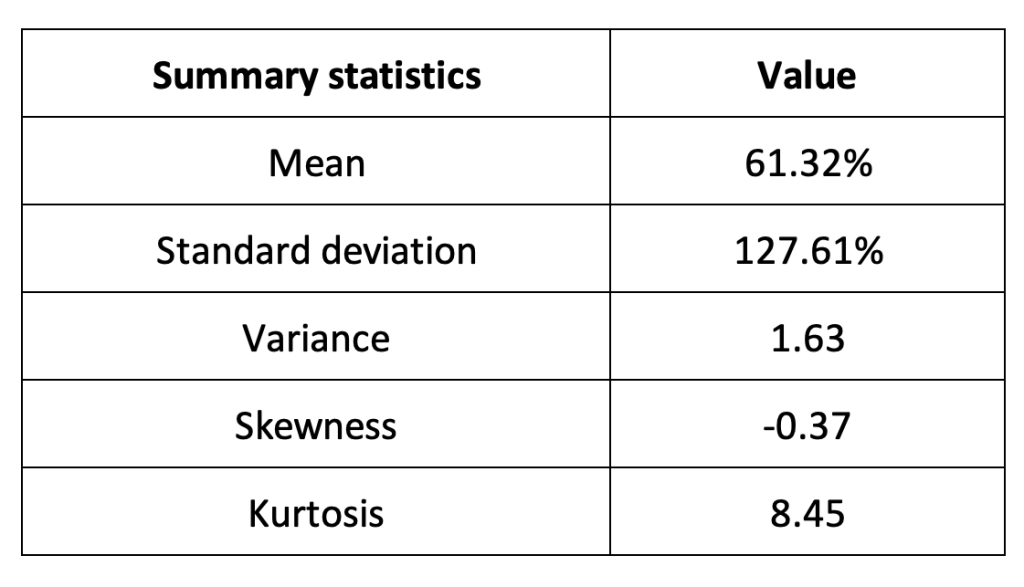
The R program that you can download above also allows you to compute summary statistics about the returns of the Solana (SOL). Table 2 below presents the following summary statistics estimated for the Solana (SOL):
- The mean
- The standard deviation (the squared root of the variance)
- The skewness
- The kurtosis.
The mean, the standard deviation / variance, the skewness, and the kurtosis refer to the first, second, third and fourth moments of statistical distribution of returns respectively.
Table 2. Summary statistics for Solana (SOL).
Source: computation by the author (data: Yahoo! Finance website).
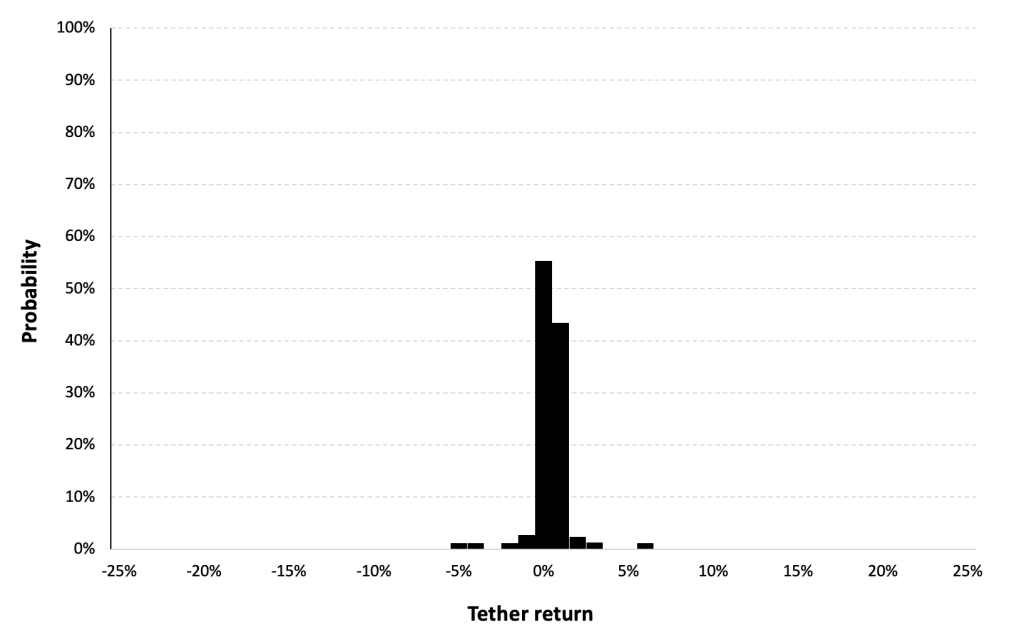
Statistical distribution of the Solana (SOL) returns
Historical distribution
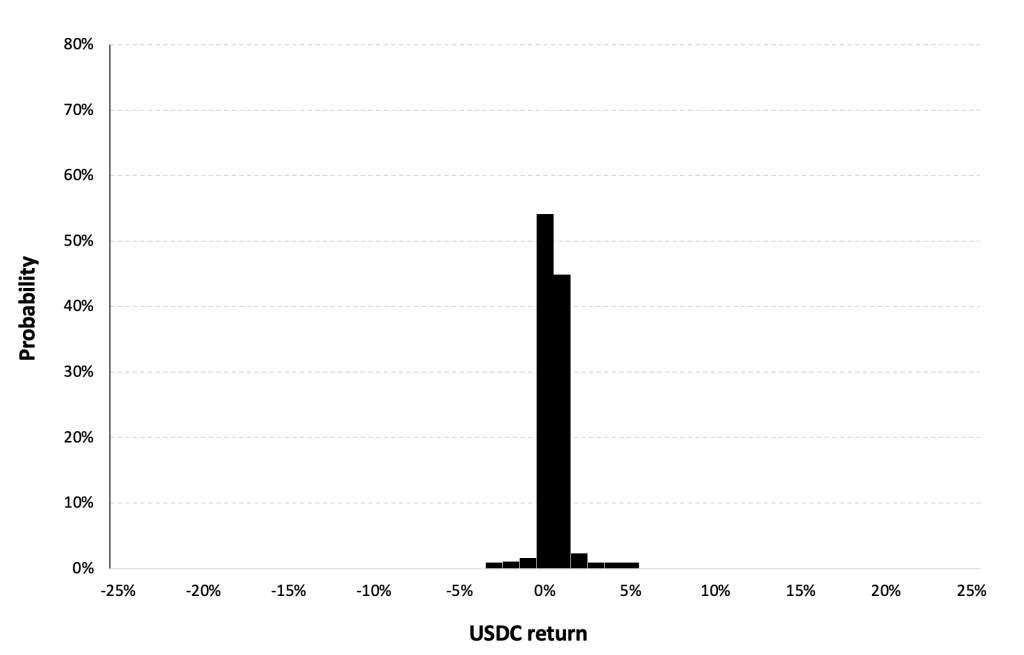
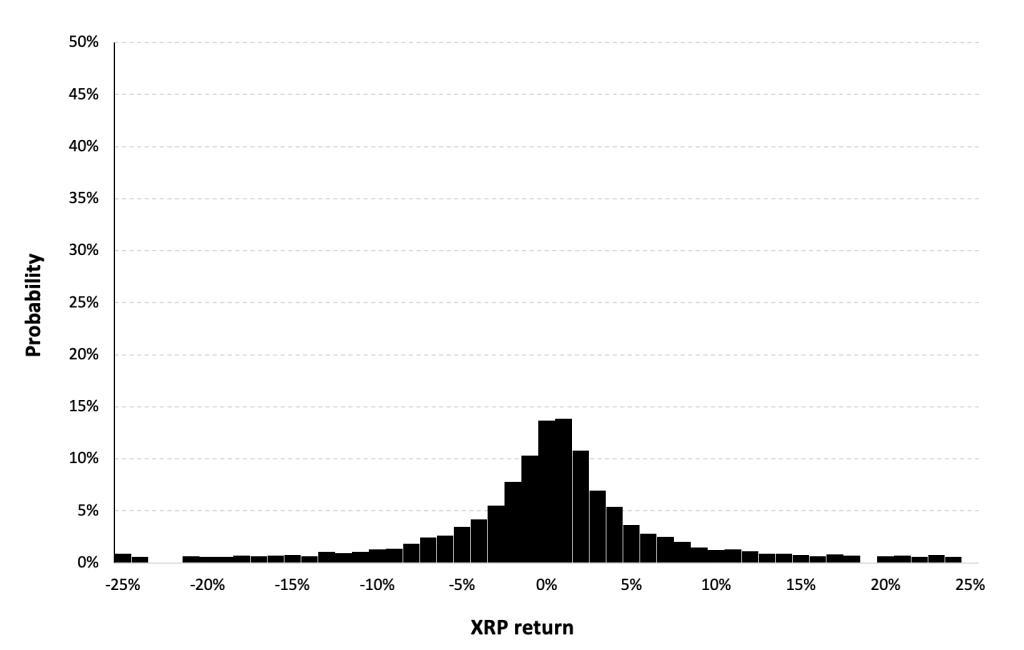
Figure 5 represents the historical distribution of the Solana (SOL) daily returns for the period from April, 2020 to December 31, 2023.
Figure 5. Historical Solana (SOL) distribution of the returns.
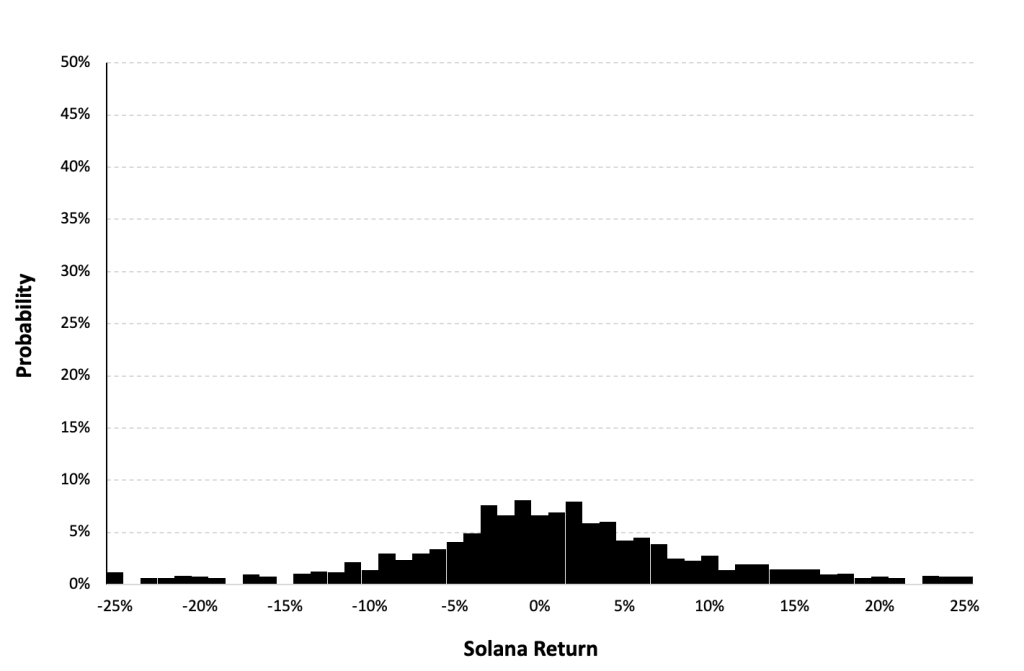
Source: computation by the author (data: Yahoo! Finance website).
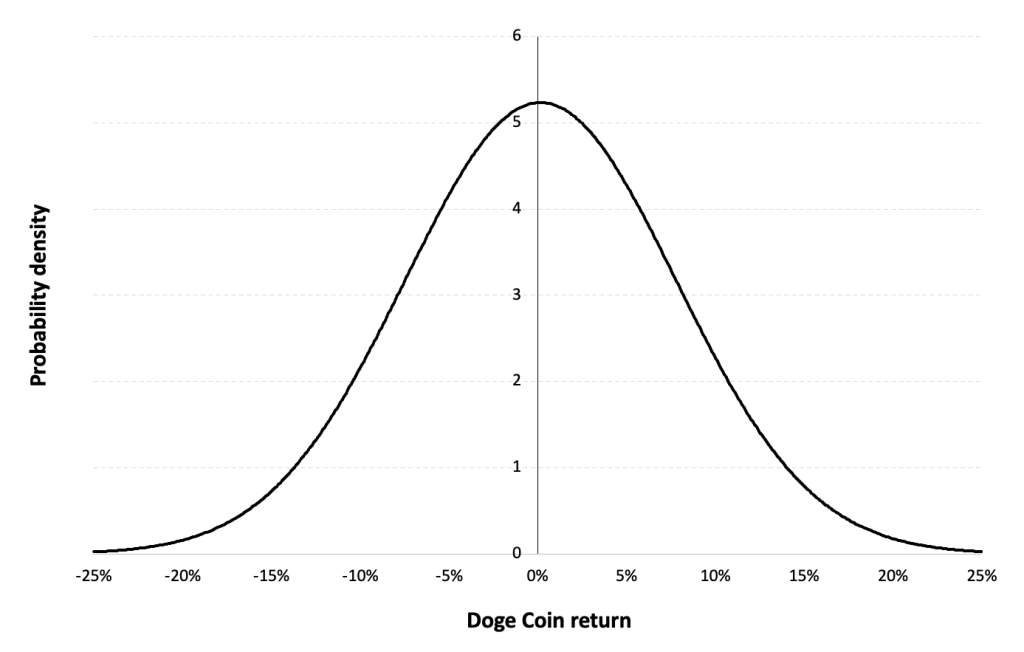
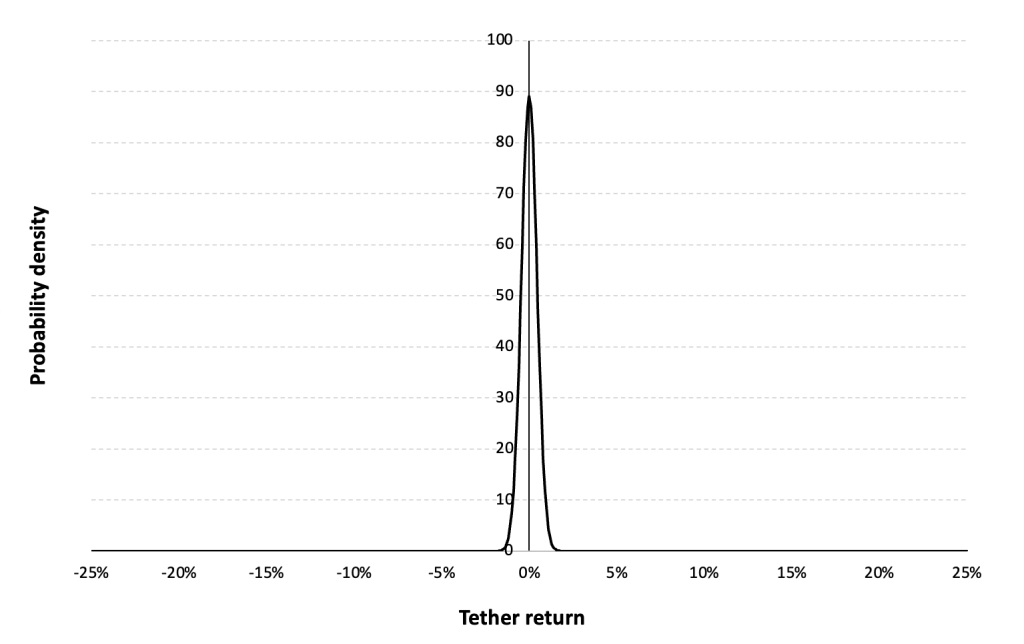
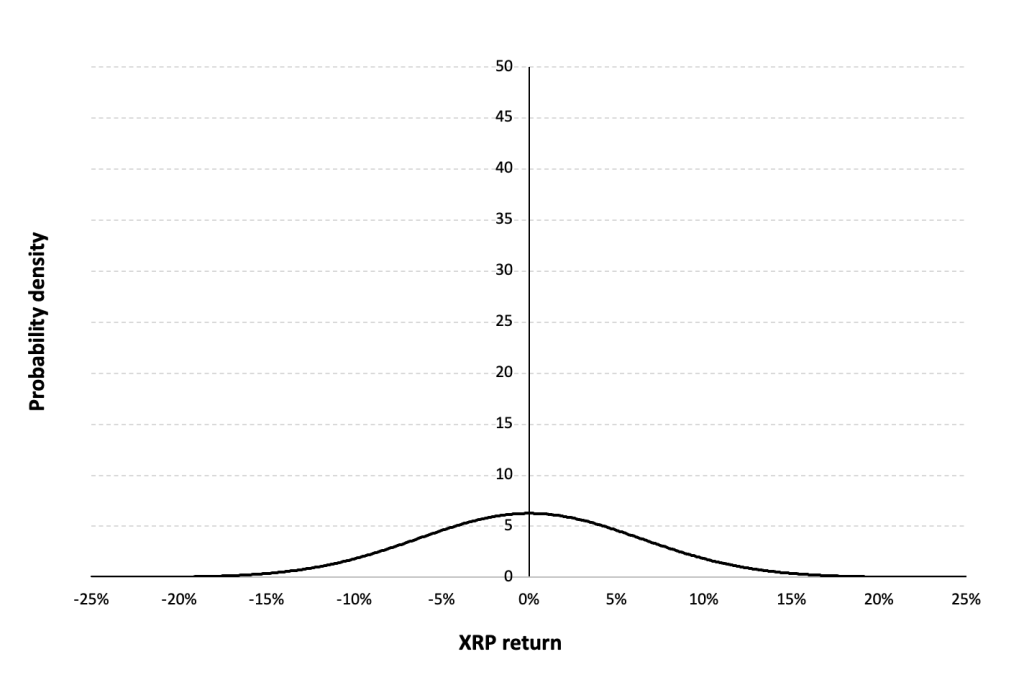
Gaussian distribution
The Gaussian distribution (also called the normal distribution) is a parametric distribution with two parameters: the mean and the standard deviation of returns. We estimated these two parameters over the period from April, 2020 to December 31, 2023.
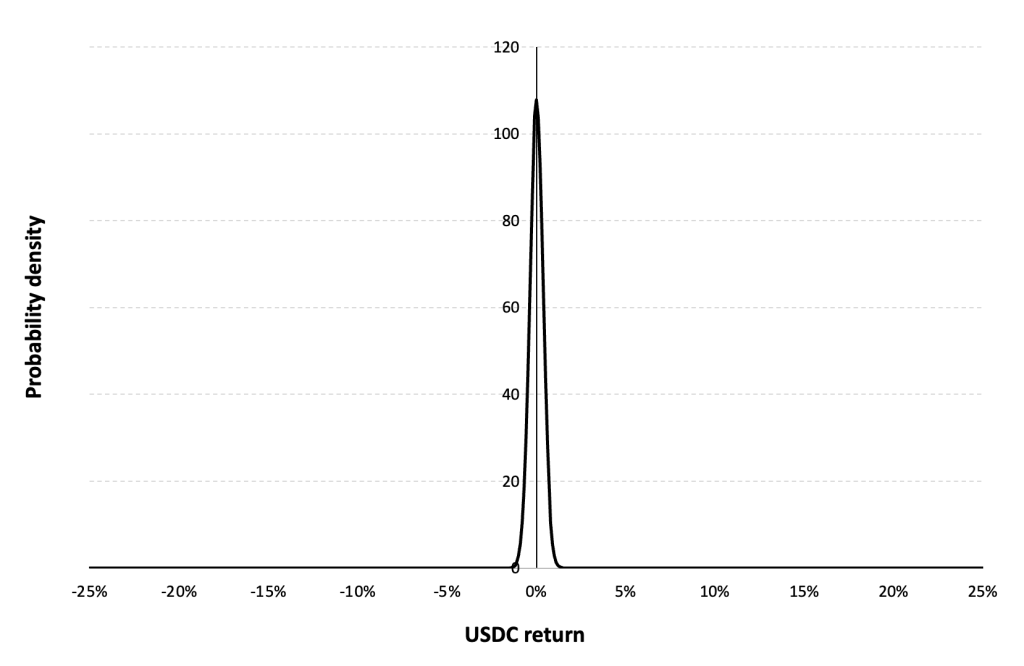
Figure 6 below represents the Gaussian distribution of the Solana (SOL) daily returns with parameters estimated over the period from April, 2020 to December, 2023.
Figure 6. Gaussian distribution of the Solana (SOL) returns.
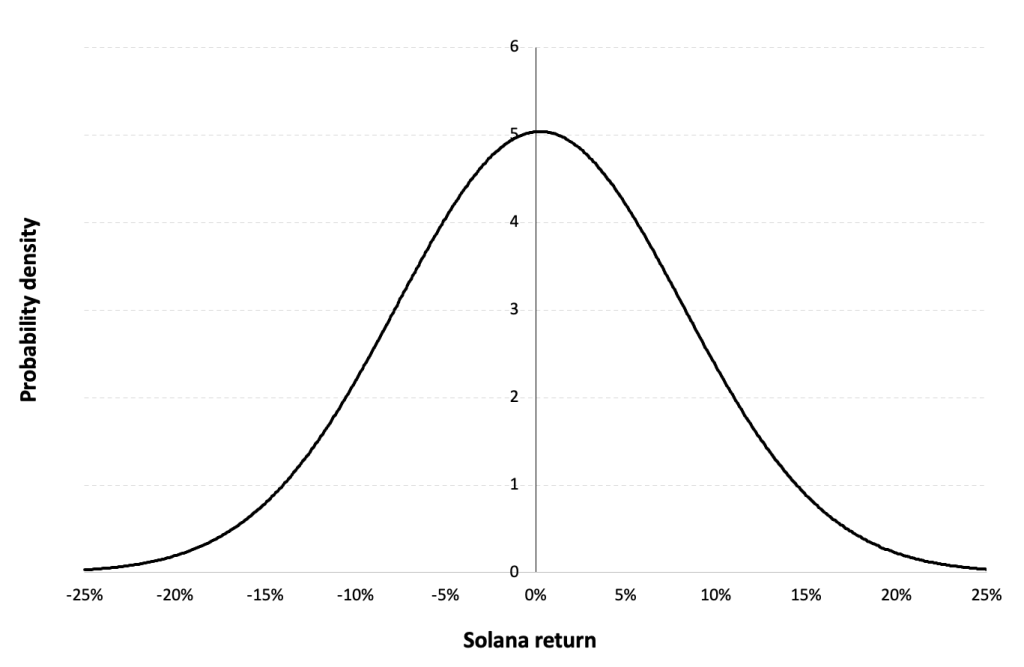
Source: computation by the author (data: Yahoo! Finance website).
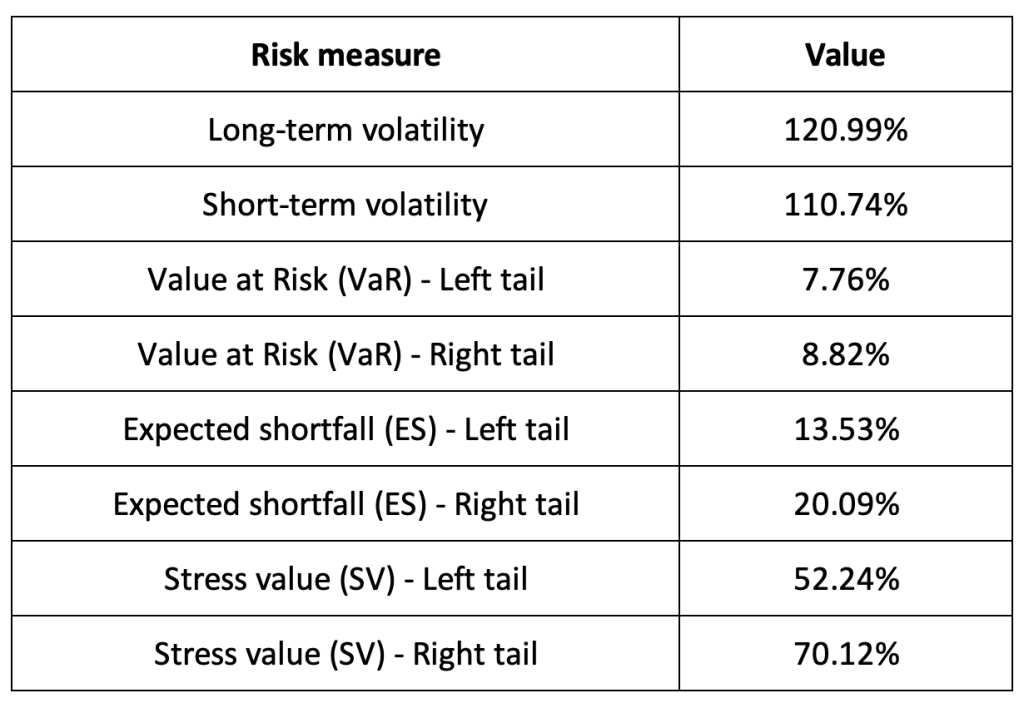
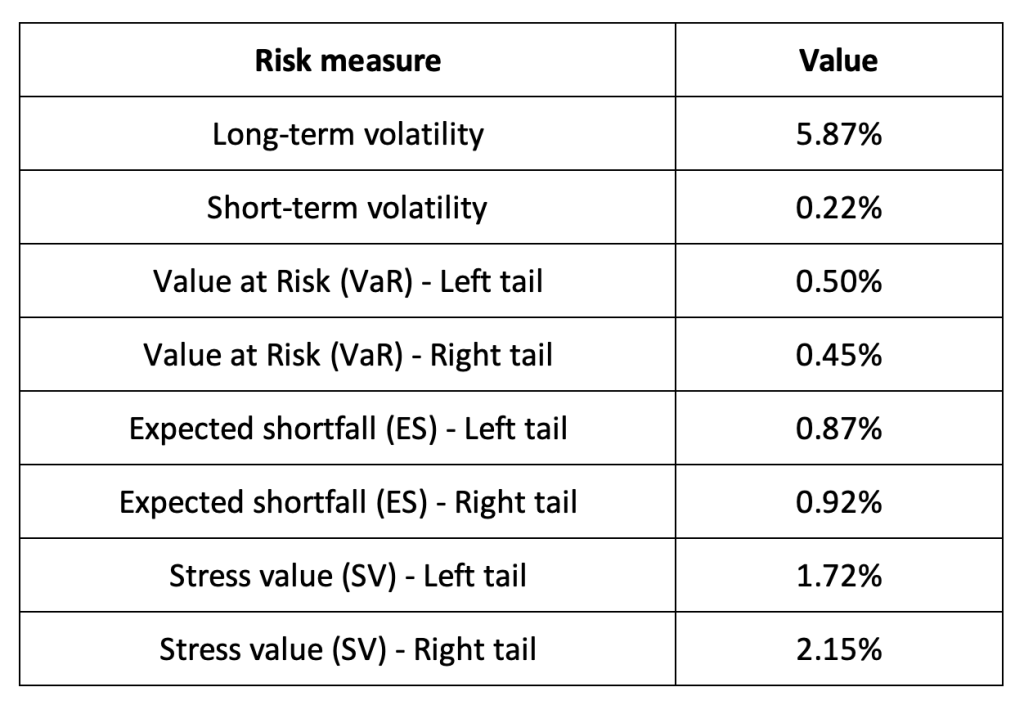
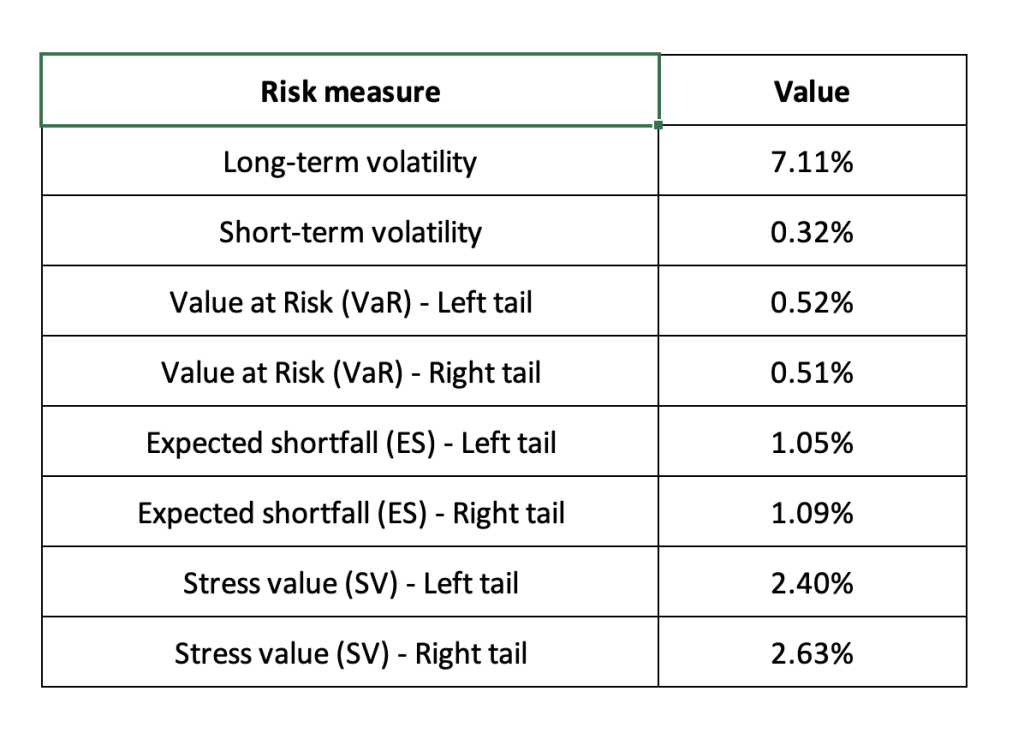
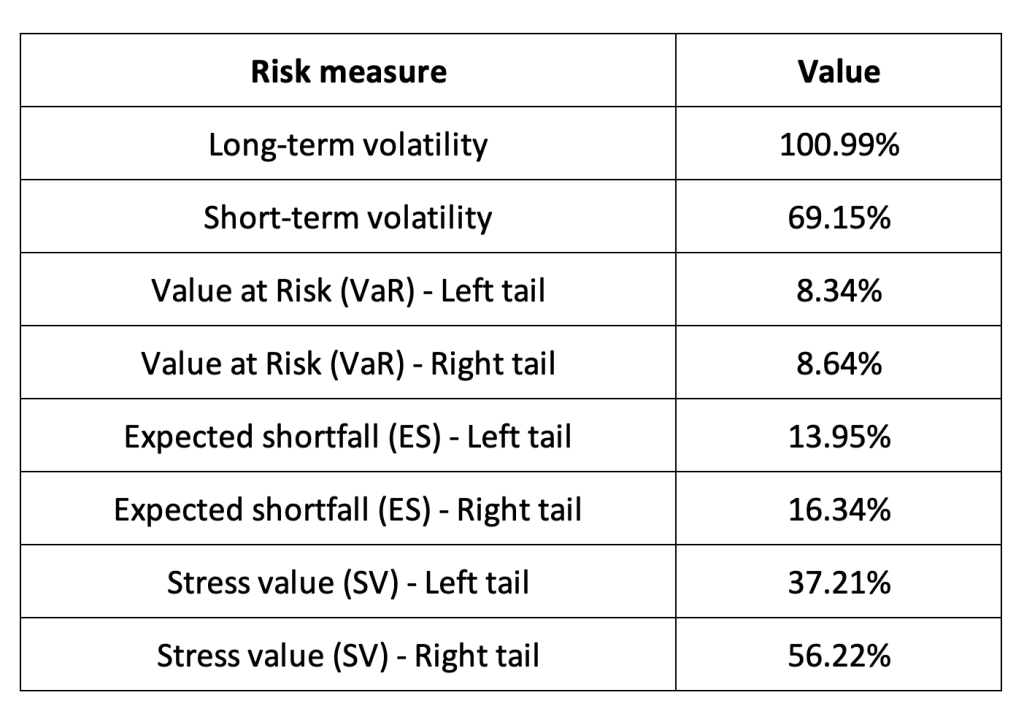
Risk measures of the Solana (SOL) returns
The R program that you can download above also allows you to compute risk measures about the returns of the Solana (SOL).
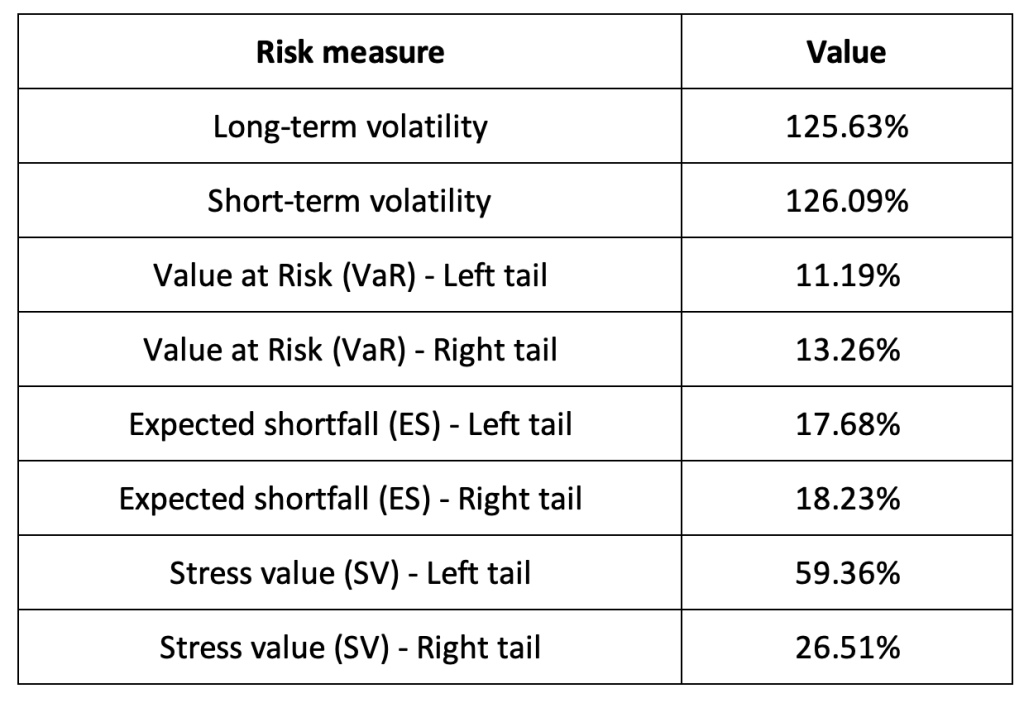
Table 3 below presents the following risk measures estimated for the Solana (SOL):
- The long-term volatility (the unconditional standard deviation estimated over the entire period)
- The short-term volatility (the standard deviation estimated over the last three months)
- The Value at Risk (VaR) for the left tail (the 5% quantile of the historical distribution)
- The Value at Risk (VaR) for the right tail (the 95% quantile of the historical distribution)
- The Expected Shortfall (ES) for the left tail (the average loss over the 5% quantile of the historical distribution)
- The Expected Shortfall (ES) for the right tail (the average loss over the 95% quantile of the historical distribution)
- The Stress Value (SV) for the left tail (the 1% quantile of the tail distribution estimated with a Generalized Pareto distribution)
- The Stress Value (SV) for the right tail (the 99% quantile of the tail distribution estimated with a Generalized Pareto distribution)
Table 3. Risk measures for the Solana (SOL).
Source: computation by the author (data: Yahoo! Finance website).
The volatility is a global measure of risk as it considers all the returns. The Value at Risk (VaR), Expected Shortfall (ES) and Stress Value (SV) are local measures of risk as they focus on the tails of the distribution. The study of the left tail is relevant for an investor holding a long position in the Solana (SOL) while the study of the right tail is relevant for an investor holding a short position in the Solana (SOL).
Why should I be interested in this post?
This blog offers an engaging exploration into a cryptocurrency that transcends traditional finance, appealing to a wide audience due to its cultural relevance, investment potential, and vibrant community. Solana’s reputation for high performance in blockchain technology, boasting the capability to process thousands of transactions per second, makes it an appealing option for developers and users seeking efficient transaction processing. Moreover, staying updated on Solana can offer insights into the growth of its ecosystem, including the development of decentralized applications (dApps) and strategic partnerships. For investors, Solana’s increasing popularity and ecosystem growth may signal investment opportunities, making it worthwhile to track news and discussions surrounding the platform. Additionally, Solana’s innovative technical advancements in scalability, consensus mechanisms, and developer tools are of interest to those intrigued by blockchain technology. Engaging with the Solana community provides opportunities for networking and gaining valuable insights into this rapidly expanding ecosystem.
Related posts on the SimTrade blog
About cryptocurrencies
▶ Snehasish CHINARA Bitcoin: the mother of all cryptocurrencies
▶ Snehasish CHINARA How to get crypto data
▶ Alexandre VERLET Cryptocurrencies
About statistics
▶ Shengyu ZHENG Moments de la distribution
▶ Shengyu ZHENG Mesures de risques
▶ Jayati WALIA Returns
Useful resources
Academic research about risk
Longin F. (2000) From VaR to stress testing: the extreme value approach Journal of Banking and Finance, N°24, pp 1097-1130.
Longin F. (2016) Extreme events in finance: a handbook of extreme value theory and its applications Wiley Editions.
Data
Yahoo! Finance Historical data for Solana
CoinMarketCap Historical data for Solana