

Understanding and writing R code can be a valuable skill for your career. While general-purpose programming languages such as Python are more widely used, R is particularly well suited to statistical analysis, data visualization, and quantitative research.
In this article, Hadrien PUCHE (ESSEC Business School, Grande École Program, Master in Management, 2023-2027) will help you to:
- Understand the core components of the R statistical ecosystem for finance
- Compare development setups (RStudio Desktop vs. Visual Studio Code)
- Install R alongside essential build tools (RTools / Xcode)
- Set up RStudio Desktop as a purpose-built workspace
- Install econometric packages via CRAN (like
quantmod) - Run a test script
But first, what is R exactly?
Historically, R was created in 1993 as an open-source implementation of the S language, developed at Bell Labs for statistical computing.
Setting up your R workspace can be straightforward. We will rely on CRAN (the Comprehensive R Archive Network), R’s main public repository for packages, to install the packages required for our analysis and their dependencies. Let’s walk through deploying a professional quantitative workspace for R.
Quick vocabulary for beginners
Before we dive in, let’s define a few technical terms you will encounter frequently:
- Package: A collection of reusable R functions, data, and documentation designed for a specific purpose. For example,
quantmodprovides tools for quantitative financial analysis and financial data retrieval. - Library: A directory on your computer, where your installed packages are stored. You will use the
library()command in your code to load them. While developers often use the terms package and library interchangeably, technically you install a package into your library. - Dependency: A package that another package requires in order to work properly. R manages these dependencies automatically, so you do not have to take care of them, but do not be surprised if R installs many more packages than you initially requested.
- Build Tools (Rtools / Xcode): Background software required by your computer to translate (or “compile”) raw source code into executable instructions. R frequently compiles financial packages directly on your machine, making these essential to prevent errors.
Choosing your development environment: RStudio or Visual Studio Code?
You generally have two choices when it comes to writing R code: RStudio Desktop and Visual Studio Code (VS Code).
- RStudio Desktop: An Integrated Development Environment (IDE) built specifically for R. It features a 4-pane layout that lets you simultaneously view your scripts, console, environment variables (data frames loaded in memory), and charts.
- Visual Studio Code: VS Code is a highly versatile code editor. You can run R in VS Code by installing the R extension and configuring the required R packages. This is a good choice if you plan to mix multiple programming languages in the same project, though configuring VS Code for R requires a bit more effort than RStudio.
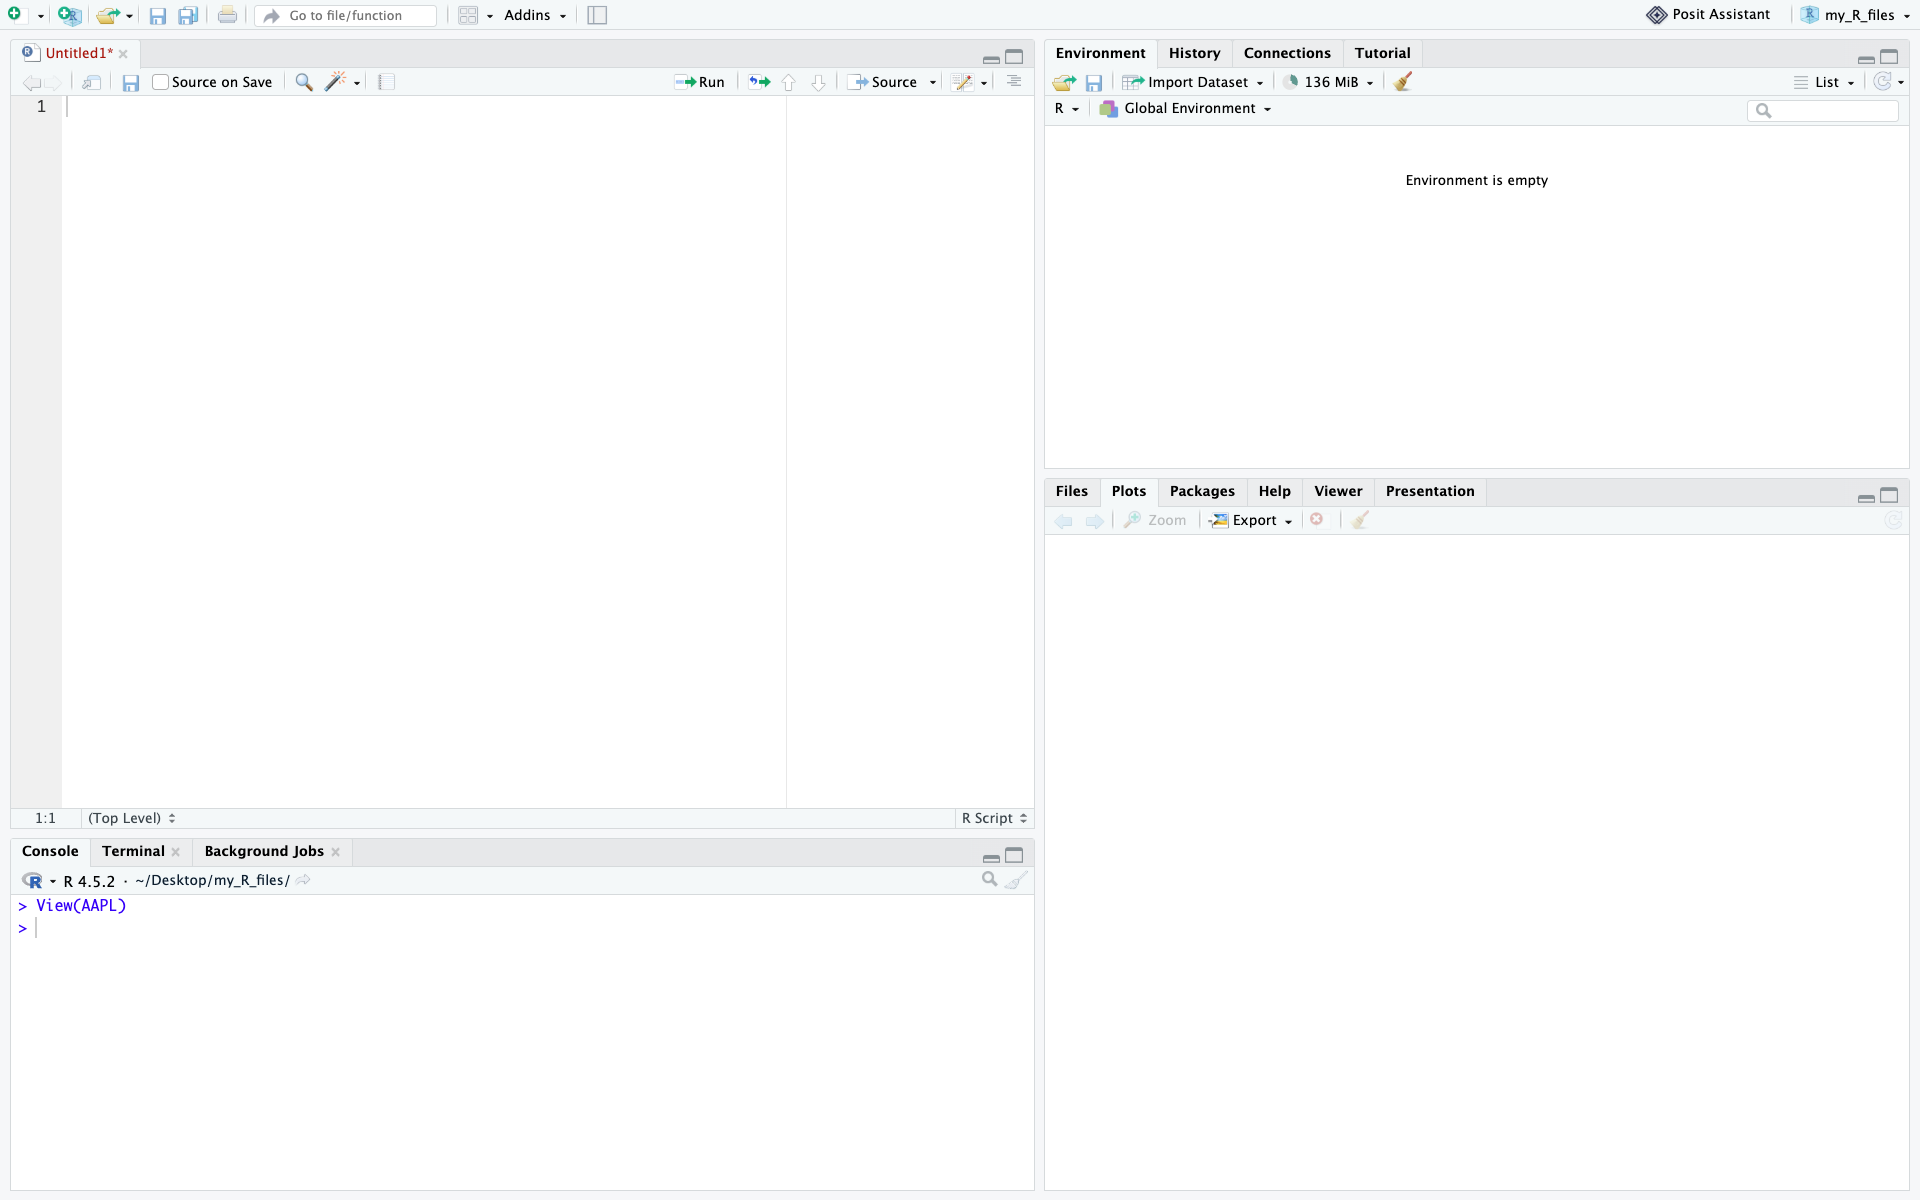
RStudio Desktop Interface
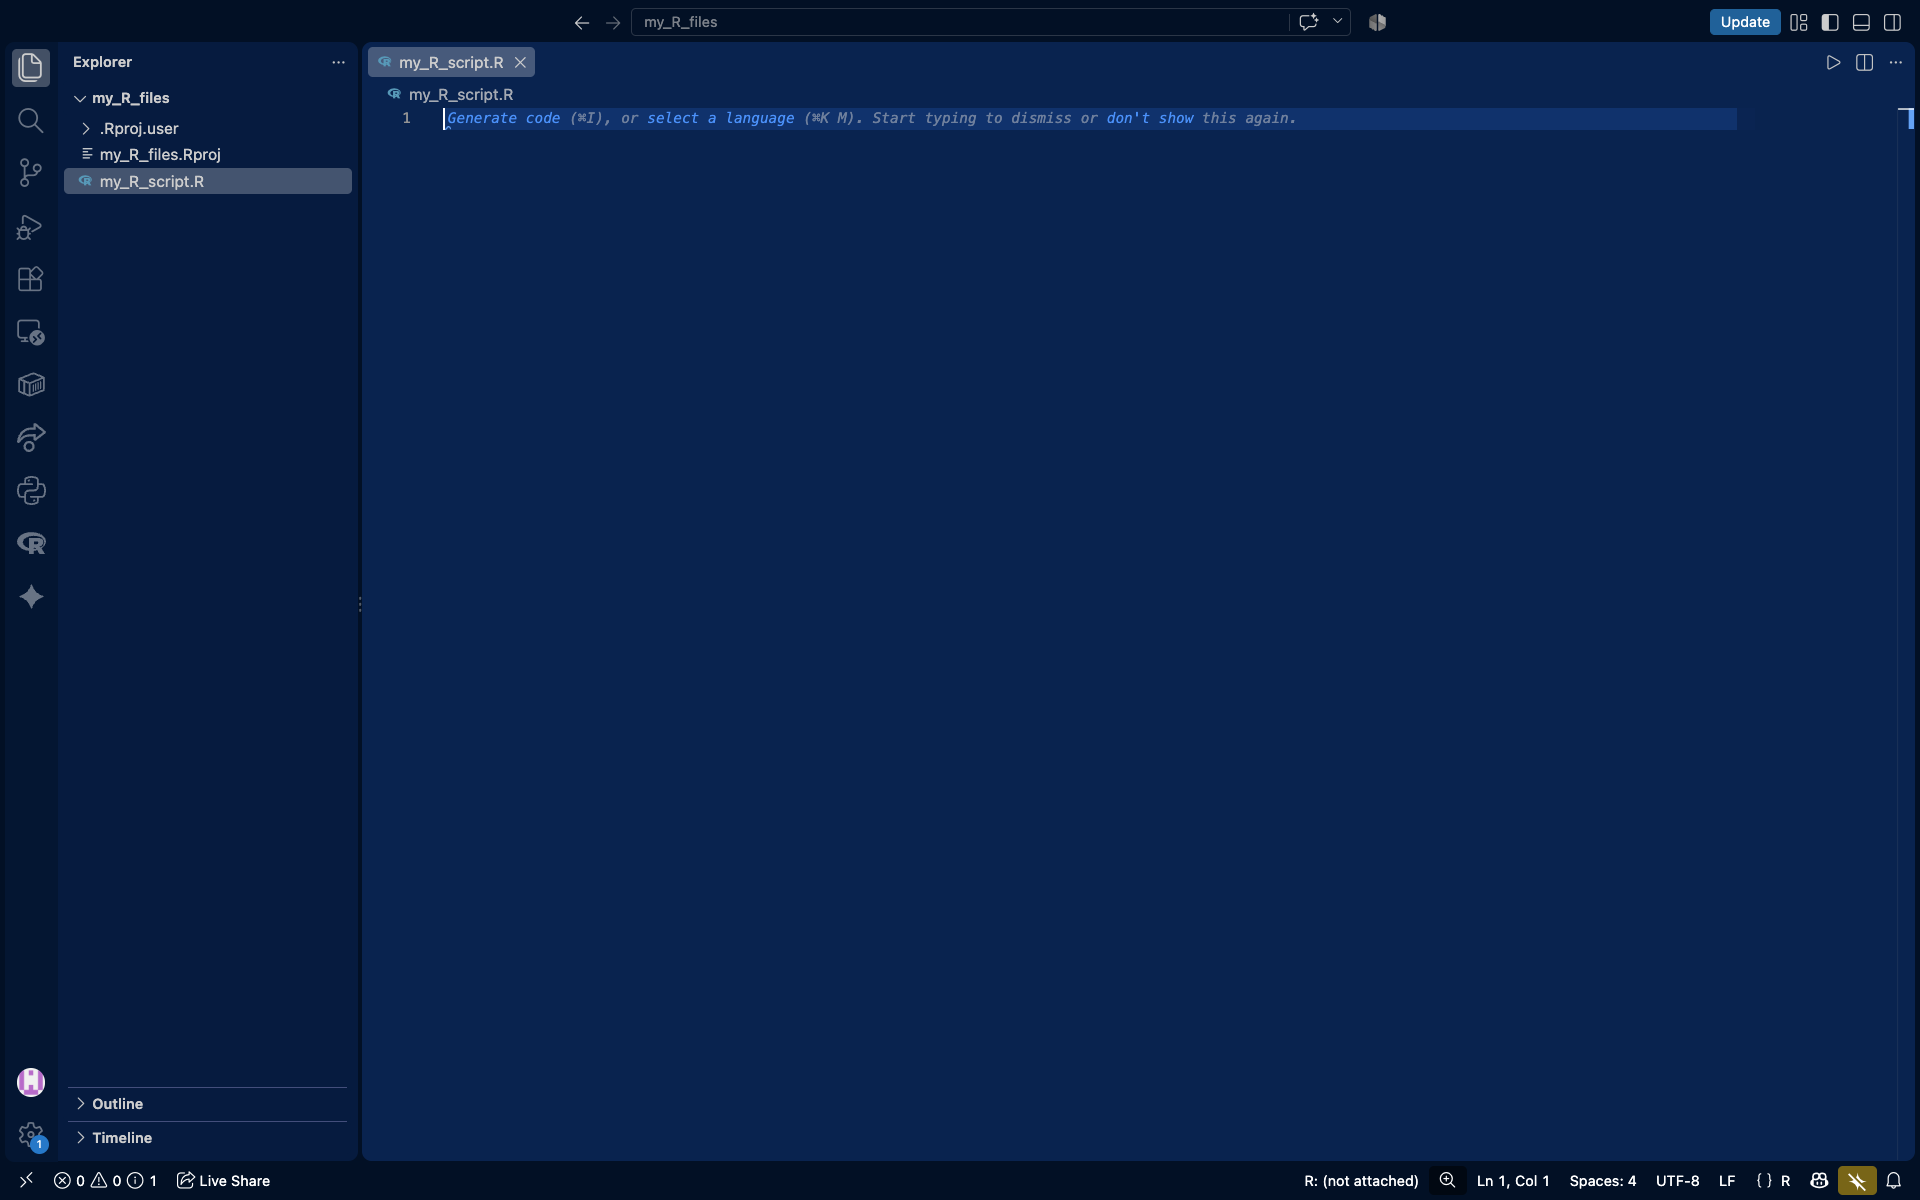
Visual Studio Code configured for R
For this guide, we will focus on setting up R and integrating it with RStudio, as it offers a purpose-built user experience for R.
Understanding the R architecture
The R architecture operates as follows:
- Base R: The underlying computational engine that calculates the math and runs the logic.
- Build tools (RTools / Xcode):oftware required to compile R packages from source when precompiled binary versions are not available. Most beginners will install packages from binaries, but having these tools available can prevent installation problems with packages that require compilation.
- CRAN: The Comprehensive R Archive Network. This is the centralized, strictly regulated global repository for R packages.
Step-by-step installation guide
Step 1: Install R and build tools
First, we must install R. RStudio will not function without it.
- Go to the official CRAN Download Page.
- For Windows:
- Click Download R for Windows > base > Download the latest R executable and install it using default settings.
- Go back to the Windows page, click Rtools, and install the version matching your R installation. This is critical for compiling quantitative packages later.
- For macOS:
- Click Download R for macOS and select the
.pkgmatching your chip (Apple Silicon or Intel). - To ensure packages compile correctly, open your Mac Terminal and run
xcode-select --installto get the necessary developer tools.
- Click Download R for macOS and select the
Step 2: Install RStudio
Now, we install the integrated development environment (IDE) that we will use to write and execute R code.
- Head to the Posit RStudio Desktop website.
- Download the free version corresponding to your operating system (Windows or macOS).
- Run the installer. RStudio will normally detect the R installation completed in Step 1 automatically.
Step 3: Install packages from CRAN
Because R uses centralized package repositories such as CRAN, we can install the packages required for our financial analysis directly from the R console in RStudio.
- Launch RStudio.
- In the Console pane (bottom-left), type the following command and press Enter. This will reach out to CRAN and download the essential tools for market data and time-series analysis:
# Install quantmod for data retrieval, xts for time-series, and PerformanceAnalytics for risk metrics
install.packages(c("quantmod", "xts", "PerformanceAnalytics", "ggplot2"))
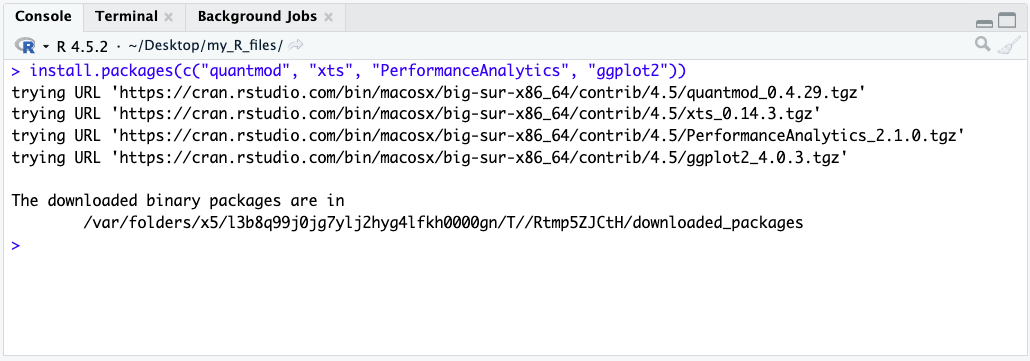
Checking that everything is working as intended
Let’s verify your infrastructure by writing a short script that pulls actual market data.
- In RStudio, go to File > New File > R Script.
- Paste the following quantitative code into the top-left editor pane.
- Highlight all the text and press
Ctrl+Enter(Windows) orCmd+Enter(macOS) to run it.
# Load the quantitative financial modeling library
library(quantmod)

# Download historical financial data for Apple via Yahoo Finance API
getSymbols("AAPL", src = "yahoo", from = "2023-01-01", to = "2024-01-01", auto.assign = TRUE)

# Display the first 5 rows of the time-series array in the console
print(head(AAPL))

# Generate a financial chart with volume and Bollinger Bands for volatility analysis
chartSeries(AAPL,
            name = "Apple Inc. (AAPL) Historical Prices",
            theme = chartTheme("white"),
            TA = c(addVo(), addBBands()))
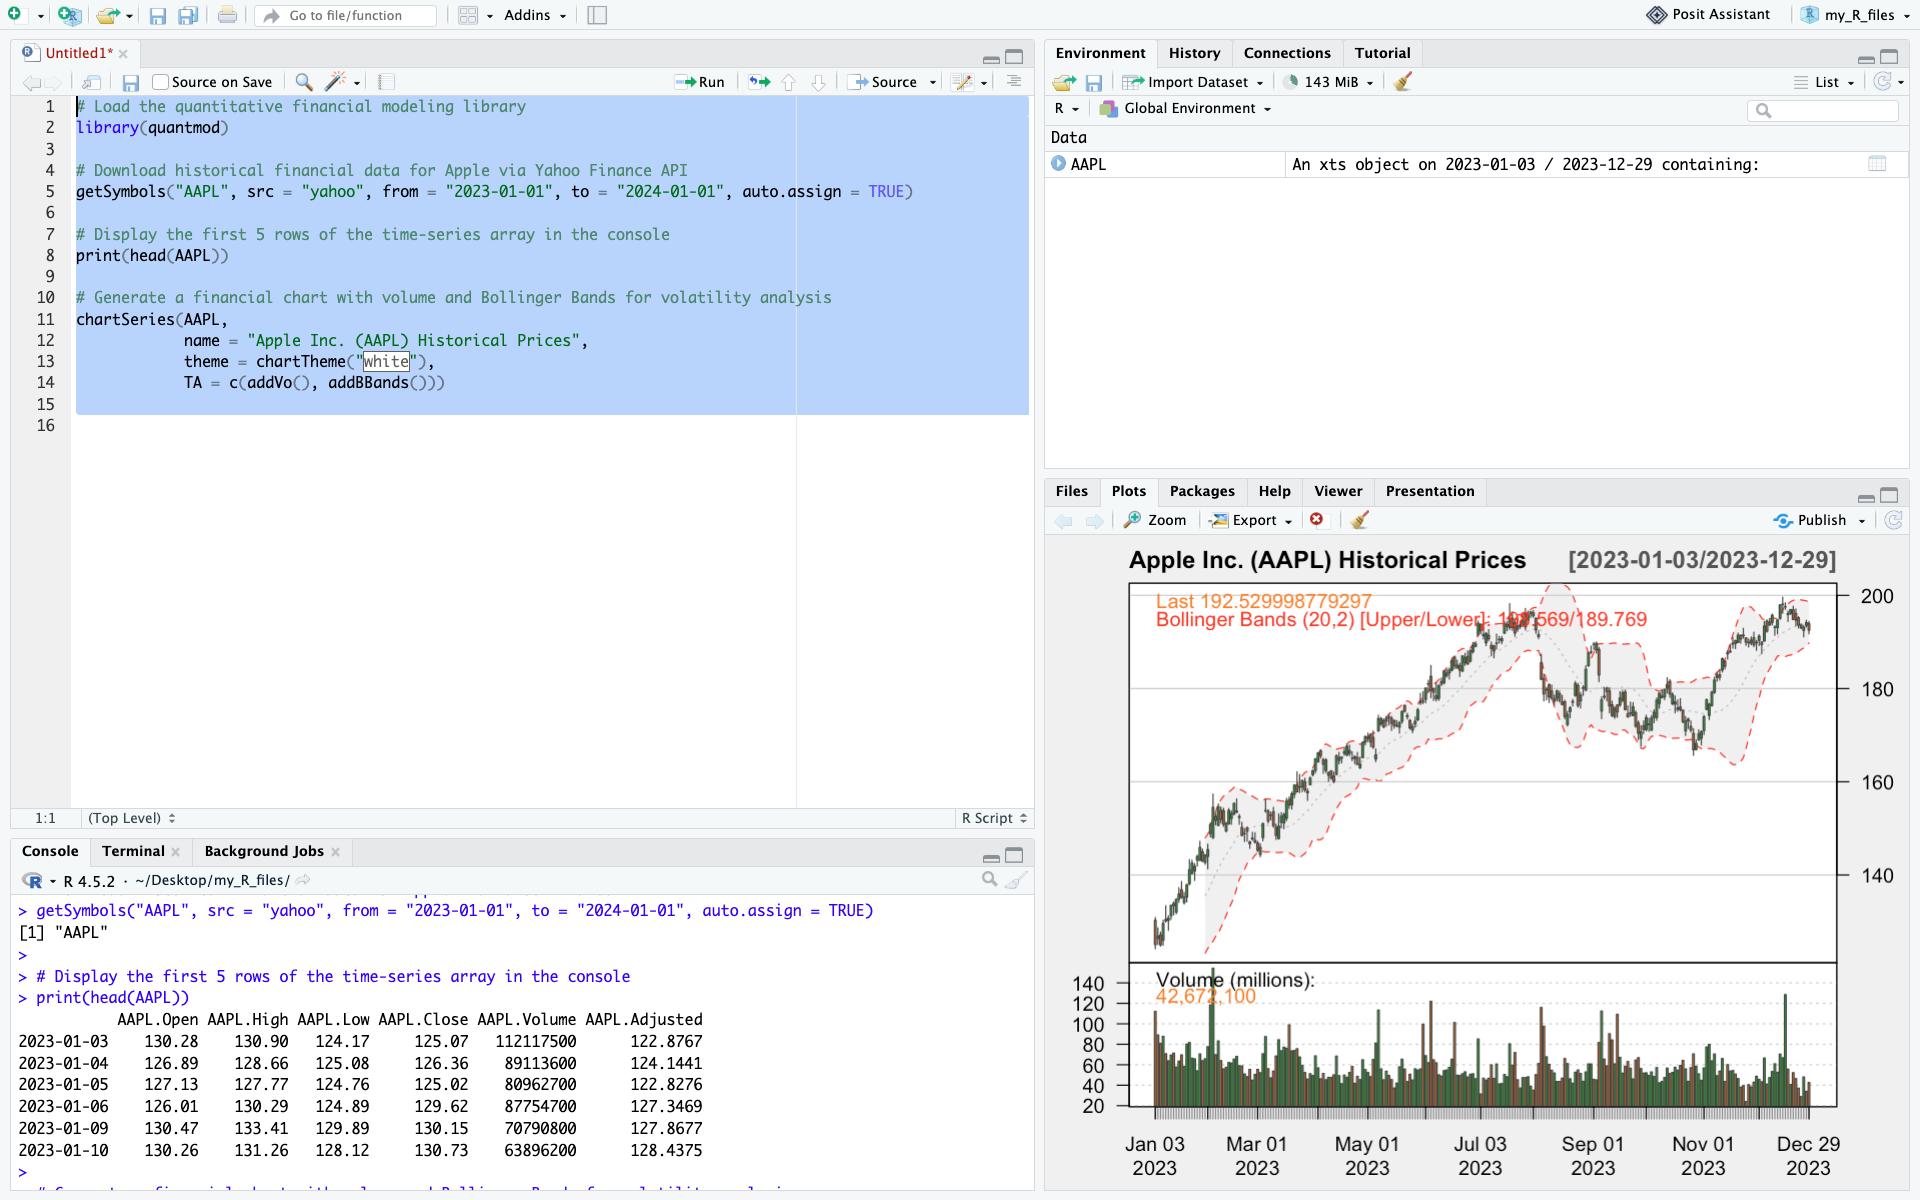
After running the script, your RStudio should look like this
If the AAPL dataset appears in your top-right Environment pane, the data prints in your Console, and a professional candlestick chart renders in your bottom-right Plots pane, your R setup is fully operational.
Next steps & use cases
With R correctly configured, you are now equipped to tackle complex econometric and financial challenges. A good next step would be to learn how to download financial data with R.
You can learn how to do so in this article: How to download financial data with R
Useful resources
▶ CRAN (The Comprehensive R Archive Network): The main public repository for R packages, R distributions, and documentation. CRAN provides a centralized infrastructure for distributing and maintaining thousands of R packages used in statistical computing, econometrics, and quantitative research.
About the author
This article was written in September 2026 by Hadrien PUCHE (ESSEC Business School, Grande École Program, Master in Management, 2023-2027).
▶ Discover all posts by Hadrien PUCHE
2 thoughts on “How to install and run R on your computer (a step-by-step guide)”
Comments are closed.